Embed Size (px)
Citation preview

Michigan Department of Corrections AExpecting Excellence Every Day@ FIELD OPERATION ADMINISTRATION OFFICE OF COMMUNITY CORRECTIONS BIANNUAL REPORT March 2003 This report is prepared by the Michigan Department of Corrections / Office of Community Corrections pursuant to the provisions of the Michigan Community Corrections Act [Public Act No. 511 of 1988, Section 12(2)] and the FY 2003 Appropriations Act for Community Programs (Public Act No. 524 of 2002, Section 704).
2
TABLE OF CONTENTS
PART 1: MEASURING THE IMPACT OF PUBLIC ACT 511 . . . . . . . . . . . . . . . . . . 3
PART 2: JAIL UTILIZATION . . . . . . . . . . . . . . . . . . . . . . . . . . . . . . . . . . . . . . . . . . 20
PART 3: PROGRAM UTILIZATION . . . . . . . . . . . . . . . . . . . . . . . . . . . . . . . . . . . . 24
PART 4: FY 2003 AWARD OF COMMUNITY CORRECTIONS FUNDS . . . . . . . 28
PART 5: DATA SYSTEMS STATUS . . . . . . . . . . . . . . . . . . . . . . . . . . . . . . . . . . . . . 33

3
PART 1
MEASURING THE IMPACT OF PUBLIC ACT 511
INTRODUCTION Section 12 of Public Act 511 of 1988 (Community Corrections Act) requires the Office of Community Corrections to submit a biannual report detailing the effectiveness of the programs and plans funded under this act, including an explanation of how the rate of commitment of prisoners to the state prison system has been affected. Section 8.4 of Public Act 511 states that the purpose of the Act is “to encourage the participation in community corrections programs of offenders who would likely be sentenced to imprisonment in a state correctional facility or jail, would not increase the risk to public safety, have not demonstrated a pattern of violent behavior, and do not have a criminal record that indicates a pattern of violent offenses.” Analysis of the prison commitment rate data continues to support the selection of the priority target groups for community corrections programs. Research indicates that community sanctions and treatment programs provide alternatives to prison and jail sentences while increasing public safety by decreasing the recidivism rates. The Community Corrections Advisory Boards (CCABs) are required to focus on prison commitment rates for their county/counties in the annual comprehensive corrections plan and application, establish goals and objectives relative to the commitment rates, and concentrate on reducing or maintaining low prison admissions for priority target populations. The target groups include straddle cell offenders, probation violators, and parole violators. These target groups were selected due to their potential impact on prison commitment rates. Straddle cell offenders can be sentenced to prison, jail, or probation, and the sentencing disposition may be influenced by the availability of sanctions and treatment programs in the community. Probation and parole violators account for approximately two-thirds of the prison intake, and the percentage has steadily increased since 1994. Including these offenders in P.A. 511 programs offer community sanctions and treatment programs as an alternative to a prison or jail sentence. P.A. 511 funded community corrections programs are not the sole influence on prison commitment rates. The rates may be affected by other programs funded by 15% monies from probation fees, substance abuse programs funded by the Michigan Department of Community Health and federal monies, local and state vocational programs funded by intermediate school districts or Michigan Works, and other county-funded community corrections programs. Other factors that affect the prison commitment rates are the state and local economy, crime rates, and prosecutorial discretion. CCABs are required to monitor prison commitment rates, adopt local policies to target priority groups of offenders, and track program utilization rates.
4
PRISON COMMITMENT RATES AND PRISON INTAKE
The prison commitment rates and prison intake data, followed by detailed county tables, provide an overview of prison commitments, utilization of jail resources and programming options among counties, progress toward addressing State and local objectives, and factors which contribute to attainment of objectives.
The original data source is the MDOC Court Disposition database. From this database, an offender database is extracted which reflects only the single most serious disposition for each offender during each report period and does not include delayed/suspended sentences, dispositions where the offender was in prison at the time of the offense, or convictions on escape charges. Offenders are identified by social security number where available, otherwise by state identification number or name where necessary. After excluding offenders in prison, escapees, and offenders on delayed sentence, the most significant record/disposition for each offender is chosen.
Factors utilized to select the most significant record/disposition include:
1. Disposition type (prison, jail, probation, other). 2. Mandatory over non-mandatory sentence. 3. Longest length of maximum term imposed.
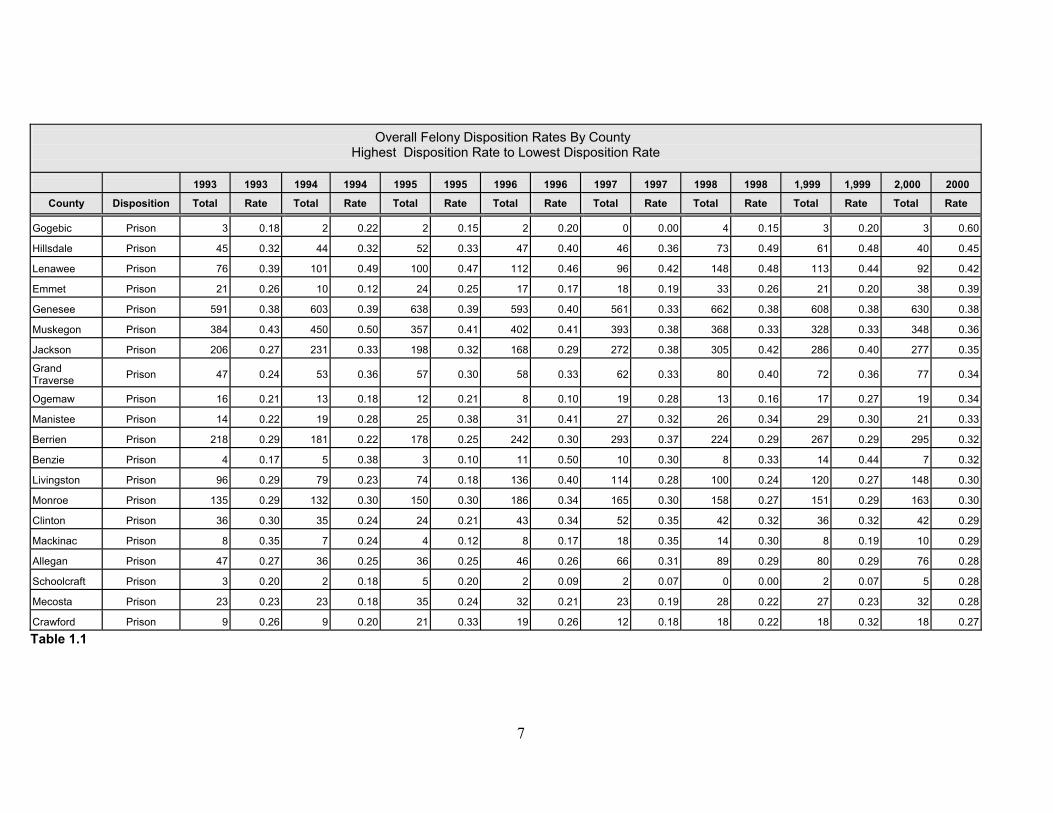
Prison Commitments The enclosed Tables provide data/information relative to prison commitment rates. The data is based on felony disposition data through March 2000 and prison intake data for 2001 (MDOC data for felony disposition rates is not available for 2001). � Table 1.1 presents the overall prison commitment rate from felony disposition data for all counties.
- The rate for the State was 23% in 2000. - Twenty-nine counties had a rate of less than 20%, and twelve counties had a rate greater than 30%. - The counties vary by size and geographic location.
� Table 1.2 presents the prison commitment rates for offenders with guidelines in the straddle cells.
- The prison commitment rate for the State was 43% in 2000. - Thirty counties had commitment rates of less than 40%. - Fourteen counties had rates greater than 60%.
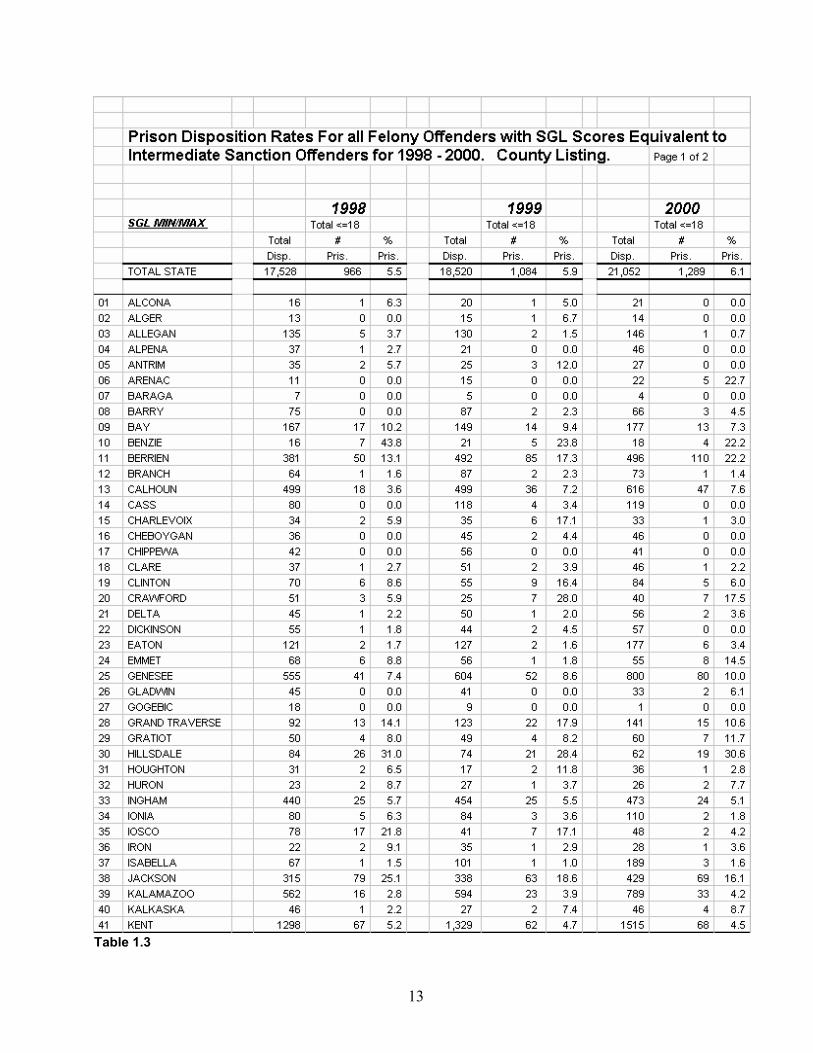
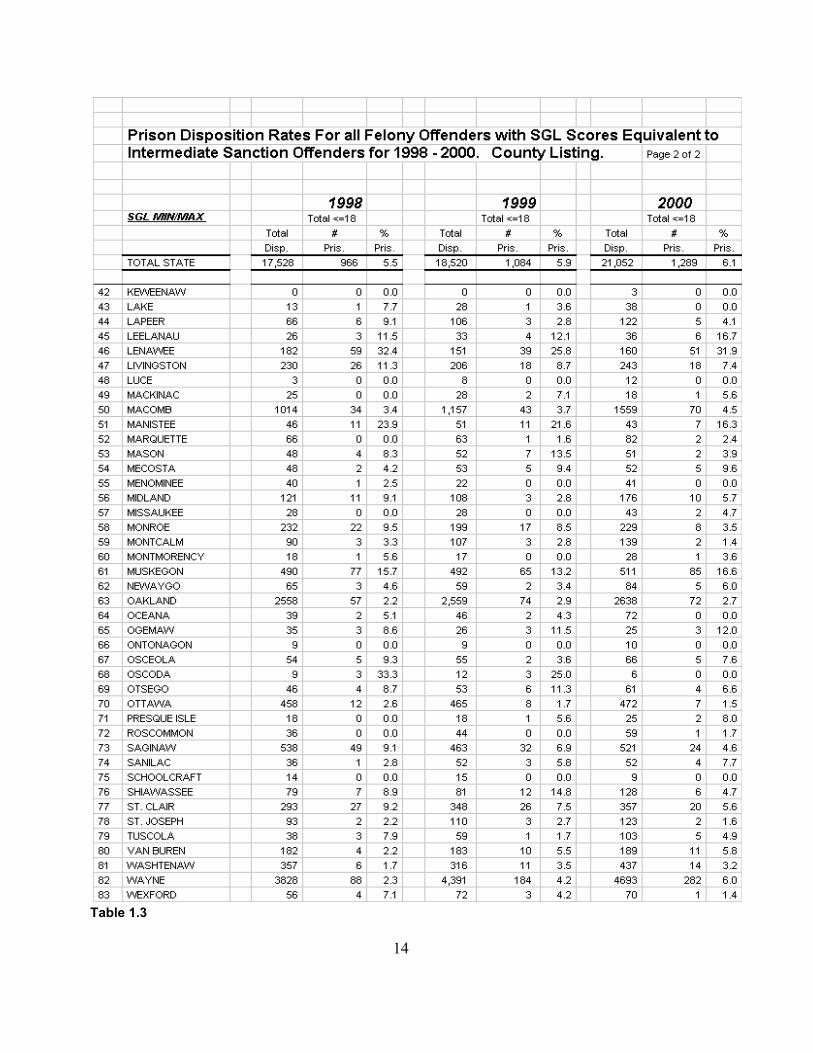
� Table 1.3 presents the prison commitment rates for offenders with guidelines in the intermediate sanction cells.
- The prison commitment rate for the State was 6.1% in 2000. - Thirty-one counties had rates of less than 3%. - Fifteen counties had prison commitment rates of 10% or greater.
� Tables 1.4a and 1.4b present prison intake data for 1994-2001. Table 1.4a presents 1994-2001 data relative to
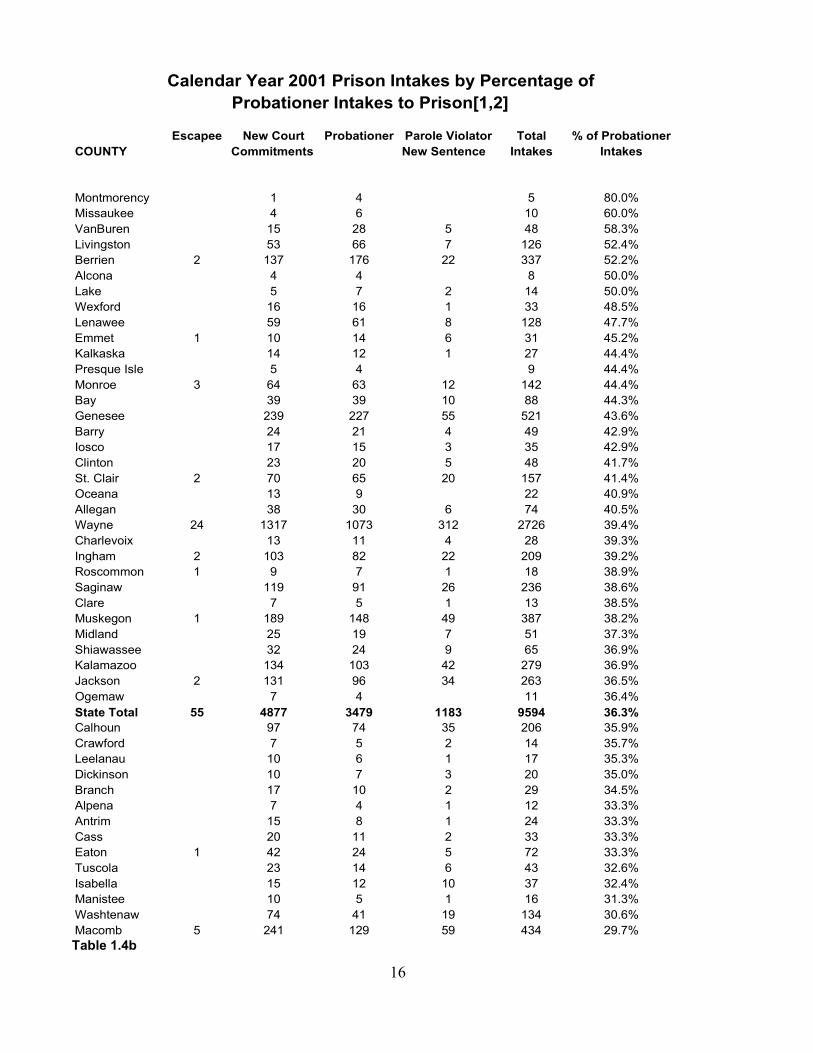
new court commitments, probation violations, parole violators-new sentence, and parole violators-technical violations. Table 1.4b presents the 2001 prison intake by county by category (excluding parole violators-technical). The counties are listed from highest to lowest per the intake of probation violators.
� Table 1.4a demonstrates that new court commitments decreased from 5,680 in 1994 to 4,879 in 2001 (from
53% of the total prison intake and returns in 1994 to 38% in 2001). During this same time period, the prison intake of probation violators increased from 1,932 in 1994 to 3,480 in 2001, and the intake of parole violators-technical increased from 1,964 in 1994 to 3,236 in 2001.
The data per Table 1.4b indicates probation violators accounted for 36% of the total prison intake in 2001. - The county specific data indicates 36 counties had rates of less than 30%. - Twenty-one counties= rates were greater than 40%.
The data substantiates the merits of probation violators being a priority population for community corrections
5
policy and programs, and the need for further review/evaluation of the factors which are contributing to high rates of incarceration of violators, particularly in the counties with the highest rates.
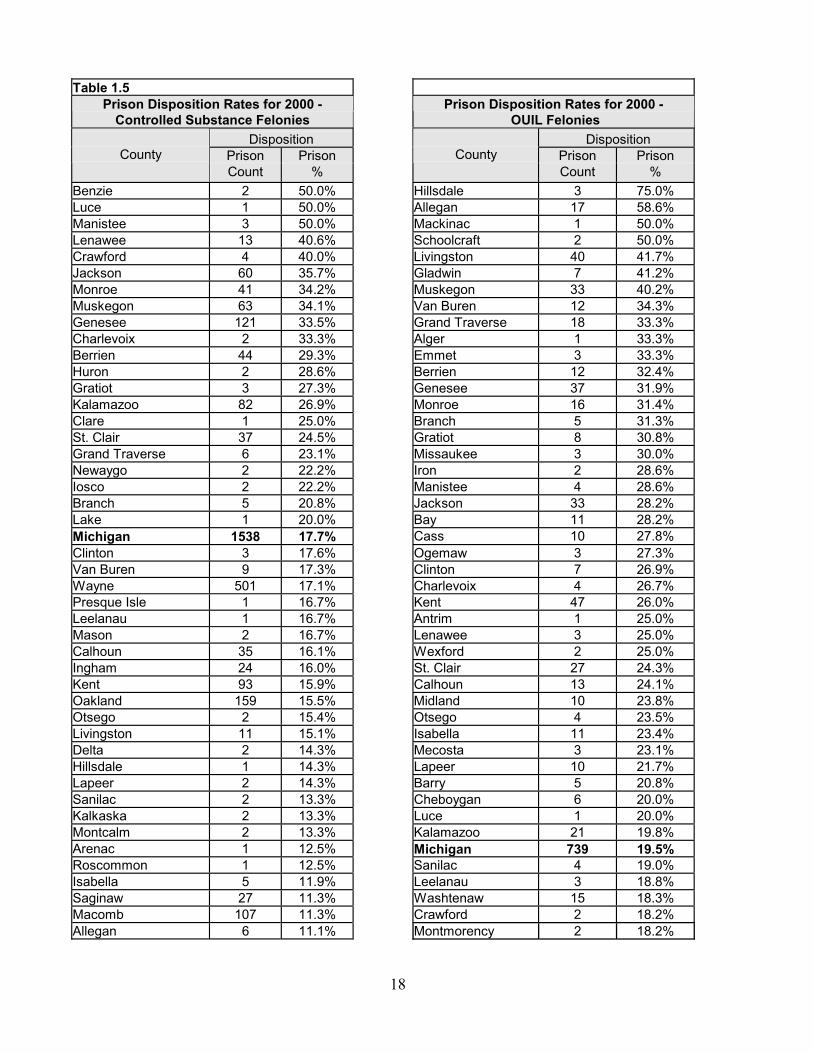
� Table 1.5 presents the 2000 prison commitment rates for controlled substance felonies and OUIL felonies.
The rate for the State for controlled substances was 17.7% in 2000. - The majority of the counties had a rate lower than the State rate. - Twenty-one counties had a rate higher than the State rate.
The 2000 state prison commitment rate for OUIL felonies was 19.5%.
- Sixteen counties had a rate greater than 30%. Progress Toward Addressing Objectives And Priorities Multiple changes have been and continue to be made among counties to improve capabilities to reduce or maintain prison commitments, increase emphases on utilizing jail beds for higher risk cases, and reduce recidivism. These changes include:
- Implementation of processes and instruments to quickly and more objectively identify low to high risk cases at the pretrial stage.
- Implementation of instruments and processes to objectively assess needs of the higher risk defendants/offenders.
- Utilization of the results of screening and assessments to help guide the selection of conditional release options for pretrial defendants and conditions of sentencing for sentenced offenders.
- This also includes the development and implementation of policies within local jurisdictions to emphasize proportionality in the use of sanctions and services, i.e., low levels of supervision and services for low risk defendants/offenders and limiting the use of more intensive programming for the higher risk cases.
- Implementation and expansion of cognitive behavioral-based programming with eligibility criteria restricted to the higher risk of recidivism cases.
- The number of counties with cognitive behavioral-based programs increased during 2002 and the number will be increased further as per the proposals and recommendations which are being presented to the State Community Corrections Board for consideration. It is noteworthy that the program expansion or increases are being achieved among counties primarily via redirection of funds among program categories, e.g., reducing use of community corrections funds for community service to finance cognitive behavioral-based programming.
- Increased focus is being placed on continuity of treatment to ensure offenders are able to continue participation in education, substance abuse, or other programming as they move among supervision options such as the jail, a residential program, and their own place of residence.
The changes which are being made among the counties are in sync with the objectives and priorities adopted by the State Community Corrections Board. They are also supported by research which has demonstrated that use of prison and jail can be reduced and recidivism reduction can be achieved through effective case differentiation based on risk, sanctions and services matching based on objective assessments for risk of recidivism and criminogenic need, proportional allocation of supervision and treatment according to levels of risk and need, and utilization of more intensive (preferably cognitive behavioral-based) programming for higher risk of recidivism offenders.

6
Priority Target Groups for P.A. 511 Funding and Programs The analysis of Calendar Year 2000 court disposition data and prison intake data supports the selection of the priority target groups from the straddle cell offenders and probation/parole violators. In addition, some counties with higher than average prison commitment rates need to examine their prison commitment rates for intermediate sanction offenders. Data for each county is presented on prison dispositions from 1998 - 2000 for both straddle cell and intermediate sanction offenders in the following tables. The tables show that there is wide variation among counties on these rates. For straddle cell offenders the State average is listed at the top of the column for each year. In 2000, the State prison commitment rate was 43%. The larger counties with above average rates are of concern; annual fluctuations for small counties can distort averages with only a few individuals involved. Even though intermediate sanction cell offenders are not a target population for community corrections programs, sentencing policies and practices need to be examined in more detail in counties where higher percentages of intermediate sanction offenders are sentenced to prison. Table 1.3 reflects that in 2000, the State average was 6.1%, and the data shows that 15 counties sentenced 10% or more intermediate sanction cell offenders to prison. The counties with high prison commitment rates for straddle cell or intermediate sanction cell offenders are required to address these issues in their annual community corrections comprehensive plan and application for funding. Preliminary data is presented in Table 1.4b by county for prison intakes during 2001. The various groups of offenders that comprise prison intakes include both new court commitments and probationers sent to prison as a result of technical violations or new offenses. The last column indicates the total percentage involving probationers sent to prison: the State average is 36.3% with a county range from 0% to 80%. Again, the focus is on the larger counties with the higher percentages of probationer intakes. The statistics are an indicator that needs to be used to frame additional questions and analysis for a county.
7
Overall Felony Disposition Rates By County Highest Disposition Rate to Lowest Disposition Rate
1993
1993
1994
1994
1995
1995
1996
1996
1997
1997
1998
1998
1,999
1,999
2,000
2000
County
Disposition
Total
Rate
Total
Rate
Total
Rate
Total
Rate
Total
Rate
Total
Rate
Total
Rate
Total
Rate Gogebic
Prison
3
0.18
2
0.22
2
0.15
2
0.20
0
0.00
4
0.15
3
0.20
3
0.60
Hillsdale
Prison
45
0.32
44
0.32
52
0.33
47
0.40
46
0.36
73
0.49
61
0.48
40
0.45
Lenawee
Prison
76
0.39
101
0.49
100
0.47
112
0.46
96
0.42
148
0.48
113
0.44
92
0.42
Emmet
Prison
21
0.26
10
0.12
24
0.25
17
0.17
18
0.19
33
0.26
21
0.20
38
0.39
Genesee
Prison
591
0.38
603
0.39
638
0.39
593
0.40
561
0.33
662
0.38
608
0.38
630
0.38
Muskegon
Prison
384
0.43
450
0.50
357
0.41
402
0.41
393
0.38
368
0.33
328
0.33
348
0.36
Jackson
Prison
206
0.27
231
0.33
198
0.32
168
0.29
272
0.38
305
0.42
286
0.40
277
0.35
Grand Traverse
Prison
47
0.24
53
0.36
57
0.30
58
0.33
62
0.33
80
0.40
72
0.36
77
0.34
Ogemaw
Prison
16
0.21
13
0.18
12
0.21
8
0.10
19
0.28
13
0.16
17
0.27
19
0.34
Manistee
Prison
14
0.22
19
0.28
25
0.38
31
0.41
27
0.32
26
0.34
29
0.30
21
0.33
Berrien
Prison
218
0.29
181
0.22
178
0.25
242
0.30
293
0.37
224
0.29
267
0.29
295
0.32
Benzie
Prison
4
0.17
5
0.38
3
0.10
11
0.50
10
0.30
8
0.33
14
0.44
7
0.32
Livingston
Prison
96
0.29
79
0.23
74
0.18
136
0.40
114
0.28
100
0.24
120
0.27
148
0.30
Monroe
Prison
135
0.29
132
0.30
150
0.30
186
0.34
165
0.30
158
0.27
151
0.29
163
0.30
Clinton
Prison
36
0.30
35
0.24
24
0.21
43
0.34
52
0.35
42
0.32
36
0.32
42
0.29
Mackinac
Prison
8
0.35
7
0.24
4
0.12
8
0.17
18
0.35
14
0.30
8
0.19
10
0.29
Allegan
Prison
47
0.27
36
0.25
36
0.25
46
0.26
66
0.31
89
0.29
80
0.29
76
0.28
Schoolcraft
Prison
3
0.20
2
0.18
5
0.20
2
0.09
2
0.07
0
0.00
2
0.07
5
0.28
Mecosta
Prison
23
0.23
23
0.18
35
0.24
32
0.21
23
0.19
28
0.22
27
0.23
32
0.28
Crawford
Prison
9
0.26
9
0.20
21
0.33
19
0.26
12
0.18
18
0.22
18
0.32
18
0.27
Table 1.1

8
Overall Felony Disposition Rates By County Highest Disposition Rate to Lowest Disposition Rate
1993
1993
1994
1994
1995
1995
1996
1996
1997
1997
1998
1998
1,999
1,999
2,000
2000
County
Disposition
Total
Rate
Total
Rate
Total
Rate
Total
Rate
Total
Rate
Total
Rate
Total
Rate
Total
Rate Leelanau
Prison
12
0.30
13
0.30
12
0.29
14
0.33
6
0.19
8
0.20
11
0.22
14
0.27
Shiawassee
Prison
36
0.29
51
0.32
35
0.24
57
0.29
63
0.39
56
0.31
57
0.38
58
0.27
Gratiot
Prison
25
0.30
22
0.22
43
0.33
31
0.27
26
0.27
27
0.29
22
0.27
25
0.26
Charlevoix
Prison
18
0.32
11
0.20
22
0.24
23
0.36
14
0.18
16
0.27
25
0.34
17
0.25
Oscoda
Prison
5
0.22
4
0.31
5
0.36
4
0.44
7
0.39
9
0.45
6
0.30
3
0.25
Barry
Prison
68
0.56
56
0.46
33
0.18
33
0.16
33
0.19
32
0.19
31
0.19
33
0.25
Wayne
Prison
2,632
0.27
2,310
0.24
2186
0.21
2,047
0.22
1,935
0.23
1,549
0.19
2,042
0.24
2,365
0.25
Antrim
Prison
17
0.28
25
0.37
27
0.42
23
0.41
28
0.30
23
0.31
25
0.38
11
0.25
Midland
Prison
54
0.21
56
0.23
61
0.23
70
0.25
73
0.22
82
0.24
60
0.24
81
0.25
Gladwin
Prison
9
0.11
18
0.21
20
0.22
9
0.10
13
0.17
22
0.21
13
0.15
21
0.25
St. Clair
Prison
111
0.21
135
0.22
139
0.22
144
0.22
178
0.23
189
0.25
149
0.20
199
0.25
Huron
Prison
6
0.21
12
0.17
17
0.21
10
0.15
12
0.22
13
0.23
9
0.15
12
0.24
Bay
Prison
121
0.40
92
0.35
109
0.37
68
0.24
83
0.25
113
0.30
94
0.29
79
0.24
Mason
Prison
22
0.22
24
0.27
45
0.38
22
0.23
14
0.16
18
0.16
40
0.34
23
0.24
Iosco
Prison
26
0.31
32
0.40
20
0.22
23
0.28
31
0.32
45
0.38
30
0.41
17
0.24
Cheboygan
Prison
13
0.23
18
0.24
20
0.19
10
0.14
12
0.14
12
0.13
28
0.26
23
0.24
Arenac
Prison
6
0.13
7
0.18
6
0.12
7
0.16
5
0.16
4
0.12
5
0.15
9
0.24
Michigan
Prison
9,398
0.25
8,794
0.24
8,558
0.22
8,813
0.23
9,120
0.23
8,945
0.22
9,002
0.23
9,179
0.23
Newaygo
Prison
21
0.14
23
0.17
28
0.17
28
0.19
23
0.17
20
0.14
24
0.18
32
0.23
Kalkaska
Prison
17
0.23
14
0.25
19
0.26
8
0.13
24
0.30
31
0.30
18
0.28
16
0.22
Kent
Prison
787
0.29
709
0.27
657
0.25
685
0.23
753
0.24
769
0.26
662
0.24
567
0.22
Van Buren
Prison
52
0.19
55
0.21
57
0.19
65
0.20
49
0.15
42
0.11
78
0.22
65
0.22
Table 1.1

9
Overall Felony Disposition Rates By County Highest Disposition Rate to Lowest Disposition Rate
1993
1993
1994
1994
1995
1995
1996
1996
1997
1997
1998
1998
1,999
1,999
2,000
2000
County
Disposition
Total
Rate
Total
Rate
Total
Rate
Total
Rate
Total
Rate
Total
Rate
Total
Rate
Total
Rate Ingham
Prison
298
0.26
290
0.25
259
0.24
268
0.25
296
0.26
264
0.26
180
0.20
185
0.22
Saginaw
Prison
308
0.29
334
0.32
300
0.25
275
0.25
327
0.26
387
0.29
322
0.27
223
0.21
Kalamazoo
Prison
295
0.23
267
0.21
258
0.20
373
0.25
285
0.21
275
0.20
264
0.20
285
0.21
Ontonagon
Prison
3
0.21
7
0.64
3
0.21
0
0.00
2
0.25
3
0.21
0
0.00
3
0.21
Tuscola
Prison
21
0.20
19
0.19
30
0.25
36
0.23
41
0.30
30
0.25
36
0.24
37
0.21
Calhoun
Prison
184
0.29
161
0.25
189
0.27
223
0.26
217
0.22
186
0.19
210
0.21
216
0.21
Otsego
Prison
16
0.21
22
0.29
21
0.26
16
0.27
11
0.16
16
0.20
29
0.29
23
0.21
Missaukee
Prison
11
0.32
3
0.06
8
0.24
11
0.22
14
0.26
12
0.20
10
0.21
12
0.21
Cass
Prison
27
0.18
47
0.27
37
0.25
38
0.22
28
0.19
57
0.25
51
0.21
42
0.20
Marquette
Prison
16
0.14
18
0.13
14
0.10
18
0.15
19
0.16
12
0.11
18
0.17
29
0.20
Branch
Prison
20
0.21
17
0.16
27
0.23
22
0.18
16
0.12
24
0.17
25
0.19
26
0.20
St. Joseph
Prison
48
0.28
28
0.18
45
0.23
50
0.25
35
0.18
50
0.25
48
0.18
43
0.20
Alger
Prison
0
0.00
3
0.21
2
0.10
1
0.04
3
0.11
4
0.15
1
0.05
4
0.20
Delta
Prison
21
0.36
12
0.15
13
0.13
18
0.20
9
0.11
23
0.26
23
0.25
17
0.19
Roscommon
Prison
18
0.16
11
0.11
19
0.16
24
0.19
24
0.18
29
0.22
21
0.21
21
0.19
Houghton
Prison
4
0.07
5
0.09
13
0.23
5
0.11
9
0.21
15
0.23
13
0.31
10
0.19
Luce
Prison
8
0.62
2
0.13
6
0.30
1
0.07
3
0.17
5
0.31
1
0.06
4
0.18
Montmorency
Prison
3
0.10
3
0.07
9
0.27
6
0.22
5
0.18
4
0.14
3
0.07
10
0.18
Iron
Prison
5
0.15
7
0.21
5
0.10
7
0.22
10
0.20
9
0.20
12
0.22
9
0.18
Oakland
Prison
1,010
0.19
828
0.16
742
0.15
806
0.16
907
0.17
983
0.17
908
0.17
912
0.18
Macomb
Prison
375
0.20
377
0.18
330
0.16
319
0.15
429
0.17
437
0.17
475
0.18
493
0.17
Table 1.1

10
Overall Felony Disposition Rates By County Highest Disposition Rate to Lowest Disposition Rate
1993
1993
1994
1994
1995
1995
1996
1996
1997
1997
1998
1998
1,999
1,999
2,000
2000
County
Disposition
Total
Rate
Total
Rate
Total
Rate
Total
Rate
Total
Rate
Total
Rate
Total
Rate
Total
Rate Osceola
Prison
11
0.12
6
0.10
20
0.22
23
0.20
29
0.31
19
0.21
17
0.18
17
0.17
Washtenaw
Prison
278
0.35
236
0.30
227
0.26
270
0.31
253
0.26
171
0.18
183
0.22
159
0.17
Lapeer
Prison
46
0.24
38
0.19
38
0.17
42
0.21
43
0.22
45
0.24
55
0.24
34
0.17
Eaton
Prison
58
0.16
55
0.17
42
0.15
67
0.21
56
0.17
55
0.16
64
0.19
65
0.17
Alcona
Prison
5
0.22
3
0.14
2
0.07
7
0.30
7
0.20
10
0.26
3
0.08
6
0.16
Wexford
Prison
16
0.17
21
0.26
21
0.22
23
0.20
27
0.31
32
0.31
18
0.18
17
0.16
Presque Isle
Prison
4
0.11
4
0.10
11
0.22
6
0.13
7
0.16
4
0.10
9
0.21
9
0.16
Sanilac
Prison
21
0.16
20
0.13
20
0.18
21
0.15
25
0.19
24
0.17
24
0.16
21
0.15
Isabella
Prison
26
0.11
20
0.10
19
0.09
33
0.14
34
0.11
23
0.09
44
0.16
43
0.13
Ottawa
Prison
89
0.18
103
0.18
134
0.19
98
0.14
137
0.17
104
0.12
95
0.13
97
0.13
Ionia
Prison
25
0.15
17
0.11
30
0.17
36
0.21
34
0.18
34
0.17
34
0.21
22
0.12
Dickinson
Prison
4
0.05
8
0.12
11
0.14
7
0.09
15
0.17
18
0.18
11
0.12
12
0.12
Clare
Prison
10
0.14
12
0.15
13
0.13
8
0.09
22
0.22
15
0.21
11
0.11
9
0.11
Menominee
Prison
8
0.13
6
0.10
6
0.15
10
0.23
9
0.24
10
0.17
6
0.17
6
0.11
Alpena
Prison
9
0.11
10
0.12
13
0.15
14
0.19
17
0.26
9
0.12
13
0.27
7
0.10
Montcalm
Prison
24
0.13
19
0.10
32
0.15
42
0.18
35
0.20
43
0.20
36
0.17
22
0.10
Baraga
Prison
6
0.67
4
0.31
2
0.18
1
0.14
1
0.13
3
0.17
2
0.15
1
0.09
Chippewa
Prison
12
0.16
13
0.24
12
0.17
11
0.12
10
0.14
10
0.15
6
0.07
6
0.09
Oceana
Prison
10
0.13
5
0.07
4
0.06
14
0.15
22
0.25
12
0.14
22
0.24
8
0.08
Lake
Prison
4
0.10
11
0.24
15
0.32
18
0.24
15
0.23
6
0.12
9
0.19
3
0.05
Keweenaw
Prison
1
1.00
0
0.00
0
0.00
1
0.33
1
0.17
0
0.00
0
0
0.00
Table 1.1 Note: OCC/MDOC offender database uses the single most serious court disposition received during the reporting period.

11
Table 1.2

12
Table 1.2
13
Table 1.3
14
Table 1.3

15
PRISON INTAKES AND RETURNS Fiscal Year/Calendar Year [1]
1994
1995
1996
1997
1998
1999
2000 [2]
2001
New Court Commitments
5,680
5,160
5,090
5,151
4,948
4,414
4,352
4,879
Probation Violators
1,932
2,617
3,046
3,154
3,131
3,136 3,332
3,480
Parole Violators - New Sentence
1,233
890
1,033
1,288
1,345
1,254 1,164
1,195
Parole Violators - Technical Viol.
1,964
1,916
2,577
2,668
3,109
3,186 3,104
3,236
Total B Intake and Returns [3]
10,809
10,583
11,746
12,261
12,533
11,990
11,952
12,790
Total B Intake Only [4]
8,845
8,667
9,169
9,593
9,424
8,804 8,848
9,554
Probation and Parole
5,129
5,423
6,656
7,110
7,585
7,576
7,600
7,911
Percentage: New Commitments
53%
49%
43%
42%
39%
37%
36%
38%
[1] 1994-1999 based on fiscal year data. 2000-2001 based on calendar year data. [2] Corrections Data Fact Sheet for December 2000. [3] Prison intake and returns include new court commitments, probation violators (technical and new [4] Prison intake includes new court commitments, probation violators (technical and new sentence),
parole violators with new sentences, and escapees with new sentences.
Table 1.4a
0 10,000 20,000 Total intakes and Returns
199419951996199719981999
2000[2]2001
Fisc
al Y
ear
New Court Commitments Probation violatorsParole violators - New sentence Parole violators - technical viol.
Prison Intakes and Returns
16
Calendar Year 2001 Prison Intakes by Percentage ofProbationer Intakes to Prison[1,2]
Escapee New Court Probationer Parole Violator Total % of ProbationerCOUNTY Commitments New Sentence Intakes Intakes
Montmorency 1 4 5 80.0%Missaukee 4 6 10 60.0%VanBuren 15 28 5 48 58.3%Livingston 53 66 7 126 52.4%Berrien 2 137 176 22 337 52.2%Alcona 4 4 8 50.0%Lake 5 7 2 14 50.0%Wexford 16 16 1 33 48.5%Lenawee 59 61 8 128 47.7%Emmet 1 10 14 6 31 45.2%Kalkaska 14 12 1 27 44.4%Presque Isle 5 4 9 44.4%Monroe 3 64 63 12 142 44.4%Bay 39 39 10 88 44.3%Genesee 239 227 55 521 43.6%Barry 24 21 4 49 42.9%Iosco 17 15 3 35 42.9%Clinton 23 20 5 48 41.7%St. Clair 2 70 65 20 157 41.4%Oceana 13 9 22 40.9%Allegan 38 30 6 74 40.5%Wayne 24 1317 1073 312 2726 39.4%Charlevoix 13 11 4 28 39.3%Ingham 2 103 82 22 209 39.2%Roscommon 1 9 7 1 18 38.9%Saginaw 119 91 26 236 38.6%Clare 7 5 1 13 38.5%Muskegon 1 189 148 49 387 38.2%Midland 25 19 7 51 37.3%Shiawassee 32 24 9 65 36.9%Kalamazoo 134 103 42 279 36.9%Jackson 2 131 96 34 263 36.5%Ogemaw 7 4 11 36.4%State Total 55 4877 3479 1183 9594 36.3%Calhoun 97 74 35 206 35.9%Crawford 7 5 2 14 35.7%Leelanau 10 6 1 17 35.3%Dickinson 10 7 3 20 35.0%Branch 17 10 2 29 34.5%Alpena 7 4 1 12 33.3%Antrim 15 8 1 24 33.3%Cass 20 11 2 33 33.3%Eaton 1 42 24 5 72 33.3%Tuscola 23 14 6 43 32.6%Isabella 15 12 10 37 32.4%Manistee 10 5 1 16 31.3%Washtenaw 74 41 19 134 30.6%Macomb 5 241 129 59 434 29.7% Table 1.4b

17
Calendar Year 2001 Prison Intakes by Percentage ofProbationer Intakes to Prison[1,2]
Escapee New Court Probationer Parole Violator Total % of ProbationerCOUNTY Commitments New Sentence Intakes Intakes
Gratiot 15 8 4 27 29.6%Ionia 20 10 4 34 29.4%Osceola 22 10 2 34 29.4%Kent 2 368 188 122 680 27.6%Hillsdale 43 19 10 72 26.4%Gladwin 1 10 5 3 19 26.3%Oakland 5 529 239 150 923 25.9%Arenac 6 2 8 25.0%Houghton 6 2 8 25.0%Luce 2 1 1 4 25.0%Mason 17 7 4 28 25.0%Grand Traverse 34 15 12 61 24.6%St. Joseph 36 13 4 53 24.5%Lapeer 18 8 7 33 24.2%Ottawa 1 55 20 10 86 23.3%Montcalm 32 11 6 49 22.4%Newaygo 20 7 6 33 21.2%Iron 6 2 2 10 20.0%Cheboygan 1 6 2 2 11 18.2%Delta 10 2 1 13 15.4%Benzie 5 1 1 7 14.3%Marquette 11 2 1 14 14.3%Otsego 12 2 1 15 13.3%Sanilac 12 2 2 16 12.5%Mecosta 16 1 4 21 4.8%Alger 2 1 3 0.0%Baraga 1 1 0.0%Chippewa 1 13 1 15 0.0%Gogebic 3 3 0.0%Huron 1 1 0.0%Mackinac 2 2 0.0%Menominee 9 1 10 0.0%Ontonagon 2 2 0.0%Oscoda 6 6 0.0%Schoolcraft 3 3 0.0%
[1] Prison intake and returns include new court commitments, probation violators (technical and new sentence)parole violators with new sentences, and escapees with new sentences, and parole violators that aretechnical violations.[2] Prison intake includes new court commitments, probation violators (technical and new sentence), parole violators with new sentences, and escapees with new sentences.
1-28-02 Probationintake2001C.xlsSOURCE: Preliminary 1/10/2002 CMIS datasetK. Dimoff - H:\ADMITS\2001\REPORTS\20020124.DOC - January 24, 2002
Table 1.4b
18
Table 1.5
Prison Disposition Rates for 2000 - Controlled Substance Felonies
Prison Disposition Rates for 2000 - OUIL Felonies
Disposition
Disposition Prison Prison Prison Prison
County Count %
County Count %
Benzie 2 50.0% Hillsdale 3 75.0% Luce 1 50.0% Allegan 17 58.6% Manistee 3 50.0% Mackinac 1 50.0% Lenawee 13 40.6% Schoolcraft 2 50.0% Crawford 4 40.0% Livingston 40 41.7% Jackson 60 35.7% Gladwin 7 41.2% Monroe 41 34.2% Muskegon 33 40.2% Muskegon 63 34.1% Van Buren 12 34.3% Genesee 121 33.5% Grand Traverse 18 33.3% Charlevoix 2 33.3% Alger 1 33.3% Berrien 44 29.3% Emmet 3 33.3% Huron 2 28.6% Berrien 12 32.4% Gratiot 3 27.3% Genesee 37 31.9% Kalamazoo 82 26.9% Monroe 16 31.4% Clare 1 25.0% Branch 5 31.3% St. Clair 37 24.5% Gratiot 8 30.8% Grand Traverse 6 23.1% Missaukee 3 30.0% Newaygo 2 22.2% Iron 2 28.6% Iosco 2 22.2% Manistee 4 28.6% Branch 5 20.8% Jackson 33 28.2% Lake 1 20.0% Bay 11 28.2% Michigan 1538 17.7% Cass 10 27.8% Clinton 3 17.6% Ogemaw 3 27.3% Van Buren 9 17.3% Clinton 7 26.9% Wayne 501 17.1% Charlevoix 4 26.7% Presque Isle 1 16.7% Kent 47 26.0% Leelanau 1 16.7% Antrim 1 25.0% Mason 2 16.7% Lenawee 3 25.0% Calhoun 35 16.1% Wexford 2 25.0% Ingham 24 16.0% St. Clair 27 24.3% Kent 93 15.9% Calhoun 13 24.1% Oakland 159 15.5% Midland 10 23.8% Otsego 2 15.4% Otsego 4 23.5% Livingston 11 15.1% Isabella 11 23.4% Delta 2 14.3% Mecosta 3 23.1% Hillsdale 1 14.3% Lapeer 10 21.7% Lapeer 2 14.3% Barry 5 20.8% Sanilac 2 13.3% Cheboygan 6 20.0% Kalkaska 2 13.3% Luce 1 20.0% Montcalm 2 13.3% Kalamazoo 21 19.8% Arenac 1 12.5% Michigan 739 19.5%Roscommon 1 12.5% Sanilac 4 19.0% Isabella 5 11.9% Leelanau 3 18.8% Saginaw 27 11.3% Washtenaw 15 18.3% Macomb 107 11.3% Crawford 2 18.2% Allegan 6 11.1% Montmorency 2 18.2%

19
Table 1.5
Prison Disposition Rates for 2000 - Controlled Substance Felonies
Prison Disposition Rates for 2000 - OUIL Felonies
Disposition
Disposition Prison Prison Prison Prison
County Count %
County Count %
Bay 5 11.1% Osceola 4 18.2% Eaton 3 11.1% Delta 5 17.9% Missaukee 1 11.1% Montcalm 6 15.0% Mecosta 1 11.1% Newaygo 4 14.8% Shiawassee 2 10.5% Wayne 59 14.3% Ionia 2 10.5% Shiawassee 5 14.3% Wexford 1 10.0% Alcona 1 14.3% Emmet 1 10.0% Macomb 30 13.9% Washtenaw 14 9.6% Oakland 80 12.8% Barry 2 9.5% Kalkaska 1 12.5% Midland 2 8.7% Presque Isle 1 12.5% Dickinson 1 7.1% Dickinson 3 12.5% Oceana 1 6.7% Ingham 13 11.9% Tuscola 1 6.7% Tuscola 5 11.1% Marquette 1 4.8% Ottawa 11 11.0% St. Joseph 1 4.5% Saginaw 9 10.8% Ottawa 3 3.3% Roscommon 4 10.5% Alpena 1 3.2% Clare 2 9.1% Cass 1 3.0% Ionia 5 9.1% Antrim 0 0.0% Houghton 1 8.3% Alcona 0 0.0% St. Joseph 2 8.3% Alger 0 0.0% Mason 1 7.7% Cheboygan 0 0.0% Eaton 4 7.3% Iron 0 0.0% Marquette 1 6.7% Baraga 0 0.0% Chippewa 0 0.0% Montmorency 0 0.0% Benzie 0 0.0% Schoolcraft 0 0.0% Baraga 0 0.0% Menominee 0 0.0% Iosco 0 0.0% Houghton 0 0.0% Lake 0 0.0% Oscoda 0 0.0% Alpena 0 0.0% Osceola 0 0.0% Huron 0 0.0% Gladwin 0 0.0% Arenac 0 0.0% Mackinac 0 0.0% Menominee 0 0.0% Ogemaw 0 0.0% Oceana 0 0.0% Ontonagon 0 0.0% Ontonagon 0 0.0% Keweenaw 0 0.0% Oscoda 0 0.0% Chippewa 0 0.0% Keweenaw 0 0.0%

20
PART 2
JAIL UTILIZATION
Jails are a key sanction for felony and misdemeanant offenders in each county. Approximately 80% of felony offenders are sentenced to a community sanction - 56% of these offenders are sentenced to a jail term. During the 1990s and through 2000, sentenced felons accounted for an increasing percentage of jails= average daily population. The percentage of felony offenders sentenced to jail increased as prison commitment rates decreased; data presented in Part 1 showed that the use of split sentences has also increased. Progressively, the sentence to jail is a condition of probation and part of a structured sentence plan which includes a relatively short term in jail followed by placement in residential or other community-based programs. Section 8.4 of P.A. 511 explains that the purpose of the Act includes the participation of offenders who would likely be sentenced to imprisonment in a state correctional facility or jail. Section 2 (c) defines Acommunity corrections program@ as a program that is an alternative to incarceration in a state correctional facility or jail. Over the years, as prison commitment rates decreased, and as a result of legislative changes, the role of jails in the community corrections system has changed. This section examines the use of jails in Michigan as part of the continuum of sanctions available in sentencing decisions. The State Community Corrections Board has adopted priorities for jail use for community corrections. Each CCAB is required to examine the jail management practices and policies as part of the annual community corrections comprehensive plan and application for funds. Local policies/practices directly affect the availability of jail beds which can be utilized for sentenced felons. Local jurisdictions have implemented a wide range of policies/practices to influence the number and length of stay of different offender populations. The local policies and practices include conditional release options for pretrial detainees, restrictions on population groups which can be housed in the jail in order to reserve jail beds for offenders who are a higher risk to public safety, earned release credits (i.e., reduction in jail time for participation in-jail programming), and structured sentencing. During 2000, 44% of the straddle cell offenders were sentenced to jail. Due to the high number of straddle cell offenders sentenced to prison, the State Community Corrections Board targeted this population as a priority population for community corrections. A jail sentence is also a key sanction used for probation violators. Local probation response guides often include jail time along with additional local sanctions imposed including programs funded by community corrections. Jail crowding issues can impact the use of jails and availability of beds for alternative sanctions for different felony offender target groups, such as straddle cell offenders, probation violators, and even intermediate sanction offenders. The use of jail beds for serious felony offenders is an issue when jail crowding occurs. Community corrections programs have been established to impact on the amount of jail time that offenders serve. Program policies have been established so that program participation and successful completion of programs lead to decreased jail lengths of stay.

21
JAIL STATISTICS OVERVIEW During CY 2001 and the first nine months of CY 2002, 69 of Michigan=s 81 counties with jails electronically transmitted jail utilization and inmate profile data to the State. Collectively the county data inputs comprise the Jail Population Information System (JPIS). During the full calendar year of 2001, the reporting counties accounted for an average of 15,854 of the jail beds in the State; about 90% of the total jail beds in Michigan. Since not every county is included in the report and some of the reporting counties did not contribute data every month, the summary data from the report does not completely represent State figures or State totals; however, it does provide a reasonable and useful representation of a mix of counties including rural, urban, and metropolitan counties. One of the stated purposes of JPIS is to provide information to support coherent policy making. Using this data, the State and CCABs can track jail utilization, study utilization trends, examine characteristics of offenders being sent to jail, and evaluate specific factors affecting jail utilization. Results of such analyses permit formulation of objectives to improve utilization (i.e., reducing jail crowding, changing offender population profiles, and reducing the average length of stay), and to monitor the utilization of the jails after various policies, practices, procedures or programming are implemented. This part of the biannual report summarizes the data for CY 2001 and the first nine months in CY 2002 based upon primary categories of the JPIS data. The report indicated the average daily populations by type of offenders utilizing the jails, average lengths of stay, and the number of releases upon which lengths of stay are based. This report focuses on felons and misdemeanants that originated in the reporting counties, as opposed to the part of the jail populations made up of offenders boarded for the State, the Federal government and other counties, or offenders held on writs, etc. The JPIS data for CY 2001 and the first nine months of CY 2002 show the following:
� Of the offenders released during this period: - 138,370 were charged as felons. - 289,872 were charged as misdemeanants.
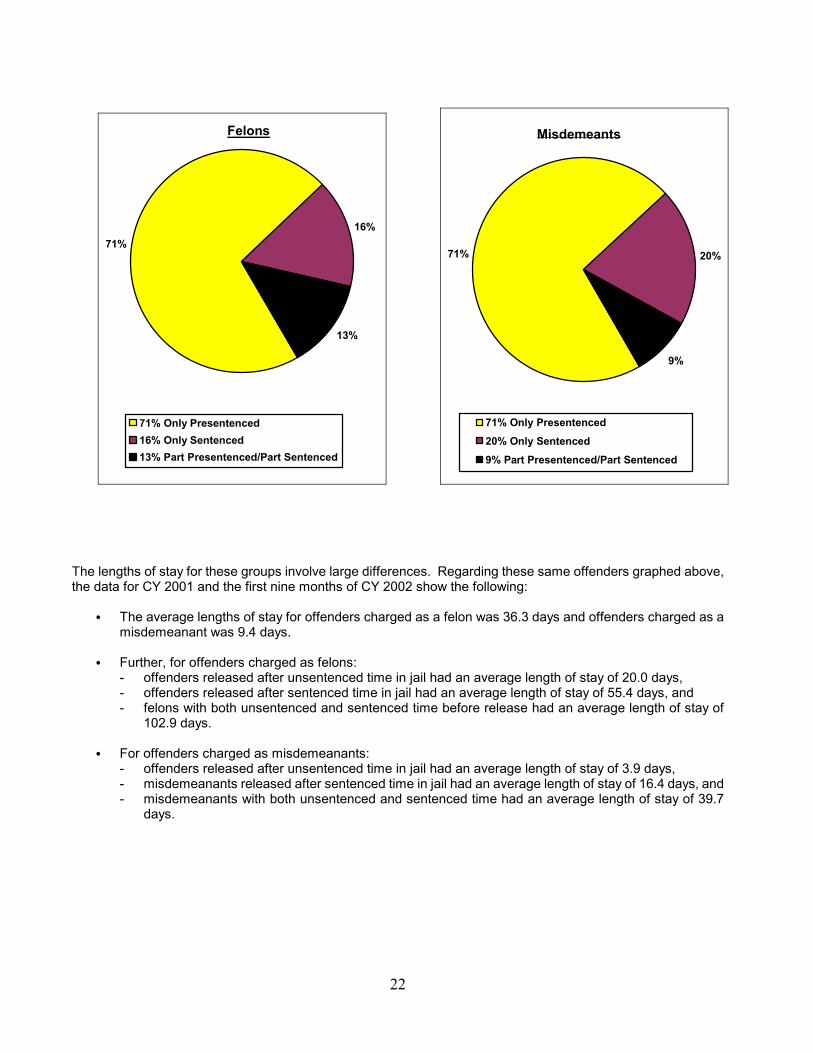
� Of the 138,370 offenders charged as felons:
- 71% (98,673) were released with unsentenced time in jail. - 16% (21,821) were released after sentenced time in jail. - 13% (17,876) spent part of their time unsentenced and the remainder sentenced.
� Of the 289,872 offenders charged as misdemeanants:
- 71% (206,989) were released after unsentenced time in jail. - 20% (58,334) were released after sentenced time in jail. - 9% (24,549) spent part of their time unsentenced and the remainder sentenced.
These figures are illustrated in percentages in the charts on page 22.
22
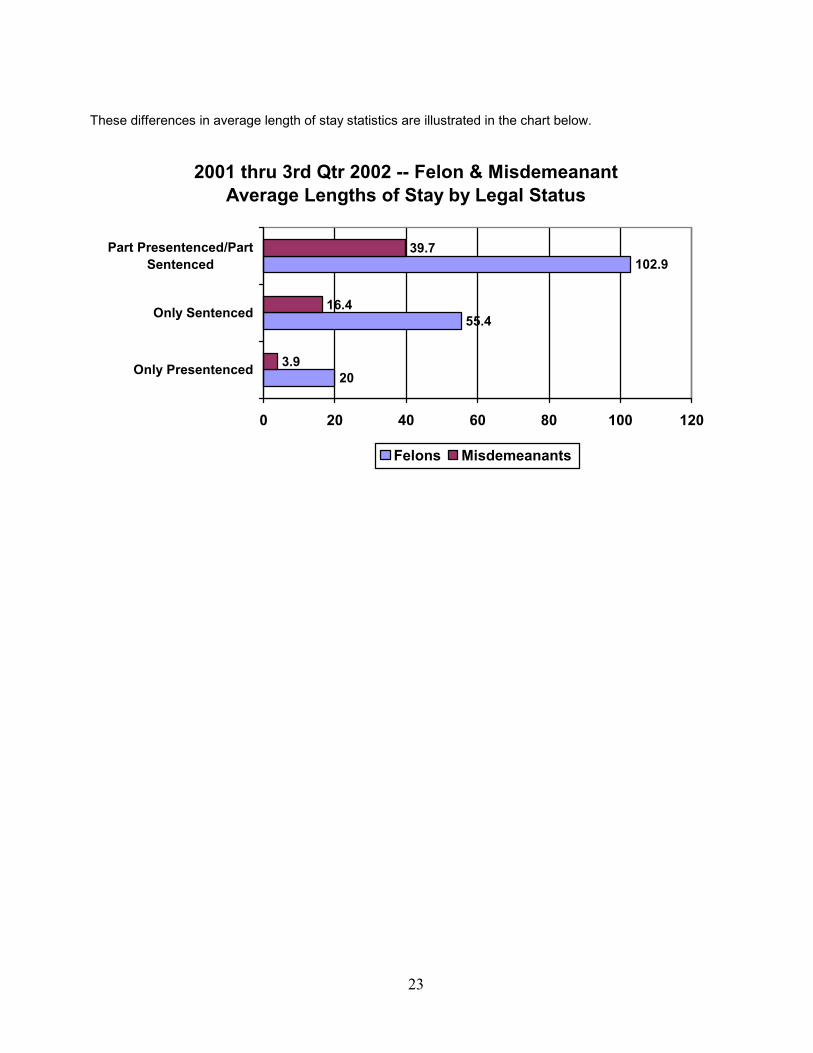
The lengths of stay for these groups involve large differences. Regarding these same offenders graphed above, the data for CY 2001 and the first nine months of CY 2002 show the following:
� The average lengths of stay for offenders charged as a felon was 36.3 days and offenders charged as a misdemeanant was 9.4 days.
� Further, for offenders charged as felons:
- offenders released after unsentenced time in jail had an average length of stay of 20.0 days, - offenders released after sentenced time in jail had an average length of stay of 55.4 days, and - felons with both unsentenced and sentenced time before release had an average length of stay of
102.9 days.
� For offenders charged as misdemeanants: - offenders released after unsentenced time in jail had an average length of stay of 3.9 days, - misdemeanants released after sentenced time in jail had an average length of stay of 16.4 days, and - misdemeanants with both unsentenced and sentenced time had an average length of stay of 39.7
days.
Felons
71%16%
13%
71% Only Presentenced16% Only Sentenced13% Part Presentenced/Part Sentenced
Misdemeants
71% 20%
9%
71% Only Presentenced20% Only Sentenced9% Part Presentenced/Part Sentenced
23
These differences in average length of stay statistics are illustrated in the chart below.
2001 thru 3rd Qtr 2002 -- Felon & Misdemeanant Average Lengths of Stay by Legal Status
20
55.4
102.939.7
3.9
16.4
0 20 40 60 80 100 120
Only Presentenced
Only Sentenced
Part Presentenced/PartSentenced
Felons Misdemeanants

24
PART 3
PROGRAM UTILIZATION
FISCAL YEAR 2002 Community corrections programs are expected to contribute to local goals and objectives concerning prison commitments and/or jail utilization of their respective counties. Appropriate program policies and local practices must be in place for the programs to operate as diversions from prison or jail, or as treatment programs that can reduce the recidivism of offenders that successfully complete the program. To impact prison commitment and jail utilization rates, specific target populations have been identified due to the high number of these offenders being sentenced to prison or jail. It is not possible to individually identify offenders that would have been sentenced to prison or jail if alternative sanctions or treatment programs were not available. But as a group, evidence can be presented to support their designation as a target population. National research studies have been completed that show that cognitive restructuring and substance abuse programs reduce recidivism. Community corrections funds have been used to fund these types of programs based upon these national studies. Further, supporting information is available concerning the impact of community corrections sanctions and programs on jail utilization. It is possible to identify local sentencing policies that specify that jail time will be decreased based upon an offender=s participation or completion of community corrections programs. This section presents information relative to offenders screened and determined eligible for participation in P.A. 511 programs and enrollments in community corrections programs during FY 2002. In the following Tables, the number of eligible P.A. 511 offenders represents an unduplicated count of offenders; the number of enrollments is greater than the number determined eligible because an offender can be enrolled in multiple programs. October 2001 through September 2002 eligible offender data and program enrollment data, submitted by local jurisdictions, indicate the following: Eligible Offenders $ Since FY 1997, there has been an increase in the number of felony offenders determined eligible for
community corrections programs. In FY 1997, 61% of the eligible offenders were felons and 39% were misdemeanants, while during FY 2002, 63% of the eligible offenders were felons.
$ Over 30,300 offenders were determined to be eligible to participate in P.A. 511 programs during FY 2002. For
additional information, please refer to the Tables on pages 26-27.
25
While complete data is not available for analysis for the entire 2002 fiscal year, an analysis of the first six months of FY 2002 yielded the following: $ Nearly 800 straddle cell offenders were determined eligible for P.A. 511 services in the first half of FY 2002.
The actual number of straddle cell offenders was probably higher, but reporting of sentencing guideline data on sentenced felons is incomplete. More than 62% of the offenders have the SGL data recorded as either not applicable or unknown.
$ For the first half of FY 2002, sentenced felons convicted of higher severity felonies were reported for 60% of the
eligible offenders. The severity of the felony is a key determinant in the probability of a prison or a jail sentence. The higher the severity of the felony, the higher the probability of a prison or jail sentence. The legislative sentencing guidelines divide crimes into nine levels, from AA@ the most serious crimes to AH@ the least serious crimes. When the severity group E was included, 60% of the sentenced felons had a felony severity of A through E. Only 5% of the felons were reported with a PACC code that fell into the least severe felony group of H.
$ For sentenced felons, 31% of the offenders were reported with crimes against property, and 28% were reported
with crimes involving controlled substances. Crimes against public safety accounted for 21% of the offenders, and crimes against persons accounted for 13% of the offenders.
Enrolled Offenders $ For October 2001 through September 2002, there were over 54,800 program enrollments, compared to almost
49,500 reported in FY 2001. Nearly 37,400 of the offenders were in programs funded in whole or in part by state community corrections funds.
$ In FY 2002, felony program enrollments in P.A. 511 funded programs accounted for the majority of enrollments
in treatment programs: approximately 76% of all substance abuse enrollments, about 84% of all mental health enrollments, approximately 76% of the educational enrollments, and about 71% of the employment enrollments. Misdemeanant offenders were more likely enrolled in community service programs. This is as expected considering community service programs are utilized extensively to reduce the misdemeanant population in the jails in order to increase the availability of jail beds for felons. In addition to the frequent use of substance abuse programs for sentenced felons, alternative funding sources were also utilized to extend these programs to a smaller but sizeable number of misdemeanants.
$ Pretrial service programs have been implemented in several jurisdictions to expand utilization of conditional
release options and decrease lengths of stay in jail of pretrial detainees. The enrollment for programs funded by community corrections consists of over 83% felons. This serves as another means to increase the availability of jail beds for sentenced felons.

26
Offenders Determined PA-511 Eligible
Summaries of FY 2001 and FY 2002
FY 2001
Unsentenced
Sentenced
Totals
%
Felony
2,058
16,172
18,230
65%
Misdemeanor
1,563
8,107
9,670
35%
Totals
3,621
24,279
27,900
%
13%
87%
FY 2002
Unsentenced
Sentenced
Totals
%
Felony
3,146
15,949
19,095
63%
Misdemeanor
2,393
8,821
11,214
37%
Totals
5,539
24,770
30,309
%
18%
82%
Note: Tables based on CCIS Offender data with available Crime Class and Legal Status. Civil infractions included as misdemeanors; federal as felonies.

27
State Summary Enrollments by Crime Class & Legal Status
PA-511 Funded
FY 2002 Legal StatusUnsentenced Crime Class
Sentenced Crime Class
Type of Program
New
Enrollments Felon Misdemeanant Felon Misdemeanant Case Management 4,623 321 25 3,560 717 Community Service 7,525 63 98 3,062 4,302 Education 1,307 197 81 799 230 Employment & Training 882 49 42 578 213 Intensive Supervision 4,722 789 362 1,370 2,201 Mental Health 325 55 4 218 48 Pre-Trial Services 9,912 6,026 1,319 2,263 304 Probation/Residential 4,120 77 7 3,903 133 Substance Abuse 3,121 105 47 2,258 711 Other 853 11 4 776 62 Total 37,390 7,693 1,989 18,787 8,921
State Summary of New Enrollments by Crime Class and Legal Status
All Funding Sources
FY 2002 Legal statusUnsentenced Crime class
Sentenced Crime class
Type of Program
New
Enrollments Felon Misdemeanant Felon Misdemeanant Case Management 5,337 327 354 3,718 938 Community Service 10,037 87 123 4,599 5,228 Education 1,651 261 109 959 322 Employment & Training 1,273 55 46 731 441 Intensive Supervision 5,551 852 656 1,497 2,546 Mental Health 548 95 16 296 141 Pre-Trial Services ** 16,360 6,649 6,639 2,354 718 Probation/Residential 4,624 80 12 4,316 216 Substance Abuse 5,673 150 66 3,379 2,078 Other 3,749 28 9 3,586 126 Total 54,803 8,584 8,030 25,435 12,754 Notes: 56,483 total reported enrollments; above tables based upon 54,803 records where program code, crime
class & legal status were all available.
Data may include enrollment of an individual in more than one program. ** Some Pre-Trial Services, rendered to offenders eventually sentenced as felons or misdemeanants, appear under the respective “Sentenced” columns.
28
PART 4
FY 2003 AWARD OF COMMUNITY CORRECTIONS FUNDS COMMUNITY CORRECTIONS PLANS AND SERVICES FUNDS
FY 2003 Appropriation $13,006,000 FY 2003 Award of Funds $13,005,962
FY 2003 Community Corrections Plans and Services funds were awarded to support community-based programs in 72 counties. On December 5, 2002, Governor John Engler signed Executive Order #2002-22 that reduced the Community Corrections Plans and Services appropriation from $13,033,000 to $13,006,000. The Plans and Services funds are utilized within local jurisdictions to support a wide range of programming options for eligible detainees and offenders. The distribution of funds among program categories is presented below.
Resource Commitment by Program Category:
Community Service $1,067,667 Education $1,026,766 Employment & Training $462,760 Intensive Supervision $1,610,478 Mental Health $245,924 Pretrial Services $1,801,145 Substance Abuse $1,256,996 24 Hour Structured $11,000 Case Management $1,783,646 CCAB Administration $2,882,835 Other $856,745
Total $13,005,962
In FY 2003, a commitment to increase emphasis on cognitive behavioral-based and other programming for higher risk need cases was continued. This represents a continuation and further implementation of priorities adopted by the State Community Corrections Board and the Department in February 1999 and reaffirmed in February 2000. Resource Commitment by Local Jurisdiction The sanctions and services supported by FY 2003 Comprehensive Plans and Services funds within each local jurisdiction are identified in Table 4.1.
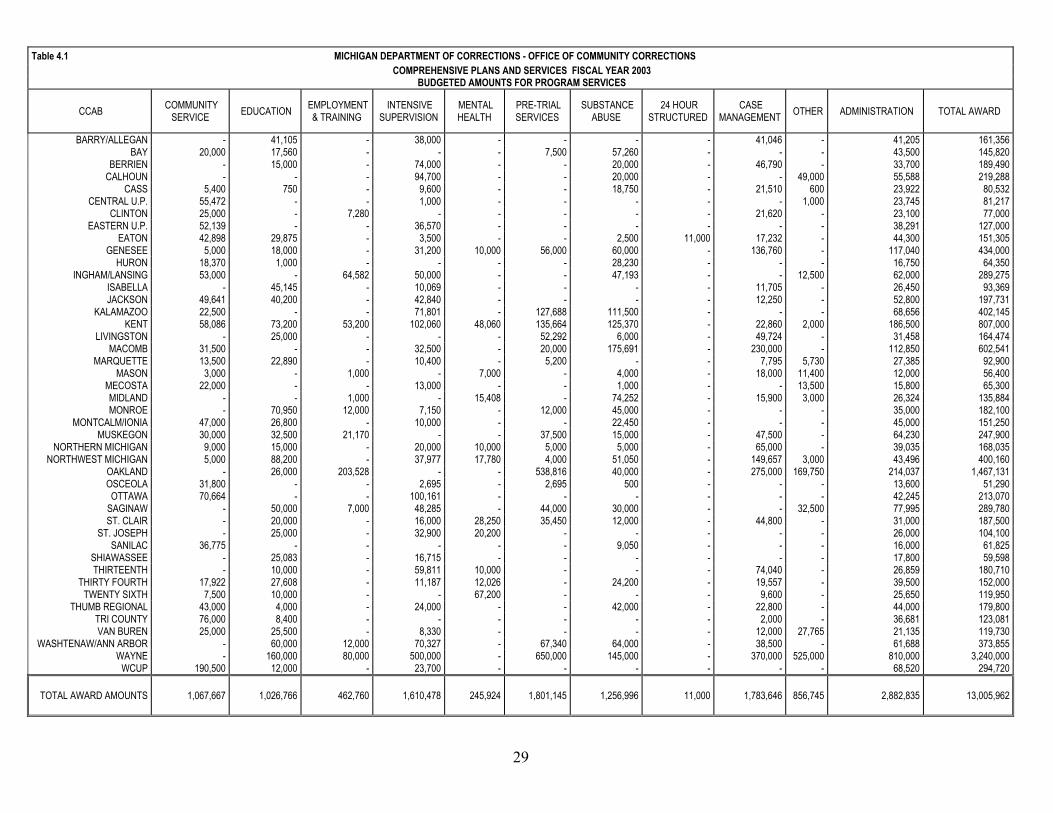
29
Table 4.1 MICHIGAN DEPARTMENT OF CORRECTIONS - OFFICE OF COMMUNITY CORRECTIONS COMPREHENSIVE PLANS AND SERVICES FISCAL YEAR 2003
BUDGETED AMOUNTS FOR PROGRAM SERVICES
CCAB COMMUNITY SERVICE EDUCATION EMPLOYMENT
& TRAINING INTENSIVE
SUPERVISION MENTAL HEALTH
PRE-TRIAL SERVICES
SUBSTANCE ABUSE
24 HOUR STRUCTURED
CASE MANAGEMENT OTHER ADMINISTRATION TOTAL AWARD
BARRY/ALLEGAN - 41,105 - 38,000 - - - - 41,046 - 41,205 161,356 BAY 20,000 17,560 - - - 7,500 57,260 - - - 43,500 145,820
BERRIEN - 15,000 - 74,000 - - 20,000 - 46,790 - 33,700 189,490 CALHOUN - - - 94,700 - - 20,000 - - 49,000 55,588 219,288
CASS 5,400 750 - 9,600 - - 18,750 - 21,510 600 23,922 80,532 CENTRAL U.P. 55,472 - - 1,000 - - - - - 1,000 23,745 81,217
CLINTON 25,000 - 7,280 - - - - - 21,620 - 23,100 77,000 EASTERN U.P. 52,139 - - 36,570 - - - - - - 38,291 127,000
EATON 42,898 29,875 - 3,500 - - 2,500 11,000 17,232 - 44,300 151,305 GENESEE 5,000 18,000 - 31,200 10,000 56,000 60,000 - 136,760 - 117,040 434,000
HURON 18,370 1,000 - - - - 28,230 - - - 16,750 64,350 INGHAM/LANSING 53,000 - 64,582 50,000 - - 47,193 - - 12,500 62,000 289,275
ISABELLA - 45,145 - 10,069 - - - - 11,705 - 26,450 93,369 JACKSON 49,641 40,200 - 42,840 - - - - 12,250 - 52,800 197,731
KALAMAZOO 22,500 - - 71,801 - 127,688 111,500 - - - 68,656 402,145 KENT 58,086 73,200 53,200 102,060 48,060 135,664 125,370 - 22,860 2,000 186,500 807,000
LIVINGSTON - 25,000 - - - 52,292 6,000 - 49,724 - 31,458 164,474 MACOMB 31,500 - - 32,500 - 20,000 175,691 - 230,000 - 112,850 602,541
MARQUETTE 13,500 22,890 - 10,400 - 5,200 - - 7,795 5,730 27,385 92,900 MASON 3,000 - 1,000 - 7,000 - 4,000 - 18,000 11,400 12,000 56,400
MECOSTA 22,000 - - 13,000 - - 1,000 - - 13,500 15,800 65,300 MIDLAND - - 1,000 - 15,408 - 74,252 - 15,900 3,000 26,324 135,884 MONROE - 70,950 12,000 7,150 - 12,000 45,000 - - - 35,000 182,100
MONTCALM/IONIA 47,000 26,800 - 10,000 - - 22,450 - - - 45,000 151,250 MUSKEGON 30,000 32,500 21,170 - - 37,500 15,000 - 47,500 - 64,230 247,900
NORTHERN MICHIGAN 9,000 15,000 - 20,000 10,000 5,000 5,000 - 65,000 - 39,035 168,035 NORTHWEST MICHIGAN 5,000 88,200 - 37,977 17,780 4,000 51,050 - 149,657 3,000 43,496 400,160
OAKLAND - 26,000 203,528 - - 538,816 40,000 - 275,000 169,750 214,037 1,467,131 OSCEOLA 31,800 - - 2,695 - 2,695 500 - - - 13,600 51,290 OTTAWA 70,664 - - 100,161 - - - - - - 42,245 213,070
SAGINAW - 50,000 7,000 48,285 - 44,000 30,000 - - 32,500 77,995 289,780 ST. CLAIR - 20,000 - 16,000 28,250 35,450 12,000 - 44,800 - 31,000 187,500
ST. JOSEPH - 25,000 - 32,900 20,200 - - - - - 26,000 104,100 SANILAC 36,775 - - - - - 9,050 - - - 16,000 61,825
SHIAWASSEE - 25,083 - 16,715 - - - - - - 17,800 59,598 THIRTEENTH - 10,000 - 59,811 10,000 - - - 74,040 - 26,859 180,710
THIRTY FOURTH 17,922 27,608 - 11,187 12,026 - 24,200 - 19,557 - 39,500 152,000 TWENTY SIXTH 7,500 10,000 - - 67,200 - - - 9,600 - 25,650 119,950
THUMB REGIONAL 43,000 4,000 - 24,000 - - 42,000 - 22,800 - 44,000 179,800 TRI COUNTY 76,000 8,400 - - - - - - 2,000 - 36,681 123,081 VAN BUREN 25,000 25,500 - 8,330 - - - - 12,000 27,765 21,135 119,730
WASHTENAW/ANN ARBOR - 60,000 12,000 70,327 - 67,340 64,000 - 38,500 - 61,688 373,855 WAYNE - 160,000 80,000 500,000 - 650,000 145,000 - 370,000 525,000 810,000 3,240,000
WCUP 190,500 12,000 - 23,700 - - - - - - 68,520 294,720
TOTAL AWARD AMOUNTS 1,067,667 1,026,766 462,760 1,610,478 245,924 1,801,145 1,256,996 11,000 1,783,646 856,745 2,882,835 13,005,962

30
PROBATION RESIDENTIAL SERVICES
FY 2003 Appropriation $13,685,000 FY 2003 Award of Funds $13,685,000
FY 2003 funds were awarded to support residential services pursuant to 31 local comprehensive corrections plans. The FY 2003 awards respond to program utilization patterns between local jurisdictions and create greater capabilities for local jurisdictions to purchase residential services for eligible felony offenders from a wider range of providers. On December 5, 2002, Governor John Engler signed Executive Order #2002-22 that reduced the Probation Residential Centers appropriation from $14,997,000 to $13,685,000. The order decreased the FY 2003 appropriation to support an average daily population from 956 to 872.
During FY 2003, emphases continue to be on: utilizing residential services as part of a continuum of sanctions and services (e.g., short-term residential substance abuse treatment services followed by outpatient treatment as appropriate, residential services followed by day reporting), reducing the length of stay in residence, and increasing the utilization of short-term residential services for probation violators.
It is expected an increase in utilization of Probation Residential Services will be experienced in FY 2003 and that the actual ADP will be greater than 872. The increased utilization is expected due to the following factors:
$ Changes being implemented within Wayne County will have an impact on the utilization rates of residential
services.
$ Utilization patterns among other jurisdictions are expected to continue through FY 2003.
$ The statutory guidelines will continue to produce increased demands for residential services. Specifically, offenders with guideline scores in the straddle cells and the higher end of the intermediate sanction cells are increasingly sentenced to a jail term followed by placement in a residential program.
$ Attention will continue to be focused on the utilization of residential services in response to probation
violations and eligible parole violators in accordance with the Department=s policies and procedures. The attached Table provides information regarding the past three fiscal years= data of the actual average daily population, the FY 2003 awards, and the authorized average daily population of each jurisdiction.

31
MICHIGAN DEPARTMENT OF CORRECTIONS PROBATION RESIDENTIAL SERVICES
AVERAGE DAILY POPULATION FY
1999 FY
2000 FY
2001 FY
2002 FY 2003 CCAB
ADP ADP ADP ADP AUTHORIZED ADP
AWARD AMOUNT
Allegan/Barry 4.4 3.2 6.4 5.4 6 100,253Bay 4.2 5.2 4.1 6.5 5 85,931
Berrien 12.6 18.1 18.1 30.7 27 429,651Calhoun 10.9 19.4 19.6 24.5 25 401,008
Eaton 2.0 4.3 3.2 4.5 4 57,287Genesee 68.3 81.9 86.2 81.5 70 1,102,770
Ingham/Lansing 29.0 30.6 34.2 36.0 35 544,225Isabella 0.8 1 14,322Jackson 10.7 15.5 13.5 11.5 13 200,505
Kalamazoo 88.7 82.6 84.2 70.9 71 1,117,092Kent 78.1 91.9 95.8 98.0 88 1,389,204
Livingston 9.4 4 57,287Macomb 26.1 25.9 25.8 24.6 25 401,008
Marquette 1.2 1.6 2.4 1.9 2 28,644Midland 3.8 4.1 4.3 5.0 5 71,609Monroe 4.7 10.4 16.4 18.0 16 257,791
Muskegon 26.8 40.2 30.7 35.8 38 544,225Northern Michigan 2.4 3.2 3.5 2.6 3 42,966
Northwest Michigan 5.4 8.4 8.9 9.0 8 128,896Oakland 84.9 91.2 91.0 87.1 86 1,346,477
Ottawa 5.1 3.8 3.0 4.9 3 42,966Saginaw 47.6 45.9 51.1 54.4 44 687,441St. Clair 40.0 37.3 42.7 44.1 38 601,511
St. Joseph 42.4 37.7 43.1 47.7 38 601,511Thirteenth Circuit 7.5 7.5 9.8 8.8 8 128,896
Thirty Fourth Circuit 2.8 2.5 1.8 2.2 3 42,966Twenty Sixth Circuit 3.3 4.3 4.8 5.6 5 85,931
Van Buren 8.3 4.7 10.4 8 128,896Washtenaw/Ann Arbor 22.3 39.7 25.5 22.4 21 329,399
Wayne 227.0 216.9 170.2 149.5 168 2,642,723West Central U.P. 3.4 4.3 4.2 3.1 4 71,609
PRS TOTALS 865.8 945.7 909.2 916.3 872 13,685,000
Table 4.2
32 Table 4.3
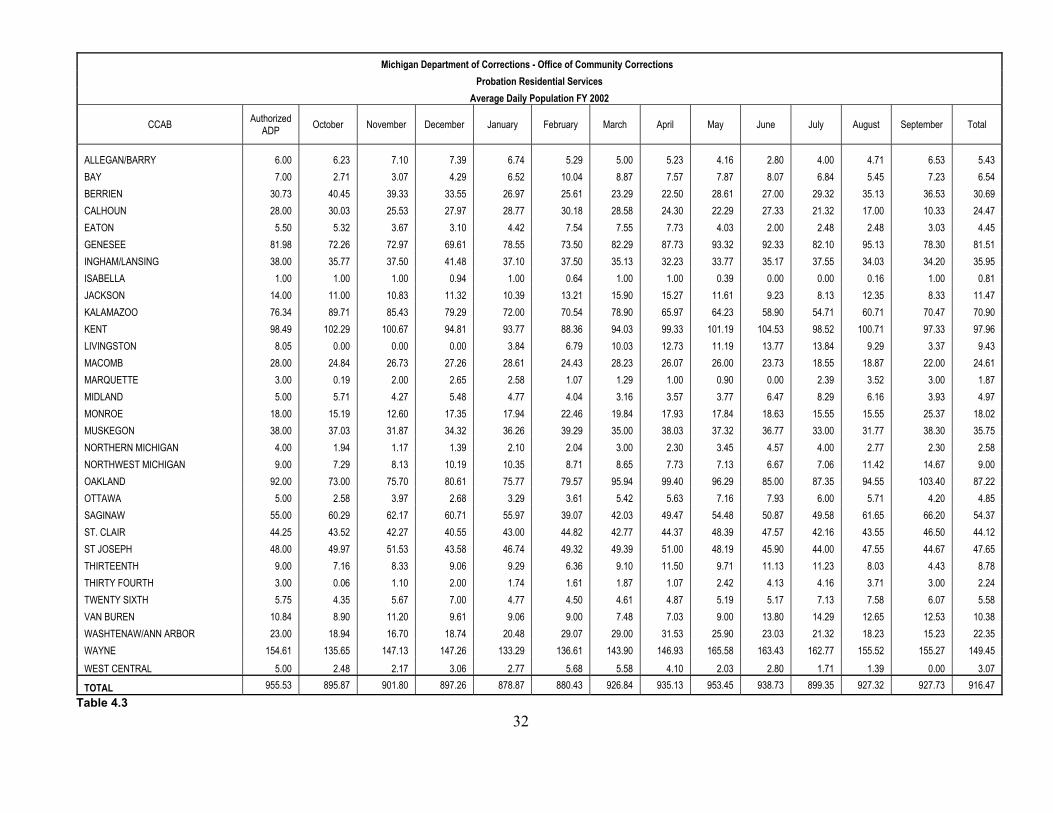
Michigan Department of Corrections - Office of Community Corrections Probation Residential Services
Average Daily Population FY 2002
CCAB Authorized ADP October November December January February March April May June July August September Total
ALLEGAN/BARRY 6.00 6.23 7.10 7.39 6.74 5.29 5.00 5.23 4.16 2.80 4.00 4.71 6.53 5.43 BAY 7.00 2.71 3.07 4.29 6.52 10.04 8.87 7.57 7.87 8.07 6.84 5.45 7.23 6.54 BERRIEN 30.73 40.45 39.33 33.55 26.97 25.61 23.29 22.50 28.61 27.00 29.32 35.13 36.53 30.69 CALHOUN 28.00 30.03 25.53 27.97 28.77 30.18 28.58 24.30 22.29 27.33 21.32 17.00 10.33 24.47 EATON 5.50 5.32 3.67 3.10 4.42 7.54 7.55 7.73 4.03 2.00 2.48 2.48 3.03 4.45 GENESEE 81.98 72.26 72.97 69.61 78.55 73.50 82.29 87.73 93.32 92.33 82.10 95.13 78.30 81.51 INGHAM/LANSING 38.00 35.77 37.50 41.48 37.10 37.50 35.13 32.23 33.77 35.17 37.55 34.03 34.20 35.95 ISABELLA 1.00 1.00 1.00 0.94 1.00 0.64 1.00 1.00 0.39 0.00 0.00 0.16 1.00 0.81 JACKSON 14.00 11.00 10.83 11.32 10.39 13.21 15.90 15.27 11.61 9.23 8.13 12.35 8.33 11.47 KALAMAZOO 76.34 89.71 85.43 79.29 72.00 70.54 78.90 65.97 64.23 58.90 54.71 60.71 70.47 70.90 KENT 98.49 102.29 100.67 94.81 93.77 88.36 94.03 99.33 101.19 104.53 98.52 100.71 97.33 97.96 LIVINGSTON 8.05 0.00 0.00 0.00 3.84 6.79 10.03 12.73 11.19 13.77 13.84 9.29 3.37 9.43 MACOMB 28.00 24.84 26.73 27.26 28.61 24.43 28.23 26.07 26.00 23.73 18.55 18.87 22.00 24.61 MARQUETTE 3.00 0.19 2.00 2.65 2.58 1.07 1.29 1.00 0.90 0.00 2.39 3.52 3.00 1.87 MIDLAND 5.00 5.71 4.27 5.48 4.77 4.04 3.16 3.57 3.77 6.47 8.29 6.16 3.93 4.97 MONROE 18.00 15.19 12.60 17.35 17.94 22.46 19.84 17.93 17.84 18.63 15.55 15.55 25.37 18.02 MUSKEGON 38.00 37.03 31.87 34.32 36.26 39.29 35.00 38.03 37.32 36.77 33.00 31.77 38.30 35.75 NORTHERN MICHIGAN 4.00 1.94 1.17 1.39 2.10 2.04 3.00 2.30 3.45 4.57 4.00 2.77 2.30 2.58 NORTHWEST MICHIGAN 9.00 7.29 8.13 10.19 10.35 8.71 8.65 7.73 7.13 6.67 7.06 11.42 14.67 9.00 OAKLAND 92.00 73.00 75.70 80.61 75.77 79.57 95.94 99.40 96.29 85.00 87.35 94.55 103.40 87.22 OTTAWA 5.00 2.58 3.97 2.68 3.29 3.61 5.42 5.63 7.16 7.93 6.00 5.71 4.20 4.85 SAGINAW 55.00 60.29 62.17 60.71 55.97 39.07 42.03 49.47 54.48 50.87 49.58 61.65 66.20 54.37 ST. CLAIR 44.25 43.52 42.27 40.55 43.00 44.82 42.77 44.37 48.39 47.57 42.16 43.55 46.50 44.12 ST JOSEPH 48.00 49.97 51.53 43.58 46.74 49.32 49.39 51.00 48.19 45.90 44.00 47.55 44.67 47.65 THIRTEENTH 9.00 7.16 8.33 9.06 9.29 6.36 9.10 11.50 9.71 11.13 11.23 8.03 4.43 8.78 THIRTY FOURTH 3.00 0.06 1.10 2.00 1.74 1.61 1.87 1.07 2.42 4.13 4.16 3.71 3.00 2.24 TWENTY SIXTH 5.75 4.35 5.67 7.00 4.77 4.50 4.61 4.87 5.19 5.17 7.13 7.58 6.07 5.58 VAN BUREN 10.84 8.90 11.20 9.61 9.06 9.00 7.48 7.03 9.00 13.80 14.29 12.65 12.53 10.38 WASHTENAW/ANN ARBOR 23.00 18.94 16.70 18.74 20.48 29.07 29.00 31.53 25.90 23.03 21.32 18.23 15.23 22.35 WAYNE 154.61 135.65 147.13 147.26 133.29 136.61 143.90 146.93 165.58 163.43 162.77 155.52 155.27 149.45 WEST CENTRAL 5.00 2.48 2.17 3.06 2.77 5.68 5.58 4.10 2.03 2.80 1.71 1.39 0.00 3.07
TOTAL 955.53 895.87 901.80 897.26 878.87 880.43 926.84 935.13 953.45 938.73 899.35 927.32 927.73 916.47

33
PART 5 DATA SYSTEMS STATUS The Office of Community Corrections is responsible for the development of two information systems: the Jail Population Information System (JPIS) and the Community Corrections Information System (CCIS). This report summarizes the status of each system. JAIL POPULATION INFORMATION SYSTEM (JPIS)
OVERVIEW
The Michigan Jail Population Information System was developed as a means to gather standardized information on jail utilization and demographics from county jails throughout the state. JPIS is the product of a cooperative effort among the Michigan Department of Corrections, Office of Community Corrections, County Jail Services Unit and the Michigan Sheriff=s Association, with assistance from Michigan State University and the National Institute of Corrections. While it was never intended that JPIS would have all the information contained at each individual reporting site, specifications called for capture of data on individual demographics, primary offense, known criminal history and information related to arrest, conviction, sentencing, and release. Mission and Concept The primary purpose of the statewide Jail Population Information System is to provide the ability to monitor and evaluate jail population characteristics for use in policy planning. As a statewide database, it is sufficiently flexible to enable the system to be compatible with existing jail management and MIS systems in each county. Originally developed as a mainframe process, the JPIS system was later rewritten to run on MDOC=s PC network, utilizing full-time bulletin board hardware to facilitate gathering monthly files and returning error reports and analytical reports. JPIS is a means to gather a subset of the information which already resides on individual jail management systems, with each county running a monthly extract process to generate a standard file. The primary approach taken was to promote the adoption, enhancement and proper use of local data systems. In turn, the local system would provide the foundation to extract the optimum of usable data for the JPIS extract, which should be viewed as a logical by-product. History and Impact The locally-centered approach taken for JPIS development has had a substantial impact on the utilization of local jail management systems throughout the state. When JPIS requirements were first implemented, over half the counties in Michigan did not have functional automated jail management systems, and objective inmate risk classification was in its infancy. Now, all the counties have automated systems, with nearly every county having transmitted electronic data files to the central JPIS system. Similarly, the JPIS requirement for standardized classification of offenders has been a major factor in the adoption of objective offender classification processes and procedures throughout the state.
34
Use of JPIS Data Currently, the monthly edit error reports returned to the counties include summaries based upon the incoming file of admissions, releases, and unreleased inmates by reported security class. These reports enhance capabilities to review each monthly submission for accuracy. Since 1998, detailed reports based upon accumulated JPIS master data have been mailed quarterly to each Sheriff=s department and CCAB. The reports cover cumulative data for the current calendar year, as well as full-year data for the preceding year. The associated tables include categories such as jail admissions and releases, length-of-stay for offenders, and average daily population for the jail. In addition, an audit response sheet is included to gather feedback on how well the reports represent the jail population. These reports provide a primary means for on-site review of JPIS statistics with the counties, to isolate and correct data problems not readily identified by routine file editing. As additional data problems are identified and resolved, the quality and confidence of the reports increase. Local Data Systems and JPIS Michigan counties employ a wide variety of electronic jail management packages which are based upon their overall size and local requirements to collect jail data. These applications include both custom-written systems and packages sold by outside vendors. On a statewide basis, it is a very dynamic environment, with regular hardware and software upgrades at individual sites - and not infrequently - switches to entirely different jail management packages. This evolving vendor landscape presents some unique data-gathering challenges, as even the most conscientious counties periodically deal with jail management software issues that disrupt both local operations and JPIS data submissions. JPIS Data Reporting Even though several counties do not have active Community Corrections Advisory Boards and do not receive community corrections funding, the counties submitting JPIS jail data accounted for nearly 90% of statewide jail beds in FY 2002. OCC has continued to provide technical support to maximize the capability to collect and aggregate local jail data on a statewide basis. By mid-2003, JPIS data reporting should account for approximately 95% of the jail beds statewide.

35
JPIS DATA SYSTEM ENHANCEMENTS The Office of Community Corrections continues to review, update and streamline the overall JPIS data reporting requirements to maximize the use of the system. Simplified data specifications were distributed to new vendors, existing vendors, and counties to reduce local demands and streamline processing. The changes to the JPIS data system required several modifications to OCC’s editing procedures, master database, and reporting formats. Although the overall number of specified data elements was substantially reduced, some vendor programming was required to achieve the advantage of the new data reporting format. Coupled with the changes being made to the JPIS data system is the migration to a new software suite in the Department of Corrections. The migration to a new software suite present additional challenges to provide uninterrupted service of incoming jail data, but will provide an opportune time to reassess the methodology and outputs in the current system. Potential changes to processing, reporting, and data transmission methods will now be examined in light of the new set of developmental tools. The efforts underway to streamline JPIS reporting are expected to contribute toward the goal of providing additional outputs to benefit both the state and local jurisdictions. The focus is upon gathering the most critical data elements from all counties, as monthly reporting is expanded, to make maximum use of the available data for analysis purposes and local feedback.
36
COMMUNITY CORRECTIONS INFORMATION SYSTEM (CCIS)
OVERVIEW Local jurisdictions submit monthly offender profile and program utilization data to OCC on all offenders enrolled in community corrections programs funded by P.A. 511 and other funding sources. Two types of data are required: (1) characteristics of offenders who have been determined P.A. 511 eligible for enrollment into programs; and (2) program participation details. The CCIS data submitted represents an extract of the data available locally for program planning and case management purposes. OCC uses the data to examine the profiles of offenders in programs, monitor utilization, and evaluate the various CCAB goals and objectives specific to program utilization. Data is submitted via e-mail, however, floppy-disk submissions are permitted if circumstances so require. Data files are edited upon receipt, and error reports are returned if the data does not meet basic format and/or content requirements. When data meets editing requirements, a feedback report is provided to the CCAB to verify the accuracy of the data. CCIS ENHANCEMENTS An updated report on CCIS data includes financial data so program utilization can be directly viewed in comparison to program expenses. Available at the CCAB level, the report identifies the budget and year-to-date information on expenses, new enrollments, average lengths of stay of successful and failed completions, and average enrollment levels for each P.A. 511 funded program. The CCIS edit enhancement detailed above is part of OCC=s ongoing commitment to provide feedback to local entities and OCC staff, toward the goal to increase the ability to actively monitor local program activity and examine various elements of services to priority populations.
37
Impact of System Enhancements As changes and improvements to corrections-related data systems continue to be refined, the overall ability to monitor prison commitments, jail utilization and program utilization by priority target groups of offenders continues to improve. Areas in which data system enhancements have impact include: 1. Improvement to the timeliness and availability of felony disposition data.
The use of a data export process developed to provide CCABs with felony disposition data directly generated from the MDOC’s master data-gathering system, OMNI, is operational in the Field Operations Administration Region I and Region II offices, and has been initiated in Region III.
The readily accessible and improved timeliness of felony disposition data obtained from OMNI, and enhanced data on sentencing guideline scores, should improve the analytical and reporting capabilities at the local level. As a result, the accuracy of CCIS data should be improved as well.
2. An expanded capability to identify target groups in jails and link to other data sources.
A redesign of the Jail Population Information System is aimed at streamlining the process, while improving the ability to identify target populations among sentenced and unsentenced felons. Over time, the adoption of the JPIS enhancements by software vendors and local jails will provide an expanding capability to link felony disposition data to jail population data.
3. Improved recognition of any data reporting problems.
Expanded editing and feedback routines in the JPIS and CCIS systems should simplify the process to monitor data content and isolate problems in vendor software or local data collection practices which may adversely impact data quality. Expanded feedback on individual file submissions will enable local entities to promptly identify and address potential problems.