Embed Size (px)
Citation preview

District of Columbia
Department of Corrections
DC Department of Corrections
Facts and Figures
October 2017

District of Columbia
Department of Corrections
DC Department of Corrections Operating Budget
and Net Expenditure
The Department of Corrections provides housing, security, and inmate services
at the DOC facilities for some inmates under Federal jurisdiction and is
reimbursed for such services.
FY 2017 data reflects revised budget and estimated expenditures.
Budget information and narratives can be accessed at: http://cfo.dc.gov June 2017

District of Columbia
Department of Corrections
FY 2017 Budget by Service
June 2017

District of Columbia
Department of Corrections
Department Of Corrections Full Time Employees
June 2017
FY 2017 FTE Distribution by Grade

District of Columbia
Department of Corrections
October 2017
The Department of Corrections facilities include the Correctional Treatment Facility
and the Central Detention Facility. DOC also contracts out for a limited number of Half
Way House bed spaces in the Community.
Average Daily Population by Fiscal Year
DC Department of Corrections (DOC) Total
and Central Detention Facility (CDF)
2589
2311
2041
1628 1748
1998 1945
1718
1490
1150 1252
1349
0
500
1000
1500
2000
2500
3000
FY 2012 FY 2013 FY 2014 FY 2015 FY 2016 FY 2017
DOC CDF

District of Columbia
Department of Corrections
October 2017
Average Daily Population by Calendar Year
DC Department of Corrections (DOC) Total
and Central Detention Facility (CDF)
The Department of Corrections facilities include the Correctional Treatment Facility
and the Central Detention Facility. DOC also contracts out for a limited number of Half
Way House bed spaces in the Community.
2589
2311
2041
1628 1781
2048 1945
1718
1490
1150 1263 1362
0
500
1000
1500
2000
2500
3000
2012 2013 2014 2015 2016 2017
DOC CDF

District of Columbia
Department of Corrections
October 2017
Average Daily Population FY 2017
by Sex and Facility
DOC System Central Detention Facility
Contract Halfway Houses Correctional Treatment Facility
Juveniles are physically housed at the CTF but counted at the CDF.
33
9
0
5
10
15
20
25
30
35
Hope Village Fairview
1830
147 21
0200400600800
100012001400160018002000
Males Females Juveniles
1330
21
0
200
400
600
800
1000
1200
1400
Males Juveniles
467
138
050
100150200250300350400450500
Males Females

District of Columbia
Department of Corrections
October 2017
Average Daily Population CY 2017
by Sex and Facility
DOC System Central Detention Facility
Contract Halfway Houses Correctional Treatment Facility
Juveniles are physically housed at the CTF but counted at the CDF.
1365
20
0
200
400
600
800
1000
1200
1400
1600
Males Juveniles
1873
147 20
0
500
1000
1500
2000
Males Females Juveniles
496
147
0
100
200
300
400
500
600
Males Females
32
8
0
5
10
15
20
25
30
35
Hope Village Fairview
District of Columbia
Department of Corrections
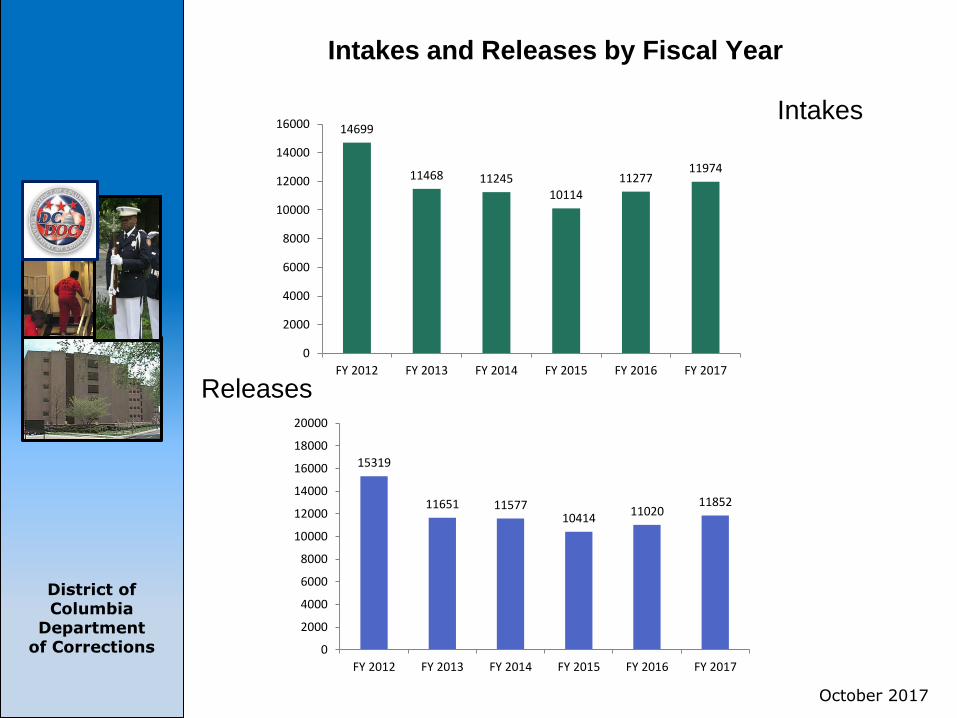
Intakes and Releases by Fiscal Year
Releases
October 2017
Intakes
15319
11651 11577 10414
11020 11852
0
2000
4000
6000
8000
10000
12000
14000
16000
18000
20000
FY 2012 FY 2013 FY 2014 FY 2015 FY 2016 FY 2017
14699
11468 11245 10114
11277 11974
0
2000
4000
6000
8000
10000
12000
14000
16000
FY 2012 FY 2013 FY 2014 FY 2015 FY 2016 FY 2017

District of Columbia
Department of Corrections
Intakes and Releases by Calendar Year
Releases
October 2017
Intakes
14082
12334
10603 10521 11560
9225
0
2000
4000
6000
8000
10000
12000
14000
16000
2012 2013 2014 2015 2016 2017
14453
12976
11007 10104
11000
9055
0
2000
4000
6000
8000
10000
12000
14000
16000
18000
20000
2012 2013 2014 2015 2016 2017

July 2016 – June 2017 Intakes by Ward
.
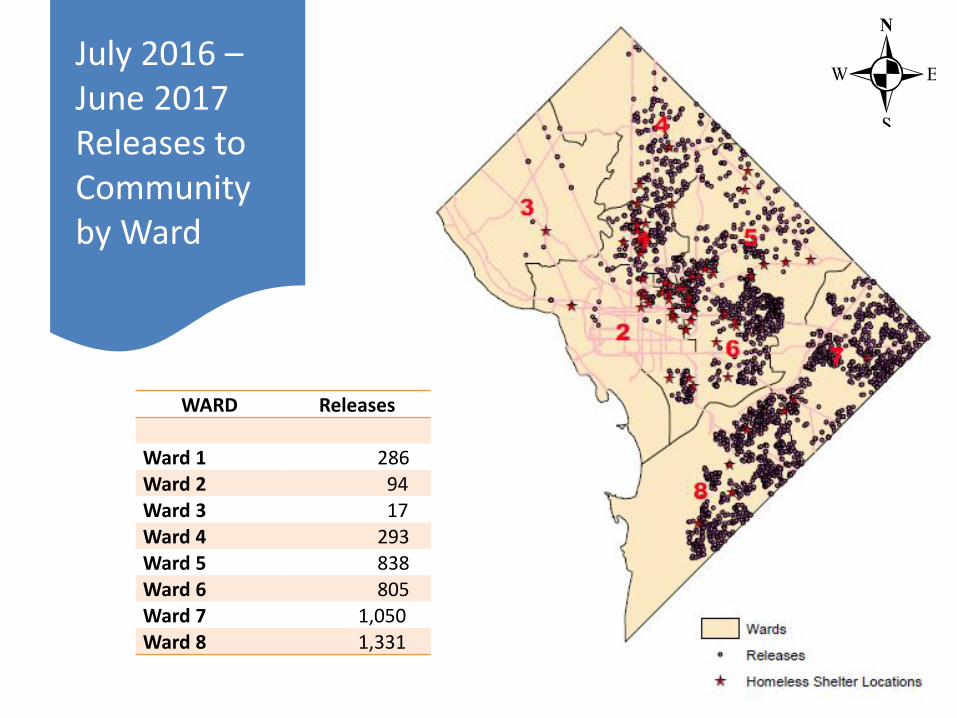
July 2016 – June 2017 Releases to Community by Ward
WARD Releases
Ward 1 286 Ward 2 94 Ward 3 17 Ward 4 293 Ward 5 838 Ward 6 805 Ward 7 1,050 Ward 8 1,331
.

District of Columbia
Department of Corrections
DC Inmates by Census Tract of Residence – June 30, 2017
June 2017

District of Columbia
Department of Corrections
October 2017
Age Distribution of Male Inmates
Inmates by Sex
The median age of male inmates is 32.4 years.
The median age for all DOC inmates is 32.7 years.
8%
92%
0%
20%
40%
60%
80%
100%
Females Males
Under 21 6.5%
21 - 30 39.0%
31 - 40 26.2%
41 - 50 14.4%
51 - 60 11.0%
Over 61 2.8%
District of Columbia
Department of Corrections
October 2017
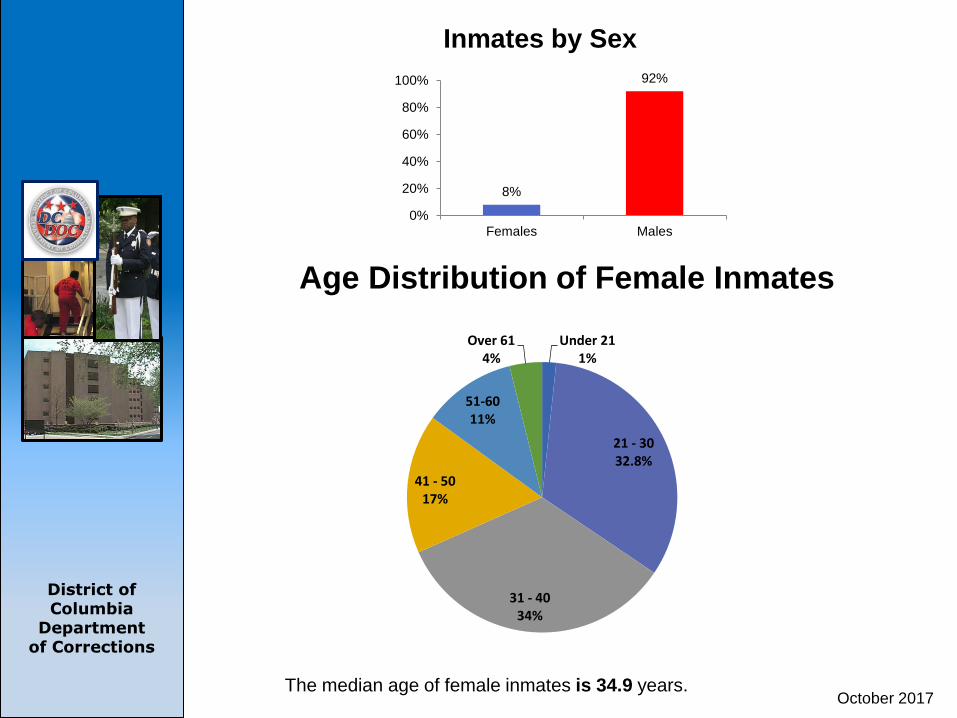
Inmates by Sex
The median age of female inmates is 34.9 years.
Age Distribution of Female Inmates
8%
92%
0%
20%
40%
60%
80%
100%
Females Males
Under 21 1%
21 - 30 32.8%
31 - 40 34%
41 - 50 17%
51-60 11%
Over 61 4%

District of Columbia
Department of Corrections
October 2017
Inmate Population by Race
The category “Other” includes Native Americans and those who have declared their
race as Other or not declared a race. Blacks are overrepresented compared to the DC
population which is 48.3% Black. Whites, Hispanics, and Asians are under-represented
compared to the DC population which is 36.1% White, 10.6% Hispanic, 4% Asian and
0.8% Other. DC Population Data from www.census.gov .
Asian 0%
Black 89%
Hispanic 5%
Other 3%
White 3%

District of Columbia
Department of Corrections
October 2017
Self Declared Education Levels for Male Inmates
60.9 % of men in custody report having at least a GED or HS Diploma. All data is self reported by male inmates in DOC custody.
3.9%
26.2%
35.0%
28.0%
7.0%
0.0%
5.0%
10.0%
15.0%
20.0%
25.0%
30.0%
35.0%
40.0%
College G.E.D. High School Neither GED norHigh School
Not Declared

District of Columbia
Department of Corrections
October 2017
Self Declared Education Levels for Female Inmates
58.3% of women in custody report having at least a GED or HS Diploma. All data is self reported by female inmates in DOC custody.
6.7% 7.8%
50.6%
16.1% 18.9%
0.0%
10.0%
20.0%
30.0%
40.0%
50.0%
60.0%
College G.E.D. High School Neither GED norHigh School
Not Declared

District of Columbia
Department of Corrections
Religious Affiliation of Intakes FY 2017
All data is self reported by intakes to DOC custody between October 1, 2016 and September 30, 2017. The category “Other Major Religions” includes other faiths such as Jewish, Buddhist, Hindu and Rastafarian which occur infrequently among intakes.
October 2017
1.1%
44.5%
22.0% 20.0%
7.1% 5.3%
0.0%
5.0%
10.0%
15.0%
20.0%
25.0%
30.0%
35.0%
40.0%
45.0%
50.0%

District of Columbia
Department of Corrections
October 2017
Percent of Male Inmates in Custody by Legal Status and Average Length of Stay in Days
•Pretrial means at least one unresolved legal matter exists and no sentences are being served.
•Sentenced indicates the inmate is serving at least one sentence.
•Felon indicates the most serious offense requiring detention is a felony.
•Misdemeanant indicates that the individual has no felony offenses requiring detention.
•Parole Violator indicates an individual whose violated conditions of parole, probation or release.
•Writ/Hold individuals may have other charges (typically in transit, fugitive) requiring legal
resolution. Only 4% of all inmates are detained solely on a writ.
Overall Average LOS for all Male Inmates = 159 days
0.6%
50.7%
4.7%
18.9% 11.4%
10.3%
3.4%
140
209
28
129
229
87
293
0
50
100
150
200
250
300
350
0.0%
10.0%
20.0%
30.0%
40.0%
50.0%
60.0%
OT PF PM PV SF SM WH
Inmates Averale LOS

District of Columbia
Department of Corrections
October 2017
Percent of Female Inmates in Custody by Legal Status and Average Length of Stay in Days
•Pretrial means at least one unresolved legal matter exists and no sentences are being served.
•Sentenced indicates the inmate is serving at least one sentence.
•Felon indicates the most serious offense requiring detention is a felony.
•Misdemeanant indicates that the individual has no felony offenses requiring detention.
•Parole Violator indicates an individual whose violated conditions of parole, probation or release.
•Writ/Hold individuals may have other charges (typically in transit, fugitive) requiring legal
resolution. Only 4% of all inmates are detained solely on a writ.
Overall Average LOS for all Female Inmates = 92 days
39.4%
17.2% 14.4%
11.1%
16.7%
1.1%
106
23
85
108
42
186
0
20
40
60
80
100
120
140
160
180
200
0.0%
5.0%
10.0%
15.0%
20.0%
25.0%
30.0%
35.0%
40.0%
45.0%
PF PM PV SF SM WH
Inmates Average LOS

District of Columbia
Department of Corrections
October 2017
Offenses by Most Serious Active Charge
Male Inmates
Approximately 37% of male inmates are incarcerated on violent or dangerous
offenses (per DC Code 22 Section 4501).
Other 2.4%
Assault\DV 13.4%
Failure to Appear 3.5%
Burglary/Robbery/ Carjacking
7.3%
Homicide/Conspiracy 6.9%
White Collar Crimes 1.2%
Crimes against Persons 0.7%
Drug Offenses 8.1%
Traffic/DUI 2.3%
Escape 0.4%
Fraud 0.0% Fugitive
2.2%
Property Crimes 7.4%
Parole/Release Violations
11.0%
Public Order 0.7%
Rape/Sex Abuse 2.6%
Writ/US Witness 2.9%
USMS/USDC 20.3%
Weapons 6.6%
District of Columbia
Department of Corrections
October 2017
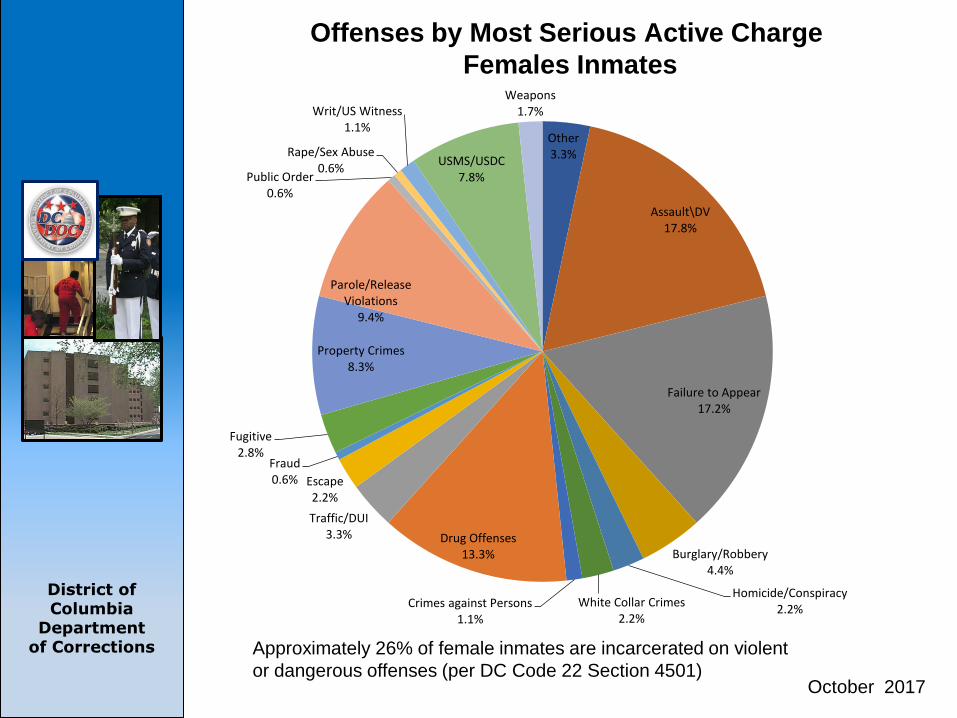
Offenses by Most Serious Active Charge
Females Inmates
Approximately 26% of female inmates are incarcerated on violent
or dangerous offenses (per DC Code 22 Section 4501)
Other 3.3%
Assault\DV 17.8%
Failure to Appear 17.2%
Burglary/Robbery 4.4%
Homicide/Conspiracy 2.2%
White Collar Crimes 2.2%
Crimes against Persons 1.1%
Drug Offenses 13.3%
Traffic/DUI 3.3%
Escape 2.2%
Fraud 0.6%
Fugitive 2.8%
Property Crimes 8.3%
Parole/Release Violations
9.4%
Public Order 0.6%
Rape/Sex Abuse 0.6%
Writ/US Witness 1.1%
USMS/USDC 7.8%
Weapons 1.7%

District of Columbia
Department of Corrections
October 2017
Length of Stay Distribution for Inmates in Custody
Male Inmates
Female Inmates
The median LOS
for males in
custody is 93.4
days.
The median LOS
for females in
custody is 48.4
days.
5.0%
35.0%
32.8%
17.8%
6.1%
2.2%
1.1%
0.0% 5.0% 10.0% 15.0% 20.0% 25.0% 30.0% 35.0% 40.0%
Less than 3 days
3 - 31 days
31 - 91 days
3 - 6 months
6 - 9 months
9 - 12 months
More than 1 year
3.4%
20.0%
26.1%
22.4%
9.6%
5.7%
12.9%
0.0% 5.0% 10.0% 15.0% 20.0% 25.0% 30.0%
Less than 3 days
3 - 31 days
31 - 91 days
3 - 6 months
6 - 9 months
9 - 12 months
More than 1 year

District of Columbia
Department of Corrections
October 2017
FY 2017 Releases by Length of Stay
The median length of stay for
released female inmates in FY
2017 was 14 days; 69 % of
female inmates released
stayed fewer than 31 days.
Female Inmates
Male Inmates The median length of stay for
released male inmates in FY
2017 was 20 days; 58% of male
inmates released stayed fewer
than 31 days.
42.7%
26.1%
17.8%
9.2%
2.7%
0.7%
0.7%
0.0% 10.0% 20.0% 30.0% 40.0% 50.0%
1 wk or less
1 wk to 1 mo
1 to 3 mo
3 to 6 mo
6 to 9 mo
9 to 12 mo
more than 1 yr
38.6%
19.7%
19.0%
12.0%
4.9%
3.3%
2.5%
0.0% 10.0% 20.0% 30.0% 40.0% 50.0%
1 wk or less
1 wk to 1 mo
1 to 3 mo
3 to 6 mo
6 to 9 mo
9 to 12 mo
more than 1 yr

District of Columbia
Department of Corrections
CY 2017 Releases by Length of Stay
The median length of stay for
released female inmates in CY
2017 was 12 days; 69% of
female inmates released
stayed fewer than 31 days.
Female Inmates
Male Inmates The median length of stay for
released male inmates in CY
2017 was 18 days; 59% of male
inmates released stayed fewer
than 31 days.
October 2017
43.0%
25.7%
19.0%
8.2%
2.5%
0.7%
0.8%
0.0% 10.0% 20.0% 30.0% 40.0% 50.0%
1 wk or less
1 wk to 1 mo
1 to 3 mo
3 to 6 mo
6 to 9 mo
9 to 12 mo
more than 1 yr
39.1%
20.0%
18.8%
11.5%
5.0%
3.1%
2.5%
0.0% 10.0% 20.0% 30.0% 40.0% 50.0%
1 wk or less
1 wk to 1 mo
1 to 3 mo
3 to 6 mo
6 to 9 mo
9 to 12 mo
more than 1 yr

District of Columbia
Department of Corrections
CY 2017 Releases by Length of Stay
The median length of stay for
released female inmates in CY
2017 was 11 days; 73% of
female inmates released
stayed fewer than 31 days.
Female Inmates
Male Inmates The median length of stay for
released male inmates in CY
2017 was 20 days; 60% of male
inmates released stayed fewer
than 31 days.
October 2017
41.0%
18.9%
18%
11%
6%
3%
2%
0.0% 10.0% 20.0% 30.0% 40.0% 50.0%
1 week or less
1 week to 1 month
1 to 3 months
3 to 6 months
6 to 9 months
9 to 12 months
more than 1 year
48.0%
25.0%
17%
6%
3%
0%
1%
0.0% 10.0% 20.0% 30.0% 40.0% 50.0%
1 wk or less
1 wk to 1 mo
1 to 3 mo
3 to 6 mo
6 to 9 mo
9 to 12 mo
more than 1 yr

District of Columbia
Department of Corrections
79.9%
14.8%
5.4%
0.0%
10.0%
20.0%
30.0%
40.0%
50.0%
60.0%
70.0%
80.0%
90.0%
1 time 2 times 3 or more
1 Year Re-Incarceration Rate
FY 2016 Releases
by Frequency of Release FY 2016
October 2016
The FY 2016 one year re-incarceration rate was 20.2% for all inmates, this is 1%
higher than the one year re-incarceration rate in FY 2015 and 2% higher than in
FY 2010. Non-federal inmates who are re-incarcerated have a significantly higher
incidence of mental illness, but are similar to federal offenders who are re-
incarcerated in most other attributes.
Re-Incarcerated
Offenders
Re-Incarcerated
Offenders