Embed Size (px)
Citation preview

MetLife Stable Value & Institutional Products Client Conference
June 19, 2008
MetLife Stable Value & Institutional Products Client Conference
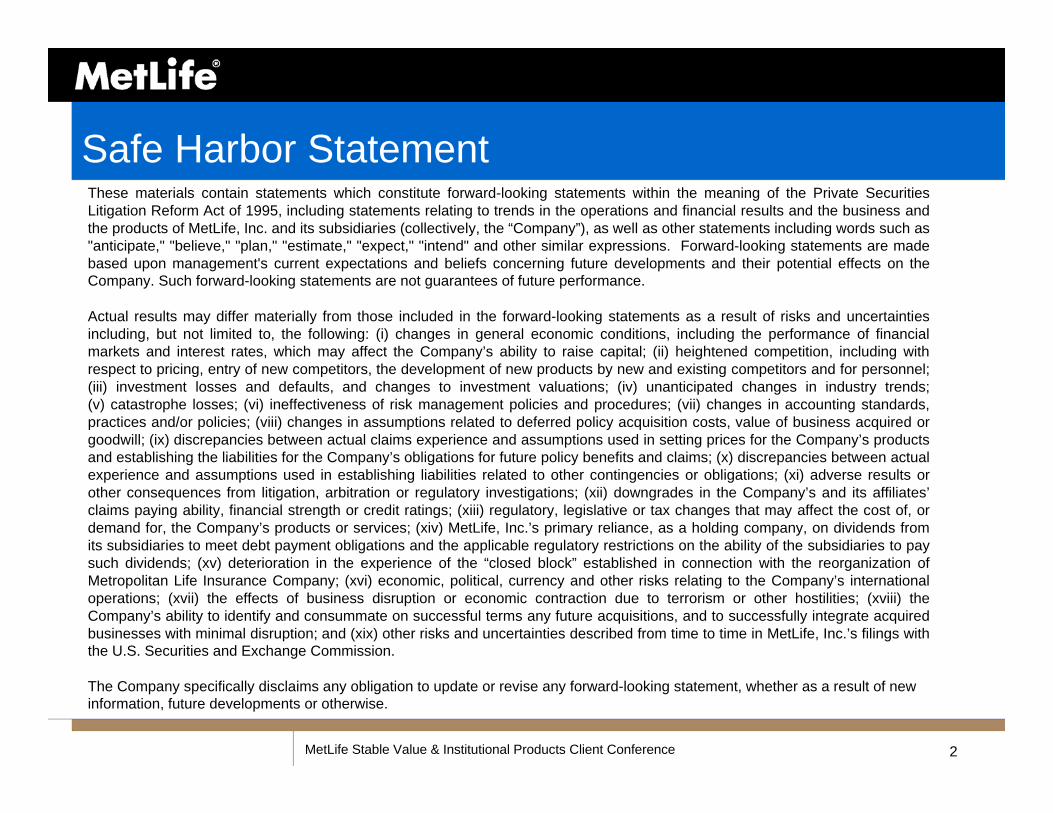
Safe Harbor StatementThese materials contain statements which constitute forward-looking statements within the meaning of the Private Securities Litigation Reform Act of 1995, including statements relating to trends in the operations and financial results and the business and the products of MetLife, Inc. and its subsidiaries (collectively, the “Company”), as well as other statements including words such as "anticipate," "believe," "plan," "estimate," "expect," "intend" and other similar expressions. Forward-looking statements are made based upon management's current expectations and beliefs concerning future developments and their potential effects on the Company. Such forward-looking statements are not guarantees of future performance.
Actual results may differ materially from those included in the forward-looking statements as a result of risks and uncertainties including, but not limited to, the following: (i) changes in general economic conditions, including the performance of financial markets and interest rates, which may affect the Company’s ability to raise capital; (ii) heightened competition, including with respect to pricing, entry of new competitors, the development of new products by new and existing competitors and for personnel;(iii) investment losses and defaults, and changes to investment valuations; (iv) unanticipated changes in industry trends; (v) catastrophe losses; (vi) ineffectiveness of risk management policies and procedures; (vii) changes in accounting standards, practices and/or policies; (viii) changes in assumptions related to deferred policy acquisition costs, value of business acquired or goodwill; (ix) discrepancies between actual claims experience and assumptions used in setting prices for the Company’s products and establishing the liabilities for the Company’s obligations for future policy benefits and claims; (x) discrepancies between actual experience and assumptions used in establishing liabilities related to other contingencies or obligations; (xi) adverse results or other consequences from litigation, arbitration or regulatory investigations; (xii) downgrades in the Company’s and its affiliates’claims paying ability, financial strength or credit ratings; (xiii) regulatory, legislative or tax changes that may affect the cost of, or demand for, the Company’s products or services; (xiv) MetLife, Inc.’s primary reliance, as a holding company, on dividends from its subsidiaries to meet debt payment obligations and the applicable regulatory restrictions on the ability of the subsidiaries to pay such dividends; (xv) deterioration in the experience of the “closed block” established in connection with the reorganization of Metropolitan Life Insurance Company; (xvi) economic, political, currency and other risks relating to the Company’s international operations; (xvii) the effects of business disruption or economic contraction due to terrorism or other hostilities; (xviii) the Company’s ability to identify and consummate on successful terms any future acquisitions, and to successfully integrate acquired businesses with minimal disruption; and (xix) other risks and uncertainties described from time to time in MetLife, Inc.’s filings with the U.S. Securities and Exchange Commission.
The Company specifically disclaims any obligation to update or revise any forward-looking statement, whether as a result of new information, future developments or otherwise.
2
MetLife Stable Value & Institutional Products Client Conference
Explanatory Note on Non-GAAP Financial Information
The historical and forward-looking financial information presented at this conference and contained in these presentations include performance measures which are based on methodologies other than Generally Accepted Accounting Principles (“GAAP”). MetLife analyzes its performance using so-called non-GAAP measures, including operating earnings, operating earnings available to common shareholders, operating earnings available to common shareholders per diluted common share and operating return on common equity. MetLife believes these measures enhance the understanding and comparability of its performance by excluding net investment gains and losses, net of income tax, and adjustments related to net investment gains and losses, net of income tax, both of which can fluctuate significantly from period to period, the impact of the cumulative effect of a change in accounting, net of income tax, and discontinued operations other than discontinued real estate, net of income tax, thereby highlighting the results from operations and the underlying profitability drivers of the business.
Operating earnings is defined as GAAP net income, excluding net investment gains and losses, net of income tax, adjustments related to net investment gains and losses, net of income tax, the impact of the cumulative effect of a change in accounting, net of income tax, and discontinued operations other than discontinued real estate, net of income tax. Scheduled settlement payments on derivative instruments not qualifying for hedge accounting treatment are included in operating earnings.
Operating earnings available to common shareholders is defined as operating earnings less preferred stock dividends, which are recorded in Corporate & Other. All references in these slides and in the presentations made at this conference to “operating earnings” for 2005 and future years should be read as references to “operating earnings available to common shareholders.”
Operating earnings available to common shareholders per diluted common share is calculated by dividing operating earnings available to common shareholders (as defined above) by the number of weighted average diluted common shares outstanding for the period indicated. All references in these slides and in the presentations made at this conference to “operating earnings per share” for 2005 and future years should be read as references to “operating earnings available to common shareholders per diluted common share.”
3

MetLife Stable Value & Institutional Products Client Conference
Explanatory Note on Non-GAAP Financial Information(Continued)Operating return on common equity is calculated by dividing operating earnings available to common shareholders (as defined above) by average common equity for the period indicated, excluding accumulated other comprehensive income.
For the historical periods presented, reconciliations of non-GAAP measures used in the presentations made at this conference to the most directly comparable GAAP measures are included in the Appendix to the presentation materials and are available on the Investor Relations portion of the Company’s website (www.metlife.com). Additional information about MetLife’s historical financial results is available in the Company’s Quarterly Financial Supplements which may be accessed through the Investor Relations portion of the Company’s website. The non-GAAP measures used in the presentations made at this conference should not be viewed as substitutes for the most directly comparable GAAP measures.
In the presentations made at this conference, MetLife provides guidance on its future earnings, earnings per share and return on common equity on an operating, non-GAAP basis. A reconciliation of these measures to the most directly comparable GAAP measures is not accessible on a forward-looking basis because MetLife believes it is not possible to provide a reliable forecast of net investment gains and losses, which can fluctuate significantly from period to period and may have a significant impact on GAAP net income.
4

MetLife Stable Value & Institutional Products Client Conference
Conference Objectives
• Overview of MetLife’s Institutional Business
• Review of MetLife’s financial strength and performance
• Dialogue with Senior Officers of MetLife
5

MetLife Stable Value & Institutional Products Client Conference
Agenda
Time Topic Presenter
8:30 - 9:00 a.m. Registration & Breakfast
9:00 - 9:10 a.m. Welcome & Introductory Remarks Gregory P. Falzon
9:10 - 9:55 a.m. MetLife Financial Overview William J. Wheeler
9:55 - 10:20 a.m. Corporate Benefit Funding Businesses Robin F. Lenna
10:20 - 10:40 a.m. Capital Markets: Funding Agreement- Thomas E. Lenihan
Backed Programs
10:40 - 10:55 a.m. Break
10:55 - 11:20 a.m. Investments Overview Robert W. Morgan
11:20 - 11:50 p.m. MetLife Institutional Business William J. Mullaney
12:00 - 1:00 p.m. Lunch
6

MetLife Stable Value & Institutional Products Client Conference
MetLife Financial Overview
William J. Wheeler
Executive Vice President & Chief Financial OfficerMetLife Stable Value & Institutional Products Client Conference
MetLife Stable Value & Institutional Products Client Conference
AgendaFirst Quarter 2008 Financial OverviewCurrent Financial Strength RatingsRGA split-off
2

MetLife Stable Value & Institutional Products Client Conference
First Quarter 2008 Financial OverviewThree Months Ended March 31,
2007 2008 % Change
Premiums, Fees & Other Revenues $8,429 $9,400 11.5%
Operating Earnings Available to Common Shareholders per Diluted Common Share
$1.41 $1.52 7.8%
Net Income Available to Common Shareholders per Diluted Common Share
$1.28 $0.84 (34.4%)
Book Value per Common Share* (actual common shares outstanding)
$41.32 $45.09 9.1%
Operating Return on Common Equity** 14.1% 13.9%
See Appendix for non-GAAP financial information definitions and/or reconciliations.
* Excluding AOCI
($ millions, except per share and book value data)
** Operating Return on Common Equity is calculated by dividing annualized 1Q earnings by average adjusted 1Q equity.
3
MetLife Stable Value & Institutional Products Client Conference
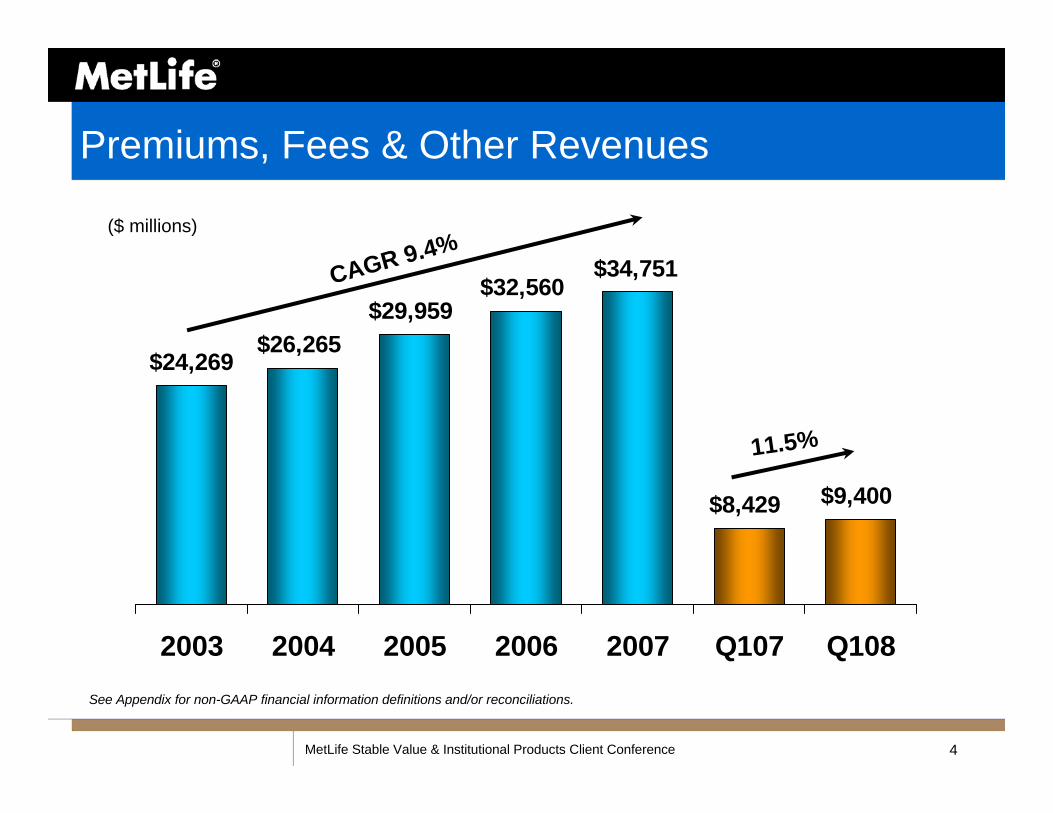
$24,269$26,265
$29,959$32,560
$9,400$8,429
$34,751
2003 2004 2005 2006 2007 Q107 Q108
CAGR 9.4%($ millions)
11.5%
Premiums, Fees & Other Revenues
See Appendix for non-GAAP financial information definitions and/or reconciliations.
4
MetLife Stable Value & Institutional Products Client Conference
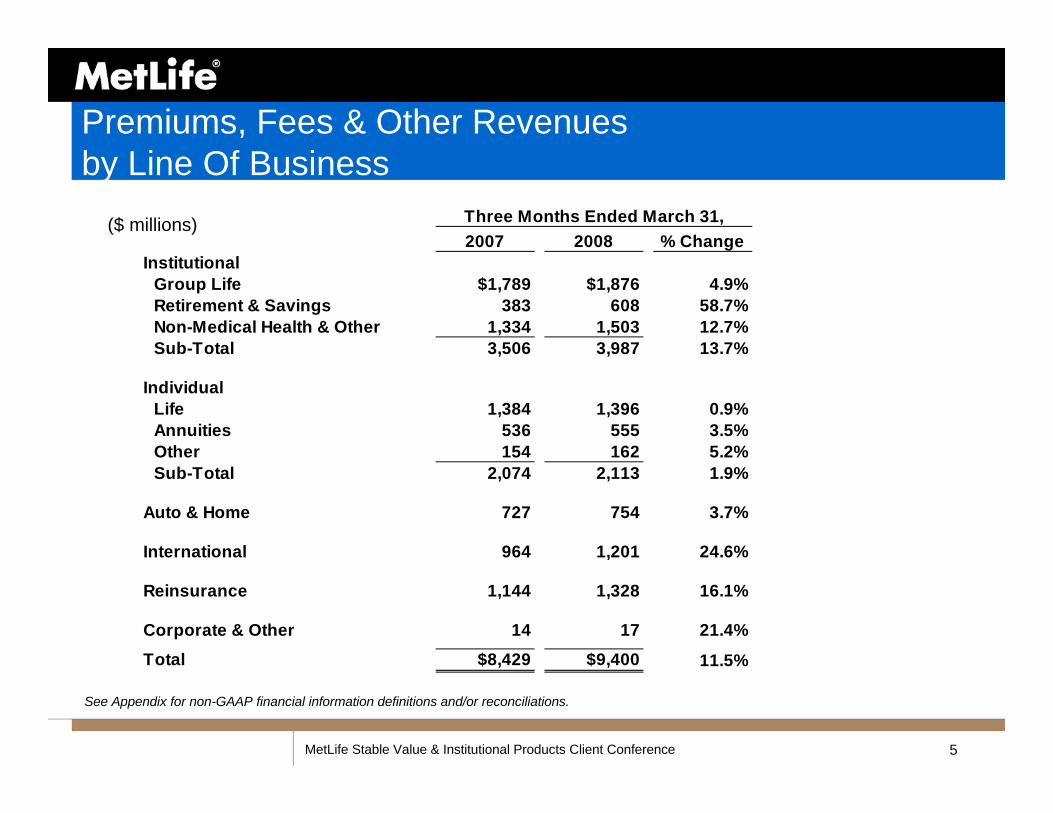
Premiums, Fees & Other Revenuesby Line Of Business
Three Months Ended March 31,2007 2008 % Change
InstitutionalGroup Life $1,789 $1,876 4.9%Retirement & Savings 383 608 58.7%Non-Medical Health & Other 1,334 1,503 12.7%Sub-Total 3,506 3,987 13.7%
IndividualLife 1,384 1,396 0.9%Annuities 536 555 3.5%Other 154 162 5.2%Sub-Total 2,074 2,113 1.9%
Auto & Home 727 754 3.7%
International 964 1,201 24.6%
Reinsurance 1,144 1,328 16.1%
Corporate & Other 14 17 21.4%
Total $8,429 $9,400 11.5%
($ millions)
See Appendix for non-GAAP financial information definitions and/or reconciliations.
5
MetLife Stable Value & Institutional Products Client Conference
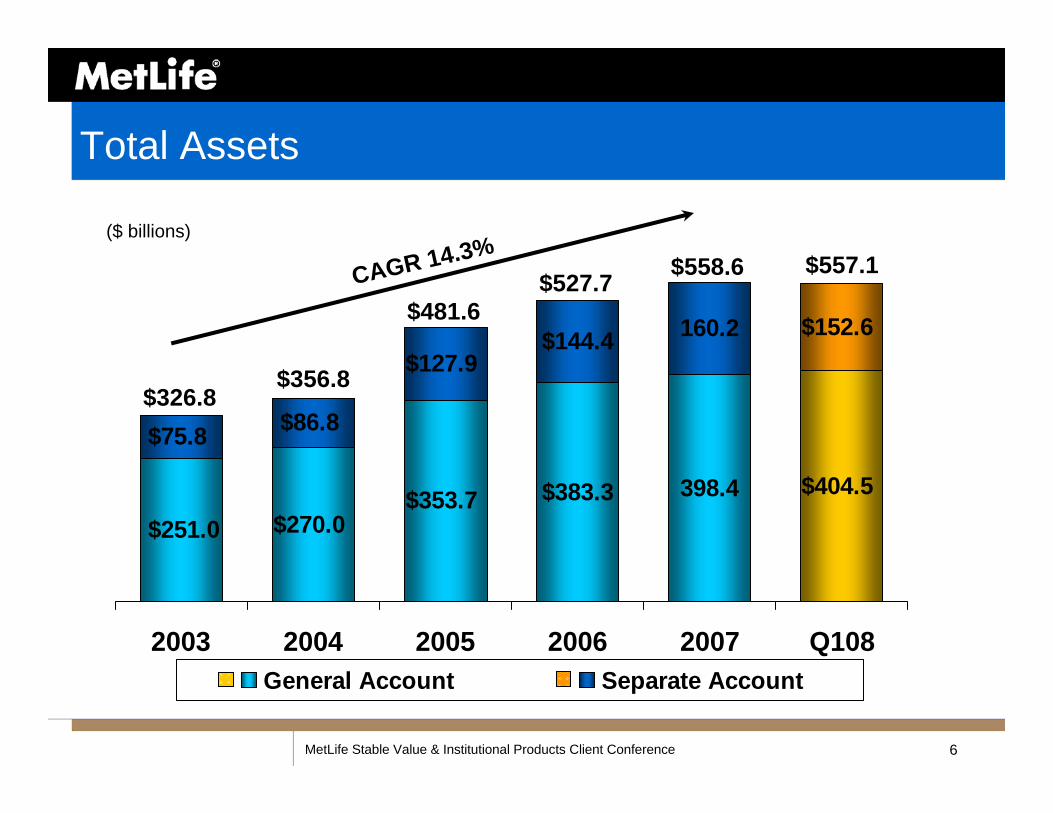
Total Assets
$404.5
$75.8 $86.8
$127.9$152.6
$383.3 $353.7$270.0$251.0
398.4
$144.4 160.2
2003 2004 2005 2006 2007 Q108General Account Separate Account
($ billions)
CAGR 14.3%
$326.8$356.8
$527.7$481.6
$557.1$558.6
6
MetLife Stable Value & Institutional Products Client Conference
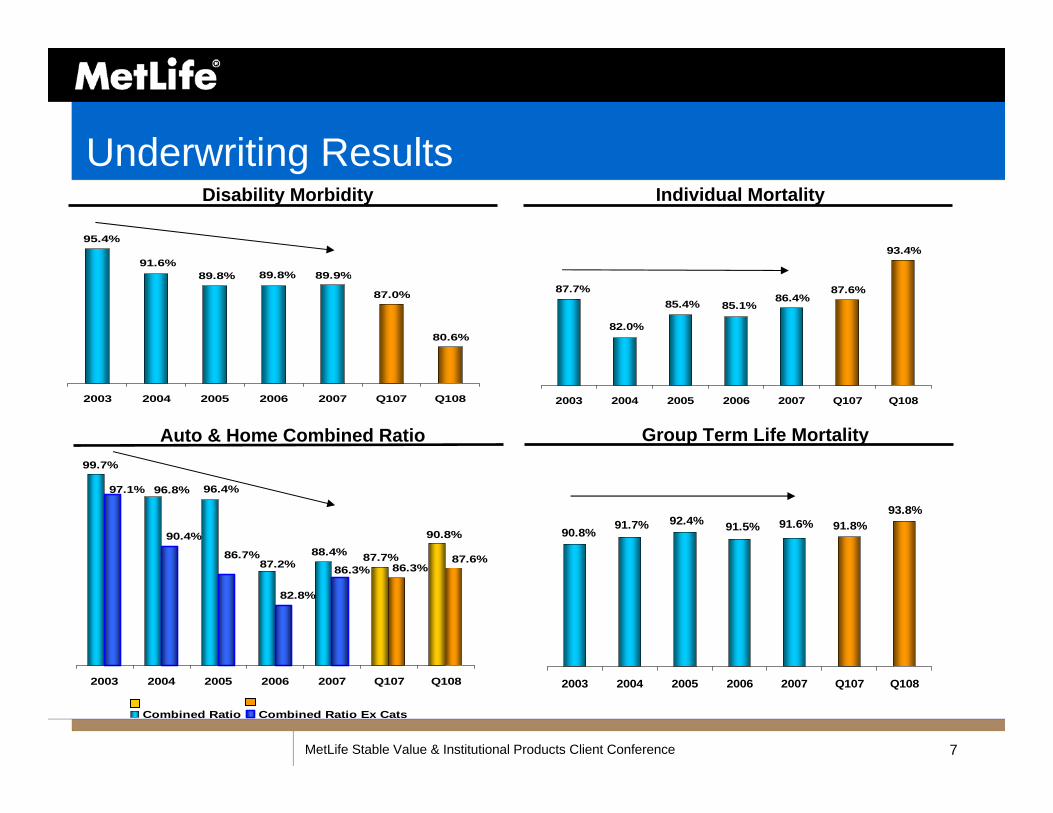
Underwriting Results
87.6%
93.4%
82.0%
85.4% 85.1%86.4%
87.7%
2003 2004 2005 2006 2007 Q107 Q108
87.7%
90.8%
99.7%
87.2%
96.4%96.8%
88.4%87.6%
82.8%
86.7%
90.4%
97.1%
86.3%86.3%
2003 2004 2005 2006 2007 Q107 Q108
Combined Ratio Combined Ratio Ex Cats
91.8%93.8%
91.7% 92.4% 91.5% 91.6%90.8%
2003 2004 2005 2006 2007 Q107 Q108
Individual MortalityDisability Morbidity
Group Term Life MortalityAuto & Home Combined Ratio
87.0%
80.6%
91.6%89.8% 89.8% 89.9%
95.4%
2003 2004 2005 2006 2007 Q107 Q108
7
MetLife Stable Value & Institutional Products Client Conference
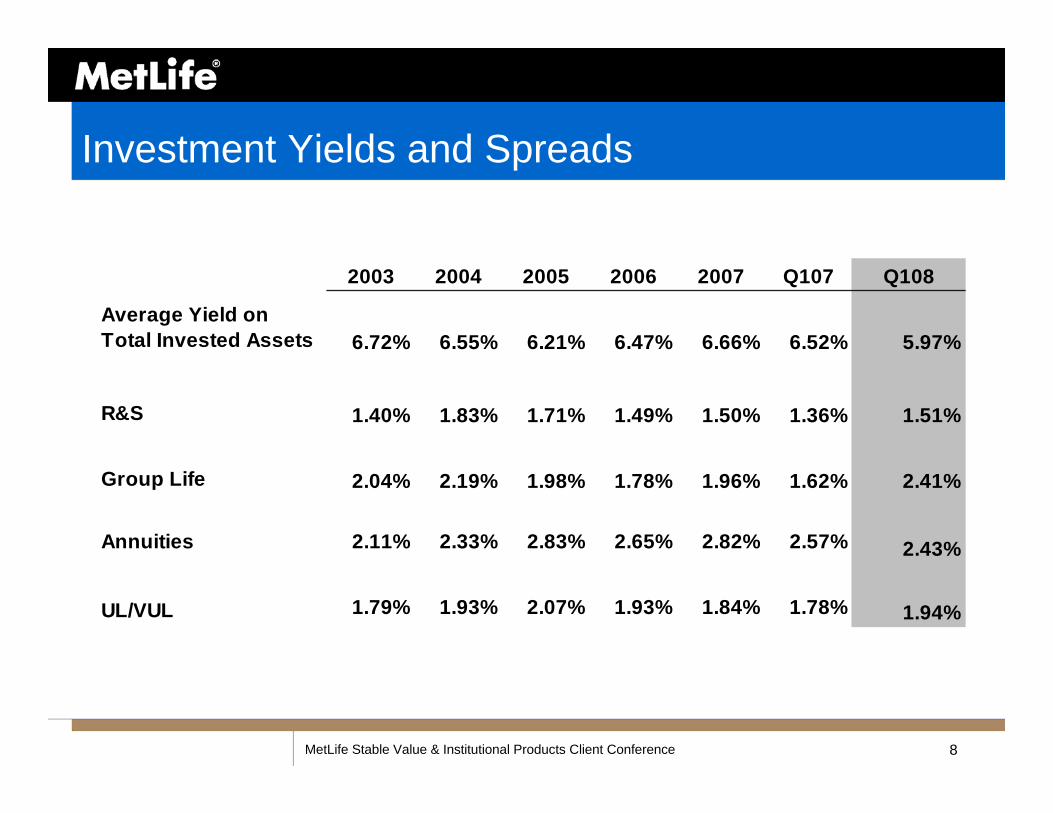
Investment Yields and Spreads
2003 2004 2005 2006 2007 Q107 Q108
Average Yield on Total Invested Assets 6.72% 6.55% 6.21% 6.47% 6.66% 6.52% 5.97%
R&S 1.40% 1.83% 1.71% 1.49% 1.50% 1.36% 1.51%
Group Life 2.04% 2.19% 1.98% 1.78% 1.96% 1.62% 2.41%
Annuities 2.11% 2.33% 2.83% 2.65% 2.82% 2.57% 2.43%
UL/VUL 1.79% 1.93% 2.07% 1.93% 1.84% 1.78% 1.94%
8
MetLife Stable Value & Institutional Products Client Conference
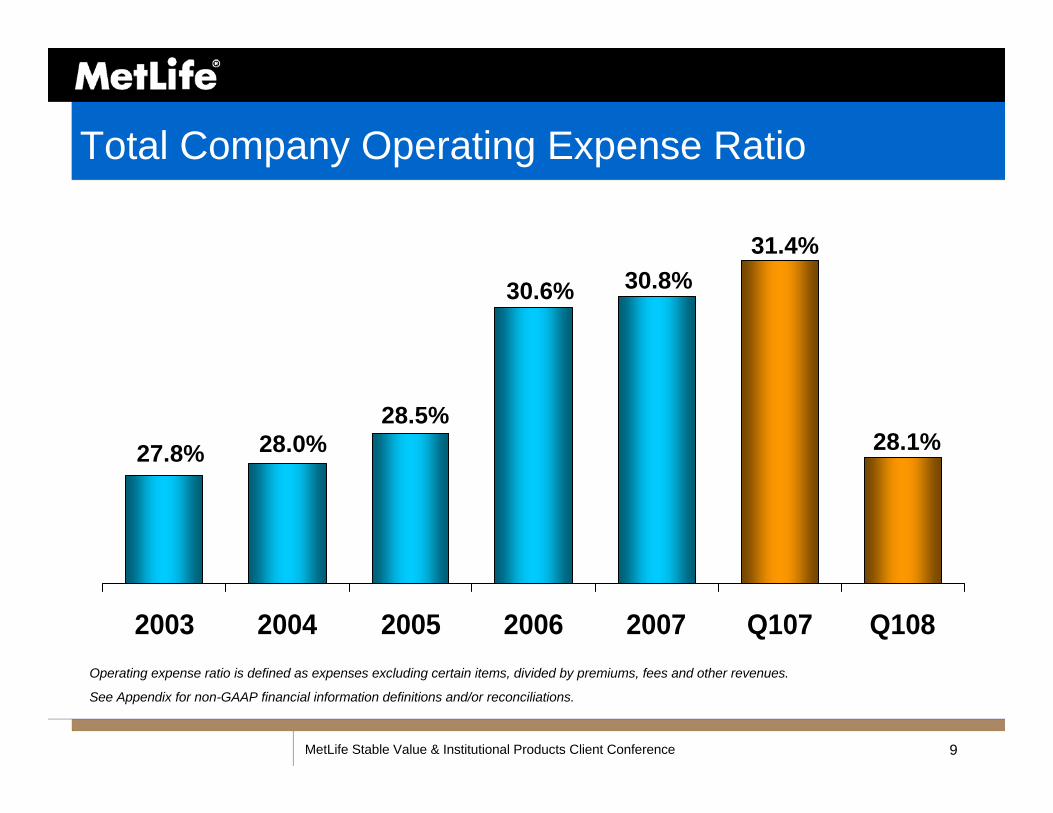
Total Company Operating Expense Ratio
2003 2004 2005 2006 2007 Q107 Q108Operating expense ratio is defined as expenses excluding certain items, divided by premiums, fees and other revenues.
See Appendix for non-GAAP financial information definitions and/or reconciliations.
28.5%
30.6% 30.8%
28.0%27.8%
31.4%
28.1%
9
MetLife Stable Value & Institutional Products Client Conference
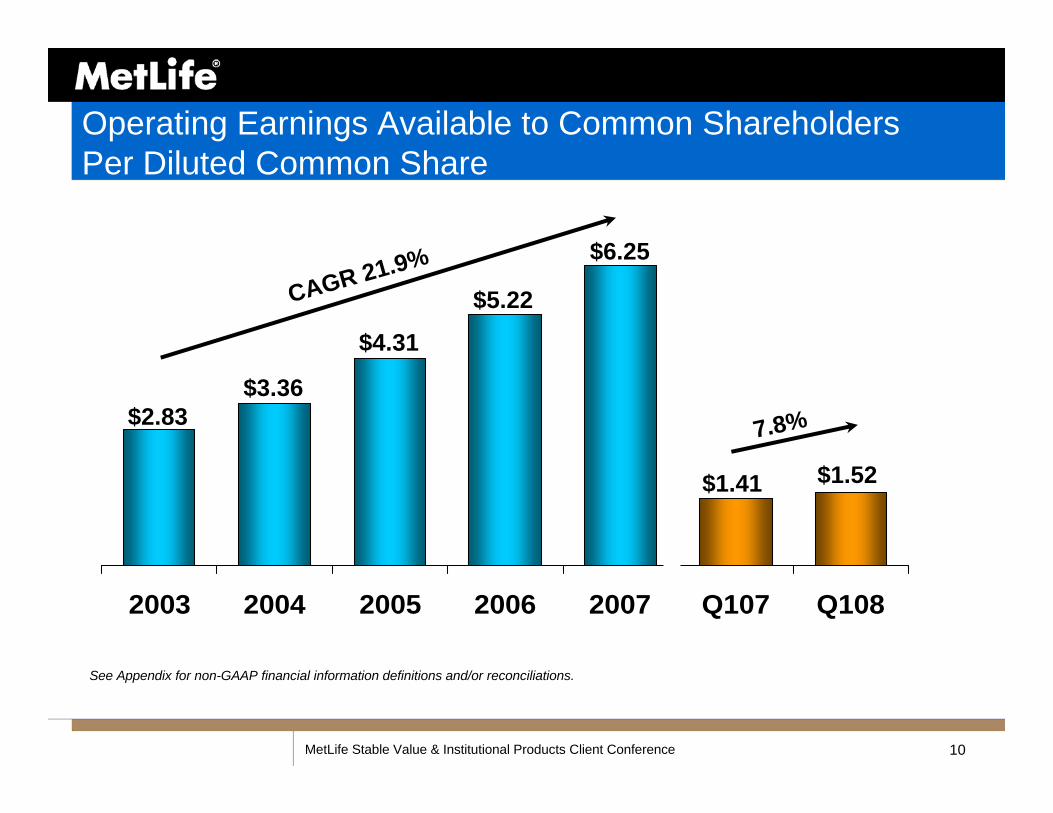
Operating Earnings Available to Common ShareholdersPer Diluted Common Share
2003 2004 2005 2006 2007 Q107 Q108
CAGR 21.9%
7.8%
$1.52
$4.31
$3.36$2.83
$5.22
$1.41
See Appendix for non-GAAP financial information definitions and/or reconciliations.
$6.25
10
MetLife Stable Value & Institutional Products Client Conference
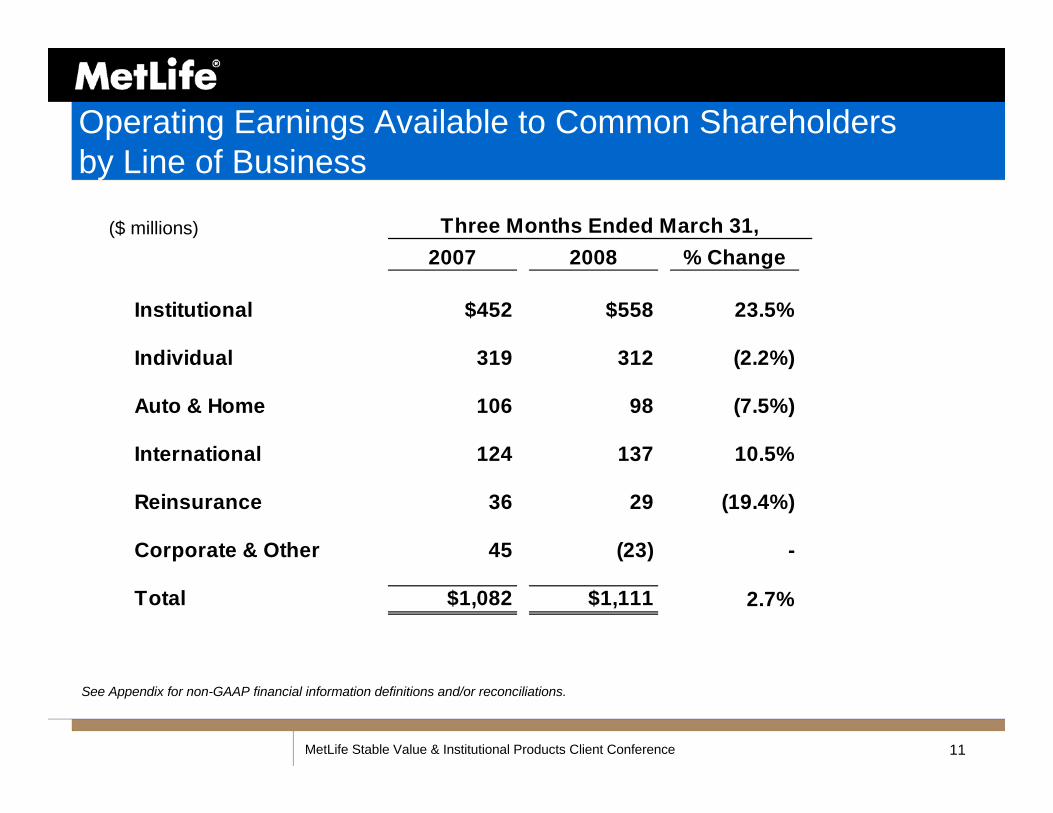
Operating Earnings Available to Common Shareholdersby Line of Business
Three Months Ended March 31,2007 2008 % Change
Institutional $452 $558 23.5%
Individual 319 312 (2.2%)
Auto & Home 106 98 (7.5%)
International 124 137 10.5%
Reinsurance 36 29 (19.4%)
Corporate & Other 45 (23) -
Total $1,082 $1,111 2.7%
See Appendix for non-GAAP financial information definitions and/or reconciliations.
($ millions)
11
MetLife Stable Value & Institutional Products Client Conference
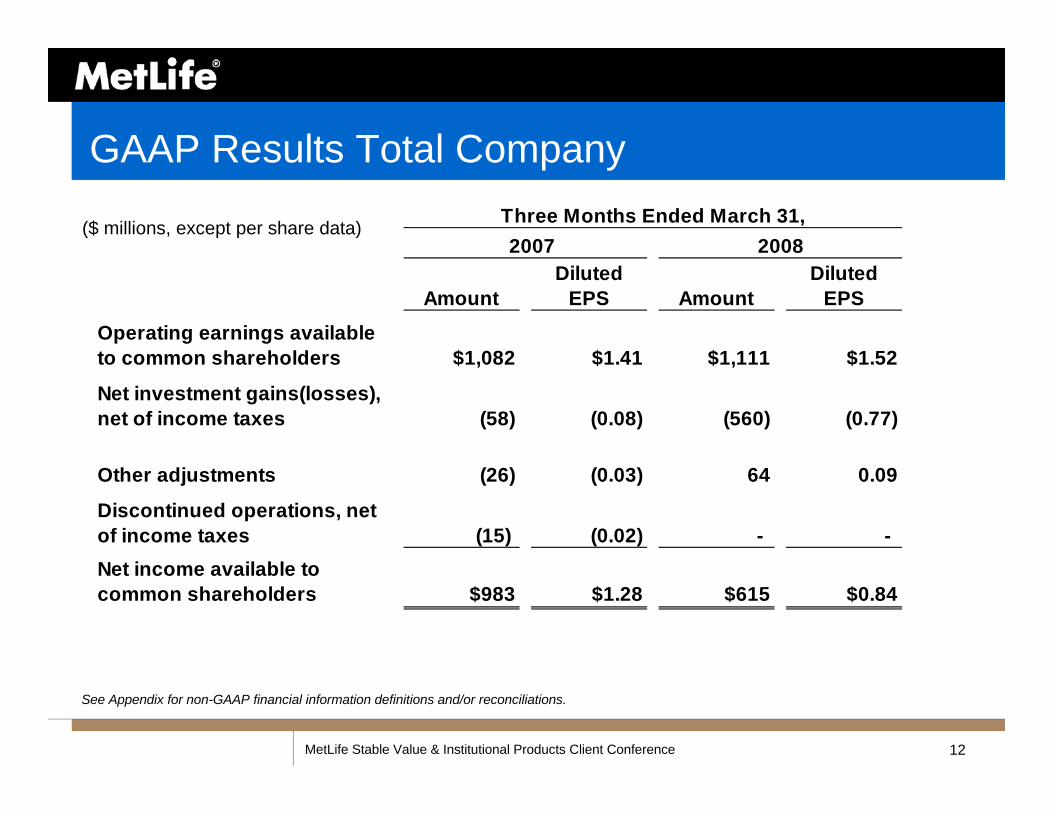
GAAP Results Total CompanyThree Months Ended March 31,2007 2008
AmountDiluted
EPS AmountDiluted
EPS
Operating earnings available to common shareholders $1,082 $1.41 $1,111 $1.52
Net investment gains(losses), net of income taxes (58) (0.08) (560) (0.77)
Other adjustments (26) (0.03) 64 0.09
Discontinued operations, net of income taxes (15) (0.02) - - Net income available to common shareholders $983 $1.28 $615 $0.84
($ millions, except per share data)
See Appendix for non-GAAP financial information definitions and/or reconciliations.
12

MetLife Stable Value & Institutional Products Client Conference
Financial Strength Ratings
Metropolitan Life Insurance Company
MetLife Insurance Company of Connecticut
Moody's Aa2 Stable Aa2 Stable
S&P AA Stable AA Stable
Fitch AA Stable AA Stable
A.M. Best A+ Stable A+ Stable
Company ratings as of May 30, 2008.
13
MetLife Stable Value & Institutional Products Client Conference
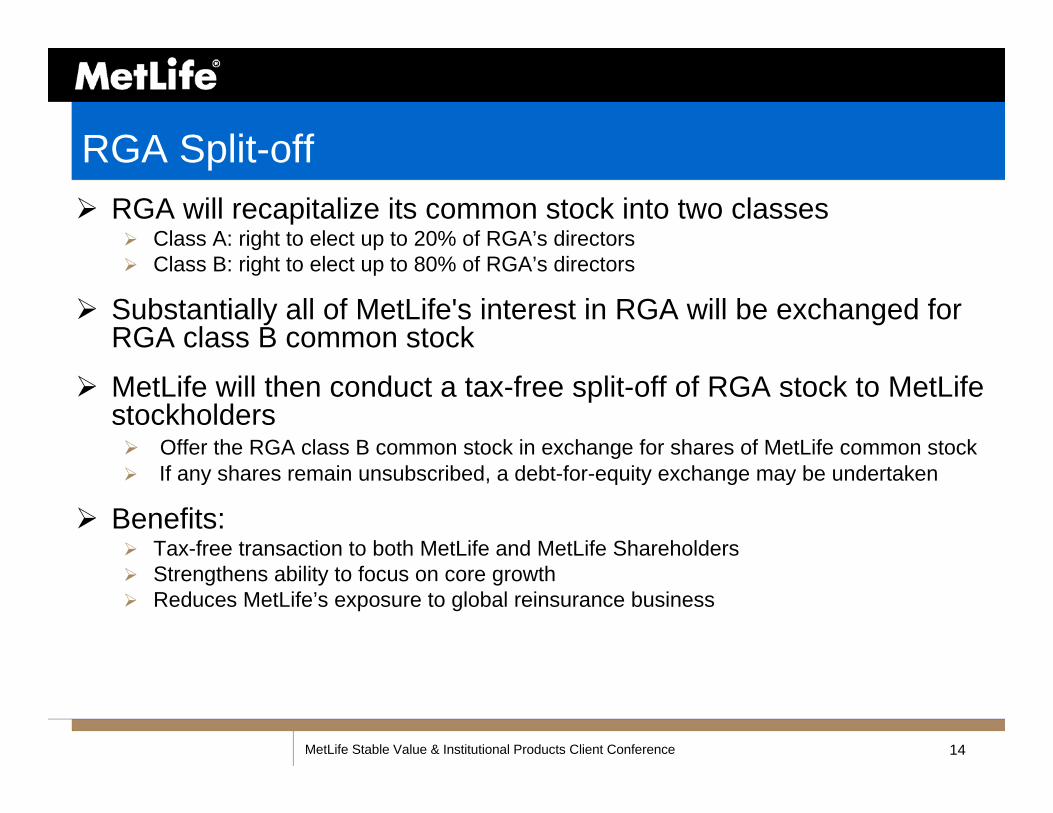
RGA Split-offRGA will recapitalize its common stock into two classes
Class A: right to elect up to 20% of RGA’s directorsClass B: right to elect up to 80% of RGA’s directors
Substantially all of MetLife's interest in RGA will be exchanged for RGA class B common stock
MetLife will then conduct a tax-free split-off of RGA stock to MetLife stockholders
Offer the RGA class B common stock in exchange for shares of MetLife common stockIf any shares remain unsubscribed, a debt-for-equity exchange may be undertaken
Benefits:Tax-free transaction to both MetLife and MetLife ShareholdersStrengthens ability to focus on core growthReduces MetLife’s exposure to global reinsurance business
14
MetLife Stable Value & Institutional Products Client Conference
SummaryOur business continues to perform wellCapital levels and balance sheet status are goodWe remain committed to maintaining MetLife’s financial strength
15

MetLife Stable Value & Institutional Products Client Conference
Corporate Benefit Funding
Robin Lenna
Senior Vice President
MetLife Stable Value & Institutional Products Client Conference

MetLife Stable Value & Institutional Products Client Conference
Who are we
Macro trends, challenges and opportunities
Solutions
Market leadership
How we compete and win
Agenda
2
MetLife Stable Value & Institutional Products Client Conference
Who Are We – Corporate Benefit Funding
Deliver retirement, benefit funding and investment solutions
Help companies make good on their benefit promises
Significant driver of growth for MetLife Institutional Business
Leader in markets in which we choose to compete
3

MetLife Stable Value & Institutional Products Client Conference
Macro Trends, Challenges and Opportunities
Enhanced focus on retirement
Global aging
Legislation highlights retirement security
Accounting drives financial transparency
Financial and economic markets challenging
4
MetLife Stable Value & Institutional Products Client Conference
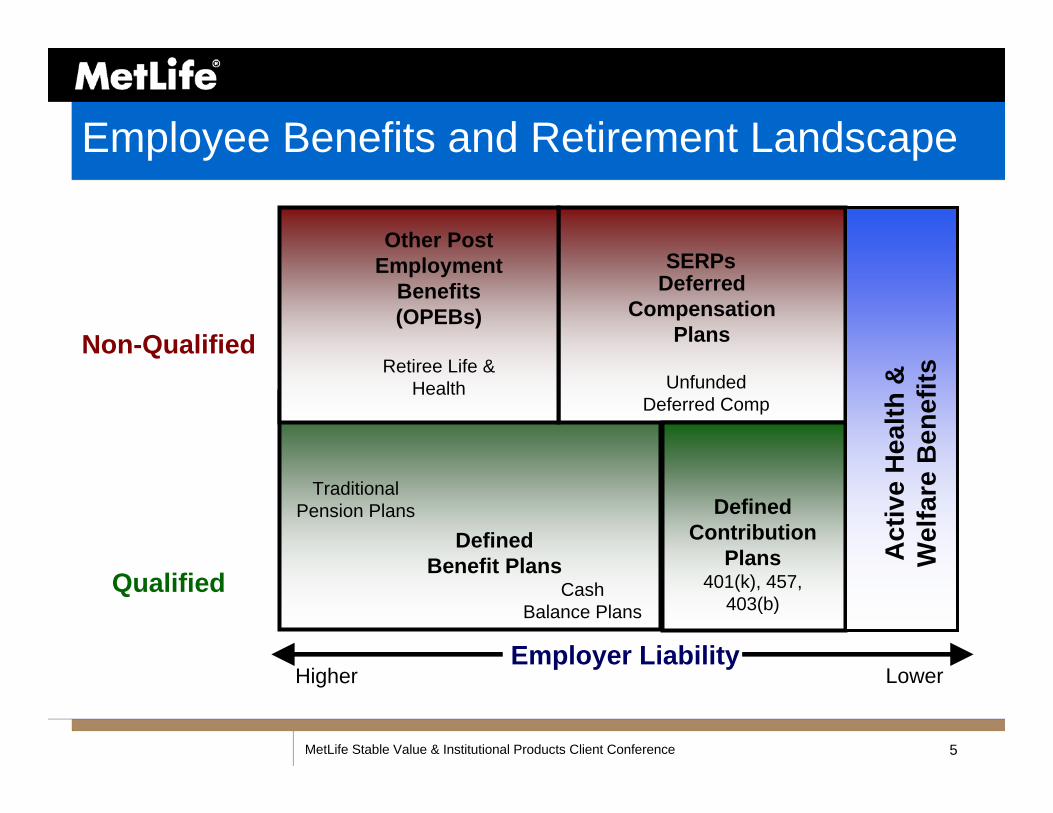
Employee Benefits and Retirement Landscape
DefinedContribution
Plans401(k), 457,
403(b)
DefinedBenefit Plans
Non-Qualified
Other Post Employment
Benefits (OPEBs)
Retiree Life & Health
DeferredCompensation
Plans
Qualified
Employer LiabilityLowerHigher
TraditionalPension Plans
CashBalance Plans
Unfunded Deferred Comp
SERPs
Act
ive
Hea
lth &
Wel
fare
Ben
efits
5
MetLife Stable Value & Institutional Products Client Conference
Distribution Channels
Direct to plan sponsors
Consultants / brokers
Third party administrators
6

MetLife Stable Value & Institutional Products Client Conference
Fixed or floating interest rateCPI-index linkedCallable structuresParticipant withdrawals (benefit responsive) at book valueOffers guaranteed full return of principal and accrued interestBoth general account and separate account
GICs and Funding AgreementsRetirement plan investment solutions
Key benefits: Guaranteed investment returns in volatile financial markets
Other solutions: LIBOR-based funding agreements for money market funds and securities lending cash pools
Product: Guaranteed Interest Contract
Sold to: Qualified pension plans
Purpose: An investment that backs a plan’s stable value option
7

MetLife Stable Value & Institutional Products Client Conference
Pension CloseoutsBenefit liability funding
Product: Single premium income annuity for retired and deferred lives
Sold to: Defined benefit pension plans
Purpose: Transfer risks associated with pension liabilities
Plan sponsor transfers liability by paying a lump sum to MetLife
MetLife provides guaranteed income payments to pension plan participants
Key benefits:Transfer of liability eliminates payments to PBGC and financial statement
volatility due to pension obligations
Provides pension plan participants with individual guarantees
8
MetLife Stable Value & Institutional Products Client Conference
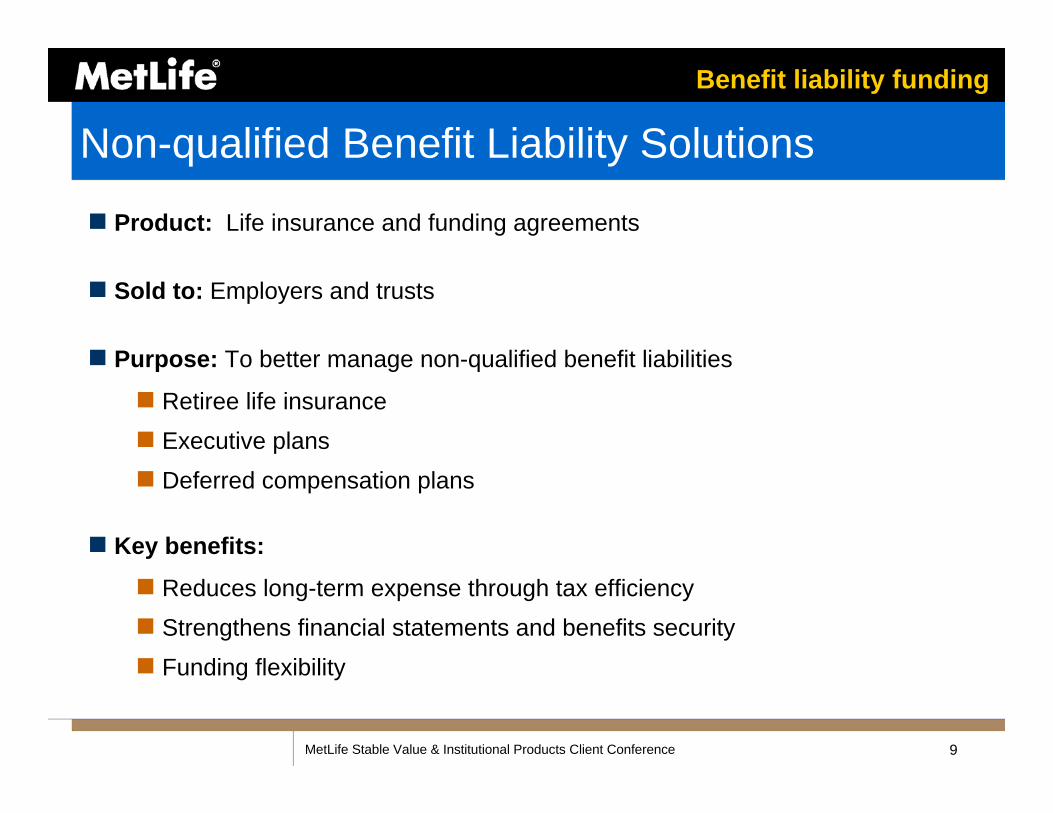
Non-qualified Benefit Liability SolutionsBenefit liability funding
Product: Life insurance and funding agreements
Sold to: Employers and trusts
Purpose: To better manage non-qualified benefit liabilities
Retiree life insuranceExecutive plansDeferred compensation plans
Key benefits:
Reduces long-term expense through tax efficiencyStrengthens financial statements and benefits securityFunding flexibility
9
MetLife Stable Value & Institutional Products Client Conference
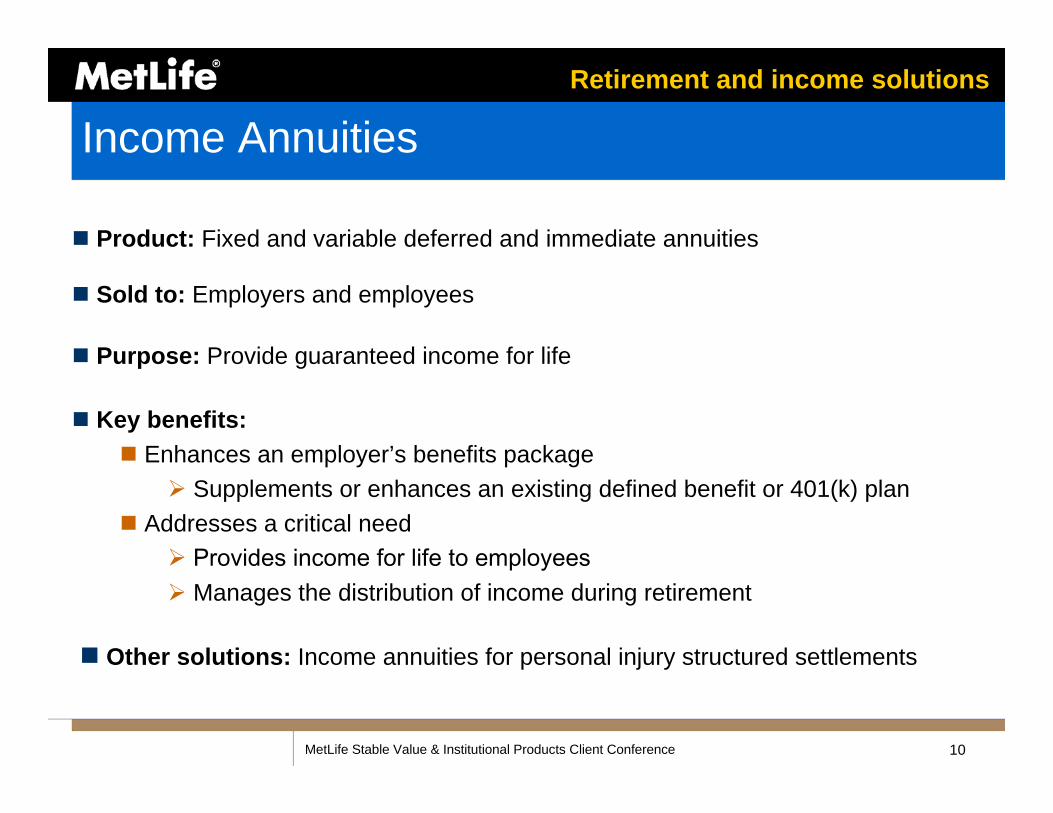
Income AnnuitiesRetirement and income solutions
Product: Fixed and variable deferred and immediate annuities
Sold to: Employers and employees
Purpose: Provide guaranteed income for life
Key benefits: Enhances an employer’s benefits package
Supplements or enhances an existing defined benefit or 401(k) planAddresses a critical need
Provides income for life to employeesManages the distribution of income during retirement
Other solutions: Income annuities for personal injury structured settlements
10
MetLife Stable Value & Institutional Products Client Conference
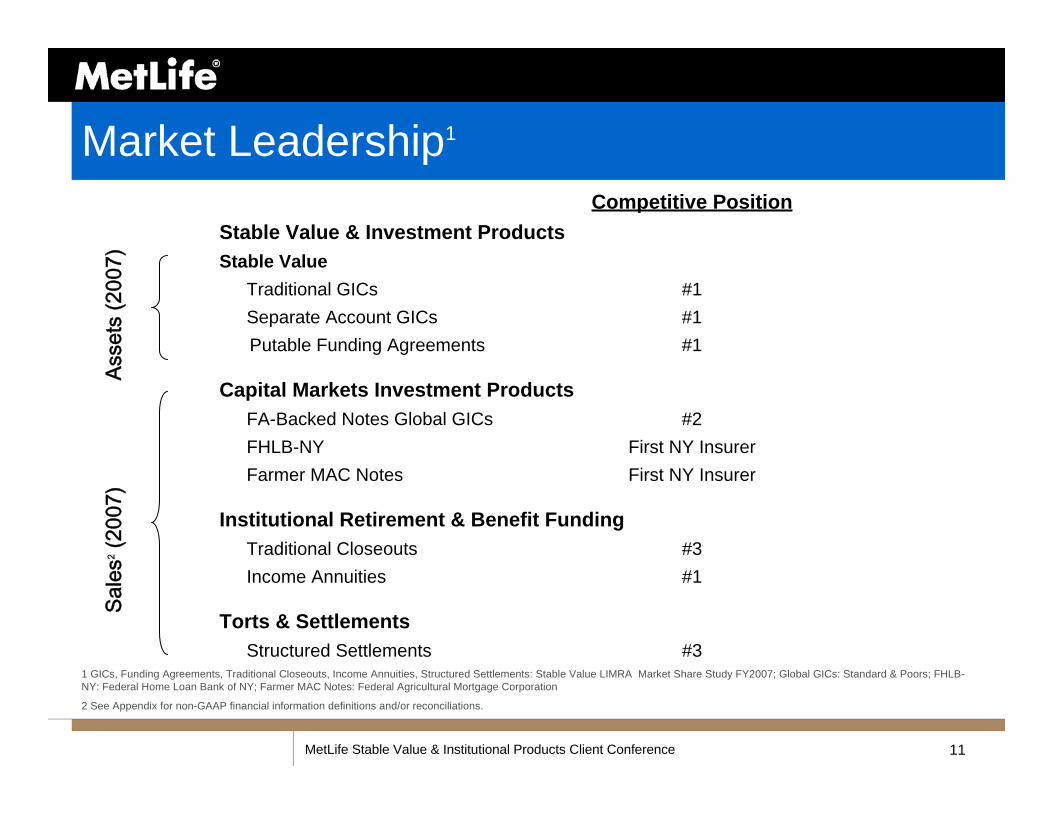
Market Leadership1
Competitive PositionStable Value & Investment ProductsStable Value
Traditional GICs #1Separate Account GICs #1
Putable Funding Agreements #1
Capital Markets Investment ProductsFA-Backed Notes Global GICs #2FHLB-NY First NY InsurerFarmer MAC Notes First NY Insurer
Institutional Retirement & Benefit FundingTraditional Closeouts #3Income Annuities #1
Torts & SettlementsStructured Settlements #3
Asse
ts (2
007)
Sale
s2(2
007)
1 GICs, Funding Agreements, Traditional Closeouts, Income Annuities, Structured Settlements: Stable Value LIMRA Market Share Study FY2007; Global GICs: Standard & Poors; FHLB-NY: Federal Home Loan Bank of NY; Farmer MAC Notes: Federal Agricultural Mortgage Corporation
2 See Appendix for non-GAAP financial information definitions and/or reconciliations.
11
MetLife Stable Value & Institutional Products Client Conference
How We Compete and Win
Recognized experience and expertise for complex cases
Brand and financial strength to provide guarantees
Superior relationships with Institutional clients
Creative solutions to meet current market conditions
Replace uncertainty with predictability
Integrity and trust
12


MetLife Stable Value & Institutional Products Client Conference
Capital Markets: Funding Agreement-Backed Programs
Tom Lenihan
Managing Director Capital Markets Group MetLife Stable Value & Institutional Products Client Conference
MetLife Stable Value & Institutional Products Client Conference
Agenda
• Funding Agreement-Backed Program Structure
• Program Overviews
2
MetLife Stable Value & Institutional Products Client Conference
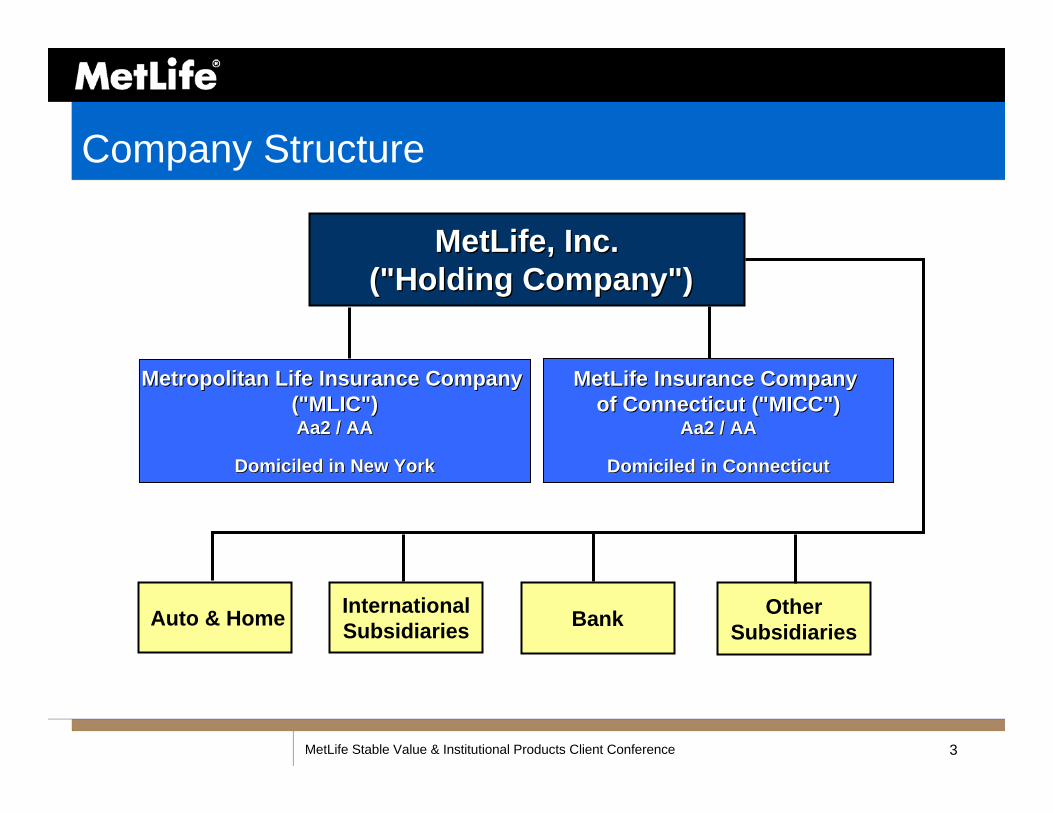
MetLife, Inc.MetLife, Inc.("Holding Company")("Holding Company")
Company Structure
International Subsidiaries
OtherSubsidiariesBankAuto & Home
Metropolitan Life Insurance Company Metropolitan Life Insurance Company ("MLIC")("MLIC")Aa2 / AAAa2 / AA
Domiciled in New YorkDomiciled in New York
MetLife Insurance Company MetLife Insurance Company of Connecticut ("MICC")of Connecticut ("MICC")
Aa2 / AAAa2 / AA
Domiciled in ConnecticutDomiciled in Connecticut
3
MetLife Stable Value & Institutional Products Client Conference
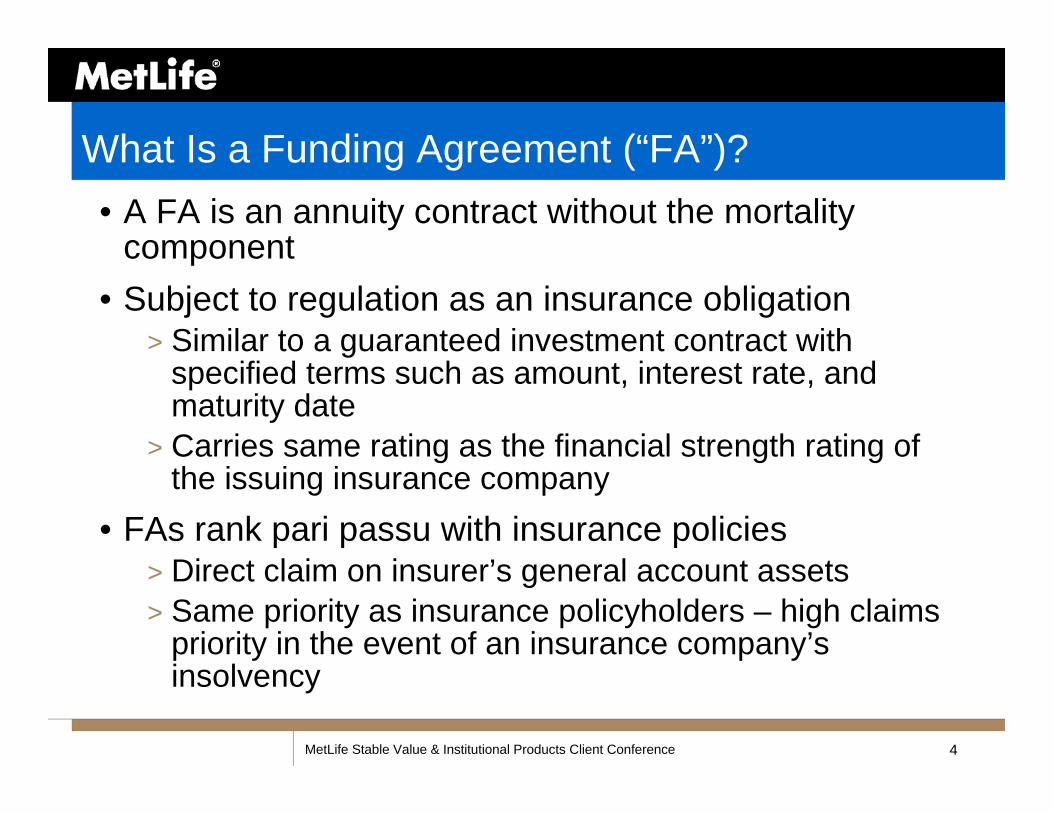
What Is a Funding Agreement (“FA”)?• A FA is an annuity contract without the mortality
component • Subject to regulation as an insurance obligation
> Similar to a guaranteed investment contract with specified terms such as amount, interest rate, and maturity date
> Carries same rating as the financial strength rating of the issuing insurance company
• FAs rank pari passu with insurance policies> Direct claim on insurer’s general account assets > Same priority as insurance policyholders – high claims
priority in the event of an insurance company’s insolvency
4

MetLife Stable Value & Institutional Products Client Conference
Structure of Programs
ProceedsProceeds
FundingAgreementNotes
Investors Trust/SPV
MLIC/MICC
5
MetLife Stable Value & Institutional Products Client Conference
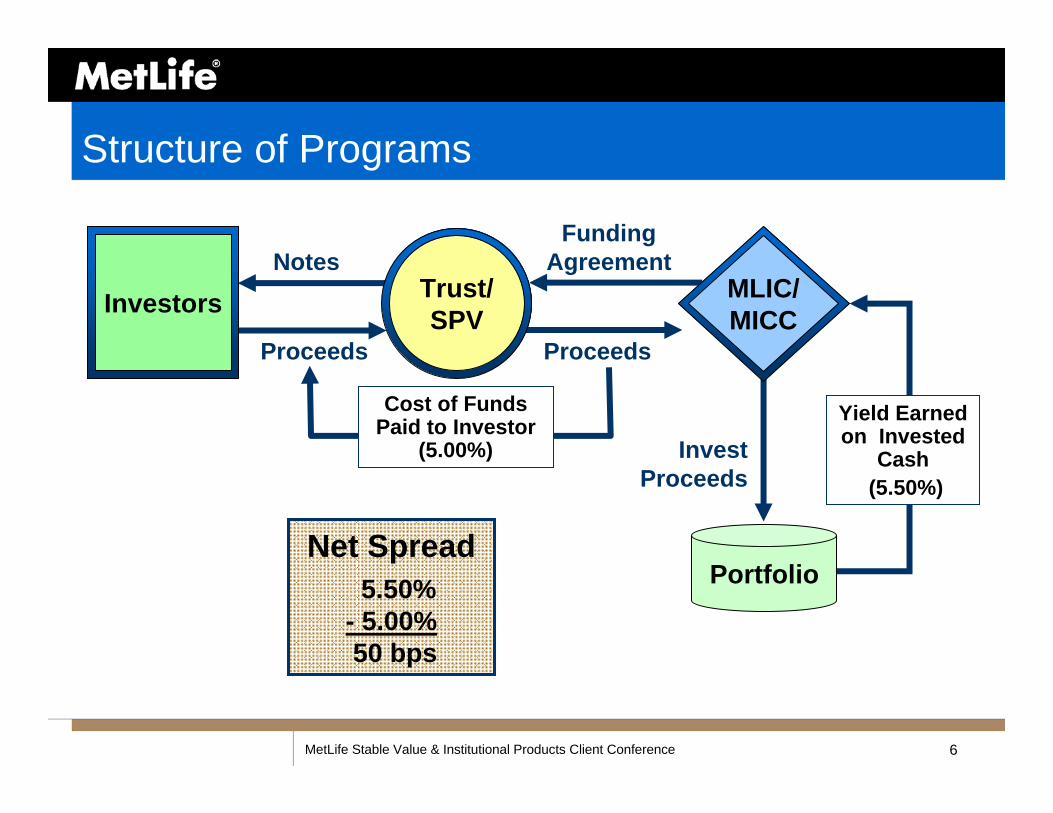
Structure of Programs
Invest Proceeds
Net Spread5.50%
- 5.00%50 bps
Yield Earned on Invested
Cash(5.50%)
Cost of Funds Paid to Investor
(5.00%)
ProceedsProceeds
FundingAgreementNotes
Investors Trust/SPV
Portfolio
MLIC/MICC
6
MetLife Stable Value & Institutional Products Client Conference
MetLife’s Funding Agreement-Backed Programs
• MLIC Funding Agreement-Backed Notes (GMTN)
• MICC Funding Agreement-Backed Notes (EMTN)
• Funding Agreement-Backed Commercial Paper
• Farmer Mac Guaranteed Notes
• Federal Home Loan Bank Advances
The Following Programs Operate in the Global Capital Markets Using FA-Backed Structures:
7
MetLife Stable Value & Institutional Products Client Conference
FA-Backed Notes Programs Operating Paradigm
• Programs operated within the Investments Department’s Capital Markets Group (CMG)
• CMG has both Asset and Liability responsibility
• Liability features drive asset mix and characteristics
• Derivatives are actively used to manage duration, currency and cash flow risks
• End result is a tight ALM paradigm
8
MetLife Stable Value & Institutional Products Client Conference
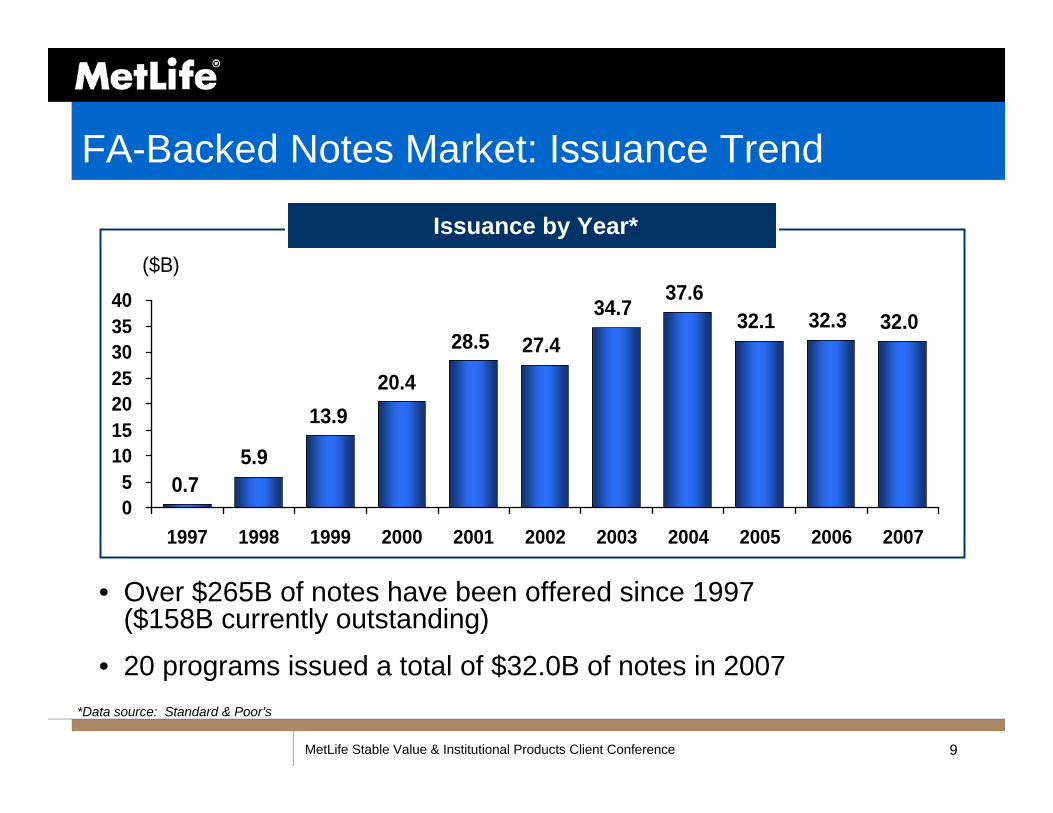
FA-Backed Notes Market: Issuance Trend
27.4
34.737.6
32.1 32.3 32.0
0.75.9
13.920.4
28.5
05
10152025303540
1997 1998 1999 2000 2001 2002 2003 2004 2005 2006 2007
($B)
• Over $265B of notes have been offered since 1997($158B currently outstanding)
• 20 programs issued a total of $32.0B of notes in 2007
Issuance by Year*
*Data source: Standard & Poor’s
9
MetLife Stable Value & Institutional Products Client Conference
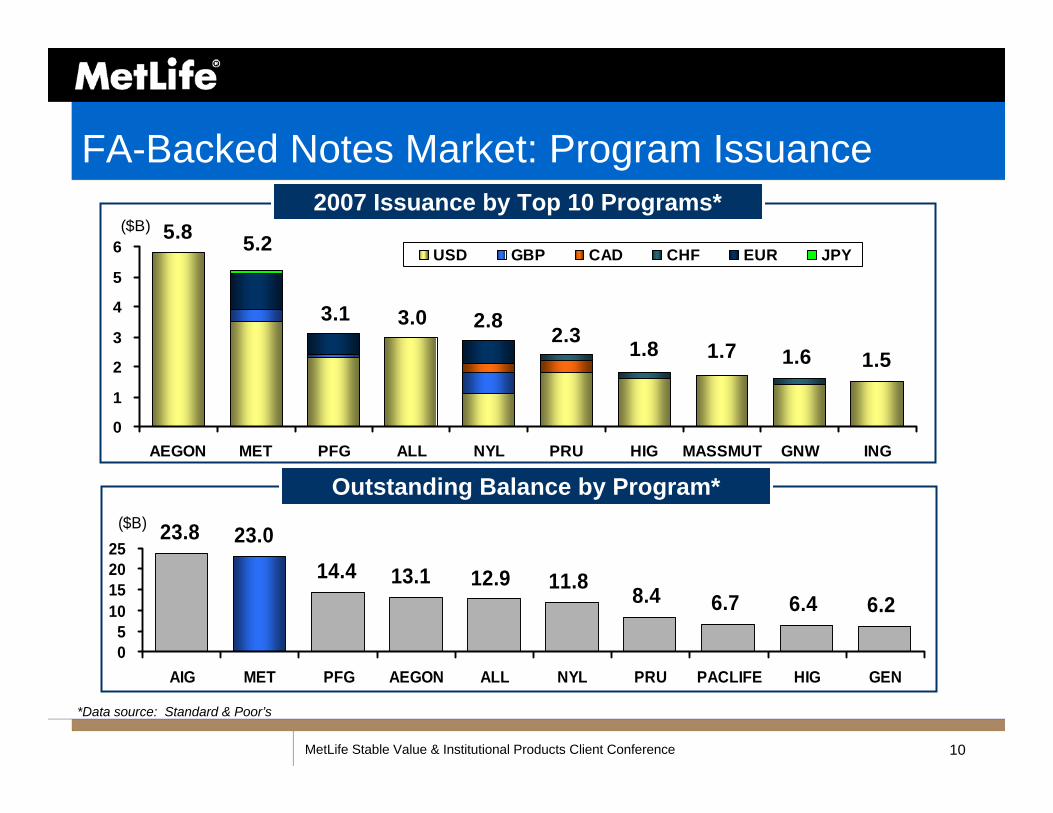
FA-Backed Notes Market: Program Issuance
1.5 1.6 1.7 1.8 2.3
5.8 5.2
3.1 3.0 2.8
0
1
2
3
4
5
6
AEGON MET PFG ALL NYL PRU HIG MASSMUT GNW ING
($B)
USD GBP CAD CHF EUR JPY
*Data source: Standard & Poor’s
11.8 8.4 6.7 6.4 6.2
23.8 23.014.4 13.1 12.9
05
10152025
AIG MET PFG AEGON ALL NYL PRU PACLIFE HIG GEN
($B)
2007 Issuance by Top 10 Programs*
Outstanding Balance by Program*
10
MetLife Stable Value & Institutional Products Client Conference
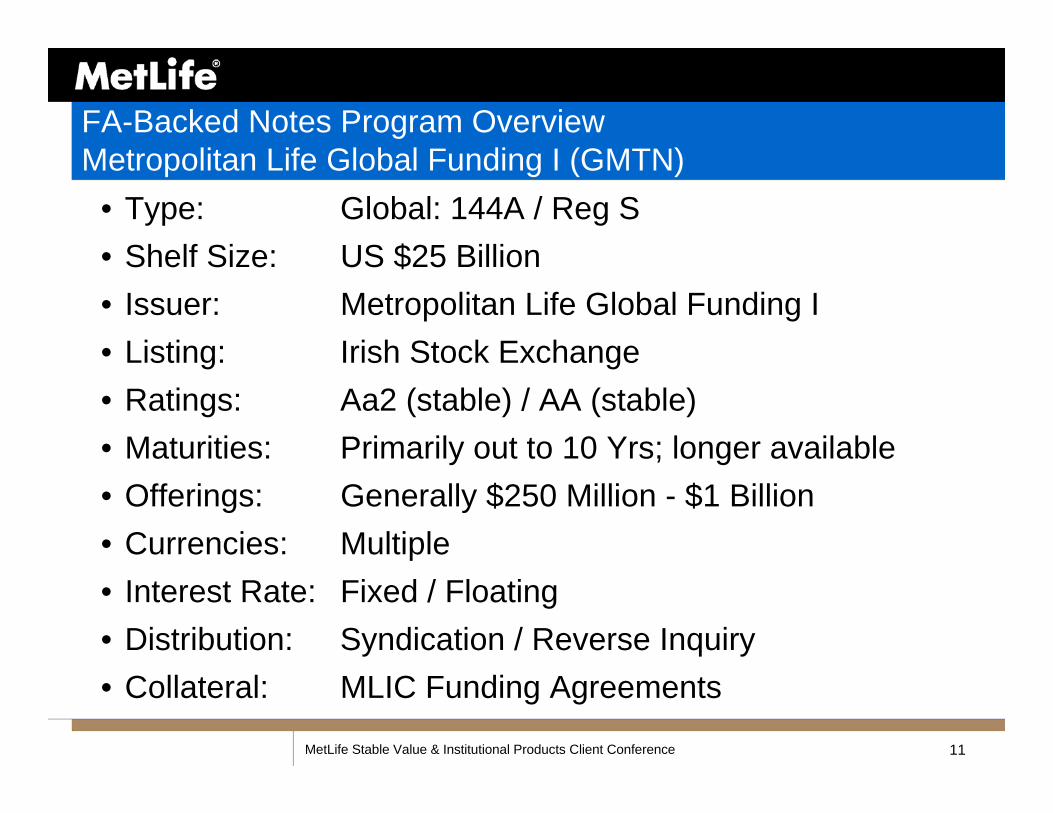
FA-Backed Notes Program OverviewMetropolitan Life Global Funding I (GMTN)
• Type: Global: 144A / Reg S• Shelf Size: US $25 Billion• Issuer: Metropolitan Life Global Funding I• Listing: Irish Stock Exchange • Ratings: Aa2 (stable) / AA (stable)• Maturities: Primarily out to 10 Yrs; longer available• Offerings: Generally $250 Million - $1 Billion• Currencies: Multiple• Interest Rate: Fixed / Floating• Distribution: Syndication / Reverse Inquiry• Collateral: MLIC Funding Agreements
11

MetLife Stable Value & Institutional Products Client Conference
MLIC FA-Backed Notes Program Summary• 64 discrete transactions totaling over $27 billion of
notes offered since inception of the program in June 2002
• Average annual issuance of about $4.5 billion • Outstanding balance totals approximately $21.8 billion• Global presence with issuances in 7 currencies• Program has reached over 450 investors globally• 2008 YTD issuance of $5.1 billion towards $4 - 6
billion plan• Diversification: currencies, curve profile, markets • Utilizes a broad group of bankers
12
MetLife Stable Value & Institutional Products Client Conference
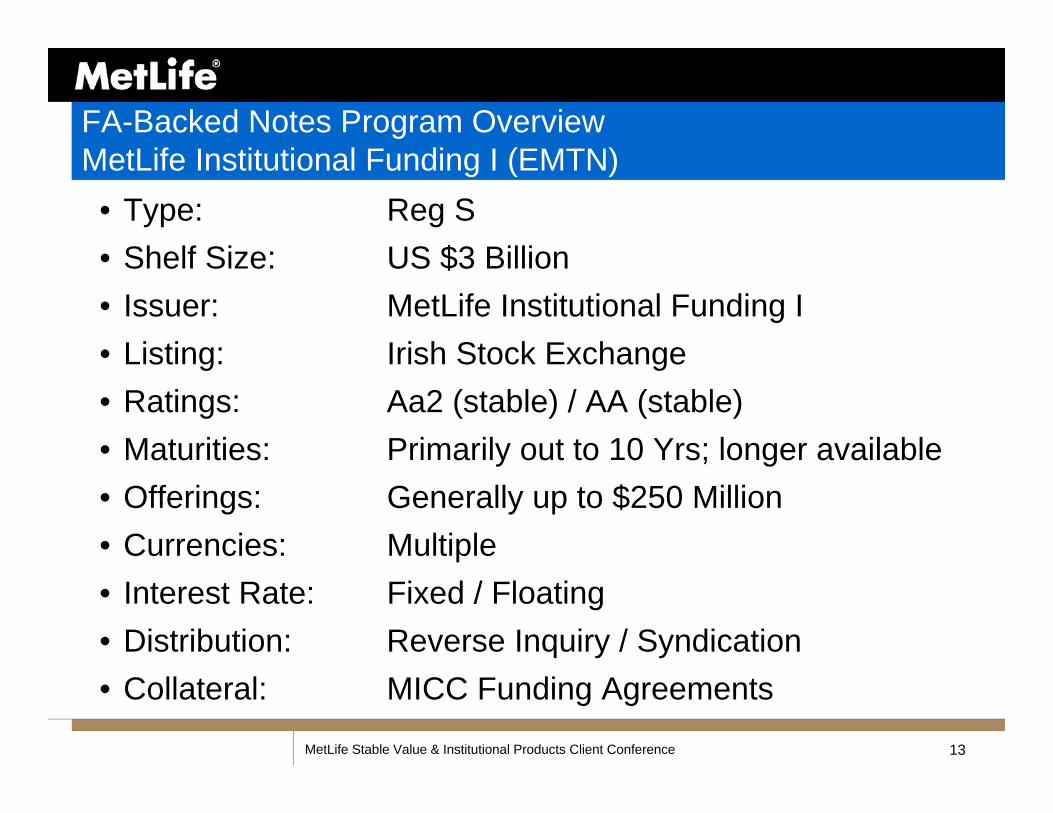
FA-Backed Notes Program OverviewMetLife Institutional Funding I (EMTN)
• Type: Reg S• Shelf Size: US $3 Billion• Issuer: MetLife Institutional Funding I• Listing: Irish Stock Exchange • Ratings: Aa2 (stable) / AA (stable)• Maturities: Primarily out to 10 Yrs; longer available• Offerings: Generally up to $250 Million• Currencies: Multiple• Interest Rate: Fixed / Floating• Distribution: Reverse Inquiry / Syndication• Collateral: MICC Funding Agreements
13

MetLife Stable Value & Institutional Products Client Conference
FA-Backed CP Program Overview
• Program Name: Beagle Funding LLC (to be renamed MetLife Short Term Funding)
• Authorized Shelf Size: $10 Billion• Ratings: “A-1+” and “P-1” by S&P and Moody’s,
respectively• CP is secured by a Funding Agreement issued by
MLIC or MICC*• Program Arranger: Morgan Stanley• Named Dealers: Morgan Stanley, Goldman Sachs,
Merrill Lynch*It is expected that MICC will be added as a Funding Agreement provider by the end of Q2
14
MetLife Stable Value & Institutional Products Client Conference
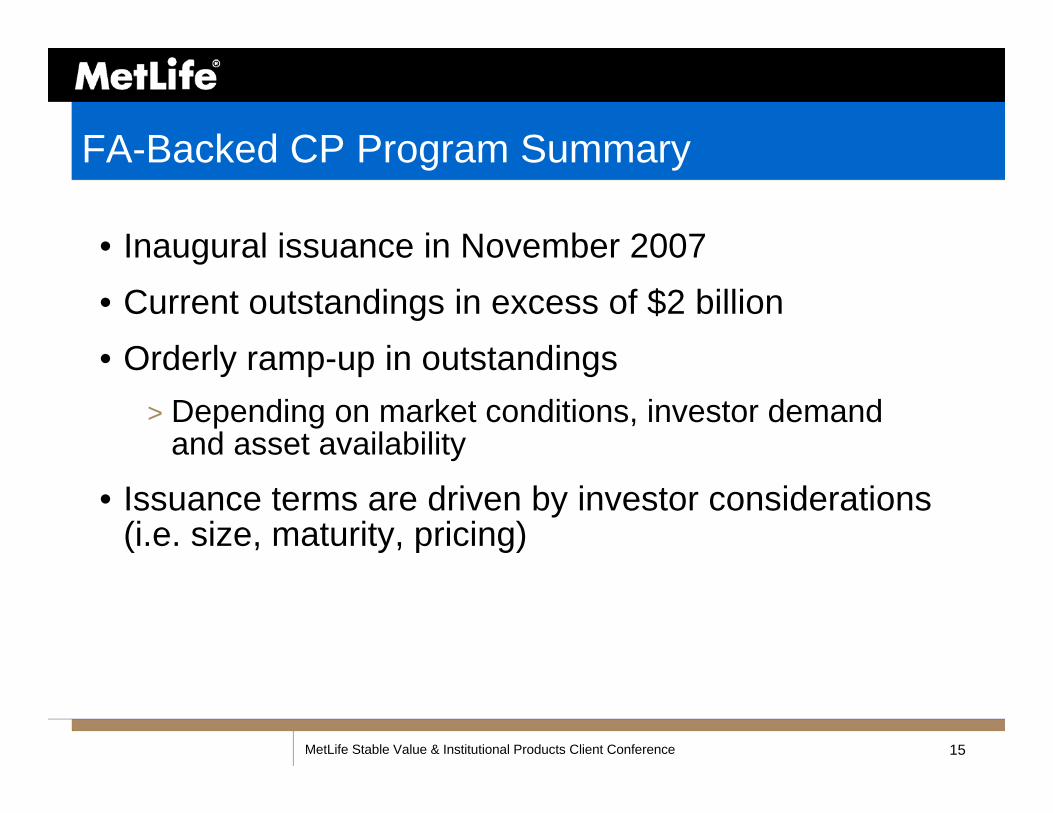
FA-Backed CP Program Summary
• Inaugural issuance in November 2007 • Current outstandings in excess of $2 billion• Orderly ramp-up in outstandings
> Depending on market conditions, investor demand and asset availability
• Issuance terms are driven by investor considerations (i.e. size, maturity, pricing)
15
MetLife Stable Value & Institutional Products Client Conference
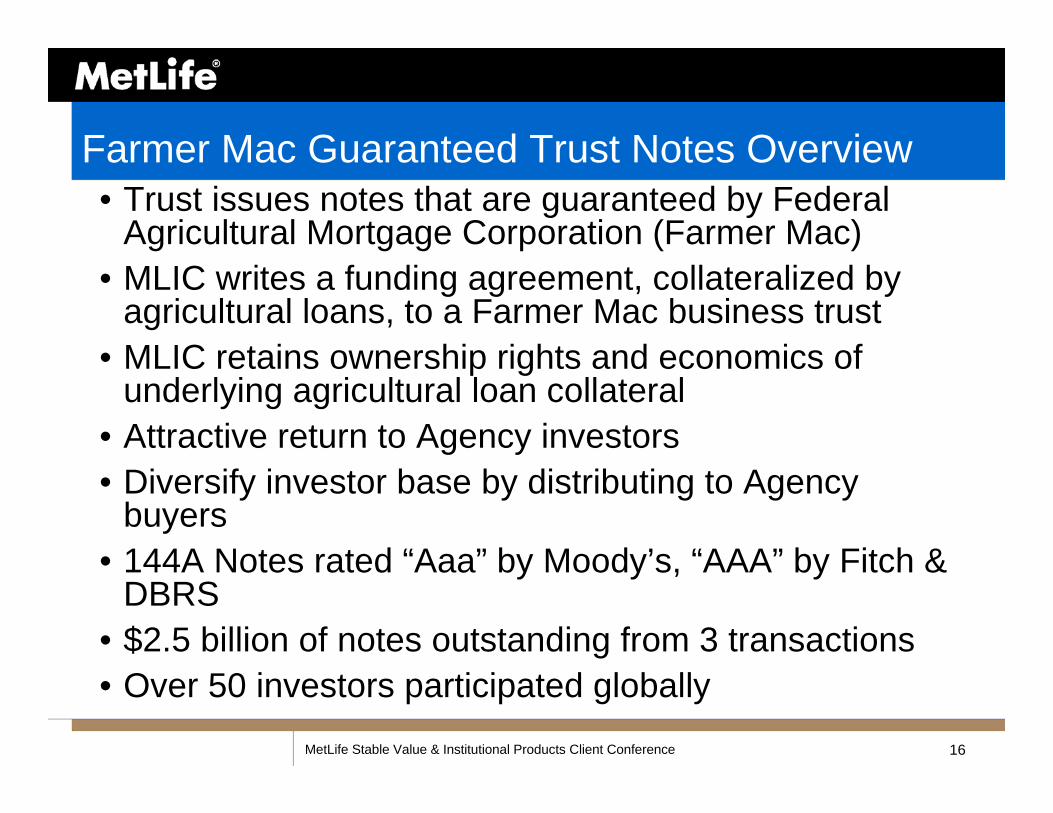
Farmer Mac Guaranteed Trust Notes Overview• Trust issues notes that are guaranteed by Federal
Agricultural Mortgage Corporation (Farmer Mac)• MLIC writes a funding agreement, collateralized by
agricultural loans, to a Farmer Mac business trust• MLIC retains ownership rights and economics of
underlying agricultural loan collateral• Attractive return to Agency investors• Diversify investor base by distributing to Agency
buyers• 144A Notes rated “Aaa” by Moody’s, “AAA” by Fitch &
DBRS• $2.5 billion of notes outstanding from 3 transactions• Over 50 investors participated globally
16
MetLife Stable Value & Institutional Products Client Conference
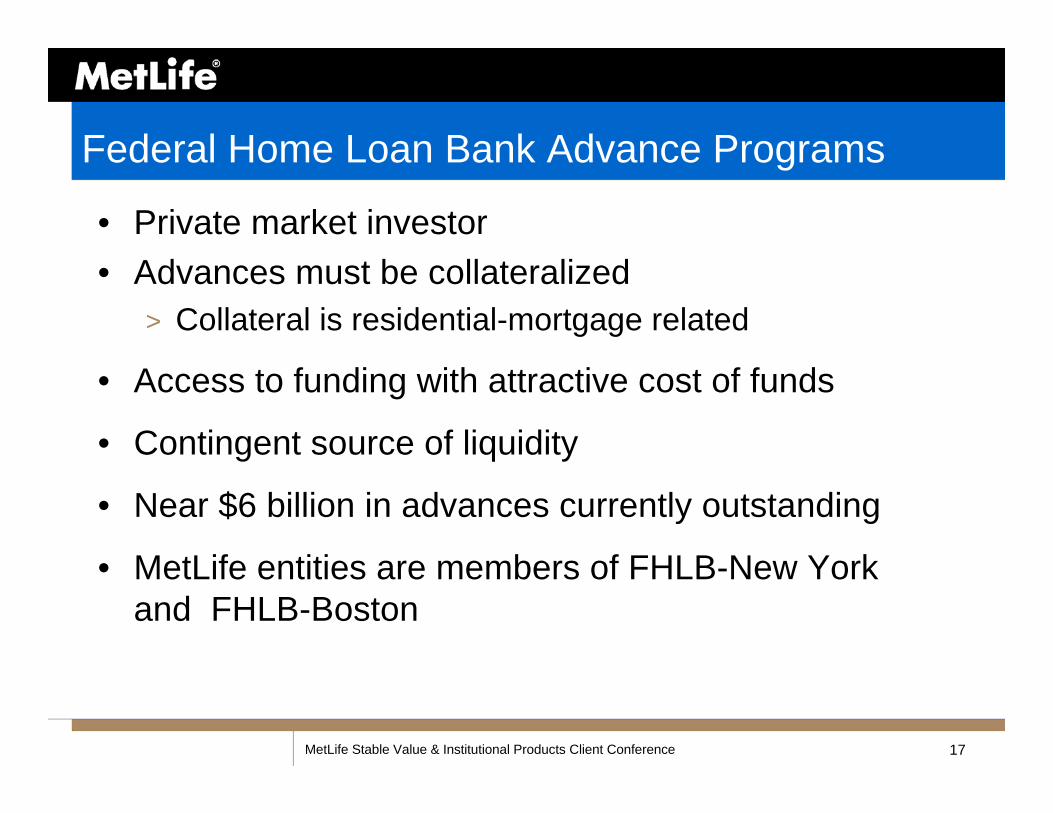
Federal Home Loan Bank Advance Programs
• Private market investor • Advances must be collateralized
> Collateral is residential-mortgage related
• Access to funding with attractive cost of funds
• Contingent source of liquidity
• Near $6 billion in advances currently outstanding
• MetLife entities are members of FHLB-New York and FHLB-Boston
17
MetLife Stable Value & Institutional Products Client Conference
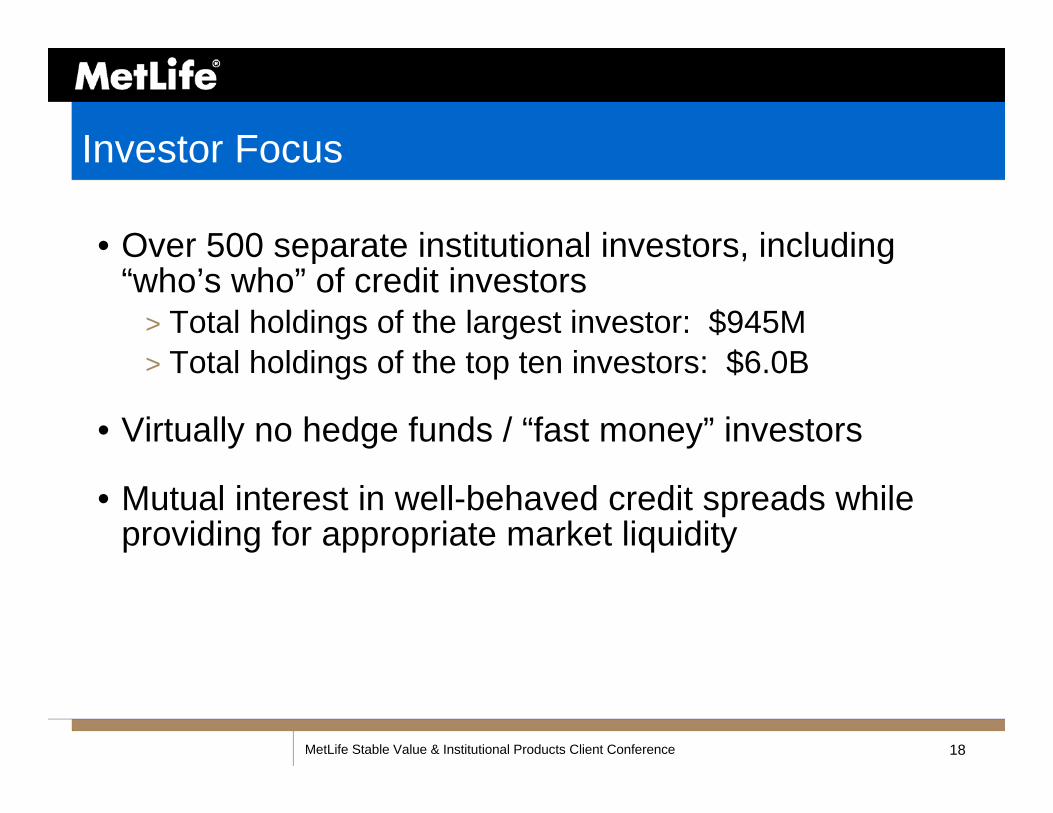
Investor Focus
• Over 500 separate institutional investors, including “who’s who” of credit investors
> Total holdings of the largest investor: $945M> Total holdings of the top ten investors: $6.0B
• Virtually no hedge funds / “fast money” investors
• Mutual interest in well-behaved credit spreads while providing for appropriate market liquidity
18

MetLife Stable Value & Institutional Products Client Conference
MetLife Stable Value & Institutional Products Client Conference
Investments Overview
Robert W. Morgan
Managing Director Portfolio Management MetLife Stable Value & Institutional Products Client Conference

MetLife Stable Value & Institutional Products Client Conference
Agenda
• Market Overview
• Portfolio Review> Asset allocation> Fixed maturity securities> Alternative investments> Real estate
• Derivatives
• Risk Management
2
MetLife Stable Value & Institutional Products Client Conference
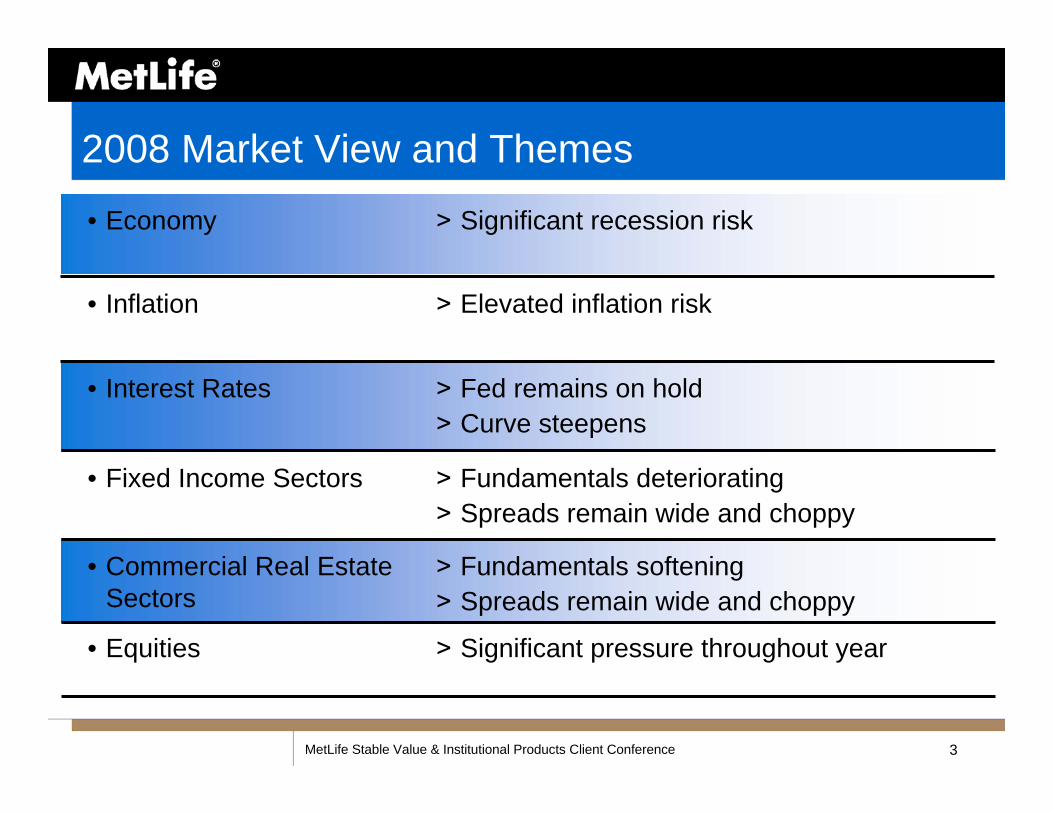
2008 Market View and Themes
> Significant pressure throughout year• Equities
> Fundamentals softening> Spreads remain wide and choppy
• Commercial Real Estate Sectors
> Fundamentals deteriorating> Spreads remain wide and choppy
• Fixed Income Sectors
> Fed remains on hold> Curve steepens
• Interest Rates
> Elevated inflation risk• Inflation
> Significant recession risk• Economy
3

MetLife Stable Value & Institutional Products Client Conference
Market Dislocation: Spreads Have Widened
0
100
200
300
400
500
600
700
800
900
Dec-06 Feb-07 Apr-07 Jun-07 Aug-07 Oct-07 Dec-07 Feb-08 Apr-08
0
100
200
300
400
500
600
Dec-06 Feb-07 Apr-07 Jun-07 Aug-07 Oct-07 Dec-07 Feb-08 Apr-08
0
100
200
300
400
500
600
700
800
900
Dec-06 Feb-07 Apr-07 Jun-07 Aug-07 Oct-07 Dec-07 Feb-08 Apr-08
BBB Corporates
A Corporates
0
20
40
60
80
100
120
140
160
180
200
Dec-06 Feb-07 Apr-07 Jun-07 Aug-07 Oct-07 Dec-07 Feb-08 Apr-08
Lehman ALehman A--BBB SpreadsBBB SpreadsLehman High Yield SpreadsLehman High Yield Spreads
Lehman 30Lehman 30--Yr Conventional RMBSYr Conventional RMBSLehman AAA CMBS SpreadsLehman AAA CMBS Spreads
Spread data through 6/6/08.
4
MetLife Stable Value & Institutional Products Client Conference
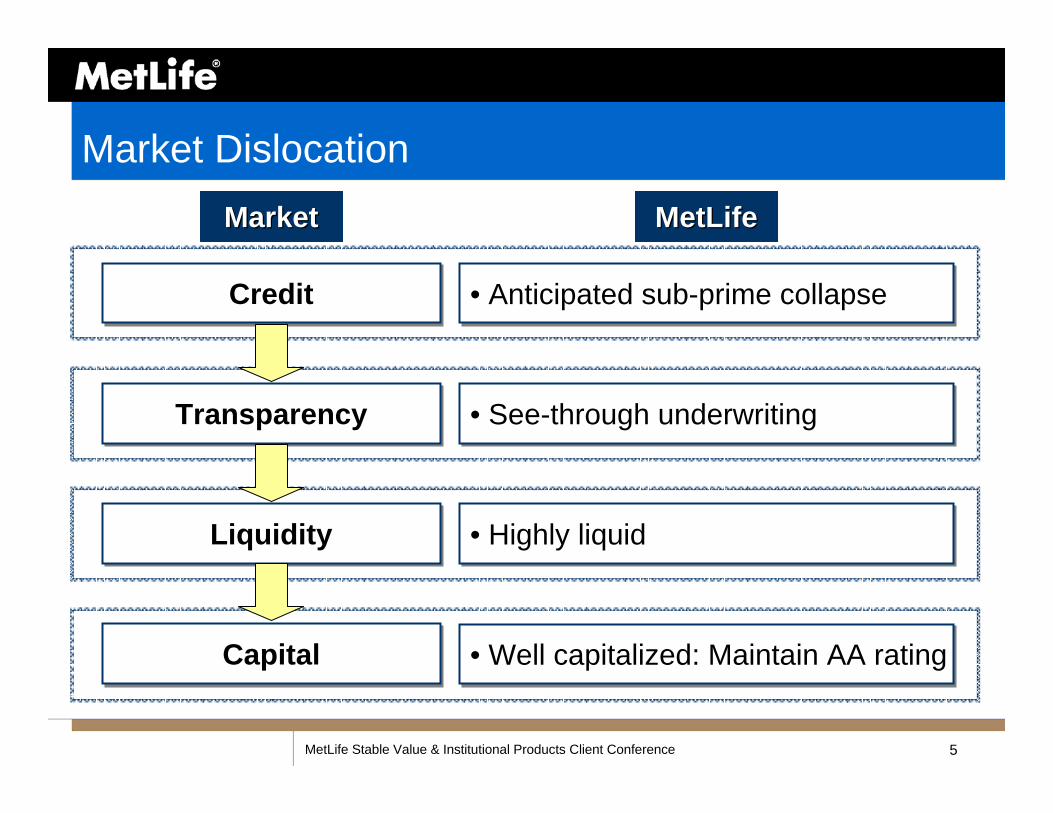
CreditCredit
Market DislocationMarketMarket MetLifeMetLife
TransparencyTransparency
LiquidityLiquidity
CapitalCapital
• Anticipated sub-prime collapse• Anticipated sub-prime collapse
• See-through underwriting• See-through underwriting
• Highly liquid• Highly liquid
• Well capitalized: Maintain AA rating• Well capitalized: Maintain AA rating
5
MetLife Stable Value & Institutional Products Client Conference
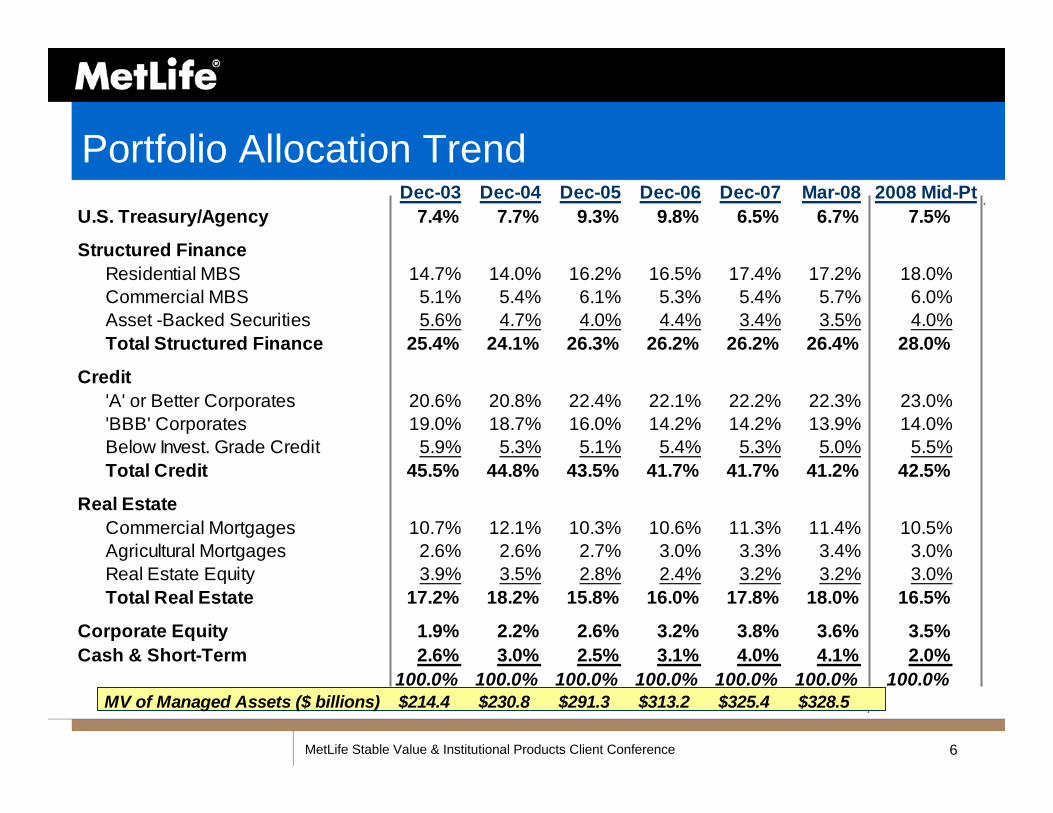
Portfolio Allocation TrendDec-03 Dec-04 Dec-05 Dec-06 Dec-07 Mar-08 2008 Mid-Pt
U.S. Treasury/Agency 7.4% 7.7% 9.3% 9.8% 6.5% 6.7% 7.5%
Structured FinanceResidential MBS 14.7% 14.0% 16.2% 16.5% 17.4% 17.2% 18.0%Commercial MBS 5.1% 5.4% 6.1% 5.3% 5.4% 5.7% 6.0%Asset -Backed Securities 5.6% 4.7% 4.0% 4.4% 3.4% 3.5% 4.0%Total Structured Finance 25.4% 24.1% 26.3% 26.2% 26.2% 26.4% 28.0%
Credit'A' or Better Corporates 20.6% 20.8% 22.4% 22.1% 22.2% 22.3% 23.0%'BBB' Corporates 19.0% 18.7% 16.0% 14.2% 14.2% 13.9% 14.0%Below Invest. Grade Credit 5.9% 5.3% 5.1% 5.4% 5.3% 5.0% 5.5%Total Credit 45.5% 44.8% 43.5% 41.7% 41.7% 41.2% 42.5%
Real EstateCommercial Mortgages 10.7% 12.1% 10.3% 10.6% 11.3% 11.4% 10.5%Agricultural Mortgages 2.6% 2.6% 2.7% 3.0% 3.3% 3.4% 3.0%Real Estate Equity 3.9% 3.5% 2.8% 2.4% 3.2% 3.2% 3.0%Total Real Estate 17.2% 18.2% 15.8% 16.0% 17.8% 18.0% 16.5%
Corporate Equity 1.9% 2.2% 2.6% 3.2% 3.8% 3.6% 3.5%Cash & Short-Term 2.6% 3.0% 2.5% 3.1% 4.0% 4.1% 2.0%
100.0% 100.0% 100.0% 100.0% 100.0% 100.0% 100.0%MV of Managed Assets ($ billions) $214.4 $230.8 $291.3 $313.2 $325.4 $328.5
6
MetLife Stable Value & Institutional Products Client Conference
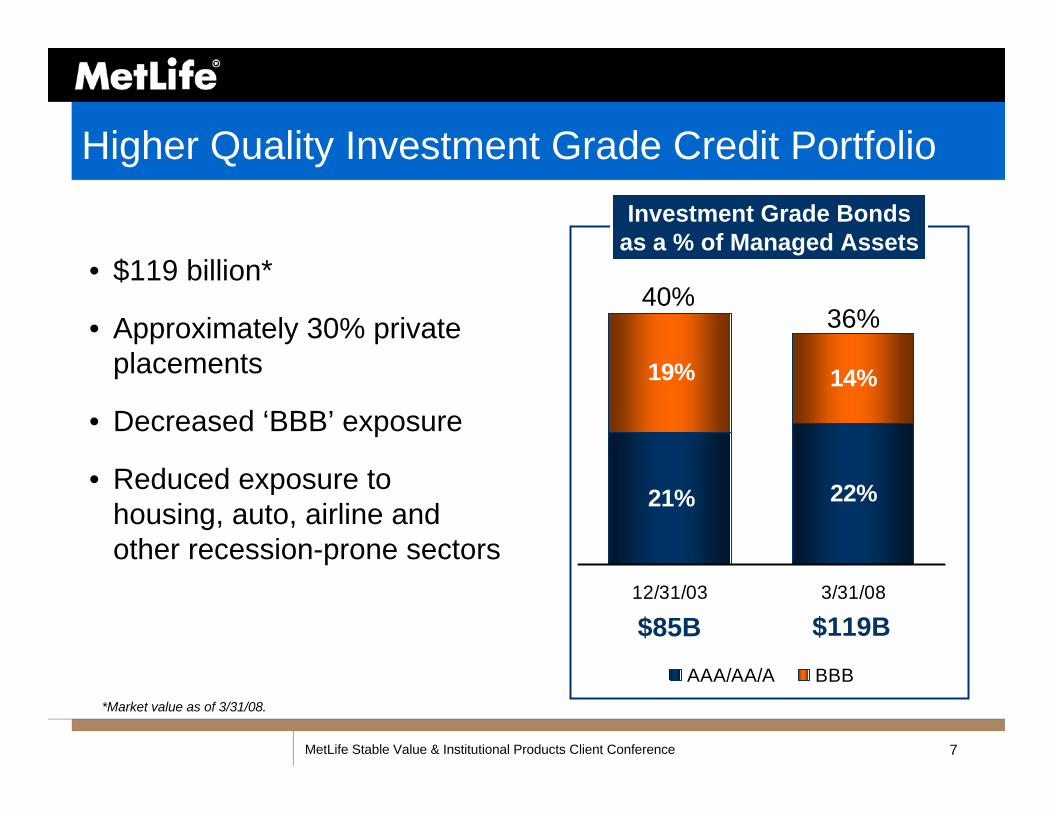
Higher Quality Investment Grade Credit Portfolio
• $119 billion*
• Approximately 30% private placements
• Decreased ‘BBB’ exposure
• Reduced exposure to housing, auto, airline and other recession-prone sectors
21% 22%
19% 14%
12/31/03 3/31/08
AAA/AA/A BBB
Investment Grade Bondsas a % of Managed Assets
*Market value as of 3/31/08.
40%36%
$85B $119B
7

MetLife Stable Value & Institutional Products Client Conference
Defensive Below Investment Grade Portfolio
32%32%
39%39%
15%15%
Public High Yield
EmergingMarkets
SecuredBankLoans
* As of 12/31/03Market value as of 3/31/08
Below Investment GradePortfolio Allocation
• Reduced below investment grade allocation from 5.9%* to 5.0% of managed assets
• Well diversified across asset classes
• Secured bank loans have grown from 15%* to 32% of portfolio
• Bank loans have historically exhibited lower default rates and higher recovery rates
ProjectFinance
Private High Yield
7%7%
7%7%
8
MetLife Stable Value & Institutional Products Client Conference
12/31/03 03/31/08
Asset Backed SecuritiesCommercial Mortgage Backed SecuritiesResidential Mortgage Backed Securities
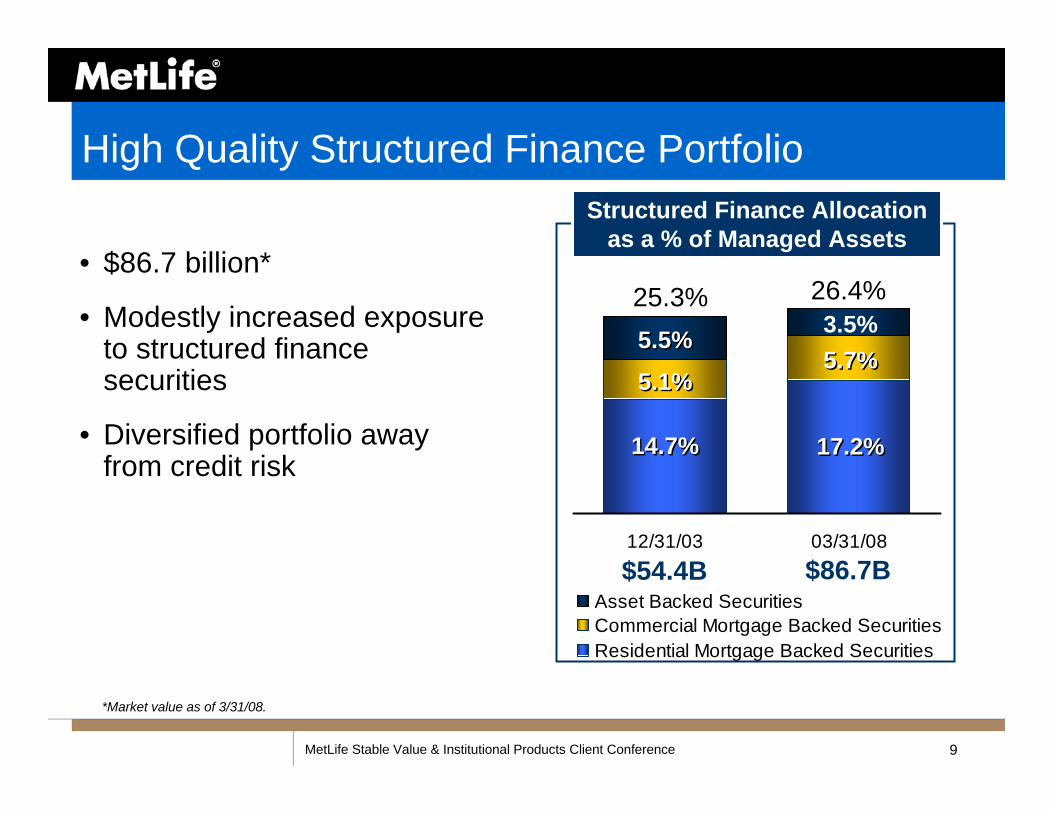
High Quality Structured Finance Portfolio
• $86.7 billion*
• Modestly increased exposure to structured finance securities
• Diversified portfolio away from credit risk
Structured Finance Allocationas a % of Managed Assets
*Market value as of 3/31/08.
$54.4B $86.7B
5.5%5.5%
5.1%5.1%
14.7%14.7% 17.2%17.2%
5.7%5.7%3.5%
26.4%25.3%
9
MetLife Stable Value & Institutional Products Client Conference
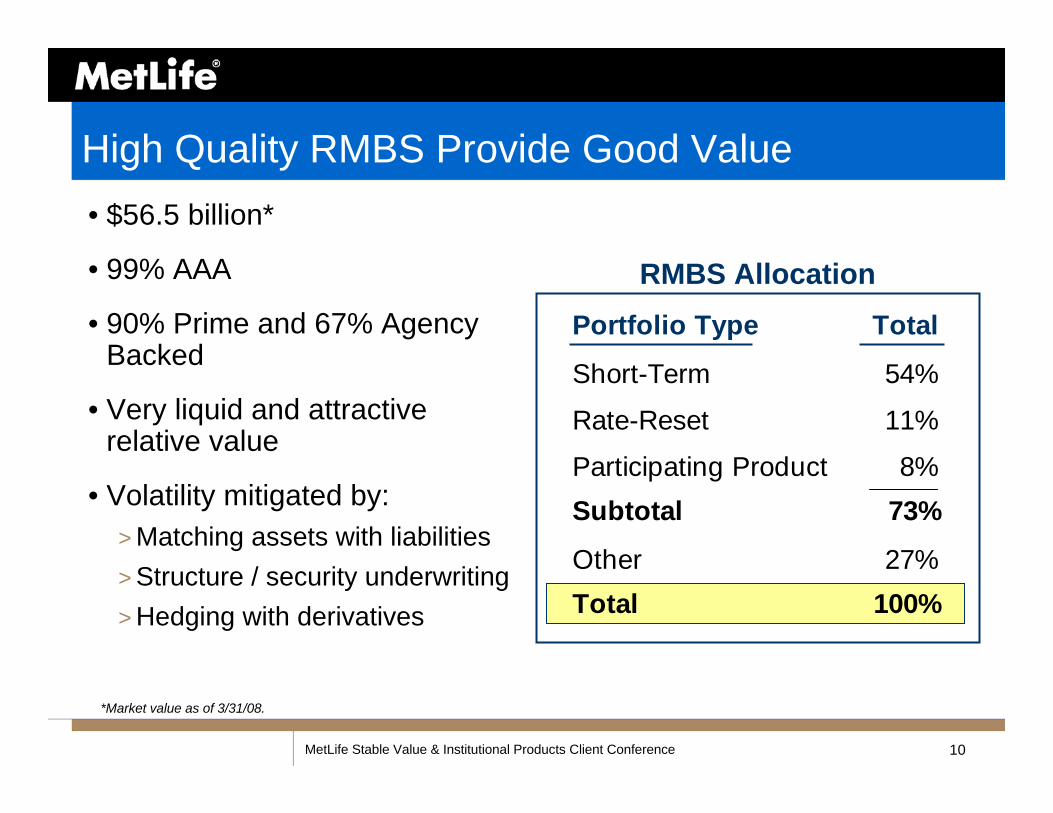
High Quality RMBS Provide Good Value• $56.5 billion*
• 99% AAA
• 90% Prime and 67% Agency Backed
• Very liquid and attractiverelative value
• Volatility mitigated by:> Matching assets with liabilities> Structure / security underwriting> Hedging with derivatives
Portfolio Type Total
Short-Term 54%
Rate-Reset 11%
Participating Product 8%Subtotal 73%
Other 27%Total 100%
*Market value as of 3/31/08.
RMBS Allocation
10
MetLife Stable Value & Institutional Products Client Conference
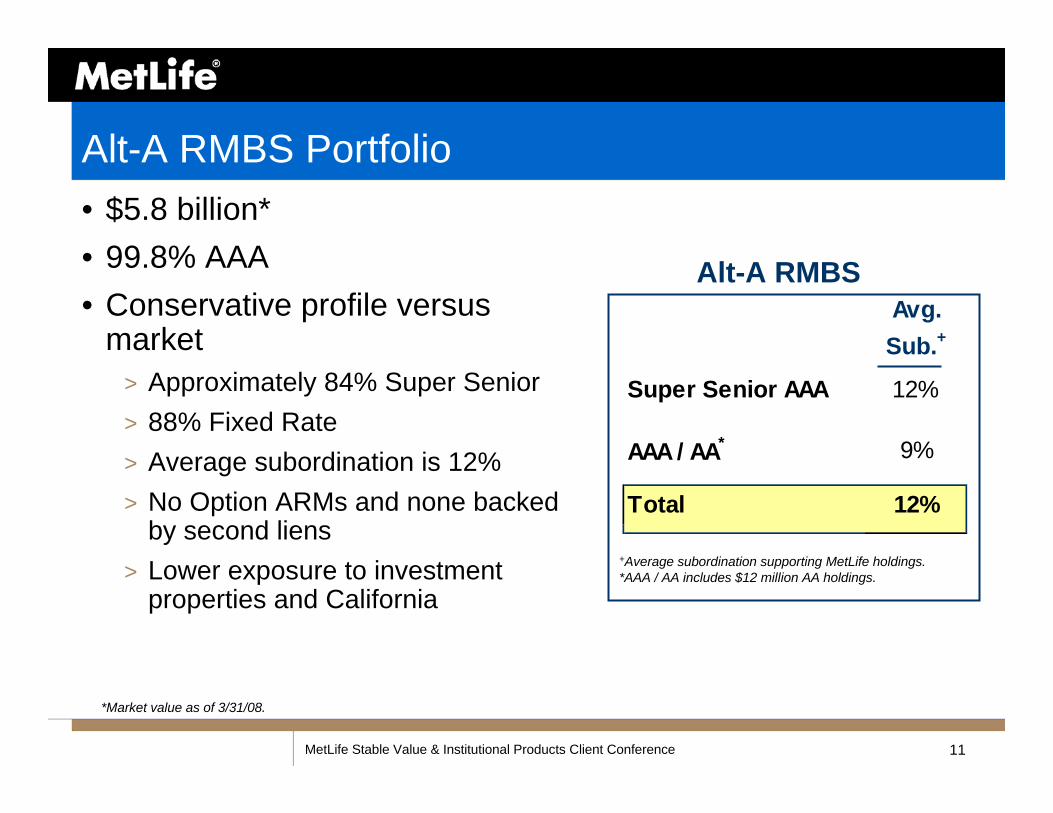
Alt-A RMBS Portfolio• $5.8 billion*• 99.8% AAA• Conservative profile versus
market> Approximately 84% Super Senior> 88% Fixed Rate> Average subordination is 12%> No Option ARMs and none backed
by second liens> Lower exposure to investment
properties and California
Avg. Sub.+
Super Senior AAA 12%
AAA / AA* 9%
Total 12%
*Market value as of 3/31/08.
+Average subordination supporting MetLife holdings. *AAA / AA includes $12 million AA holdings.
Alt-A RMBS
11

MetLife Stable Value & Institutional Products Client Conference
Identified Sub-Prime Risk Early
$0
$1,000
$2,000
$3,000
$4,000
Dec-05 Dec-06 Dec-07 Mar-08
AAA/AA
A and Below
Stopped purchasing ‘A’ and lower tranches in late 2004Reduced exposure by 46% from year-end 2005 to March 31, 2008
Sub-Prime Mortgage Holdings($ Millions)
$3,547
$3,032
$2,222$1,925
12

MetLife Stable Value & Institutional Products Client Conference
5%
90%
2%3%
• $18.6 billion*
• 95% AAA/AA
• 74% from 2005 and prior vintages
• Provide long duration assets and portfolio diversification
Commercial Mortgage-Backed Securities
*Market value as of 3/31/08.
AAAAA
ABBB & Below
Total CMBS
13
MetLife Stable Value & Institutional Products Client Conference
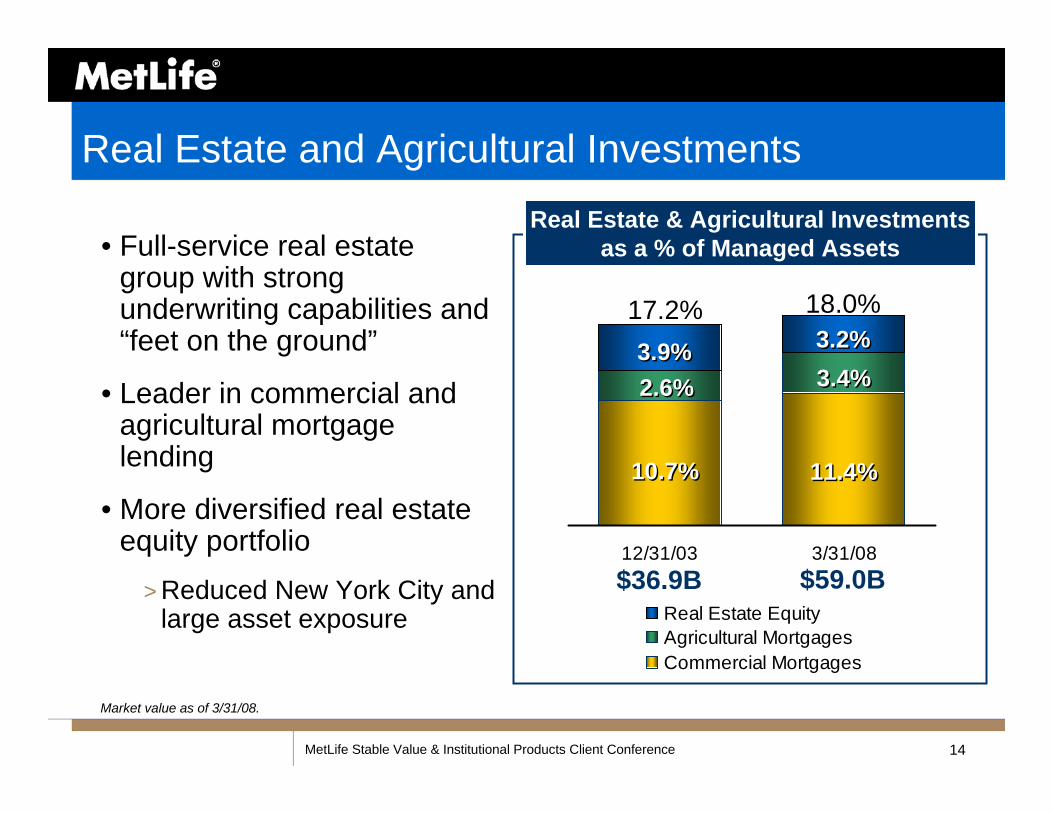
Real Estate and Agricultural Investments
12/31/03 3/31/08
Real Estate EquityAgricultural MortgagesCommercial Mortgages
Real Estate & Agricultural Investmentsas a % of Managed Assets
$36.9B $59.0B
3.9%3.9%2.6%2.6%
10.7%10.7% 11.4%11.4%
3.4%3.4%3.2%3.2%
18.0%17.2%
• Full-service real estate group with strong underwriting capabilities and “feet on the ground”
• Leader in commercial and agricultural mortgage lending
• More diversified real estate equity portfolio
> Reduced New York City and large asset exposure
Market value as of 3/31/08.
14
MetLife Stable Value & Institutional Products Client Conference
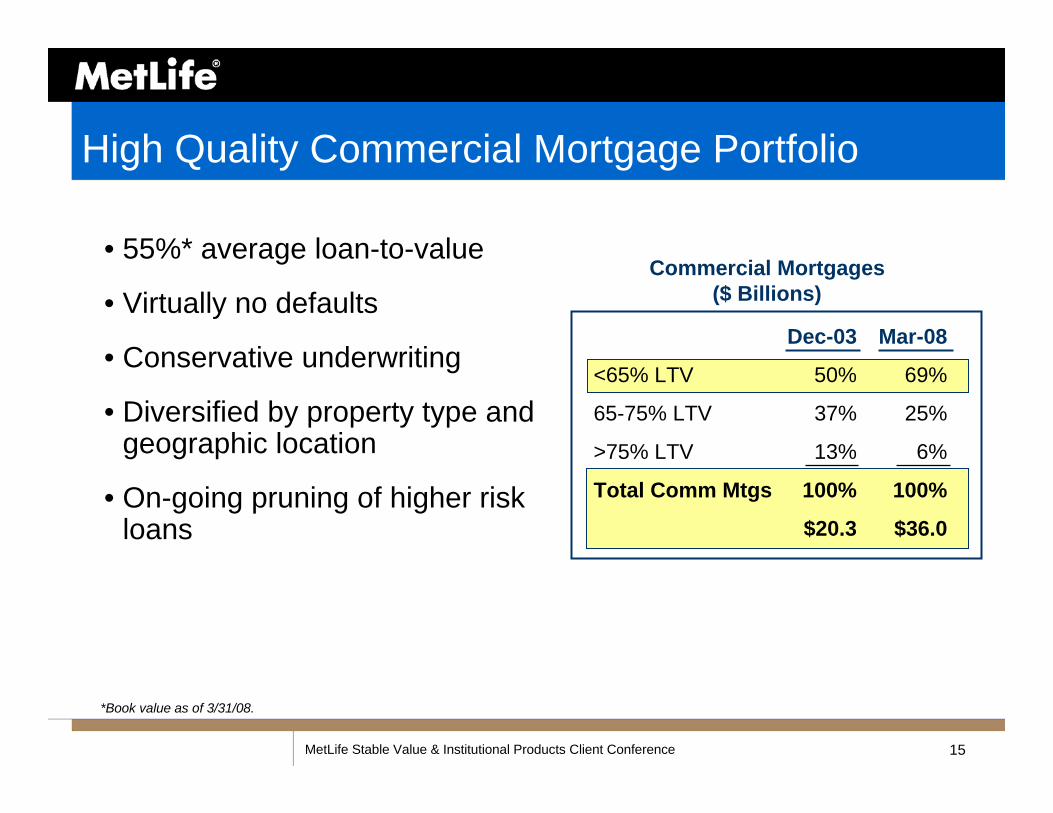
High Quality Commercial Mortgage Portfolio
• 55%* average loan-to-value
• Virtually no defaults
• Conservative underwriting
• Diversified by property type and geographic location
• On-going pruning of higher risk loans
Commercial Mortgages($ Billions)
Dec-03 Mar-08
<65% LTV 50% 69%
65-75% LTV 37% 25%
>75% LTV 13% 6%
Total Comm Mtgs 100% 100%
$20.3 $36.0
*Book value as of 3/31/08.
15

MetLife Stable Value & Institutional Products Client Conference
65%66%
63%62%
61%
53%
50%
55%
60%
65%
70%
75%
2003 2004 2005 2006 2007 3/31/2008
70%
Source for market data: Moody’s Investors Service
Average Market LTV
Target Lower Risk Commercial Mortgages
AverageLoan to Value
MetLife LTV vs. Market LTV at Loan Origination
MetLife LTV
16
MetLife Stable Value & Institutional Products Client Conference
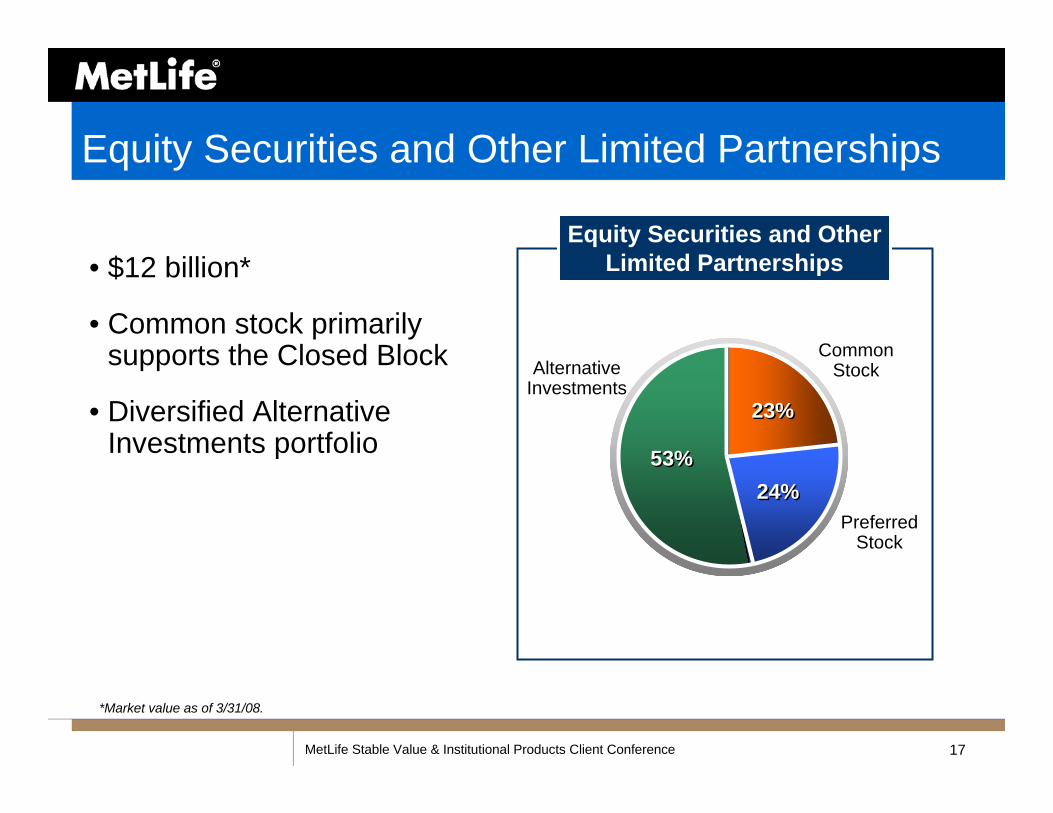
Equity Securities and Other Limited Partnerships
• $12 billion*
• Common stock primarily supports the Closed Block
• Diversified Alternative Investments portfolio
Equity Securities and OtherLimited Partnerships
CommonStock
*Market value as of 3/31/08.
53%53%
23%23%
24%24%
Alternative Investments
PreferredStock
17
MetLife Stable Value & Institutional Products Client Conference
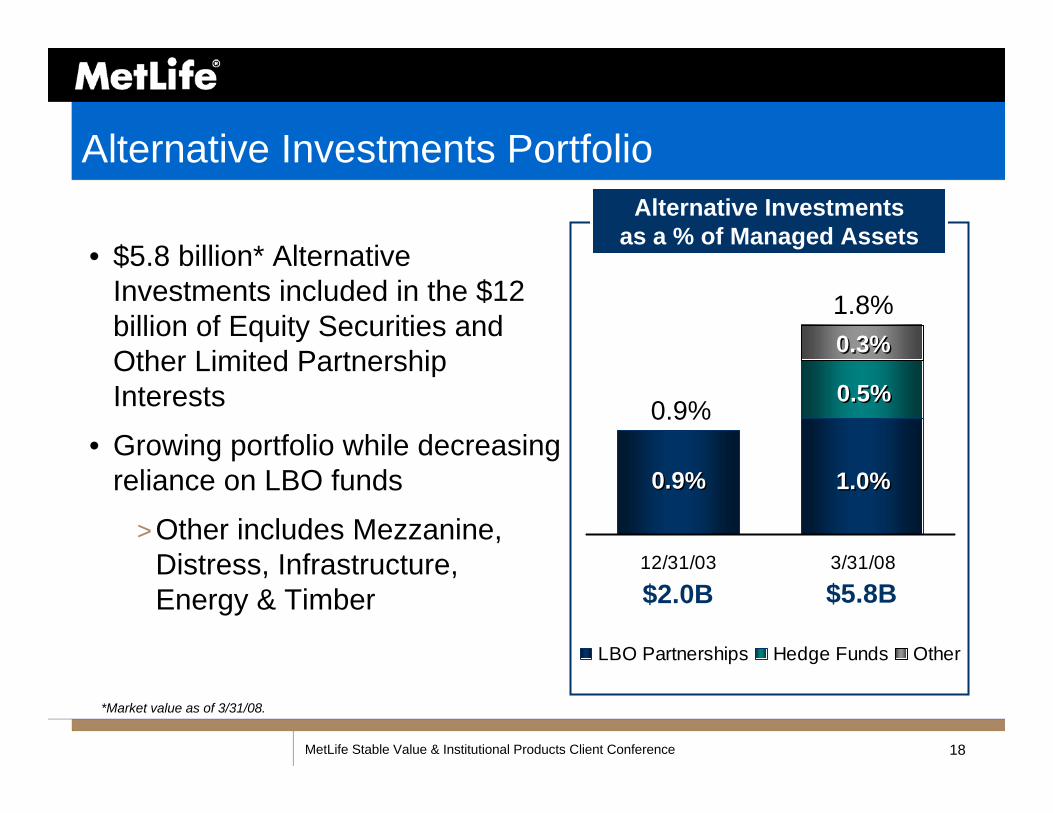
Alternative Investments Portfolio
• $5.8 billion* Alternative Investments included in the $12 billion of Equity Securities and Other Limited Partnership Interests
• Growing portfolio while decreasing reliance on LBO funds
> Other includes Mezzanine, Distress, Infrastructure,Energy & Timber
*Market value as of 3/31/08.
12/31/03 3/31/08
LBO Partnerships Hedge Funds Other
Alternative Investmentsas a % of Managed Assets
$2.0B $5.8B
0.9%0.9% 1.0%1.0%
0.5%0.5%
0.3%0.3%1.8%
0.9%
18
MetLife Stable Value & Institutional Products Client Conference
68%
8%9%
15%
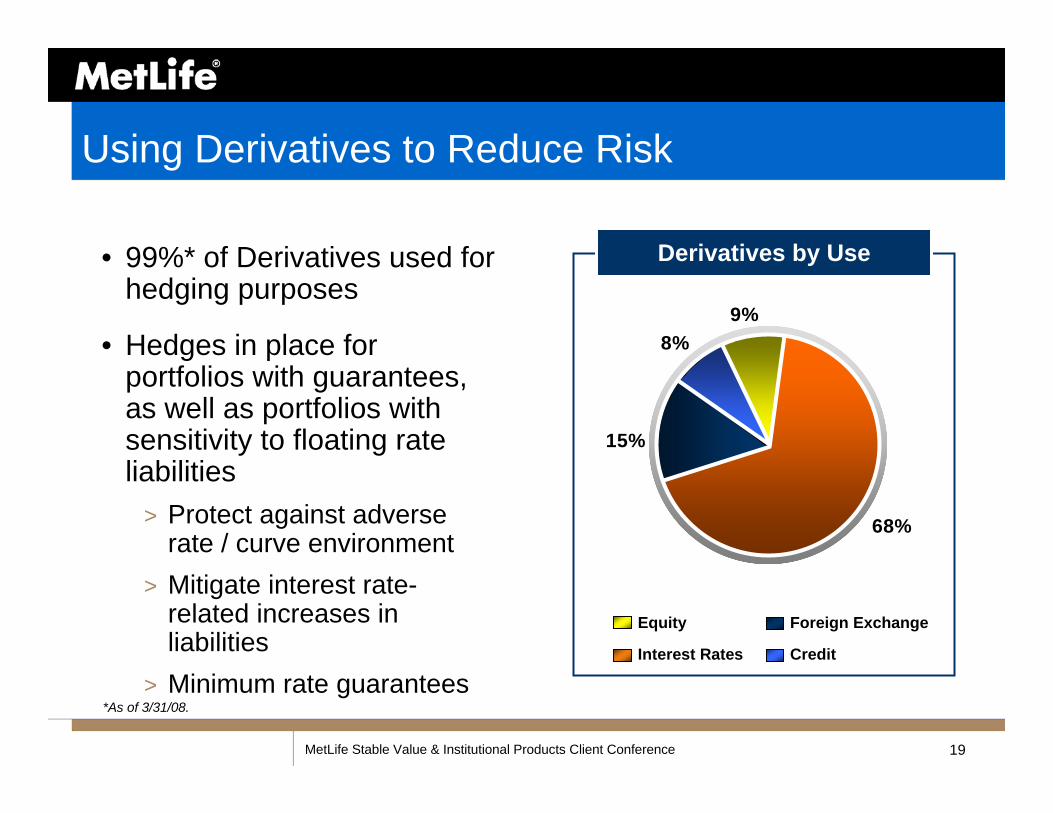
Using Derivatives to Reduce Risk
• 99%* of Derivatives used for hedging purposes
• Hedges in place for portfolios with guarantees, as well as portfolios with sensitivity to floating rate liabilities
> Protect against adverse rate / curve environment
> Mitigate interest rate-related increases in liabilities
> Minimum rate guarantees*As of 3/31/08.
Derivatives by Use
Equity
Interest Rates
Foreign Exchange
Credit
19
MetLife Stable Value & Institutional Products Client Conference
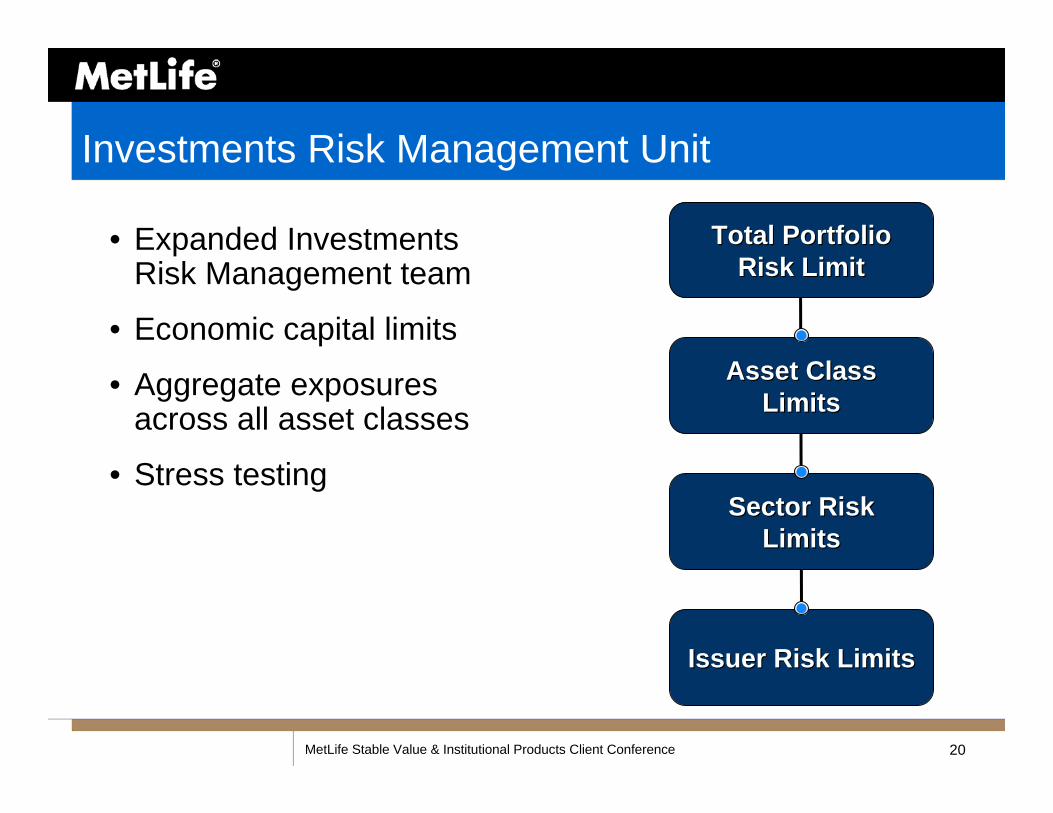
Investments Risk Management Unit
• Expanded Investments Risk Management team
• Economic capital limits
• Aggregate exposures across all asset classes
• Stress testing
Total Portfolio Total Portfolio Risk LimitRisk Limit
Asset ClassAsset ClassLimitsLimits
Sector RiskSector RiskLimitsLimits
Issuer Risk LimitsIssuer Risk Limits
20
MetLife Stable Value & Institutional Products Client Conference
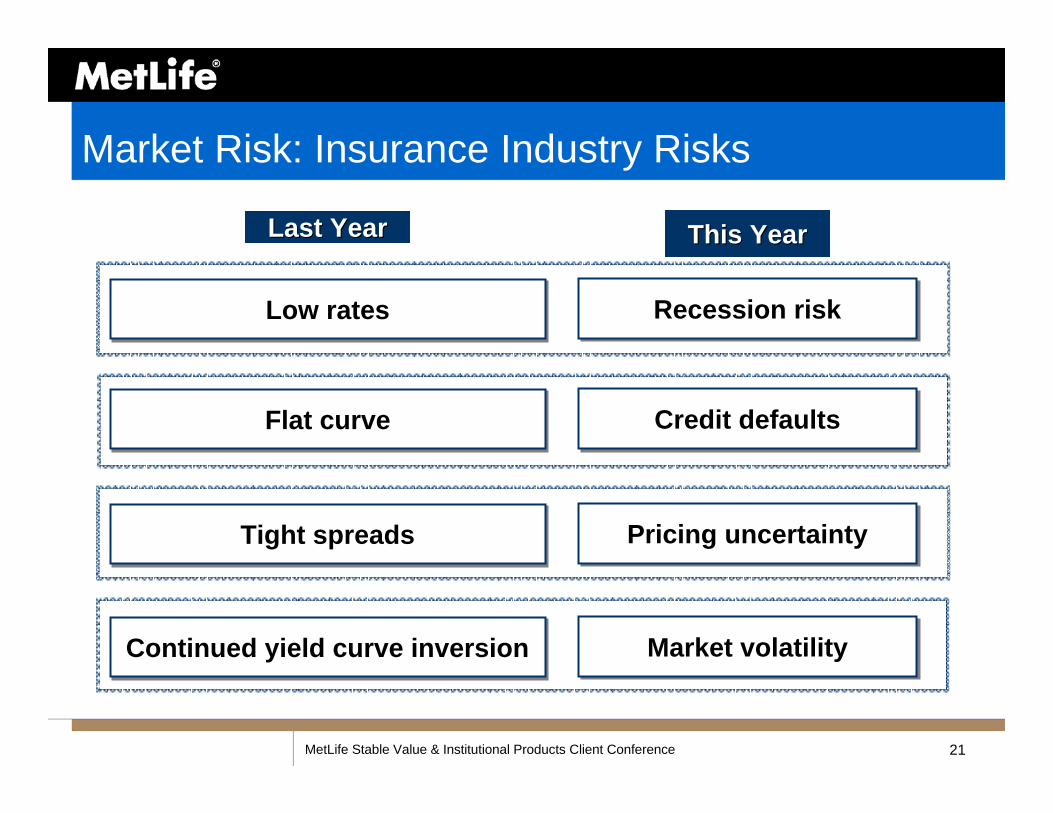
Market Risk: Insurance Industry Risks
Last YearLast Year This YearThis Year
Low ratesLow rates Recession riskRecession risk
Flat curveFlat curve Credit defaultsCredit defaults
Tight spreadsTight spreads Pricing uncertaintyPricing uncertainty
Continued yield curve inversionContinued yield curve inversion Market volatilityMarket volatility
21
MetLife Stable Value & Institutional Products Client Conference
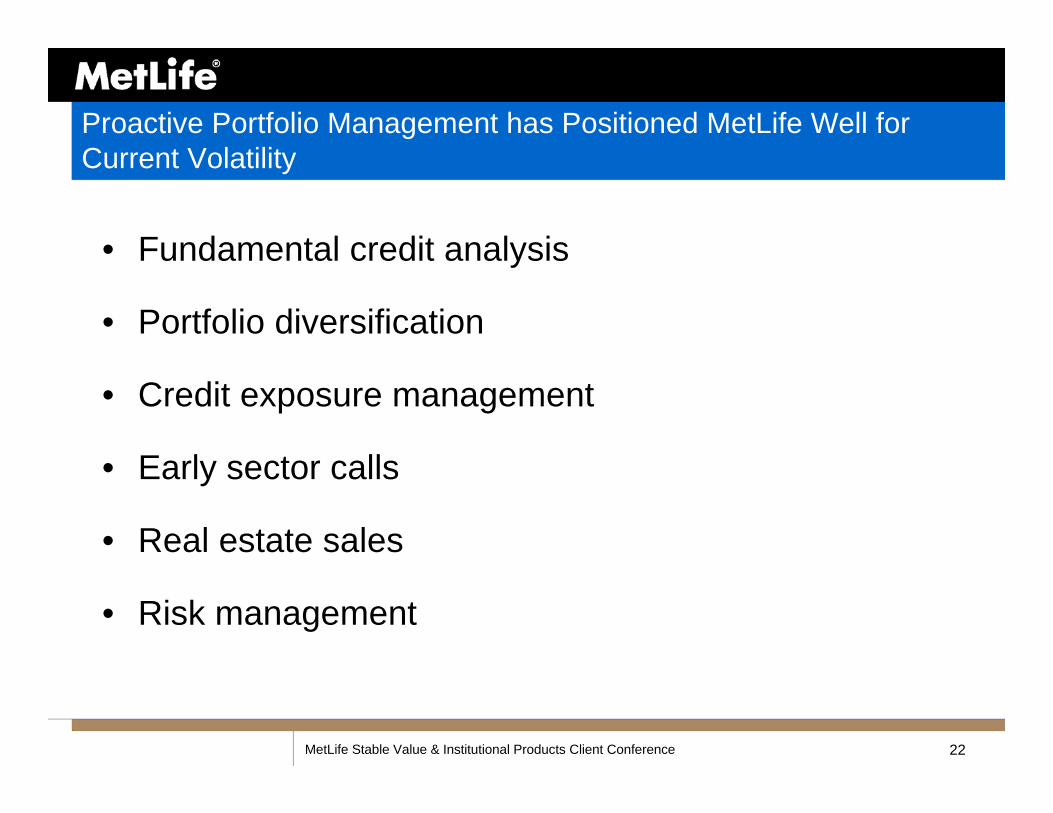
Proactive Portfolio Management has Positioned MetLife Well for Current Volatility
• Fundamental credit analysis
• Portfolio diversification
• Credit exposure management
• Early sector calls
• Real estate sales
• Risk management
22


MetLife Stable Value & Institutional Products Client Conference
MetLife Institutional Business
William J. Mullaney
President
MetLife Stable Value & Institutional Products Client Conference
MetLife Stable Value & Institutional Products Client Conference
Agenda> Institutional Business Overview
> Financial Highlights
> Growth Opportunities
> Wrap-Up
2
MetLife Stable Value & Institutional Products Client Conference
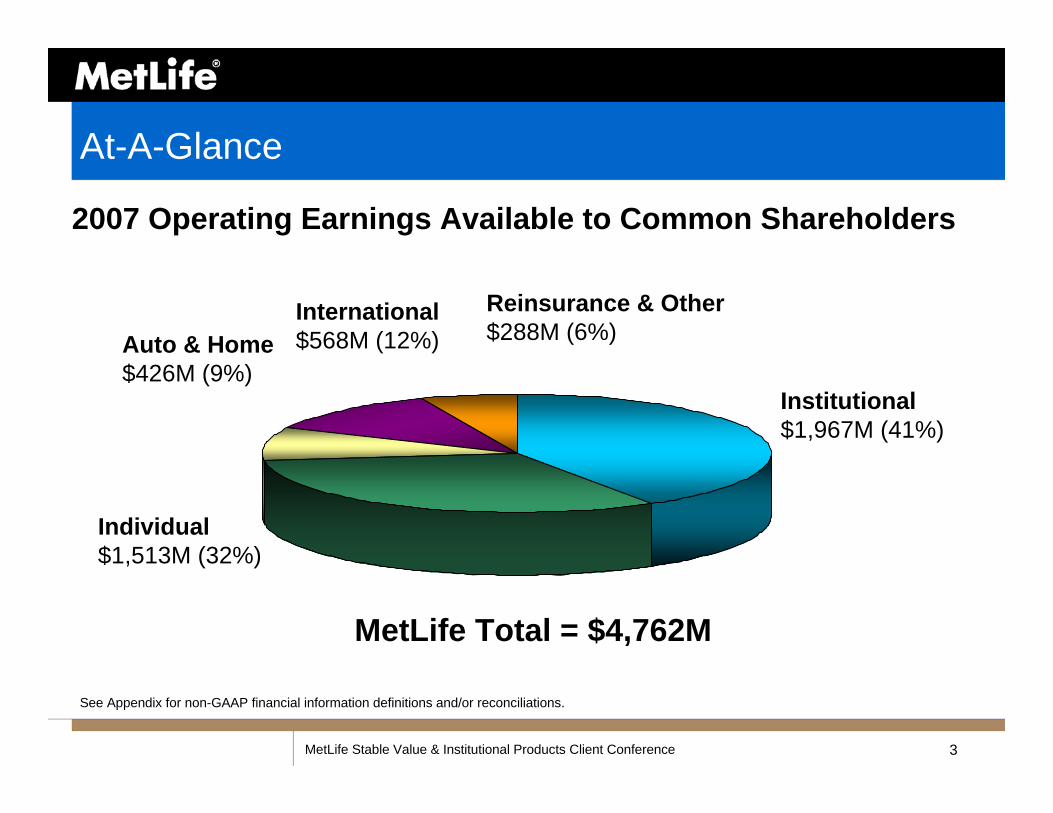
2007 Operating Earnings Available to Common Shareholders
At-A-Glance
MetLife Total = $4,762M
Reinsurance & Other $288M (6%)
International $568M (12%)Auto & Home
$426M (9%)
Individual $1,513M (32%)
Institutional $1,967M (41%)
See Appendix for non-GAAP financial information definitions and/or reconciliations.
3
MetLife Stable Value & Institutional Products Client Conference
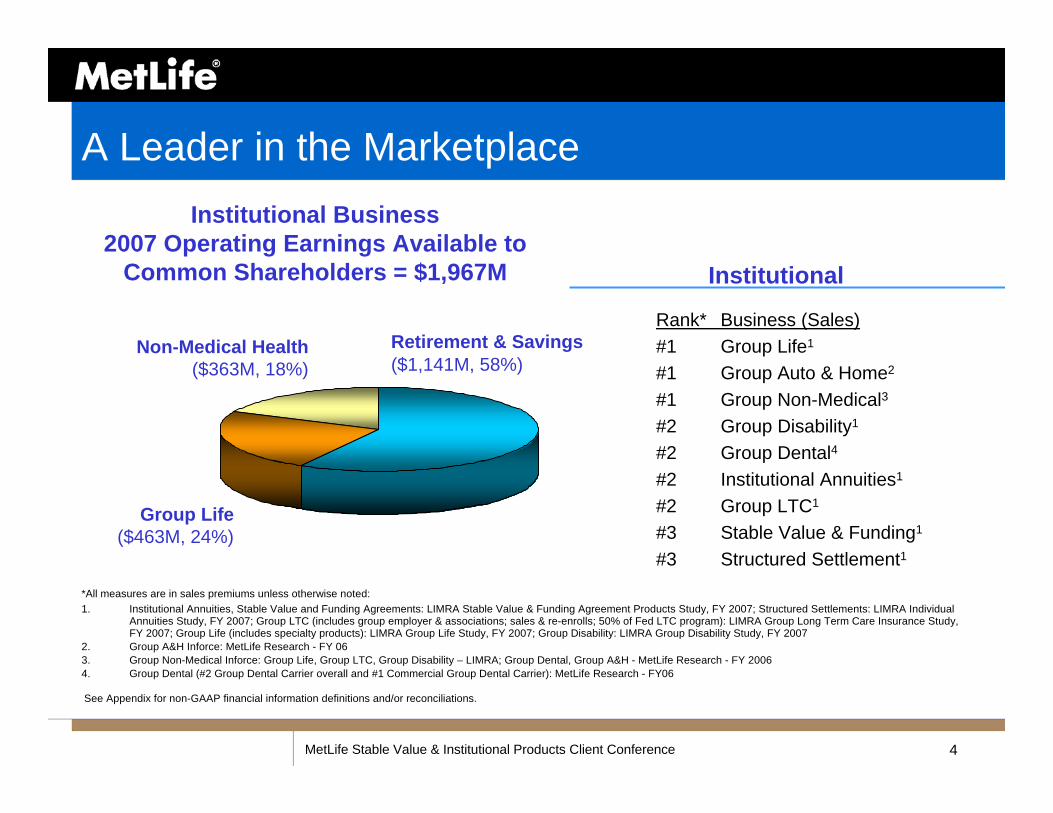
Retirement & Savings($1,141M, 58%)
Group Life($463M, 24%)
Non-Medical Health($363M, 18%)
Institutional Business2007 Operating Earnings Available to
Common Shareholders = $1,967M
A Leader in the Marketplace
Institutional
Rank* Business (Sales)#1 Group Life1
#1 Group Auto & Home2
#1 Group Non-Medical3
#2 Group Disability1
#2 Group Dental4
#2 Institutional Annuities1
#2 Group LTC1
#3 Stable Value & Funding1
#3 Structured Settlement1
*All measures are in sales premiums unless otherwise noted:1. Institutional Annuities, Stable Value and Funding Agreements: LIMRA Stable Value & Funding Agreement Products Study, FY 2007; Structured Settlements: LIMRA Individual
Annuities Study, FY 2007; Group LTC (includes group employer & associations; sales & re-enrolls; 50% of Fed LTC program): LIMRA Group Long Term Care Insurance Study, FY 2007; Group Life (includes specialty products): LIMRA Group Life Study, FY 2007; Group Disability: LIMRA Group Disability Study, FY 2007
2. Group A&H Inforce: MetLife Research - FY 063. Group Non-Medical Inforce: Group Life, Group LTC, Group Disability – LIMRA; Group Dental, Group A&H - MetLife Research - FY 20064. Group Dental (#2 Group Dental Carrier overall and #1 Commercial Group Dental Carrier): MetLife Research - FY06
See Appendix for non-GAAP financial information definitions and/or reconciliations.
4
MetLife Stable Value & Institutional Products Client Conference
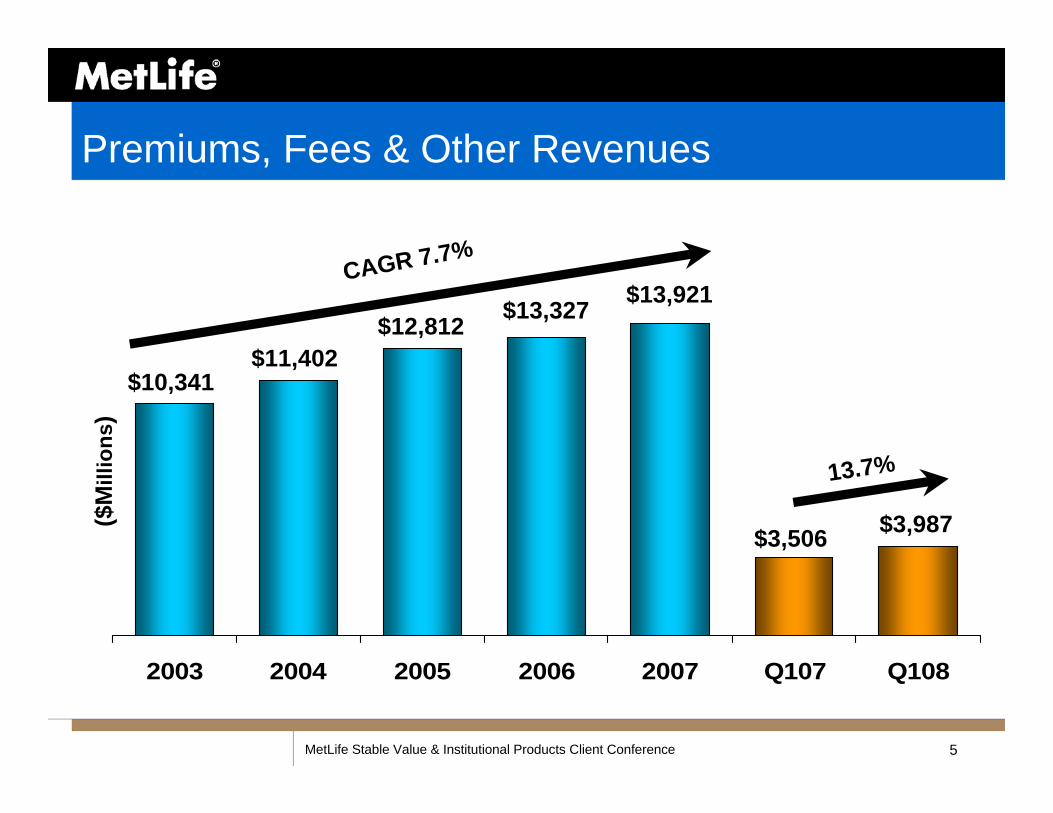
Premiums, Fees & Other Revenues
2003 2004 2005 2006 2007 Q107 Q108
CAGR 7.7%
($M
illio
ns)
13.7%
$3,506 $3,987
$10,341$11,402
$12,812 $13,327 $13,921
5
MetLife Stable Value & Institutional Products Client Conference
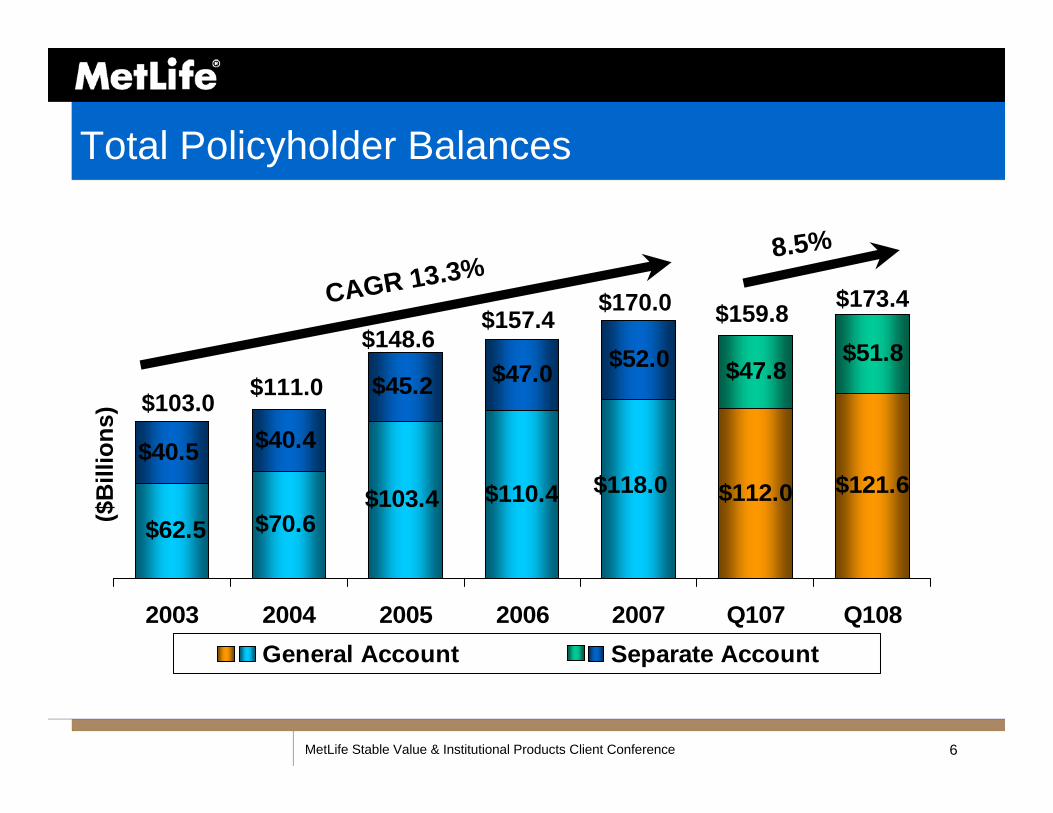
Total Policyholder Balances
$112.0 $121.6$40.5 $40.4
$45.2 $47.8
$110.4$103.4$70.6$62.5
$118.0
$47.0 $52.0 $51.8
2003 2004 2005 2006 2007 Q107 Q108General Account Separate Account
($B
illio
ns)
CAGR 13.3%
$103.0 $111.0
$148.6$157.4
$170.0 $173.4$159.8
8.5%
6

MetLife Stable Value & Institutional Products Client Conference
Operating Earnings Available to Common Shareholders
2003 2004 2005 2006 2007 Q107 Q108
CAGR 17.0%
($M
illio
ns)
23.5%
$452 $558
$1,051$1,249
$1,445$1,700
$1,967
See Appendix for non-GAAP financial information definitions and/or reconciliations.
7
MetLife Stable Value & Institutional Products Client Conference
Institutional Drivers
> Maintain strong fundamentals> Top line growth in all segments> Market share growth and margin improvement> Steeper yield curve> Lower equity and hedge fund returns> Market liquidity
8
MetLife Stable Value & Institutional Products Client Conference
$0
$3
$6
$9
$12
$15
MetLifeA B C D E F G H I
Auto & HomeLTCDisabilityDentalLife
($ Billions)($ Billions)
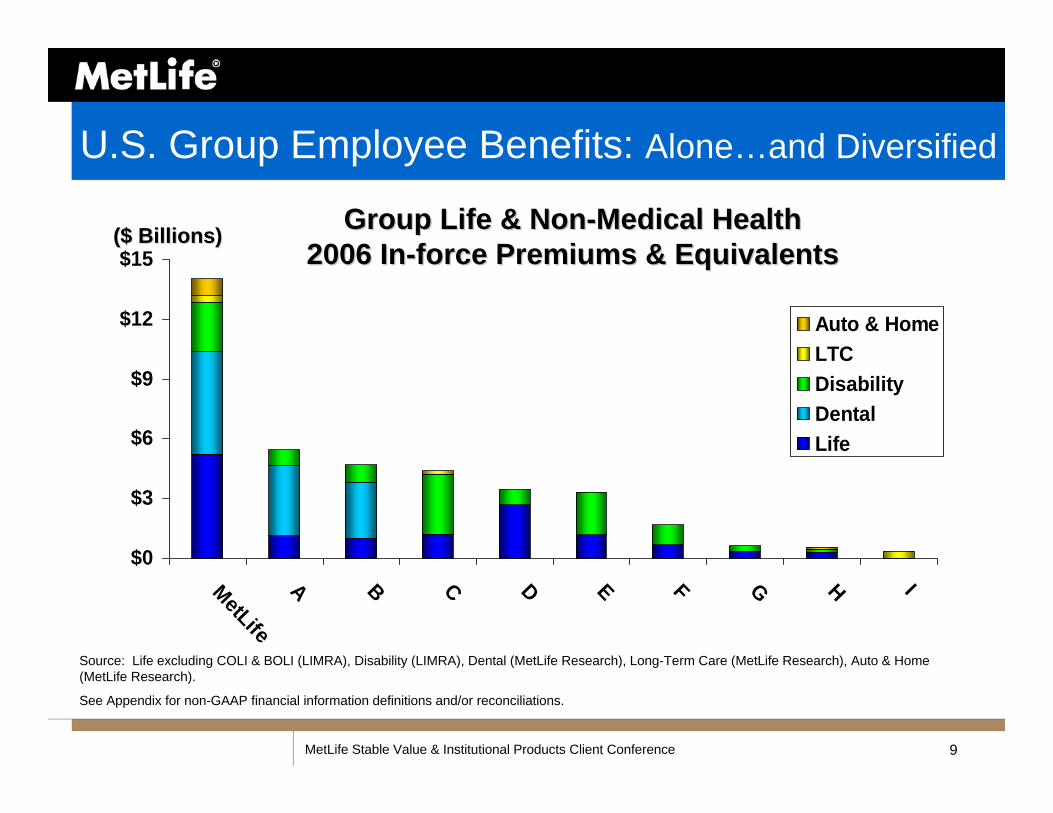
U.S. Group Employee Benefits: Alone…and Diversified
Group Life & NonGroup Life & Non--Medical HealthMedical Health2006 In2006 In--force Premiums & Equivalentsforce Premiums & Equivalents
Source: Life excluding COLI & BOLI (LIMRA), Disability (LIMRA), Dental (MetLife Research), Long-Term Care (MetLife Research), Auto & Home (MetLife Research).
See Appendix for non-GAAP financial information definitions and/or reconciliations.
9
MetLife Stable Value & Institutional Products Client Conference
Life & Non-Medical Health: Key 2008 Initiatives
> Thought Leadership
> Global Account Management
> Integration of Safeguard
> Investment in Group Disability
10
MetLife Stable Value & Institutional Products Client Conference
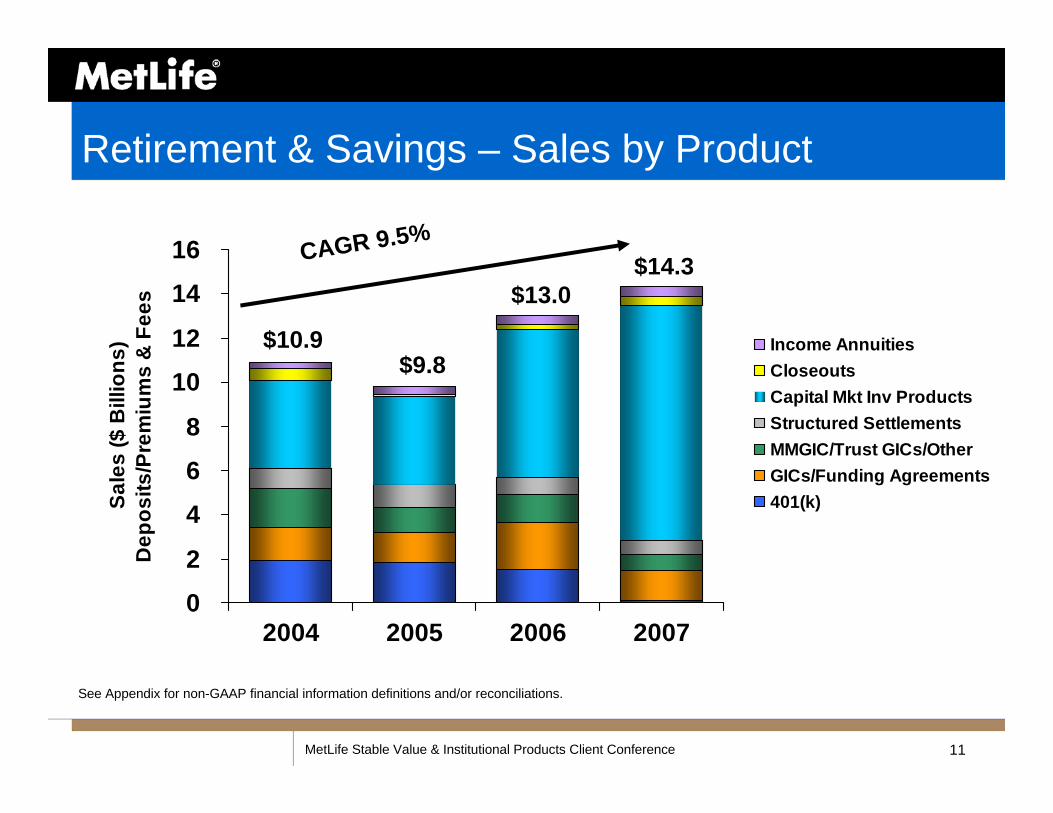
Retirement & Savings – Sales by Product
0
2
4
6
8
10
12
14
16
2004 2005 2006 2007
Sale
s ($
Bill
ions
) D
epos
its/P
rem
ium
s &
Fee
s
Income AnnuitiesCloseoutsCapital Mkt Inv ProductsStructured SettlementsMMGIC/Trust GICs/OtherGICs/Funding Agreements401(k)
CAGR 9.5%
$9.8
$13.0
$10.9
$14.3
See Appendix for non-GAAP financial information definitions and/or reconciliations.
11
MetLife Stable Value & Institutional Products Client Conference
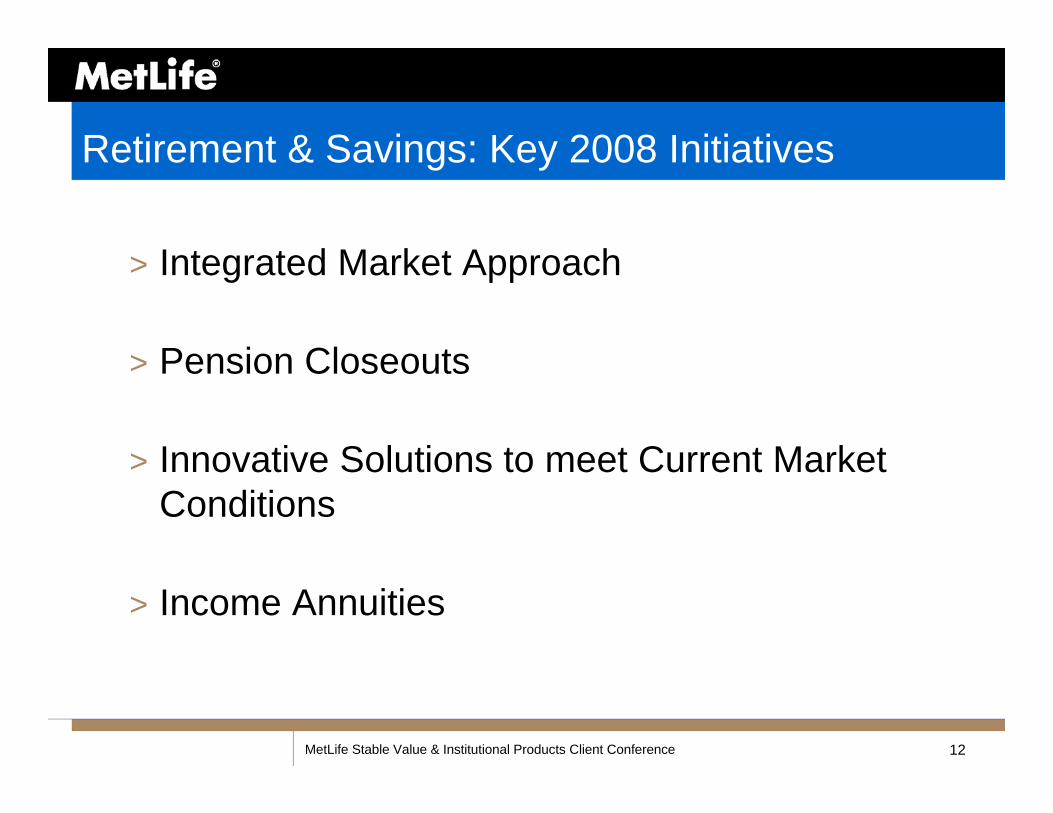
Retirement & Savings: Key 2008 Initiatives
> Integrated Market Approach
> Pension Closeouts
> Innovative Solutions to meet Current Market Conditions
> Income Annuities
12

MetLife Stable Value & Institutional Products Client Conference
Wrap-Up
> Strong record of revenue and earnings growth
> Proven market leadership
> Innovative products and services
> Well positioned to capitalize on significant growth opportunities
13

Appendix
Definitions and Reconciliations of Non-GAAP Financial Information
June 19, 2008

MetLife Stable Value & Institutional Products Client Conference
Explanatory Note on Non-GAAP Financial Information
The historical and forward-looking financial information presented at this conference and contained in these presentations include performance measures which are based on methodologies other than Generally Accepted Accounting Principles (“GAAP”). MetLife analyzes its performance using so-called non-GAAP measures, including operating earnings, operating earnings available to common shareholders, operating earnings available to common shareholders per diluted common share and operating return on common equity. MetLife believes these measures enhance the understanding and comparability of its performance by excluding net investment gains and losses, net of income tax, and adjustments related to net investment gains and losses, net of income tax, both of which can fluctuate significantly from period to period, the impact of the cumulative effect of a change in accounting, net of income tax, and discontinued operations other than discontinued real estate, net of income tax, thereby highlighting the results from operations and the underlying profitability drivers of the business.
Operating earnings is defined as GAAP net income, excluding net investment gains and losses, net of income tax, adjustments related to net investment gains and losses, net of income tax, the impact of the cumulative effect of a change in accounting, net of income tax, and discontinued operations other than discontinued real estate, net of income tax. Scheduled settlement payments on derivative instruments not qualifying for hedge accounting treatment are included in operating earnings.
Operating earnings available to common shareholders is defined as operating earnings less preferred stock dividends, which are recorded in Corporate & Other. All references in these slides and in the presentations made at this conference to “operating earnings” for 2005 and future years should be read as references to “operating earnings available to common shareholders.”
Operating earnings available to common shareholders per diluted common share is calculated by dividing operating earnings available to common shareholders (as defined above) by the number of weighted average diluted common shares outstanding for the period indicated. All references in these slides and in the presentations made at this conference to “operating earnings per share” for 2005 and future years should be read as references to “operating earnings available to common shareholders per diluted common share.”
2

MetLife Stable Value & Institutional Products Client Conference
Explanatory Note on Non-GAAP Financial Information (Continued)
Operating return on common equity is calculated by dividing operating earnings available to common shareholders (as defined above) by average common equity for the period indicated, excluding accumulated other comprehensive income.
For the historical periods presented, reconciliations of non-GAAP measures used in the presentations made at this conference to the most directly comparable GAAP measures are included in the Appendix to the presentation materials and are available on the Investor Relations portion of the Company’s website (www.metlife.com). Additional information about MetLife’s historical financial results is available in the Company’s Quarterly Financial Supplements which may be accessed through the Investor Relations portion of the Company’s website. The non-GAAP measures used in the presentations made at this conference should not be viewed as substitutes for the most directly comparable GAAP measures.
In the presentations made at this conference, MetLife provides guidance on its future earnings, earnings per share and return on common equity on an operating, non-GAAP basis. A reconciliation of these measures to the most directly comparable GAAP measures is not accessible on a forward-looking basis because MetLife believes it is not possible to provide a reliable forecast of net investment gains and losses, which can fluctuate significantly from period to period and may have a significant impact on GAAP net income.
3
MetLife Stable Value & Institutional Products Client Conference
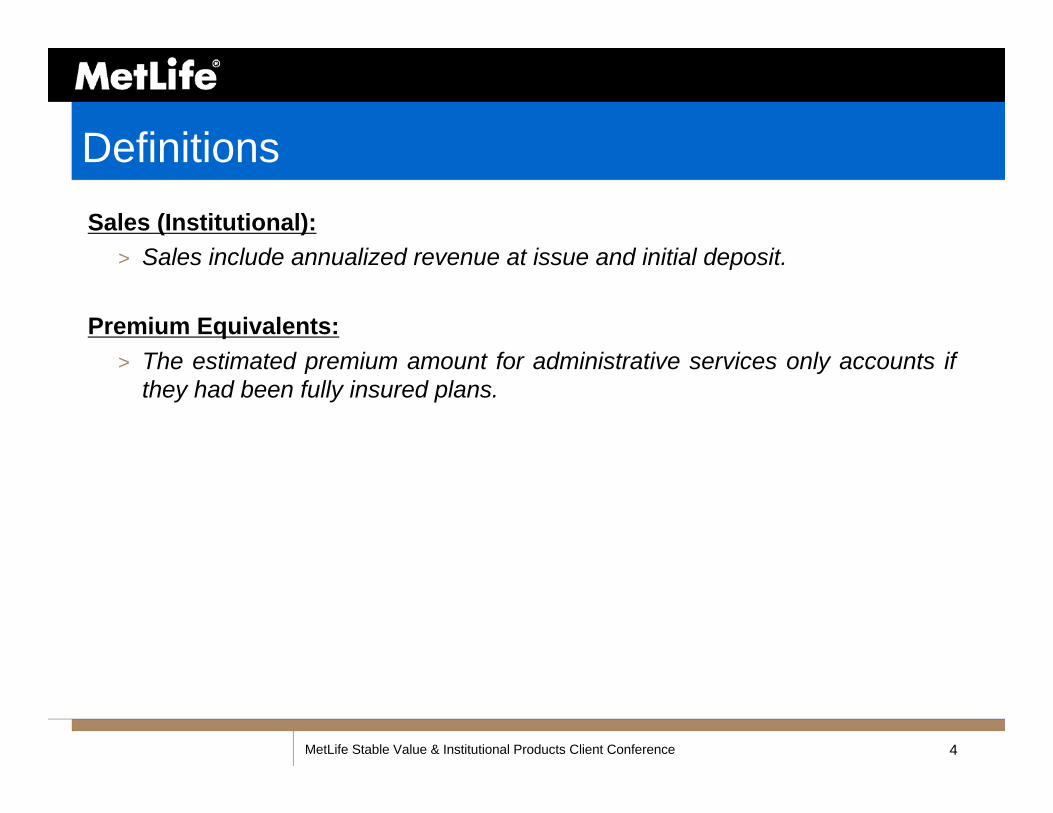
DefinitionsSales (Institutional):
> Sales include annualized revenue at issue and initial deposit.
Premium Equivalents:> The estimated premium amount for administrative services only accounts if
they had been fully insured plans.
4
MetLife Stable Value & Institutional Products Client Conference
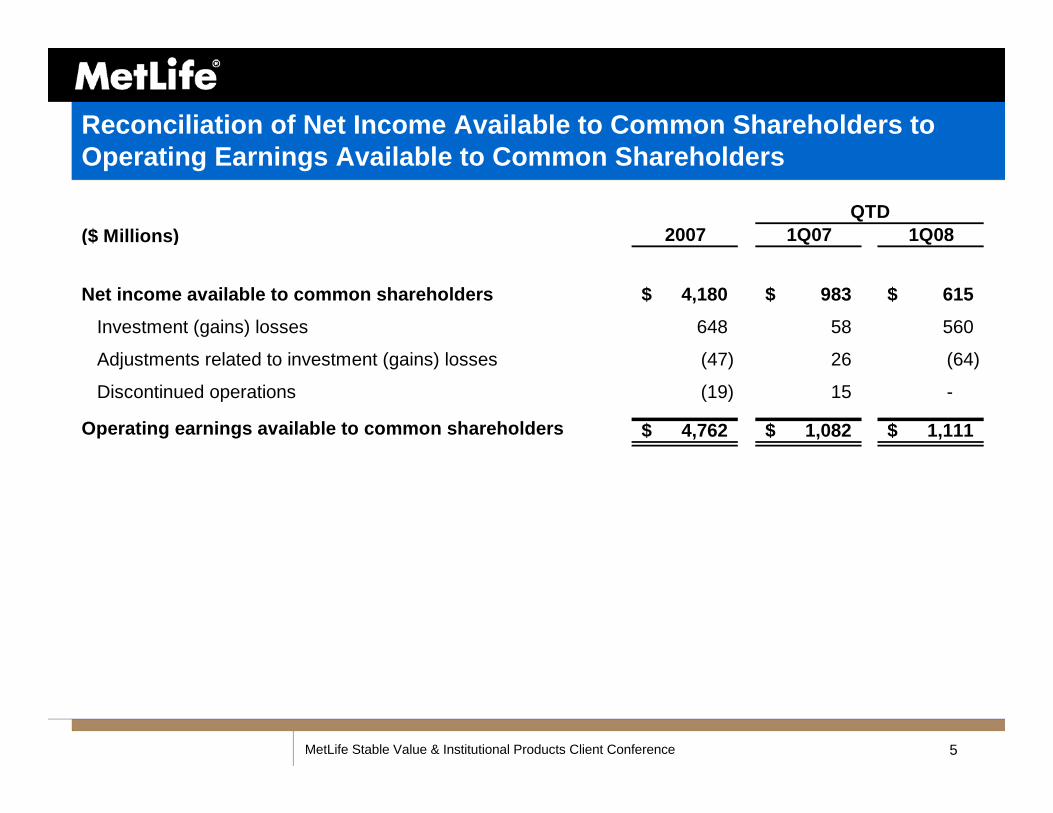
Reconciliation of Net Income Available to Common Shareholders toOperating Earnings Available to Common Shareholders
($ Millions) 2007 1Q07 1Q08
Net income available to common shareholders 4,180$ 983$ 615$
Investment (gains) losses 648 58 560
Adjustments related to investment (gains) losses (47) 26 (64)
Discontinued operations (19) 15 -
Operating earnings available to common shareholders 4,762$ 1,082$ 1,111$
QTD
5
MetLife Stable Value & Institutional Products Client Conference
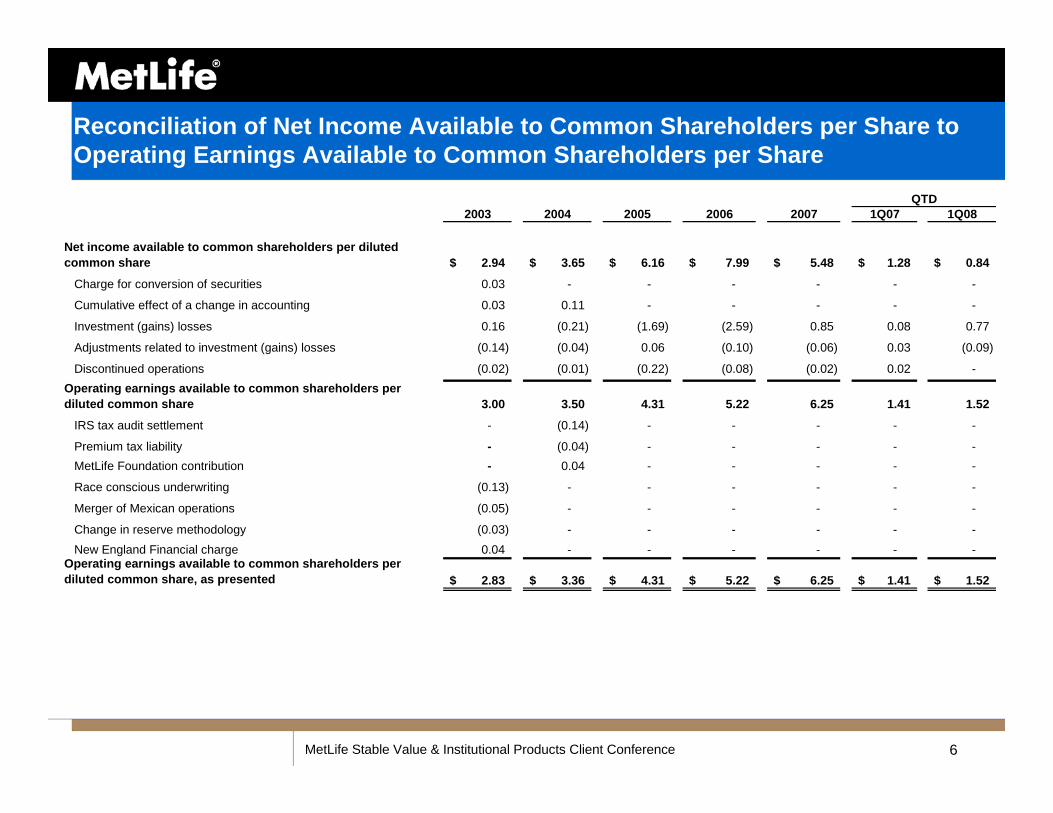
Reconciliation of Net Income Available to Common Shareholders per Share to Operating Earnings Available to Common Shareholders per Share
2003 2004 2005 2006 2007 1Q07 1Q08
Net income available to common shareholders per diluted common share 2.94$ 3.65$ 6.16$ 7.99$ 5.48$ 1.28$ 0.84$
Charge for conversion of securities 0.03 - - - - - -
Cumulative effect of a change in accounting 0.03 0.11 - - - - -
Investment (gains) losses 0.16 (0.21) (1.69) (2.59) 0.85 0.08 0.77
Adjustments related to investment (gains) losses (0.14) (0.04) 0.06 (0.10) (0.06) 0.03 (0.09)
Discontinued operations (0.02) (0.01) (0.22) (0.08) (0.02) 0.02 - Operating earnings available to common shareholders per diluted common share 3.00 3.50 4.31 5.22 6.25 1.41 1.52
IRS tax audit settlement - (0.14) - - - - -
Premium tax liability - (0.04) - - - - - MetLife Foundation contribution - 0.04 - - - - -
Race conscious underwriting (0.13) - - - - - -
Merger of Mexican operations (0.05) - - - - - -
Change in reserve methodology (0.03) - - - - - - New England Financial charge 0.04 - - - - - -
Operating earnings available to common shareholders per diluted common share, as presented 2.83$ 3.36$ 4.31$ 5.22$ 6.25$ 1.41$ 1.52$
QTD
6
MetLife Stable Value & Institutional Products Client Conference
Reconciliation of Net Income Available to Common Shareholders toOperating Earnings Available to Common Shareholders
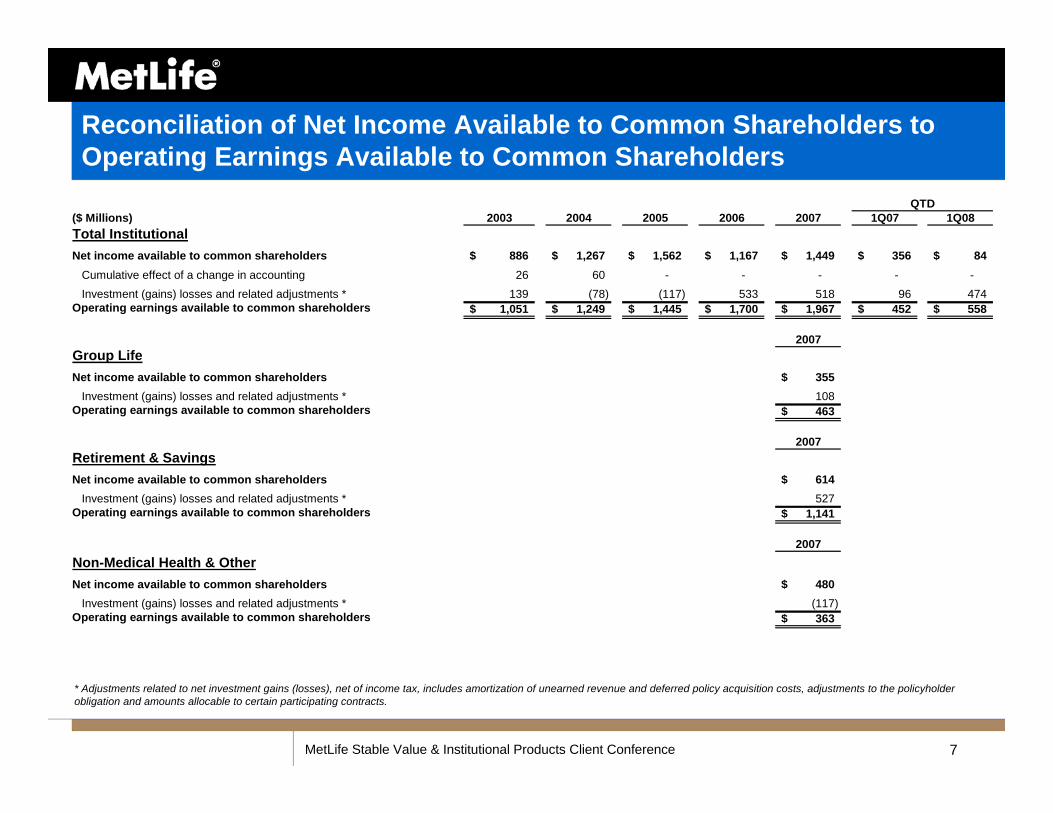
* Adjustments related to net investment gains (losses), net of income tax, includes amortization of unearned revenue and deferred policy acquisition costs, adjustments to the policyholder obligation and amounts allocable to certain participating contracts.
($ Millions) 2003 2004 2005 2006 2007 1Q07 1Q08Total InstitutionalNet income available to common shareholders 886$ 1,267$ 1,562$ 1,167$ 1,449$ 356$ 84$
Cumulative effect of a change in accounting 26 60 - - - - - Investment (gains) losses and related adjustments * 139 (78) (117) 533 518 96 474
Operating earnings available to common shareholders 1,051$ 1,249$ 1,445$ 1,700$ 1,967$ 452$ 558$
2003 2004 2005 2006 2007 1Q07 1Q08Group LifeNet income available to common shareholders 282$ 373$ 364$ 345$ 355$ 103$ 5$
Investment (gains) losses and related adjustments * 68 25 36 81 108 4 114 Operating earnings available to common shareholders 350$ 367$ 400$ 426$ 463$ 107$ 119$
2003 2004 2005 2006 2007 1Q07 1Q08Retirement & SavingsNet income available to common shareholders 365$ 684$ 943$ 544$ 614$ 181$ (111)$
Investment (gains) losses and related adjustments * 66 (100) (143) 411 527 85 432 Operating earnings available to common shareholders 457$ 624$ 800$ 955$ 1,141$ 266$ 321$
2003 2004 2005 2006 2007 1Q07 1Q08Non-Medical Health & OtherNet income available to common shareholders 239$ 210$ 255$ 278$ 480$ 72$ 190$
Investment (gains) losses and related adjustments * 5 (3) (10) 41 (117) 7 (72) Operating earnings available to common shareholders 244$ 227$ 245$ 319$ 363$ 79$ 118$
QTD
QTD
QTD
QTD
7
MetLife Stable Value & Institutional Products Client Conference
Reconciliation of Net Income Available to Common Shareholders toOperating Earnings Available to Common Shareholders
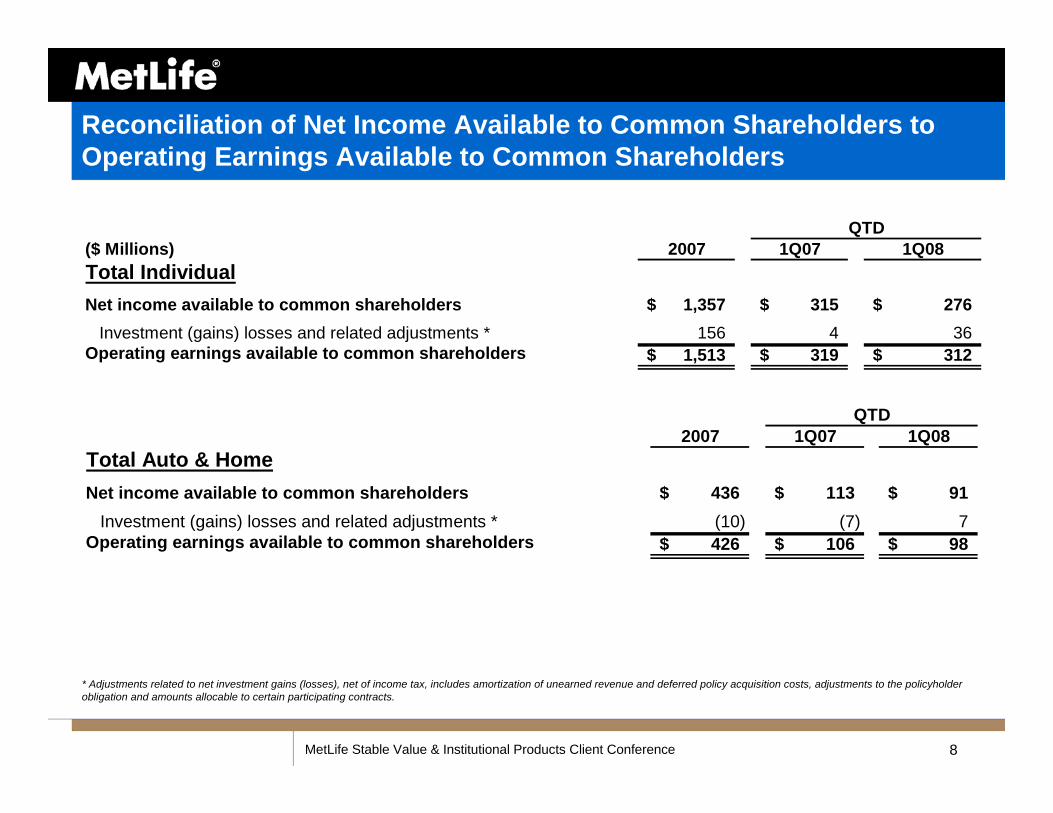
($ Millions) 2007 1Q07 1Q08Total IndividualNet income available to common shareholders 1,357$ 315$ 276$
Investment (gains) losses and related adjustments * 156 4 36 Operating earnings available to common shareholders 1,513$ 319$ 312$
QTD
2007 1Q07 1Q08Total Auto & HomeNet income available to common shareholders 436$ 113$ 91$
Investment (gains) losses and related adjustments * (10) (7) 7 Operating earnings available to common shareholders 426$ 106$ 98$
QTD
* Adjustments related to net investment gains (losses), net of income tax, includes amortization of unearned revenue and deferred policy acquisition costs, adjustments to the policyholder obligation and amounts allocable to certain participating contracts.
8
MetLife Stable Value & Institutional Products Client Conference
Reconciliation of Net Income Available to Common Shareholders toOperating Earnings Available to Common Shareholders
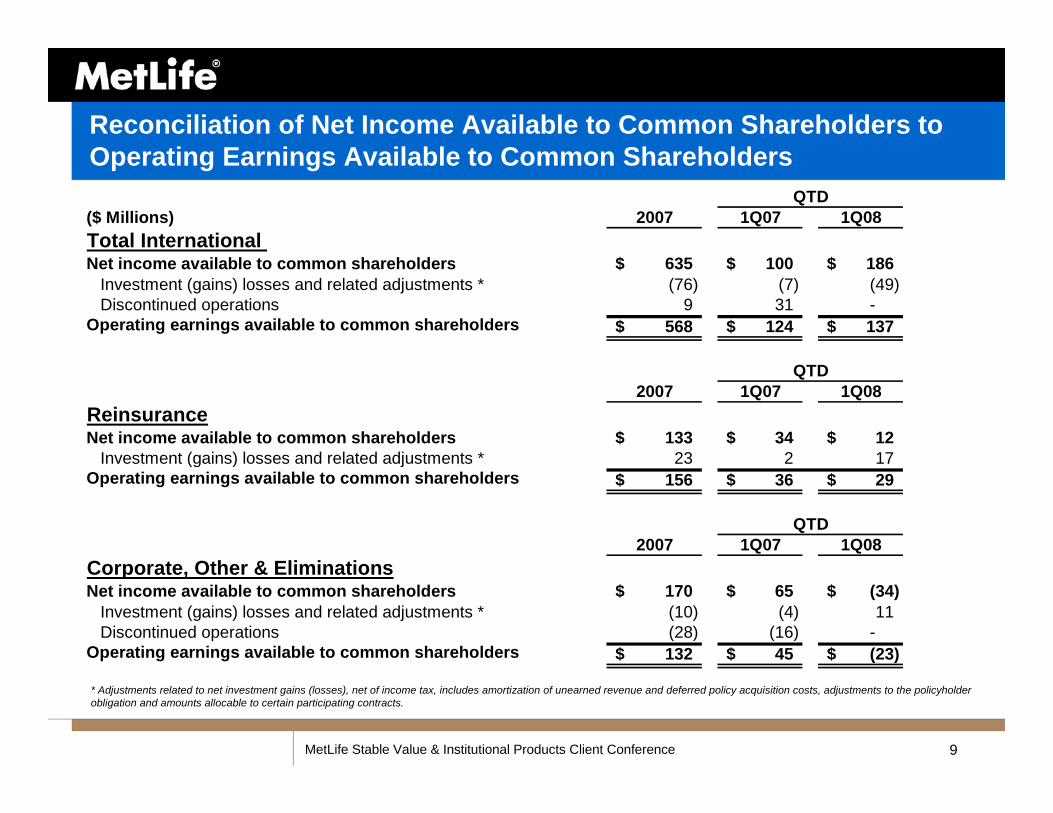
($ Millions) 2007 1Q07 1Q08Total International Net income available to common shareholders 635$ 100$ 186$
Investment (gains) losses and related adjustments * (76) (7) (49) Discontinued operations 9 31 -
Operating earnings available to common shareholders 568$ 124$ 137$
2007 1Q07 1Q08ReinsuranceNet income available to common shareholders 133$ 34$ 12$
Investment (gains) losses and related adjustments * 23 2 17 Operating earnings available to common shareholders 156$ 36$ 29$
2007 1Q07 1Q08Corporate, Other & EliminationsNet income available to common shareholders 170$ 65$ (34)$
Investment (gains) losses and related adjustments * (10) (4) 11 Discontinued operations (28) (16) -
Operating earnings available to common shareholders 132$ 45$ (23)$
QTD
QTD
QTD
* Adjustments related to net investment gains (losses), net of income tax, includes amortization of unearned revenue and deferred policy acquisition costs, adjustments to the policyholder obligation and amounts allocable to certain participating contracts.
9
MetLife Stable Value & Institutional Products Client Conference
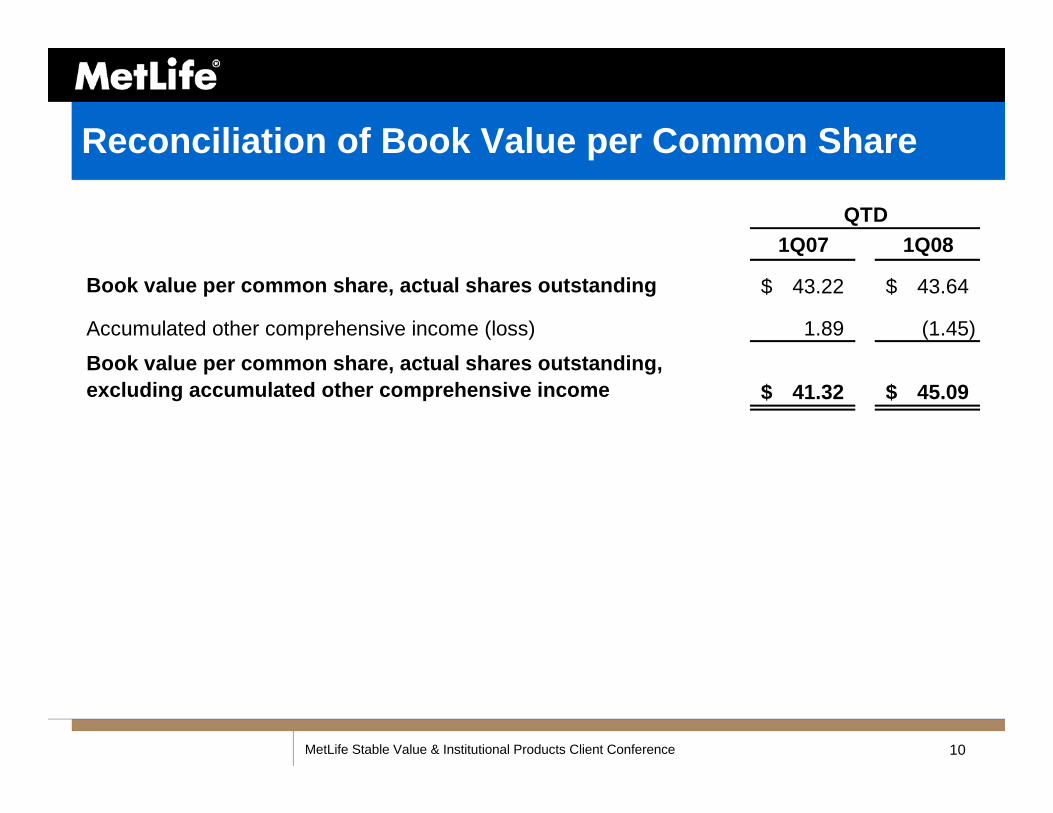
Reconciliation of Book Value per Common Share
1Q07 1Q08
Book value per common share, actual shares outstanding 43.22$ 43.64$
Accumulated other comprehensive income (loss) 1.89 (1.45)
Book value per common share, actual shares outstanding, excluding accumulated other comprehensive income 41.32$ 45.09$
QTD
10
MetLife Stable Value & Institutional Products Client Conference
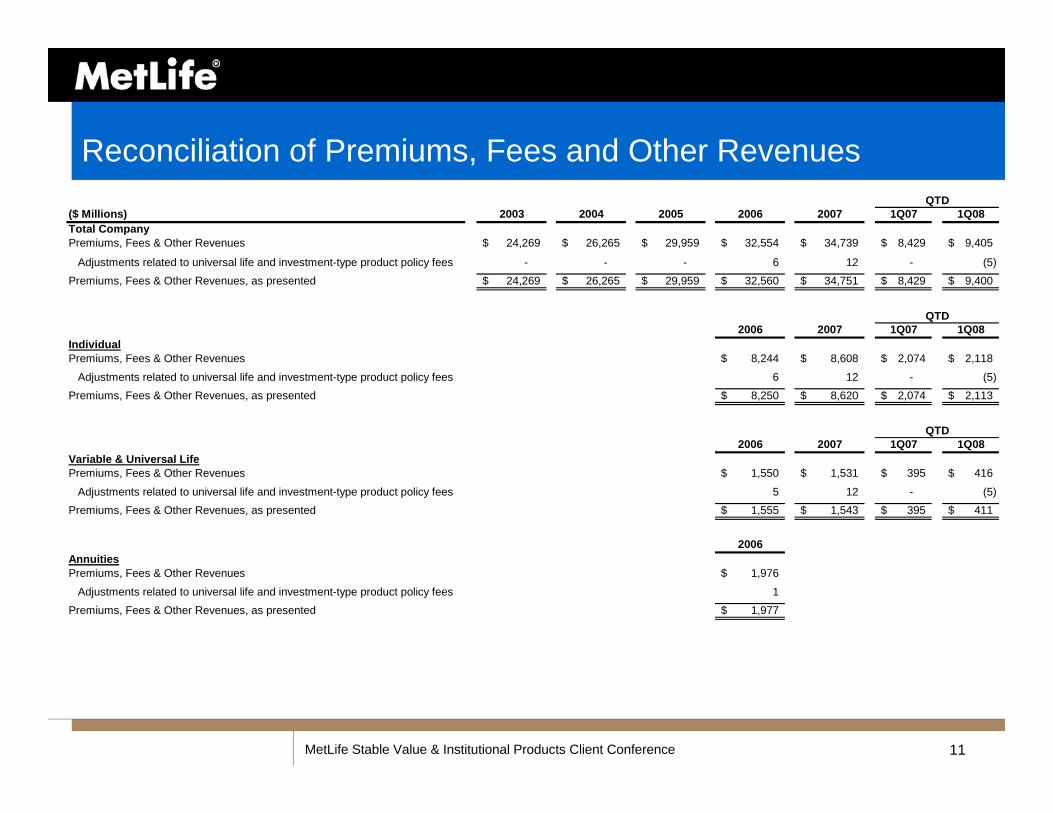
Reconciliation of Premiums, Fees and Other Revenues
($ Millions) 2003 2004 2005 2006 2007 1Q07 1Q08Total CompanyPremiums, Fees & Other Revenues 24,269$ 26,265$ 29,959$ 32,554$ 34,739$ 8,429$ 9,405$
Adjustments related to universal life and investment-type product policy fees - - - 6 12 - (5) Premiums, Fees & Other Revenues, as presented 24,269$ 26,265$ 29,959$ 32,560$ 34,751$ 8,429$ 9,400$
2006 2007 1Q07 1Q08IndividualPremiums, Fees & Other Revenues 8,244$ 8,608$ 2,074$ 2,118$
Adjustments related to universal life and investment-type product policy fees 6 12 - (5) Premiums, Fees & Other Revenues, as presented 8,250$ 8,620$ 2,074$ 2,113$
2006 2007 1Q07 1Q08Variable & Universal LifePremiums, Fees & Other Revenues 1,550$ 1,531$ 395$ 416$
Adjustments related to universal life and investment-type product policy fees 5 12 - (5) Premiums, Fees & Other Revenues, as presented 1,555$ 1,543$ 395$ 411$
2006 2007 1Q07 1Q08AnnuitiesPremiums, Fees & Other Revenues 1,976$ 2,275$ 536$ 555$
Adjustments related to universal life and investment-type product policy fees 1 - - - Premiums, Fees & Other Revenues, as presented 1,977$ 2,275$ 536$ 555$
QTD
QTD
QTD
QTD
11
MetLife Stable Value & Institutional Products Client Conference
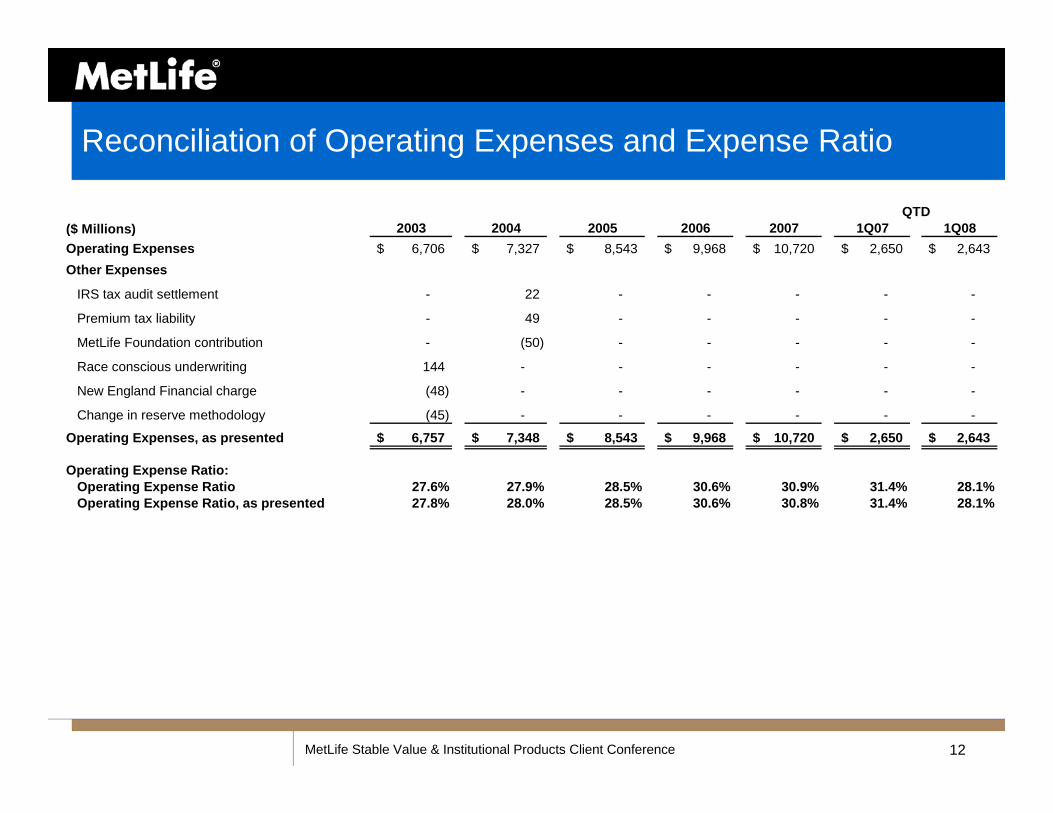
Reconciliation of Operating Expenses and Expense Ratio
($ Millions) 2003 2004 2005 2006 2007 1Q07 1Q08Operating Expenses 6,706$ 7,327$ 8,543$ 9,968$ 10,720$ 2,650$ 2,643$ Other Expenses
IRS tax audit settlement - 22 - - - - -
Premium tax liability - 49 - - - - -
MetLife Foundation contribution - (50) - - - - -
Race conscious underwriting 144 - - - - - -
New England Financial charge (48) - - - - - -
Change in reserve methodology (45) - - - - - -
Operating Expenses, as presented 6,757$ 7,348$ 8,543$ 9,968$ 10,720$ 2,650$ 2,643$
Operating Expense Ratio:Operating Expense Ratio 27.6% 27.9% 28.5% 30.6% 30.9% 31.4% 28.1%Operating Expense Ratio, as presented 27.8% 28.0% 28.5% 30.6% 30.8% 31.4% 28.1%
QTD
12

MetLife Stable Value & Institutional Products Client Conference
Reconciliation of Return on Common Equity
($ Millions)1Q07 1Q08
Net income available to common shareholders 983$ 615$ Investment (gains) losses 58 560 Adjustments related to investment (gains) losses 26 (64) Discontinued operations 15 - Operating earnings available to common shareholders 1,082 1,111
Total equity 34,069 32,999 Less: Accumulated other comprehensive income 1,402 (1,028) Less: Preferred stock 2,042 2,042
Adjusted equity 30,625 31,985
Average equity 30,632 32,022
Annualized operating earnings available to common shareholders 4,328 4,444
Operating earnings available to common shareholders return on common equity 14.1% 13.9%
QTD
13