Embed Size (px)
Citation preview
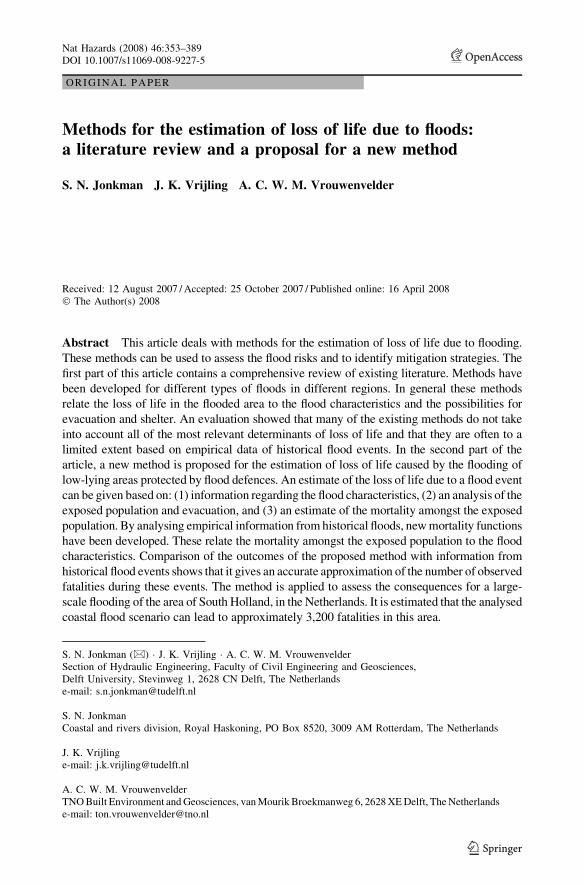
ORI GIN AL PA PER
Methods for the estimation of loss of life due to floods:a literature review and a proposal for a new method
S. N. Jonkman Æ J. K. Vrijling Æ A. C. W. M. Vrouwenvelder
Received: 12 August 2007 / Accepted: 25 October 2007 / Published online: 16 April 2008� The Author(s) 2008
Abstract This article deals with methods for the estimation of loss of life due to flooding.
These methods can be used to assess the flood risks and to identify mitigation strategies. The
first part of this article contains a comprehensive review of existing literature. Methods have
been developed for different types of floods in different regions. In general these methods
relate the loss of life in the flooded area to the flood characteristics and the possibilities for
evacuation and shelter. An evaluation showed that many of the existing methods do not take
into account all of the most relevant determinants of loss of life and that they are often to a
limited extent based on empirical data of historical flood events. In the second part of the
article, a new method is proposed for the estimation of loss of life caused by the flooding of
low-lying areas protected by flood defences. An estimate of the loss of life due to a flood event
can be given based on: (1) information regarding the flood characteristics, (2) an analysis of the
exposed population and evacuation, and (3) an estimate of the mortality amongst the exposed
population. By analysing empirical information from historical floods, new mortality functions
have been developed. These relate the mortality amongst the exposed population to the flood
characteristics. Comparison of the outcomes of the proposed method with information from
historical flood events shows that it gives an accurate approximation of the number of observed
fatalities during these events. The method is applied to assess the consequences for a large-
scale flooding of the area of South Holland, in the Netherlands. It is estimated that the analysed
coastal flood scenario can lead to approximately 3,200 fatalities in this area.
S. N. Jonkman (&) � J. K. Vrijling � A. C. W. M. VrouwenvelderSection of Hydraulic Engineering, Faculty of Civil Engineering and Geosciences,Delft University, Stevinweg 1, 2628 CN Delft, The Netherlandse-mail: [email protected]
S. N. JonkmanCoastal and rivers division, Royal Haskoning, PO Box 8520, 3009 AM Rotterdam, The Netherlands
J. K. Vrijlinge-mail: [email protected]
A. C. W. M. VrouwenvelderTNO Built Environment and Geosciences, van Mourik Broekmanweg 6, 2628 XE Delft, The Netherlandse-mail: [email protected]
123
Nat Hazards (2008) 46:353–389DOI 10.1007/s11069-008-9227-5

Keywords Loss of life � Floods � Mortality � Models � Consequences �Risk assessment
1 Introduction
Every year floods cause enormous damage and loss of life on a global scale. An analysis of
global statistics showed that inland floods (river floods, flash floods and drainage floods)
caused 175,000 fatalities and affected more than 2.2 billion people between 1975 and 2002
(Jonkman 2005). In these statistics the consequences of other types of floods such as coastal
floods and tsunamis are not included. Table 1 gives an overview of some historical coastal
floods to indicate the impacts of these events. These results show that coastal flood events
are even more catastrophic than inland floods in terms of loss of life. A recent example of
such a catastrophic event is the flooding caused hurricane Katrina in the year 2005. This
event caused more than 1,100 fatalities in the state of Louisiana and hundreds of fatalities
occurred in the flooded parts of the city of New Orleans. Other types of floods can also lead
to large loss of life. The estimated death toll from the Indian Ocean tsunami in the year 2004
is approximately 230,000, making it one of the most catastrophic disasters in history.
Existing literature treats different aspects of the loss of life due to flooding. Some
studies investigate loss of life patterns on global scale (Berz et al. 2001; Jonkman 2005) or
discuss loss of life in the context of general public health impacts (Hajat et al. 2003; Ahern
et al. 2005). Other studies focus on the analysis of the causes and circumstances of indi-
vidual flood disaster deaths for specific regions or events (Coates 1999; Jonkman and
Kelman 2005). This article focuses on methods for the estimation of loss of life due to
flooding. These methods are generally used to identify the possible consequences of
flooding, and results can be used to assess the flood risks and to identify mitigation
strategies. The background of this article is a research program on flood risks in the
Netherlands (van Manen and Brinkhuis 2005; Rijkswaterstaat 2006), in which the prob-
abilities of and consequences of large-scale floods in the Netherlands have been assessed.
In the research program it was recognized there was limited insight in the loss of life
caused by flooding and no uniformly established method was available.
Therefore, the first objective of this article is to provide a comprehensive review of
methods for the estimation of loss of life due to flooding. A review of literature has been
conducted to identify methods used in different countries and for different types of
flooding (coastal flooding, river flooding, but also tsunami-induced flooding). Different
Table 1 Overview of some historical coastal flood events
Date Affected area Loss of life Source
1-2-1953 Southwest of the Netherlands 1,835 Waarts (1992)
1-2-1953 United Kingdom, East Coast 315 Kelman (2003)
26-9-1959 Ise Bay, Japan 5,101 Tsuchiya and Yasuda (1980)
30-4-1991 Bangladesh 139,000a Chowdhury et al. (1993)
29-8-2005 New Orleans, United States 1,118b IPET (2007)
a According to Chowdhury et al. (1993) the estimated death toll for this event varies between 67,000 and139,000b Loss of life in the state of Louisiana. Additional fatalities occurred in other states, such as Mississippi andFlorida
354 Nat Hazards (2008) 46:353–389
123

methods have been identified by means of an extensive search in peer-reviewed literature
and research reports. Given the background of this study (see above), it is evaluated
whether the existing methods are applicable to assess the consequences of large-scale
floods in the Netherlands.
The second objective is to develop a method for the estimation of loss of life caused by
large-scale flooding of low-lying areas with a specific emphasis on the situation in the
Netherlands. Large parts of the Netherlands are below sea level and the high water levels in
the rivers (see Fig. 1). Flooding of these low-lying areas can occur due to breaching of
flood defences and these events can flood extensive areas up to large water depths with
catastrophic consequences. For example, in the Netherlands coastal flooding caused 1,835
fatalities in the southwestern parts of the country in the year 1953. Such low-lying areas
can also be found in many other parts of the world, particularly in the deltas of large rivers,
such as the Mississippi (United States) and the Yangtze (China). The proposed method can
therefore also be relevant for such areas.
This article is structured as follows. Section 2 gives an overview and evaluation of loss
of life models. Section 3 contains a proposal for a new method for the estimation of loss of
life caused by large-scale floods. The application of the method is demonstrated in a case
study in Sect. 4. Concluding remarks are presented in Sect. 5.
Fig. 1 Parts of the Netherlands that could potentially be flooded due to coastal and river flooding.Source: Rijkswaterstaat (2006)
Nat Hazards (2008) 46:353–389 355
123

2 A review of methods for the estimation of loss of life due to flooding
In literature several methods have been developed that relate the mortality in a flooded area
to flood characteristics and possibilities for warning and evacuation. Mortality is defined in
this study as the number of fatalities divided by the number of exposed people. This section
reviews the existing methods for the estimation of loss of life developed in several
countries for different types of floods (Sect 2.1). Approaches for the analysis of human
instability in flowing water are summarized in Sect. 2.2. The methods are evaluated in
Sect. 2.3.
2.1 Methods for the estimation of life due to different flood types
In an international context, various methods have been developed for the estimation of loss
life for different types of floods. The considered fields include dam breaks floods, tsunamis,
coastal storm surges and river floods.
2.1.1 Coastal storm surges
On a global scale a large part of the loss of life due to flooding is caused by coastal flood
events, such as storm surges and hurricanes/cyclones (see also Sect. 1).
Throughout history several large storm surges have struck Japan. Based on such his-
torical events, Tsuchiya and Kawata (1981) derived a relationship between typhoon energy
and mortality. These authors have also investigated the relationship between mortality and
factors such as the collapse of buildings, the time of warning and the volume of flooding
(i.e. flooded area multiplied by water depth). However, no definitive method for the pre-
diction of mortality is proposed.
Mizutani (1985; quoted in Tachi personal communication) developed relationships for
typhoons Jane and Isewan between average flood depth (h) and mortality (FD):
Isewan typhoon:
FD ¼ 10ð2=3�h�11=3Þ FD� 1 ð1ÞTyphoon Jane:
FD ¼ 10ðh�5:5Þ FD� 1 ð2ÞDue to the large differences in mortality between the events (e.g. a factor 30 for water
depth of 1 m), it is believed that other factors, such as warning and the available time have
played an important role.
Boyd (2005) analysed the loss of life in the city of New Orleans (USA) due to flooding
after hurricane Betsy (September 1965). Fifty-one fatalities were directly related to the
flooding of parts of the city. Based on the limited amount of available data, he proposed a
linear relationship between mortality and storm surge height, FD = 0.304 � 10-5h. In a later
publication Boyd et al. (2005) derived a mortality function based on observations from seven
flood events, including hurricanes Betsy (1965) and Camille (1969) in the United States.
They proposed the following relationship between mortality and water depth (see Fig. 2):
FD ¼0:34
ð1þ expð20:37� 6:18hÞÞ ð3Þ
356 Nat Hazards (2008) 46:353–389
123

This function is S-shaped and it has an asymptote for mortality FD = 0.34 for water
depth values that are approximately above 4 m. This implies that about two thirds of the
population will always survive regardless of the water depth. With respect to this
asymptote for mortality the authors state: ‘‘One basic empirical fact of flood events is thatthere are always survivors. Rarely, if ever, has the entire population exposed to the floodperished. Instead, even if the water is extremely deep people tend to find debris, trees,attics, roofs, and other ways to stay alive. Only under the most extreme situations wouldone expect the fatality rate to reach one.’’ (Boyd et al. 2005).
Following the catastrophic flooding of New Orleans after hurricane Katrina in August
2005, a method for the estimation of loss of life for hurricane-induced flooding of New
Orleans has been developed in the context of the ‘Interagency Performance Evaluation
Taskforce’ (IPET 2007). This method is based on the principles of the Lifesim model that has
been developed by Utah State University for dam breaks (see Sect. 2.1.4), but now it is
applied to flooding associated with breaching of flood defences. In the method in the IPET
study, the exposed population is assigned to three different zones (walk away zone, safe zone,
compromised zone). Each zone has a typical value for the mortality rate. Local flood depths
and building heights and the age of the population1 determine the distribution of the popu-
lation over the three zones. The number of people exposed has been distributed over the three
zones so that the total number of observed fatalities was approximated well. The method can
be used to assess the loss of life for hurricane related flood events in the greater New Orleans
area, e.g. in the context of a risk analysis that includes future flood scenarios for the area.
2.1.2 Methods developed in the Netherlands for coastal and river floods
Large part of the Netherlands could be flooded both due to coastal and river flooding.
Throughout the last decades several methods have been proposed in the Netherlands for the
estimation of loss of life for coastal and river floods. Most methods are directly or
0 2 4 6
0.0
0.2
0.4
0.6
Water depth [m]
Mor
talit
y
Fig. 2 Relationship betweenmortality and water depth basedon observations from historicalhurricane flood events (Boydet al. 2005)
1 Because many of the fatalities due to the floods after hurricane Katrina were elderly, it is assumed in theIPET model that those over 65-year old are unable to evacuate vertically above the highest floor level.
Nat Hazards (2008) 46:353–389 357
123

indirectly based on data on the fatalities caused by the 1953 flood disaster in the Neth-
erlands. This event was induced by a storm surge on the North Sea that resulted in flooding
in the Netherlands, the United Kingdom and Belgium. In the Netherlands large areas in the
southwestern part of the country were flooded and the disaster caused enormous economic
damage and 1835 fatalities. Duiser (1989) and Waarts (1992) collected data regarding the
loss of life due to this disaster in the Netherlands from memorial volumes and official
reports. Both reports give loss of life and hydraulic circumstances (water depth and
sometimes rise rate) by municipality. Based on available descriptions, Waarts (1992)
distinguished fatalities in three zones: a zone with high flow velocities, a zone with rapidly
rising waters and a remaining zone. Table 2 presents the distribution of reported fatalities
over the three categories and shows that most fatalities occurred in the zone with rapidly
rising waters. This dataset has been used for the derivation of the methods described below.
Based on the available data, Duiser (1989) proposed a model that relates the local
mortality fraction to the flood depth. More data on the 1953 floods have been added by
Waarts (1992). He derived a general function for flood mortality (FD [-]) as a function of
water depth (h [m]):
FDðhÞ ¼ 0:665 � 10�3e1:16h FD� 1 ð4ÞWaarts also proposed a more refined method that takes into account the effects of
warning and evacuation, high flow velocities and the collapse of buildings. However, not
all factors in this refined method have been specified based on historical data.
Based on Waarts’ general functions, an extended method has been proposed by
Vrouwenvelder and Steenhuis (1997). Especially rapidly rising floods will cause hazardous
situations for people, and therefore the rate of rise of the water (w [m/h]) is included in the
mortality function (see also Fig. 3):
FD ¼ 0 h \ 3 m OR w \ 0:3 m/h
FDðh;wÞ ¼ minðmaxð8:5e0:6h�6 � 0:15; 0Þ �minðmaxð8:5e1:2w�4:3 � 0:15; 0Þ; 1ÞÞFD ¼ 1 h [ 6:25 m AND w [ 2 m/h
ð5Þ
It is noticeable that this function gives FD = 0 for h \ 3 m. This is in contrast with the
observations from the 1953 storm surge disasters, where about one third of the fatalities
occurred at locations with water depths below 3 m (Jonkman 2007). For w [ 2 m/h and
h [ 3 m the function approximately corresponds to the above function of Waarts (1992),
see Eq. 4.
Vrouwenvelder and Steenhuis (1997) proposed a method for sea and river floods. It
takes into account the fraction of buildings collapsed (FB), the fraction of fatalities near the
breach (FR), fatalities due to other factors (FO) and the evacuated fraction of the affected
Table 2 Categorized data regarding fatalities caused by the 1953 disaster in the Netherlands, based onWaarts (1992)
Zone Fatalities Fraction
Rapidly rising waters 1,047 0.58
High flow velocities 260 0.15
Remaining zone 488 0.27
Total 1,795a 1
a The difference between the totals 1,835 and 1,795 is accounted for by a number of people that died in aperiod after the disaster because of the illness and suffering they experienced during the first hours or days
358 Nat Hazards (2008) 46:353–389
123

population (FE). Combination with the number of inhabitants (NPAR) yields the total
number of fatalities (N):
N ¼ ðFO þ PBFR þ PSFBÞð1� FEÞNPAR ð6Þ
where PB is the probability of dike breach nearby a residential area [-] and Ps is the
probability of storm (1 for a coastal flood, 0.05 for a river flood) [-].
Some of the factors in the above method, for example FR and FB, are not specified based
on historical data but derived from expert judgement. Nevertheless the approach includes
several important factors that influence loss of life.
Jonkman (2001) proposes a method for the determination of loss of life for sea and
river floods in the Netherlands. It accounts for the effects of water depth, flow velocity
and the possibilities for evacuation. Based on the results from human stability tests in
flood flows (Abt et al. 1989; see also Sect. 2.2), a function to account for the effects of
high flow velocities is given. Mortality becomes a function of flow velocity v [m/s],
leading to FD(v). Mortality due to higher water depths is modelled with the general
function of Waarts (FD(h), see Eq. 4). It is also assumed that drowning due to water depth
and flow velocity are disjunct events. The probability of a successful evacuation or escape
is assumed to be a function of the time available for evacuation. Event mortality can now
be expressed as:
Fig. 3 Mortality as a function of water depth and rate of rise (Kok et al. 2002)
Nat Hazards (2008) 46:353–389 359
123

FDðh; v; TAÞ ¼ FDðhÞ þ FDðvÞð Þ 1� FEðTAÞð Þ 0�FDðh; v; TAÞ� 1 ð7Þ
where TA is the time available for evacuation [h] and FE is the evacuated fraction of the
exposed population [-].
All the above methods are directly or indirectly based on findings from the 1953 storm
surge. An evaluation of these methods (Jonkman 2004) showed the following. Comparison
with the available observations regarding the loss of life caused by the 1953 storm surge
showed that these methods did not give a good prediction of the observed number of
fatalities. In several of these methods, variables are included that are based on expert
judgement and not on empirical data.
2.1.3 Other methods for coastal and river floods
Some authors developed more general methods applicable to both river and coastal floods.
Zhai et al. (2006) analysed data from floods in Japan. They derived a relationship between
the number of inundated houses and the loss of life. In these floods fatalities mainly
occurred when more than 1,000 buildings were inundated and then increased as a function
of the number of inundated buildings. The obtained statistical relationships show con-
siderable variation, which might be due to the influence of other factors such as warning,
evacuation, flood characteristics and the actual collapse of buildings.
Ramsbottom et al. (2003, 2004), see also Penning-Rowsell et al. (2005), developed an
approach for assessing the flood risk to people, in a research project for the Environment
Agency for England and Wales. The risk to people is determined by three factors: flood
hazard, people vulnerability and area vulnerability. A flood hazard rating is indirectly
based on the available tests for human instability and the effects of debris. The proposed
values for the other factors are based on expert judgement. By combination of these three
factors, the numbers of fatalities and injuries are estimated. The method is applied to three
case studies covering past river floods in the UK, and the obtained results agree well with
the observed historical data.
In several countries methods are available to identify hazard zones for different types
flooding. These methods provide a qualitative indication of the hazard (high, moderate,
low) based on the combination of water depth and flow velocity that could be expected
during a flood. Criteria have been developed to determine the risks to people and the risk of
building collapse. These criteria are based on available information related to instability of
people and building collapse in flowing water (see also Sect. 2.2 for further elaboration).
Examples of such applications are a study on hazard classification for river flooding in
New Zealand (Wood 2007) and the guidelines for hazard classification for dam break
floods in the United States (USBR 1988).
2.1.4 Dam break floods
McClelland and Bowles (2002) give a comprehensive historical review of loss of life
methods for dam break floods and also discuss their merits and limitations. Here, the most
important methods are summarized.
Brown and Graham (1988) developed a function to estimate the number of fatalities (N)
for dam breaks as a function of the time available for evacuation2 (TA) and the size of the
population at risk (NPAR):
2 In the original publications this variable is indicated as warning time.
360 Nat Hazards (2008) 46:353–389
123

N ¼ 0:5NPAR TA\0:25 h
N ¼ N 0:6PAR 0:25\TA\1:5 h
N ¼ 0:0002NPAR TA [ 1:5 h
ð8Þ
The procedure is derived from the analysis of 24 major dam failures and flash floods.
The formulas show large discontinuities. For example for NPAR = 10,000 the loss of life
jumps from 5,000 to 251 at TA = 0.25 h and then jumps from 251 to 2 at TA = 1.5 h (see
also Fig. 4).
DeKay and McClelland (1993) make a distinction between ‘‘high lethality’’ and ‘‘low
lethality’’ floods. They define high lethality floods as events with large hydraulic forces,
for example in canyons, where 20% of the flooded residences are either destroyed or
heavily damaged. Low lethality conditions occur when less than 20% of the houses are
destroyed or damages and these usually occur on flood plains. The following relation-
ships, again a function of population size and time available for evacuation, have been
proposed:
N ¼ NPARð1þ 5:207NPAR0:513
eð3:838TA�4:012ÞÞ�1for ‘‘high lethality’’ floods
N ¼ NPARð1þ 5:207NPAR0:513
eð3:838TA�4:012ÞÞ�1for ‘‘low lethality’’ floods
ð9Þ
In both functions loss of life decreases very quickly when the time available increases
(see Fig. 4). It is noted that re-ordering3of both the above functions shows of the popu-
lation at risk. Application of this expression for short warning times gives mortality values
in the order 10-2 to 10-4.
Fig. 4 Estimated number of fatalities for dam break as a function of warning time for a population ofNPAR = 10,000 according to the methods of Brown and Graham (1988) and DeKay and McClelland (1993).Note that the vertical axis is depicted on a logarithmic scale
3 For example, the DeKay and McClelland expression for mortality (FD) in low lethality floods becomes:
FD ¼ N=NPAR ¼ ð1þ 5:207NPAR0:513
e0:822TA Þ�1
.
Nat Hazards (2008) 46:353–389 361
123

Graham (1999) presents a framework for estimation of loss of life due to dam failures.
Recommended fatality rates are provided based on the severity of the flood, the amount of
warning and the understanding of the flood severity by the population. Quantitative criteria
for flood severity are given in the form of the water depth and the depth-velocity product.
Three categories of warning time are distinguished: no/little warning (\15 min), some
warning (15–60 min) and adequate warning ([60 min). The understanding of the flood
severity depends on whether a warning is received and understood by the population at
risk. The recommended fatality rates are based on the analysis of 40 historical dam breaks.
In later work Reiter (2001) introduced factors in Graham’s approach to account for the
vulnerability of the population (number of children and elderly), and the influence of
warning efficiency and possible rescue actions.
The methods discussed above are based on statistical analyses of data from historical
floods. Recent research has focused on more detailed simulation of flood conditions and
individual behaviour of people after dam break floods. The ‘Life Safety Model’ developed
by British Columbia Hydro (Watson et al. 2001; Assaf and Hartford 2002; Hartford and
Baecher 2004; Johnstone et al. 2005) takes into account the hydraulic characteristics of the
flood, the presence of people in the inundated area and the effectiveness of evacuation. An
individual’s fate is modelled mechanistically, i.e. individual behaviour causes of death are
accounted for at an individual level. Drowning can occur in three different states: when the
building in which a person stays is destroyed, when a walking person loses his stability or
when a person’s vehicle is overwhelmed by the water. Calculations result in different
values for loss of life for different times of the year, week and day due to differences in
affected population and the effectiveness of warning. As a validation, Johnstone et al.
(2003, 2005) use the model for a reconstruction of the consequences of the Malpasset dam
failure in France in 1959.
Utah State University (McClelland and Bowles 1999, 2002; Aboelata 2002) has
developed a model (‘Lifesim’) for loss of life estimation for dam break floods. It considers
several categories of variables to describe the flood and area characteristics, warning and
evacuation and the population at risk. A comprehensive analysis of historical dam break
cases and the factors determining loss of life has been undertaken (McClelland and Bowles
2002). Different flood zones are distinguished based on the characteristics of the flood
(depth, velocity) and the availability of shelter. Mortalities observed in historical cases
have differed distinctly between flood zones. In the most hazardous chance zones, his-
torical mortalities range from FD = 0.5 to 1 with an average of 0.9. In compromised zones,
where the available shelter has been severely damaged, the average death rate amounts to
0.1. The model has been implemented in a GIS framework and can be used for both
deterministic (scenario) and probabilistic (risk analysis) calculations.
2.1.5 Tsunamis
A method for the estimation of loss of life due to tsunamis is given in CDMC (2003).
Based on historical statistics from Japanese tsunamis, mortality is estimated as a function
of tsunami wave height (hts [m]) when it reaches land:
FD ¼ 0:0282e0:2328hts FD� 1 ð10ÞCorrection factors are proposed which account for the tsunami arrival time and resident
awareness, and thus for the effects of evacuation and warning. Furthermore the extent of
dike and sea wall breaching is included in the mortality estimation.
362 Nat Hazards (2008) 46:353–389
123

Sugimoto et al. (2003) and Koshimura et al. (2006) propose methods that combine a
numerical simulation of the inundation flow due to tsunami and an analysis of the evac-
uation process. Both methods use criteria for human instability in flowing water (see
Sect. 2.2) to estimate the loss of life.
After the Indian Ocean tsunami of December 2004, various publications have addressed
the loss of life caused by this tragic event. Various surveys were conducted amongst
affected households in different affected areas (Nishikiori et al. 2006; Rofi et al. 2006;
Doocy et al. 2007; Guha-Sapir et al. 2007). It is striking that all these studies reported
mortality fractions in the affected areas between FD = 0.129 and FD = 0.17. These
investigations present very relevant information related to individual risk factors, such as
age and gender. However, they do not directly address the relationship between mortality
and the characteristics of the tsunami wave and the consequent inland flooding.
2.2 Human instability in flowing water
Although flood fatalities can occur due to various other causes such as physical trauma,
heart attack and drowning in cars (Jonkman and Kelman 2005), loss of human stability and
consequent drowning are a high personal hazard. Therefore several authors have investi-
gated the issue of human (in)stability in flowing water. Most authors propose a critical
depth–velocity (hvc) product indicating the combination of depth (h [m]) and velocity
(v [m/s]) that would lead to a person’s instability. Similarly, in analysing building collapse
in flood flows, the hvc product also tends to be used (e.g. Clausen 1989; Kelman 2002). Such
criteria can be used for the creation of flood hazard maps for different types of flooding.
This topic’s first experimental study was presumably (Abt et al. 1989), as they state that
‘‘previous work of this nature was not located in literature’’ (p. 881). They conducted a
series of tests in which human subjects and a monolith were placed in a laboratory flume in
order to determine the water velocity and depth which caused instability. Equation 11 was
derived from the resulting empirical data to estimate the critical product hvc at which a
human subject becomes unstable as a function of the subject’s height (L [m]) and mass
(m [kg]):
hvc ¼ 0:0929 e0:001906Lmþ1:09� �2 ð11Þ
Further tests on humans in laboratory flumes were carried out in the Rescdam project
(Karvonen et al. 2000). Depending on the test person’s height and mass, critical depth–
velocity products were found between 0.64 m2/s and 1.29 m2/s. Based on the test data, the
authors proposed the following limit for manoeuvrability under normal conditions:
hvc ¼ 0:004Lmþ 0:2 ð12ÞIn Japan, experiments were conducted on the feasibility of walking through floodwaters.
Suetsugi (1998) reports these results in English indicating that people will experience
difficulties in walking through water when the depth–velocity product exceeds 0.5 m2/s.
Figure 5 shows the combinations of water depth and flow velocity that resulted in
instability in the two experimental series, i.e. those by Abt et al. and Karvonen et al. The
lines show combinations with a constant value of the depth–velocity product (hv). The
middle line has a value of hv = 1.35m2/s. This corresponds to the value that follows from
the criterion proposed by Abt et al. (1989) for a person with L = 1.75 m and m = 75 kg
(see Eq. 11). It is expected that this type of criterion can be used for conditions in which
experiments were conducted, i.e. 0.5 \ v \ 3 m/s and 0.3 \ h \ 1.5 m. Figure 5 also
Nat Hazards (2008) 46:353–389 363
123

illustrates that the two datasets are different (see also Ramsbottom et al. 2004). This
reflects that the two experiments were carried out under different test circumstances
(bottom friction, test configuration) and involved a variety of personal characteristics
(weight, height, clothing).
Different authors have used the available test data to derive empirical functions for
determining stability. Lind and Hartford (2000), also see Lind et al. (2004), derived theo-
retical relationships for the stability in water flows of three shapes representing the human
body: a circular cylindrical body, a square parallelepiped body, and composite cylinders
(two small ones for the legs and one for the torso). Based on the developed relationships and
calibration with test data, they proposed a reliability function that can be used the proba-
bility of instability for a given person under certain flow conditions. USBR (1988) and
Green (2001) give semi-quantitative criteria that indicate certain hazard ranks (e.g. high and
low danger zones) as a function of water depth and flow velocity. Similarly, Ramsbottom
et al. (2004) and Penning-Rowsell et al. (2005) have proposed a semi-quantitative equation
to relate the flood hazard to people to depth and velocity of the water as well as the amount
of debris that is in the water. From this equation the level of hazard to people can be
estimated and then categorized as ‘low’, ‘moderate’, ‘significant’ or ‘extreme’.
Overall, the available studies show that people lose stability in flows in relatively low
depth–velocity products. The obtained critical depth–velocity products for standing range
from 0.6 m2/s to about 2 m2/s. These two values are also indicated in Fig. 5. People may
experience difficulties in wading through water at lower depth–velocity products. In
practice several other phenomena could even reduce stability more, for example obstacles
on the bottom or reduced fatigue of persons in the water.
2.3 Discussion and evaluation of methods for loss of life estimation
Despite the enormous impacts of floods on global scale, a limited number of methods is
available for the estimation of loss of life due to flooding. The previous sections have given
a review of (known) available methods and such a comprehensive overview was not
available in literature so far. Below, the methods are briefly evaluated with respect to their
field of application, and background data and modelling approach. Table 3 summarizes the
0
0.5
1
1.5
2
0 1 2 3 4
Flow velocity [m/s]
Wat
er d
epth
[m
]
data Abt et al.
data Rescdam
hv=1.35m2/s
hv=0.6m2/s
hv=2m2/s
Fig. 5 Combination of waterdepth and flow velocity that ledto instability of test persons in theexperiments by Abt et al. (1989)and Karvonen et al. (2000)
364 Nat Hazards (2008) 46:353–389
123

Ta
ble
3O
ver
vie
wo
fex
isti
ng
loss
of
life
met
ho
ds,
thei
rfi
eld
of
app
lica
tio
n,
and
the
fact
ors
incl
ud
ed
Met
hod
Fie
ldof
appli
cati
on
Dat
abas
isF
acto
rsta
ken
into
acco
unt
inlo
ssof
life
esti
mat
ion
Wat
erd
epth
Vel
oci
tyR
ate
of
risi
ng
War
nin
gan
dev
acu
atio
nC
oll
apse
of
bu
ild
ings
Oth
er
Tsu
chiy
aan
dK
awat
a(1
98
1)
Co
asta
lfl
ood
s(J
apan
)
His
tori
cal
typhoons
inJa
pan
Ty
pho
on
ener
gy
Miz
uta
ni
(1985)
2T
yphoons
X
Bo
yd
etal
.(2
00
5)
Co
asta
lfl
oo
ds
(sto
rmsu
rge,
hu
rric
ane)
Var
ious
storm
surg
esX
IPE
T(2
00
7)
Hu
rric
ane
rela
ted
flo
od
ing
du
eto
lev
eeb
reac
hes
(New
Orl
ean
s)
Lo
sso
fli
feaf
ter
hu
rric
ane
Kat
rina
XX
Sh
elte
r,ag
eo
fp
eop
le
Du
iser
(19
89)
Riv
eran
dco
asta
lfl
oo
ds
inlo
wly
ing
area
s(e
spec
iall
yth
eN
eth
erla
nd
s)
19
53
Sto
rmsu
rge
dis
aste
rin
the
Net
her
lands
X
Waa
rts
(19
92)
X
Waa
rts
(19
92):
det
aile
dX
XX
XX
Vro
uw
envel
der
and
Ste
enh
uis
(19
97)
XX
TN
OX
XX
X
Jon
km
an(2
00
1)
XX
X
Zh
aiet
al.
(20
06)
Riv
eran
dco
asta
lfl
oo
ds
(Jap
an)
His
tori
cal
floods
Jap
anX
Ram
sbott
om
etal
.(2
00
3,
20
04)
Riv
eran
dco
asta
lfl
oo
ds
(UK
)S
tab
ilit
yte
sts
and
exp
ert
jud
gem
ent
XX
XX
XP
opu
lati
on
vu
lner
abil
ity
Nat Hazards (2008) 46:353–389 365
123

Ta
ble
3co
nti
nu
ed
Met
hod
Fie
ldof
appli
cati
on
Dat
abas
isF
acto
rsta
ken
into
acco
unt
inlo
ssof
life
esti
mat
ion
Wat
erd
epth
Vel
oci
tyR
ate
of
risi
ng
War
nin
gan
dev
acu
atio
nC
oll
apse
of
bu
ild
ings
Oth
er
US
BR
(giv
esa
qu
alit
ativ
era
nk
ing
of
flood
haz
ard)
Haz
ard
clas
sifi
cati
on
for
riv
eran
dd
amb
reak
flo
od
s
Em
pir
ical
stu
die
so
nin
stab
ilit
yo
fp
eop
lean
db
uil
din
gs
XX
Bro
wn
and
Gra
ham
(19
88)
Dam
bre
akfl
oo
ds
His
tori
cal
dam
bre
aks
XA
ffec
ted
po
pu
lati
on
DeK
ayan
dM
cCle
llan
d(1
99
3)
His
tori
cal
dam
bre
aks
XA
ffec
ted
po
pu
lati
on
Gra
ham
(19
99)
His
tori
cal
dam
bre
aks
Com
bin
edin
sev
erit
ycl
assi
fica
tio
nX
BC
Hy
dro
Lif
eS
afet
yM
odel
Sim
ula
tio
n,
Mal
pas
set
dam
bre
akX
XX
XIn
div
idu
alb
ehav
iou
r
Uta
hS
tate
Un
iver
sity
His
tori
cal
dam
bre
aks
Dif
fere
nt
haz
ard
zon
esd
efined
XX
CD
MC
(20
03)
Tsu
nam
i
His
tori
cal
tsunam
isX
XT
sunam
iw
ave
hei
gh
t
Su
gim
oto
etal
.(2
00
3)
Sim
ula
tio
nX
XX
Ko
shim
ura
etal
.(2
00
6)
Sim
ula
tio
nX
XX
Ab
tet
al.
(19
89)a
Hu
man
inst
abil
ity
infl
ow
ing
wat
erS
tab
ilit
yte
sts
XX
Peo
ple
’sw
eig
ht,
hei
gh
tan
dcl
oth
ing
Res
cdam
aS
tab
ilit
yte
sts
XX
aO
nly
ori
gin
alst
abil
ity
test
sar
eli
sted
inth
eta
ble
,n
ot
the
form
ula
tio
ns
der
ived
fro
mth
ese
test
by
oth
erau
tho
rs
366 Nat Hazards (2008) 46:353–389
123

methods, their field of application and shows which factors are taken into account in loss of
life estimation.
The methods have been developed for different types of floods in different regions.
Applications that have received relatively much attention are dam breaks in USA and
Canada, coastal storm surges in Japan, floods in the Netherlands, and human instability in
flood flows. All of the reviewed methods include some kind of function which relates
mortality to flood characteristics. Depending on the flood type and the type of area dif-
ferent variables will be most significant in predicting loss of life. For large-scale dam
breaks, warning time is very important, as people exposed to the effects of a large dam
break wave have limited survival chances. For coastal and river floods, local water depth
and rate of rising are important parameters for mortality. For all floods evacuation is a
critical factor in loss of life estimation, as it reduces the number of people exposed to the
flood. It is noted that this factor is not included in many of the approaches listed in Table 3.
Figure 6 schematically compares some of the discussed methods with respect to their
level of detail and modelling principles. The level of detail (vertical axis) varies from the
modelling of each individual’s fate to an overall estimate for the whole event. On the
horizontal axis the basic modelling principles are categorized. Mechanistic methods are
those that model the individual behaviour and the causes of death. Empirical methods
relate mortality in the exposed population to event characteristics.
The methods of Utah State University and BC Hydro use detailed local data and capture the
mechanisms that lead to mortality. The method of BC Hydro is most detailed as it simulates an
individual’s fate during a flood event. The disadvantage of such a mechanistic approach is that
a large number of variables have to be assigned for which very limited empirical information
is available, e.g. variables related to the behaviour of the person. Yet, detailed simulations can
provide visualisation tools for communication with the public and decision makers. More
empirically based methods have been proposed which take account of local circumstances
(e.g. the methods of Ramsbottom et al. and Waarts) or give a purely empirical estimation of
mortality for an event (e.g. the methods of Graham and DeKay and McClelland). In general
the single-parameter methods (i.e. the methods that include one factor such as water depth or
warning time) are fully based on historical data. Probably due to the lack of historical data, not
all the factors in multi-parameter methods could be empirically derived.
One objective of this study was to investigate the applicability of the available methods
for floods of low-lying areas protected by flood defences, with specific emphasis on the
situation in the Netherlands. Many of the available methods have been specifically
developed for other types of floods (e.g. dam breaks) and they are less suitable for the type
of flood considered here. A group of methods have been developed for the situation in the
Basic modelling principles
Empirical Mechanistic
Lev
el o
f d
etai
l
Mac
ro:
even
t M
icro
: in
divi
dual
BC Hydro LSM
Utah State Univ.
Ramsbottom et al.
Mes
o: Z
one
or lo
catio
n
Instability tests
Waarts
DeK
ay a
nd
McC
lella
nd
Gra
ham
IPET: New Orleans
Fig. 6 Comparison of theproposed method with othermethods for loss of lifeestimation (based on Johnstoneet al. 2005)
Nat Hazards (2008) 46:353–389 367
123

Netherlands (see Sect. 2.1.2) and these are largely based on observations regarding loss of
life caused by the 1953 storm surge in the Netherlands. An evaluation of these methods
(Jonkman 2004) showed that these methods did not give a good prediction of the observed
number of fatalities in the 1953 flood. Overall, most of the existing methods do not take
into account the combined influence of different factors that are considered to be the most
relevant determinants of loss of life, e.g. water depth, rise rate, evacuation, collapse of
buildings and shelter. In addition, most of the existing methods have a limited empirical
basis and the influence of several variables is often estimated based on expert judgement.
Given their different bases and natures, applying different loss of life methods will give
different results. Application of some of the discussed methods to a region in the Neth-
erlands with 360,000 inhabitants showed that the predicted loss of life varied between 72
and 88,000 (Jonkman et al. 2002).
Given the above considerations it is expected that the available methods are not able to
provide an accurate estimate of loss of life for large-scale floods of low-lying areas in the
Netherlands. Therefore, there is a need for the development a new method for the esti-
mation of loss of life that takes into account the most relevant determinants. A first attempt
to provide a modelling framework based on empirical information from historical flood
events is presented in the next section.
3 A new method for the estimation of loss of life due to flooding
3.1 Determinants of loss of life
In order to develop a method for the estimation of loss of life, it is necessary to have insight
in the factors that determine loss of life. To gain more insight in these determinants
documents with relevant information from historical flood events have been examined.
Given the scope of this study, the examined cases concern floods in low-lying areas
protected by flood defences. Table 4 gives an overview of the events and the data sources,
see Jonkman (2007) for further details.
Despite differences with respect to their temporal and geographical situation, the major
factors that have determined the loss of life in these historical flood events seem to be
similar. Based on the available information and previous analyses (e.g. Tsuchiya and
Yasuda 1980; Bern et al. 1993; McClelland and Bowles 2002; Ramsbottom et al. 2003),
the main factors that influence mortality are summarized below:
• The events with the largest loss of life occurred unexpectedly and without substantial
warning. Many of the high-fatality events also occurred at night (Netherlands and UK
1953, Japan 1959), making notification and warning of the threatened population
difficult.
• Timely warning and evacuation prove to be important factors in reducing the loss of
life. Even if the time available is insufficient for evacuation, warnings can reduce the
loss of life. Warned people may have time to find some form of shelter shortly before or
during the flood.
• The possibilities for shelter are a very important determinant of mortality. Buildings
can have an important function as a shelter, but possibilities to reach shelters will
depend on the level of warning, water depth and rise rate of the water.
• The collapse of buildings in which people are sheltering is an important determinant of
the number of fatalities. Findings from different events (Bangladesh 1991, Netherlands
368 Nat Hazards (2008) 46:353–389
123

Ta
ble
4O
ver
vie
wo
ffl
ood
even
tsan
dli
tera
ture
sou
rces
for
wh
ich
the
det
erm
inan
tso
flo
sso
fli
feh
ave
bee
nan
alyse
d
Dat
eA
ffec
ted
area
Loss
of
life
Sourc
eC
onta
ins
info
rmat
ion
on
1-2
-19
53
So
uth
wes
to
fth
eN
eth
erla
nd
s1
,83
5W
aart
s(1
99
2)
Loss
of
life
by
munic
ipal
ity
and
rela
tionsh
ipw
ith
flood
char
acte
rist
ics,
such
asdep
th,
rise
rate
and
vel
oci
tyD
uis
er(1
98
9)
Sla
ger
(19
92)
1-2
-19
53
Un
ited
Kin
gd
om
,E
ast
Co
ast
31
5K
elm
an(2
00
3)
Eff
ects
of
war
nin
g,
buil
din
gvuln
erab
ilit
y,
age
of
the
popula
tion.
Po
llar
d(1
97
8)
26
-9-1
95
9Is
eB
ay,
Jap
an5
,10
1T
such
iya
and
Yas
ud
a(1
98
0)
Rel
atio
nsh
ipb
etw
een
mort
alit
yan
dw
ater
dep
than
dw
arn
ing
JWF
(20
05)
30-4
-1991
Ban
gla
des
h139,0
00
Chow
dhury
etal
.(1
99
3)
Role
of
war
nin
g,
shel
ter
and
coll
apse
of
buil
din
gs
and
indiv
idual
vuln
erab
ilit
ies
(age,
gen
der
)B
ern
etal
.(1
99
3)
24
-9-2
00
2Ja
pan
,S
hir
anu
iT
ow
n1
2K
ato
(20
02)
Ro
leo
fw
ater
dep
th,
war
nin
gan
dco
llap
seo
fb
uil
din
g
Nat Hazards (2008) 46:353–389 369
123

1953) show that most fatalities occurred in areas with vulnerable and low quality
buildings.
• Water depth is an important parameter, as possibilities for shelter decrease with
increasing water depth. Low-lying and densely populated areas, such as reclaimed
areas or polders, will be most at risk.
• The combination of larger water depths and rapid rise of waters is especially
hazardous. In these cases people have little time to reach higher floors and shelters and
they may be trapped inside buildings.
• High flow velocities can lead to the collapse of buildings and instability of people. In
different cases (Netherlands and UK 1953, Japan 1959), many fatalities occurred
behind dike breaches and collapsed sea walls, as flow velocities in these zones are
high.
• When exposed to a severe and unexpected flood, children and elderly were more
vulnerable. This suggests that chances for survival are related to an individual’s
stamina and his or her ability to find shelter. A further analysis of individual
vulnerabilities is provided in Jonkman and Kelman (2005).
The above factors are important determinants of the loss of life. Local variations in the
above factors may lead to differences between mortality fractions for different locations
within one flood event. Especially unfavourable combinations of the above factors will
contribute to high mortality. For example in the 1953 floods in the Netherlands, mortality
was highest at locations where (a) no flood warnings were given, (b) the waters rose rapidly
to larger water depths, and (c) where the quality of buildings was poor.
3.2 Proposed approach for loss of life estimation
To estimate the loss of life caused by a flood event, it is proposed to take into account three
general steps4:
(1) Analysis of flood characteristics, such as water depth, rise rate and flow velocity;
(2) Estimation of the number of people exposed (including the effects of warning,
evacuation and shelter);
(3) Assessment of the mortality amongst those exposed to the flood.
This approach can be used to assess the consequences of hypothetical but possible flood
events, for example in the context of a risk analysis. Figure 7 schematically shows the
general approach for the estimation of loss of life due to flooding. The analysis starts with
the total number of people at risk before the event in the threatened area. By analysing the
possibilities for evacuation, shelter and rescue, the total number of people exposed to the
floodwaters (NEXP) can be estimated. Consequently the mortality in the exposed population
(FD) can be estimated. Mortality is defined in this study as the number of fatalities divided
by the number of exposed people. Mortality functions can be used that relate the mortality
fraction to flood characteristics (e.g. water depth) and other important factors such as the
collapse of buildings. The number of fatalities (N) can be estimated as follows:
N ¼ FDNEXP ð13ÞIn the analysis of these steps the different determinants of loss of life can be taken into
account (see Sect. 3.1). For example in the analysis of the possibilities for evacuation of
4 In a more general sense, similar steps can also be used to assess the loss of life for other natural andtechnological disasters (Jonkman 2007).
370 Nat Hazards (2008) 46:353–389
123

affected people, the effectiveness of warning can be taken into account. The following
sections deal with the general steps in the above approach. Section 3.3 contains the sim-
ulation of flood characteristics. Section 3.4 describes the modelling of evacuation, shelter
and rescue and the assessment of the number of people exposed. As previous work has
already focussed on the analysis of these two steps, they are treated relatively briefly. Most
emphasis is given to the development of mortality functions for floods in Sect. 3.5. Sec-
tion 3.6 describes the validation of the method.
3.3 Simulation of flood characteristics
To assess the damage and loss of life due to a flood, it is necessary to have an under-
standing of its hydraulic characteristics. These are determined for a so-called flood
scenario. A flood scenario refers to one breach or a set of multiple breaches in a flood
defence system and the resulting pattern of flooding, including the flood characteristics.
For each flood scenario the location of breaching, the outside hydraulic load conditions
(river discharge, water level, waves) and the breach growth rate have to be determined. It is
noted that the analysis of outside hydraulic boundary conditions is very important for a
proper analysis of the course of flooding and the consequences. In the context of flood risk
analysis also, the probability of a flood scenario has to be estimated.
The most relevant flood characteristics for loss of life estimation include: water depth,
rise rate, flow velocity and arrival time of the water (see also Sect. 3.1). The rise rate of the
water is expected to be an important determinant of loss of life as it influences the possi-
bilities to find shelter on higher grounds or floors of buildings. The rise rate can be derived
from the development of water depth over time. In the context of loss of life estimation, it is
proposed to estimate the average rise rate at a location from the initiation of flooding up to a
depth of 1.5 m (see Fig. 8). Then the water level approximates the human head level and
becomes hazardous for people. This approach prevents finding very high rise rates over
small incremental changes of water depth, for example over the first decimetres of water in
Fig. 8. As the rise rate is averaged, it is indicated with symbol w [m/h].
Flood characteristics
Mortality function
Mortality
Evacuation model
Exposed people Loss of life Number of people in
the area at risk
Fraction Evacuated
Evacuated people
Survivors Shelter Rescued
people
Fig. 7 General approach for the estimation of loss of life due to flooding
Nat Hazards (2008) 46:353–389 371
123

Information regarding the different flood characteristics can be obtained from flood
simulations. Several numerical methods are available, for example the Sobek 1D2D model
developed by WL Delft Hydraulics (Asselman and Heynert 2003). In the simulation of
flood flows it is important to account for the roughness and geometry of the flooded area.
Certain line elements, such as local dikes, roads, railways and natural heights, might create
barriers that can significantly influence the flood flow and the area, thereby dividing the
area in smaller compartments.
3.4 Analysis of the exposed population and evacuation
The number of people exposed to the floodwaters can be estimated based on the following
elements:
• The number of people at risk before the event: NPAR;
• The fraction of the population that is evacuated out of the area before the flood: FE;
• The fraction of the (remaining) population that has the possibility to find shelter: FS;
• The number of people rescued: NRES.
The number of people exposed equals:
NEXP ¼ 1� FEð Þ 1� FSð ÞNPAR � NRES ð14ÞThe analysis of the four elements in this formula is described more in detail below.
3.4.1 The number of people at risk
The number of people at risk (NPAR) concerns all the individuals in the affected area before
the event. For larger affected areas, it can often be approximated by the registered pop-
ulation. However, in some cases it might be necessary to take into account population
dynamics, for example when a part of the reference population will be working elsewhere
most of the time.
3.4.2 Evacuation
Evacuation is defined in this study as ‘‘the movement of people from a (potentially)
exposed area to a safe location outside that area before they come into contact with
physical effects’’. In general the possibilities for successful evacuation will depend on the
time available until the arrival of the floodwater in an area and the time required for
evacuation. The fraction of the population (FE) that can be evacuated can be estimated
based on these two variables.
Time t [hr]
Depth h [m]
w [m/hr] – averaged rise rate over the first 1.5 meters
1.5m
Fig. 8 Estimation of the(averaged) rise rate over the first1.5 m of water depth
372 Nat Hazards (2008) 46:353–389
123

The time available for evacuation is determined by two elements: (1) The time available
between the first signs and the initiation of the flood, i.e. the breach, and (2) The time
available between the breach initiation and the arrival of the floodwaters at a certain location
(the so-called arrival time). The time lag between first signs and the initiation of a flood
depends on the (threatening) type of flood and the availability of warning systems. For
example heavy rainfalls can cause flash floods within several hours, but high river dis-
charges might be predicted days in advance. For the situation in the Netherlands, Barendregt
et al. (2005) proposed representative values for the time available for different combinations
of the above factors. For example for a coastal flooding from the North Sea they estimate the
average time available at 12 h, and the 5% and 95% confidence intervals at 4 and 51 h.
The time required for evacuation equals the time needed to complete the following four
phases: (1) detection and decision making, (2) warning, (3) response, and (4) actual evac-
uation. A study of historical evacuations (Frieser 2004) shows that the first three phases are
expected to cover several hours each for a large-scale evacuation. The time required for the
actual evacuation can be estimated by means of a simulation model that includes traffic flows
and the behaviour of the population (see e.g. Simonovic and Ahmad 2005). For analysis of
flood evacuation in the Netherlands, a macro-scale traffic model has been developed (van
Zuilekom et al. 2005). The model accounts for the number of inhabitants in the area, the
capacities of the road network and the exits, the departure time distribution of evacuees and
the effects of traffic management. This model provides the time required to evacuate a
certain fraction of the population as output. An example of the application of this model is
presented in Fig. 9. The study area concerns the dikering ‘Land van Heusden/de Maaskant’.
It has 360,000 inhabitants and it is threatened by flooding of the river Meuse. The delay in
evacuation due to prediction, warning and response has to be taken into account. In addition
it needs to be accounted for that a certain fraction of the population does not evacuate, e.g.
because they are not warned or refuse to evacuate. For this area a conservative estimate of
the time available is 16 h. By combination with the results evacuation model, the evacuated
fraction is estimated at FE = 0.5 if traffic management is used. FE reduces to 0.4 if no traffic
management is used, e.g. in the case of an unorganized evacuation.
3.4.3 Shelter
Within the flooded area people may find protection within shelters. These are constructed
facilities in the exposed area, which offer protection. Examples of shelters are high-rise
0
0.2
0.4
0.6
0.8
1
0 5 10 15 20 25 30
Time [hrs]
Fra
ctio
n e
vacu
ated
[-]
reference
traffic management
delay for prediction and warning
fraction not evacuated
Fig. 9 Estimation of the timerequired for evacuation for thearea ‘‘Land van Heusden/deMaaskant’’
Nat Hazards (2008) 46:353–389 373
123

buildings during floods. Evidence from literature (Bern et al. 1993; Chowdhury et al.
1993; McClelland and Bowles 2002) suggests that fatalities in intended shelters have been
extremely rare. As a first order approximation of the effects of sheltering, it is proposed to
assume that all people present in buildings with more than three stories are safe. In the
Netherlands the fraction of people living in higher buildings could range between 0 in rural
areas to 0.2 in cities. The possibilities to reach shelter depend on the level of warning, and
also on the rise rate and depth of the water. For specific cases the presence of formal
shelters and/or high grounds can be discounted additionally.
3.4.4 Rescue
Rescue concerns the removal of people from an exposed area either by professionals or
other affected people. Rescue only prevents loss of life if people are rescued before they
will lose their life due to exposure. The expected survival time for people in cold water is
only a few hours, e.g. between 1 and 3 h for a water temperature of 5�C (Hayward 1986).
The floods with the greatest life loss have generally claimed their victims before profes-
sional rescuers were able to arrive (McClelland and Bowles 2002). Rescue actions are
expected to have a limited effect on fatalities in the direct impact phase, i.e. the first hours
of the event. A general estimate of the number of people rescued (NRES) can be obtained
based on estimates of the capacities of rescue services with boats and helicopters. In
addition, the delays in the initiation of rescue need to be accounted for.
3.5 Estimation of the mortality amongst the exposed population
In this section mortality functions are proposed. First, the general approach and data
sources are described. Consequently, the mortality functions for different zones in the
flooded area are proposed. These functions and their area of application are also sum-
marized in the Appendix.
3.5.1 General approach
After analysis of flood characteristics and evacuation, the next step is the determination of
mortality amongst those exposed to the flood. An approach is proposed in which hazard
zones are distinguished. Hazard zones are areas that differ with respect to the dominating
flood characteristics and the resulting mortality patterns.5 Based on the findings from
historical events (Sect. 3.1) and past work (Waarts 1992), it was found that many fatalities
occur behind breaches and in areas with rapidly rising waters. Three typical hazard zones
are distinguished for a breach of a flood defence protecting a low-lying area (see Fig. 10).
• Breach zone: Due to the inflow through the breach in a flood defence high flowvelocities generally occur behind the breach. This leads to collapse of buildings and
instability of people standing in the flow.
• Zones with rapidly rising waters: Due to the rapid rising of the water, people are not
able to reach shelter on higher grounds or higher floors of buildings. This is particularly
hazardous in combination with larger water depths.
5 The concept of hazard zones is also used in other loss of life models for both coastal and river floods(Ramsbottom et al. 2003) and dam break floods (McClelland and Bowles 2002).
374 Nat Hazards (2008) 46:353–389
123

• Remaining zone: In this zone the flood conditions are more slow-onset, offering better
possibilities to find shelter. Fatalities may occur amongst those that did not find shelter,
or due to adverse health conditions associated with extended exposure of those in
shelters.
For other types of floods, the situation and proportional area of the hazard zones might be
different. For example for dam breaks in narrow canyons, the hazard zone associated with
high flow velocities will be much larger.
The boundaries of the rapidly rising waters can be formed by line elements that create
barriers, such as building rows, lowered streets, dikes or steep contours. Also, depending
on the topography of the area and flow patterns, rapid rise of the water or high flow
velocities are possible in local compartments or contractions, for example due to breaching
of local dikes.
Depending on the variability of flood characteristics it might be necessary to distinguish
different locations in the exposed area to give a realistic estimate of loss of life. Each
hazard zone can thereby be subdivided into locations; see Fig. 10 for an example.
A location is defined in this context as an area for which flood characteristics (water depth,
rate of rising, flow velocities) and area characteristics (e.g. shelter possibilities) can be
assumed relatively homogeneous. For (relatively) flat areas, locations could include whole
polders or villages. If there are large local variations within one village, e.g. in land level, it
could be divided into multiple locations. For locations in every hazard zone mortality is
estimated by means of a mortality function, which relates the mortality to the local flood
characteristics.
3.5.2 Derivation of mortality functions based on historical flood events
For the three hazard zones mortality functions have been derived. These functions relate the
mortality fraction to flood characteristics. Empirical data from historical flood events are used
to analyse whether a statistical relationship exists between the mortality fraction and certain
flood characteristics. The mortality functions are derived by means of a least square fit.
In order to derive empirical mortality functions, a dataset with information regarding
flood fatalities in historical flood events has been compiled based on available literature. In
the dataset information has been included on a large number of factors that are relevant for
the investigation of loss of life. The data categories that have been reported for each record
include event characteristics (name, location, date), flood characteristics (depth, velocity,
Fig. 10 Proposed hazard zones for loss of life estimation. Numbers indicate locations
Nat Hazards (2008) 46:353–389 375
123

rise rate), information regarding warning, evacuation, shelter and collapse of buildings, and
more descriptive information regarding circumstances and vulnerabilities of flood fatali-
ties. Individual records have been created for locations for which conditions could be
assumed relatively homogeneous, so one event can involve multiple locations. To allow
empirical analysis, mainly information from references that provide quantitative data is
included. Table 5 summarizes the available information per event.
In total the database covers over 165 locations, which have been abstracted from 11
events. The locations included could be considered as separate observations each repre-
senting different exposure conditions. The available dataset is split into data used for
calibration (i.e. derivation) of the mortality functions and data used for validation(i.e. verification) of the proposed functions. The first five events in Table 5 have been used
for calibration (derivation of mortality functions), as these included large numbers of
records. The other events, which included single locations, would add limited weight in the
statistical analysis and have been used for validation of the model.
The occurrence of flood fatalities is determined by a large number of interacting factors
such as individual vulnerabilities, human behaviour and local flood conditions. In order to
achieve a robust statistical analysis, only factors for which sufficient data (more than 5 to
10 observations) are available are taken into account. Predominantly for water depth a
substantial number of observations is available. Mortality functions will thereby primarily
be derived based on water depth, which was also found to be an important determinant of
mortality in historical flood events (see Sect. 3.1). The influence of other factors of which
data are available, e.g. rise rate, collapse of buildings and warning level, has been
investigated. Due to lack of data, other potentially relevant factors, such as debris, flood
duration or temperature, could not be included in the empirical analysis
In the compilation of the dataset, a number of issues had to be taken into account,
including regional and temporal differences between the events in the dataset (see Jonkman
2007 for a discussion in more detail). With respect to regional differences between events,
it is expected that the considered events were all large-scale floods of low-lying areas with
similar area and flooding conditions. Temporal differences could emerge because many of
the events occurred in the 1950s. Developments since then may have reduced the validity
of these datasets for loss of life estimation for contemporary floods. Firstly, main changes
concern the possibilities of evacuation, as prediction, warning, communication and
transportation systems have improved. Also, the quality of buildings has been improved
and nowadays a larger number of higher buildings is available for shelter. McClelland and
Bowles (2002) conclude that, if these two factors [(1) warning, evacuation and (2) building
quality] are taken into account, life loss patterns appear consistent and similar across time.
The influence of these factors is analysed separately in Sects. 3.5.6 and 3.5.7.
3.5.3 Mortality in the breach zone
Reports from historical floods show that, if breaching occurs in populated areas, mortality
can be high in the area behind the breach. Especially due to the high flow velocities and
forces associated with breach inflow, buildings can collapse and people can lose their
stability. Some authors have investigated loss of life near breaches (see e.g. Tsuchiya and
Yasuda 1980; Waarts 1992; Ramsbottom et al. 2005). None of the available sources in the
dataset relates mortality in the breach zone directly to the local flood characteristics (depth
and velocity). Thus the available case study data do not provide enough evidence for
empirical derivation of mortality functions for the breach zone. Therefore, an approach is
376 Nat Hazards (2008) 46:353–389
123

Ta
ble
5O
ver
vie
wo
fev
ents
wit
hd
ata
on
loss
of
life
repo
rted
inth
efl
oo
dfa
tali
ties
dat
abas
e
Dat
eE
ven
t/ca
use
Co
un
try
and
area
Fat
alit
ies
Ex
pose
dN
um
ber
of
loca
tion
sR
eport
edfa
cto
rsR
efer
ence
s
Ev
ents
use
dfo
rca
lib
rati
on,
i.e.
der
ivat
ion
of
mort
alit
yfu
nct
ions
9-9
-19
34
Ty
pho
on
Mu
roto
Jap
an,
Osa
ka
Bay
84
3U
nk
now
na
(1.7
mil
lio
nin
hab
itan
ts)
10
h,
FB
Tsu
chiy
aan
dK
awat
a(1
98
1)
3-9
-19
50
Ty
pho
on
Jan
eJa
pan
,O
sak
aB
ay2
04
Un
kn
ow
na
(85
0,0
00
inhab
itan
ts)
10
h,
FB
Tsu
chiy
aan
dK
awat
a(1
98
1)
30
-1-1
95
3S
torm
surg
e,N
ort
hS
eaU
K,
Eas
tC
oas
t1
97
26
,90
01
3h,
war
nin
gG
riev
e(1
95
9),
Su
mm
ers
(19
78)
1-2
-1953
Sto
rmsu
rge,
Nort
hS
eaN
L,
South
wes
t1,7
95
206,4
00
91
h,
w,
FB
,d
ura
tio
n,
war
nin
gW
aart
s(1
99
2),
Du
iser
(19
89),
Van
den
Hen
gel
(20
06)
26
-9-1
95
9Is
eB
ayty
ph
oon
Jap
an,
Ise
Bay
4,1
52
43
2,4
65
30
h,
FB,
war
nin
g,
sea
wal
lb
reak
do
wn
rati
o
Tsu
chiy
aan
dY
asu
da
(19
80)
8-9
-19
65
Hu
rric
ane
Bet
syU
SA
,S
EL
ou
isia
na
51
Un
kn
ow
na
(20
0,0
00
inhab
itan
ts)
4F
E,
hB
oy
d(2
00
5)
Cas
edu
sed
for
vali
da
tion
19
12
Riv
erfl
oo
ds
UK
,N
orw
ich
42
,500
1h
Ram
sbott
om
etal
.(2
00
3)
Au
gu
st1
95
2R
iver
flo
od
sU
K,
Ly
nm
ou
th3
44
00
3h
Ram
sbott
om
etal
.(2
00
3)
25
-1-1
98
1F
lash
flo
od
sS
ou
thA
fric
a,L
ain
gsb
urg
10
41
85
1h
EM
-DA
T(2
00
4)
24
-9-1
99
9T
yp
ho
on
no
.1
8Ja
pan
,S
hir
anu
ito
wn
13
20
01
hT
akik
awa
(20
01),
Kat
o(2
00
2)
Au
tum
n2
00
2R
iver
flo
od
sU
K,
Go
wd
all
02
50
1h
Ram
sbott
om
etal
.(2
00
3)
Co
lum
ns
indic
ate
the
fiel
ds
that
hav
eb
een
rep
ort
edq
uan
tita
tiv
ely
inth
eu
nd
erly
ing
sou
rces
Ab
bre
via
tio
ns:
h—
wat
erd
epth
;w
—ri
sera
te;
FB—
coll
apse
of
bu
ild
ings;
FE—
frac
tion
evac
uat
eda
Fo
rth
ese
even
tsth
en
um
ber
so
fin
hab
itan
tsar
ek
no
wn,
bu
tth
en
um
ber
of
exp
ose
dca
nn
ot
be
esti
mat
edad
equ
atel
yd
ue
toth
eef
fect
so
fev
acu
atio
n
Nat Hazards (2008) 46:353–389 377
123

proposed based on information from literature. People’s instability and damages to
buildings are both generally estimated as a function of the depth–velocity product. Clausen
(1989) proposed a criterion for the damage to buildings in flow conditions. Total
destruction of masonry, concrete and brick houses occurs if the product of water depth and
flow velocity exceeds the following criteria simultaneously:
hv� 7 m2/s and v� 2 m/s ð15ÞIt is proposed to use this function to define the boundaries of the breach zone. For the
characteristic flood pattern following a breach in a flood defence (see Fig. 10), velocities
are high mainly near the breach and more moderate in other parts of the polder. Based on
the output of flood simulations, the zone can be defined where the above conditions occur.
It is assumed that most people remain indoors during the flood and that people do not
survive when the building collapses. Then, it can be assumed that mortality in the breach
zone equals FD = 1. This assumption may be conservative as those who will be picked up
by the flood may still have survival chances, see also Bern et al. (1993) for discussion.6
3.5.4 Mortality in the zone with rapidly rising water
Rapidly rising water is hazardous as people may be surprised and trapped at lower floors of
buildings and have little time to reach higher floors or shelters. The combination of rapid
rise of waters with larger water depths is particularly hazardous, as people on higher floors
or buildings will also be endangered. Data on fatalities caused by rapidly rising waters are
available for the floods in the Netherlands in 1953 (12 locations), in the UK in 1953 (one
location) and in Japan in 1959 (two locations). All the points categorized as being in the
rapidly rising zone had rise rates of 0.5 m/h and the derived function is applicable for
situations with a rise rate above this threshold value. For these observations there appears
to a rather strong relationship between water depth and mortality (see Fig. 11). This
implies that the combination of water depth and rise rate is important. A best fit trendline is
found for the lognormal distribution:
FDðhÞ ¼ UN
lnðhÞ � lN
rN
� �
lN ¼ 1:46 rN ¼ 0:28
ð16Þ
where UN is the cumulative normal distribution; lN is the average of the normal
distribution; and rN is the standard deviation of the normal distribution.
This relationship gives a good correlation between observations and results of the model
(R2 = 0.76). Additionally, another good fit (R2 = 0.74) is obtained with a rising expo-
nential distribution that is also shown in the figure. The exponential function has the
disadvantages that it approximates FD = 1 very rapidly for higher water depths. The benefit
of the lognormal function is that it is also used to model human response of exposure to
other substances with so-called probit functions and that it asymptotically approaches
FD = 1 for higher water depths. No empirical data is available to verify the correctness of
the derived function for higher mortality fractions. Some support for the course of the
function for higher water depths is provided by an analysis of loss of life in historical dam
6 Bern et al. (1993) investigated risk factors for flood mortality during the 1991 Bangladesh cyclone byconducting a survey amongst people who were affected by the flood. Of the 285 people who were sweptaway during the storm surge, 112 (39%) died, implying that 61% of those people survived.
378 Nat Hazards (2008) 46:353–389
123

break floods (McClelland and Bowles 2002). They found that when the water depth reaches
about 6.5 m (20 feet) mortality becomes 100%. To strengthen the empirical basis of this
curve further collection of data is recommended, especially for larger water depths.
3.5.5 Remaining zone
A remaining zone is distinguished to account for fatalities outside the breach and rapidly
rising zones. In this zone the flood conditions are more slow-onset (w \ 0.5 m/h), offering
better possibilities to find shelter. Fatalities may occur amongst those that did not find
shelter, or due to adverse health conditions associated with extended exposure of those in
shelters. The first five case histories in Table 5 (Japan 1934, 1950, 1959, Netherlands and
United Kingdom 1953, US 1965) provide data on mortality in the remaining zone for 93
locations. Mortality fractions are plotted as a function of water depth in Fig. 12.
The following mortality function is found for the lognormal distribution:
FDðhÞ ¼ UN
lnðhÞ � lN
rN
� �
lN ¼ 7:60 rN ¼ 2:75
ð17Þ
A very weak correlation between observations and model calculation of R2 = 0.09 is
obtained. The poor correlation is influenced by some outliers with high mortality. For
example during the floods at the east coast of the UK in 1953, 2 of the 37 inhabitants of
Wallasea Island did not survive resulting in a 0.054 mortality. The level of warning is
expected to influence the possibilities to find local shelter and thus influences loss of life,
see the discussion in the next section. The derived mortality function gives a poor fit for
absolute mortality, but it provides insight in the order of magnitude of mortality, which is
generally between 0 and 0.02.
A summary of the derived mortality functions for the three zones and their area of
application is proved in Appendix.
3.5.6 Effects of warning on mortality
Even when people cannot evacuate from the exposed area, timely warning may still play an
important role in preventing loss of life. It will allow people some time to find shelter on
higher grounds or in buildings. Information regarding warning levels is available for two of
the historical events. Tsuchiya and Yasuda (1980) investigated the relationship between
risk to life and warning for the Ise Bay typhoon in 1959 in Japan for 27 locations. The
Fig. 11 Relationship between mortality and water depth for locations with rapidly rising water
Nat Hazards (2008) 46:353–389 379
123

authors categorized the local level of warning by using the ranking system indicated in
Table 6. The same classification was applied to locations affected by the 1953 floods in the
Netherlands. A large-scale and organized evacuation was not possible, but this disaster did
not occur completely unexpected at all locations. In many of the flooded locations, some
sort of warning (e.g. by church bells) was given and people had the possibility to move to
higher grounds or buildings. Based on qualitative descriptions in memorial volumes and
eyewitness accounts (Slager 1992), the warning levels for 39 locations have been rated
with the classification system from Table 6.
Figure 13 shows the relationship between water depth, flood mortality and level of
warning for locations in the remaining zone from the two case studies (Netherlands 1953
and Japan 1959). It shows that observed mortalities in the remaining zone were highest
where (a) little (C) or no warning (D) was given and (b) where water depths were high.
Further analysis shows that many outliers in the remaining zone (see also Fig. 12) had a
poor level of warning or no warning at all. For other outliers (e.g. Wallasea Island) no
information is available on the level of warning. The above results suggest that the level
warning has an influencing on mortality in the remaining zone. However, differentiation of
mortality functions by the level of warning does not lead to an improvement of correlation
between observations and prediction. Further research in this direction is recommended.
3.5.7 Effects of the collapse of buildings on mortality
Historical flood events show that death rates are high where buildings collapse and fail to
provide a safe shelter. Especially wooden buildings, mobile homes, informal, temporary
Table 6 Classification of flood warning levels according to Tsuchiya and Yasuda (1980)
Warning rank Description
A Evacuation order was proclaimed beforehand and people could take refuge before flood
B Warning was given several hours before flood, but preparation actions could not becompletely finished
C Warning was given shortly before or just after the flood and some people managed totake action
D No warning given, warning perceived by hardly anyone
Fig. 12 Mortality as function ofwater depth for the remainingzone
380 Nat Hazards (2008) 46:353–389
123

and fragile structures (including campsites and other tented dwellings) may give rise to
significant loss of life (Ramsbottom et al. 2003). Particularly during more severe and
unexpected coastal floods, such as those in the UK and Netherlands in 1953, building
vulnerability has been an important factor influencing the large numbers of deaths.
Several authors have developed methods for the analysis of the collapse of buildings in
floods (see e.g. Roos 2003; Kelman and Spence 2004). Some work has considered the
relationship between collapse of buildings and loss of life in floods. Graham (1999) shows
that for dam breaks the highest fatality rates occurred in the zones where residences were
destroyed.
The relationship between the collapse of buildings and mortality is further investigated
for the floods in the Netherlands in 1953 using available data for different locations.
Figure 14 plots the relationship between the fraction of the total number of buildings that
collapsed (FB) and mortality (FD), for locations in the zone with rapidly rising water and
the remaining zones.
For the zone with rapidly rising water, a rather strong correlation (R2 = 0.73) exists
between collapse of buildings and mortality. The function can be approximated with
FD = 0.37FB. A rapid rise of the water leads to pressure differentials between water levels
inside and outside the building (Kelman 2002). This effect, in combination with the effects
of water depth and flow velocity, could contribute to the collapse of buildings. In the above
linear function mortality becomes 0 if collapse of buildings reduces to FB = 0. However, it
is still likely that fatalities will occur due to other causes. Therefore an asymptotic rela-
tionship is assumed and schematically shown in Fig. 14. Figure 14 shows that for the
remaining zone a less strong relationship exists between collapse of buildings and mor-
tality. In this zone the flood are more slow-onset, and people have more time to find shelter
at safer locations. Based on these findings, it is assumed that collapse of buildings is only a
significant factor in the zone with rapidly rising waters.
During the 1953 floods many of the collapsed buildings were working class houses of
poor quality. Current building quality is better, and this could be accounted for in the
mortality function. Based on Asselman (2005), it is estimated that improvement of building
quality to today’s standards would lead to a reduction in collapse of buildings of
approximately 60% relative to the 1953 event. The above analysis indicated a linear
Fig. 13 Relationship between mortality (logarithmic scale) and water depth for different levels of warning.The line shows the mortality function for the remaining zone derived in Sect. 3.5.5
Nat Hazards (2008) 46:353–389 381
123

relationship between collapse ratio and mortality for the zone with rapidly rising water.
Then, observed mortality fractions for the 1953 storm surge in the Netherlands can be
scaled with the same factor to account for improved building quality. Thereby a new
mortality function for the rapidly rising zone can be derived with parameters lN = 1.68, rN
= 0.37 in Eq. 16. It is noted that this (corrected) function is mainly based on the situation in
the Netherlands. For other regions, where other building types are used, different rela-
tionships could be developed.
3.6 Validation of the method
As a first order validation, the outcomes of the proposed method for loss of life estimation
are compared with observations from some historical flood events. Five flood events
included in the flood fatalities database are investigated. The selected events concern a
flash flood (event in Laingsburg South Africa 1984), a coastal flood (Shiranui Town, Japan,
1999) and three river floods in the UK that have been analysed in Ramsbottom et al. (2003)
and Penning-Rowsell et al. (2005). Table 7 compares the results following from the pro-
posed method with observed mortality and fatality numbers. Overall, the results show good
agreement between observations and model results. For all events the mortality (and the
number of fatalities) are estimated within a bandwidth of a factor 2, except for the Lyn-
mouth case.
Van den Hengel (2006) applied the proposed mortality functions to give a hindcast of
the consequences of the 1953 storm surge flood in the Netherlands. As input for flood
characteristics he used available flood simulations of the disaster. The exposed population
was estimated based on historical maps and population data. He found that it was possible
to give a reasonable approximation of the total number of fatalities for the whole disaster
(1,298 observed fatalities in the considered areas versus 1,705 predicted). However, locally
(e.g. per village) larger deviations existed between the observed and the predicted number
of fatalities. These deviations are due to various factors including: differences between the
observed and the simulated water depth and the sensitivity of outcomes for a location for
the value of the rise rate.
Fig. 14 Relationship betweenthe fraction of buildingscollapsed and mortality bylocation for the 1953 floods in theNetherlands
382 Nat Hazards (2008) 46:353–389
123

4 Case study: flooding of South Holland
The proposed method for loss of life estimation has been used to predict the loss of life
associated with a flood in the area of South Holland in the Netherlands. This area has
approximately 3.6 million inhabitants and it includes major cities, such as The Hague,
Rotterdam and Amsterdam. Parts of this area can be flooded due to coastal flooding from
the North Sea and river flooding from the South. Thereby, different flood scenarios are
possible and the consequences for these scenarios have been analysed in the context of a
risk assessment study (Rijkswaterstaat 2006; Jonkman and Cappendijk 2006). Below, the
consequences for an extreme but possible coastal flood scenario are presented. It concerns
an event that leads to two breaches in the coastal flood defences, at the locations The
Hague (see Fig. 15) and Ter Heijde. As much of the hinterland is below sea level, the event
will lead to large-scale flooding. Figure 15 shows the flooded area and the flood depths in
this area. In the deepest locations the flood depths can exceed 4 m for the considered
scenario. A densely populated area with approximately 700,000 inhabitants is flooded. The
possibilities for an evacuation of this area are expected to be very limited. For a coastal
flood event there is only 12–24 h available for evacuation. The time required to evacuate
the flooded area of South Holland is estimated with an evacuation model and appears to be
much larger, approximately 50 h (Van der Doef and Cappendijk 2006). Thereby it is
estimated that only a very limited fraction of the population (*15%) will be able to
evacuate before the flood. The proposed mortality functions are applied to estimate the
number of fatalities for the area. The total number of estimated fatalities is almost 3,200.
Table 8 summarizes the results regarding the exposed population and the fatalities. Fig-
ure 15 shows the spatial distribution of fatalities in the area. The majority of fatalities,
nearly 1,900, occur in areas with deep flood depths and rapidly rising waters.
The number of fatalities in the zones with rapidly rising waters is sensitive to the values of
the rise rates used as input (if the rise rate exceeds 0.5 m/h the function for the zone with rapidly
rising waters is used—see above). The consequences for a single scenario are strongly influ-
enced by the choice of outside hydraulic load conditions (storm surge height and duration), and
the modelling of breach growth and the course of flooding. Also, the assumed number of
breaches and their locations are important. Line elements, such as roads, railways and old
dikes, could affect the flood flow. Population response and behaviour might affect evacuation
success and loss of life. The number of fatalities is proportional to the number of people
exposed. The number of evacuated thus has an important influence on the number of fatalities.
Table 7 Comparison between reported mortality figures for some historical flood events and the resultscalculated with the proposed method
Flood Flood type Observations Method
Exposed Fatalities Mortality Fatalities Mortality
Norwich river floods, 1912 River 1,250a 4 1.6 � 10-3 5 3.6 � 10-3
Lynmouth floods, 1952 River/flash 400 34 0.085 11 0.028
Laingsburg, South Africa,1981
Flash 185 104 0.56 73 0.39
Shiranui Town, Japan, 1999 Coastal 200 13 0.065 7 0.035
Gowdall river floods, 2002 River 25a 0 0 0.07 2.8 � 10-3
a Based on descriptions by Ramsbottom et al. (2003), evacuation has been assumed for the Norwich andGowdall events
Nat Hazards (2008) 46:353–389 383
123

5 Concluding remarks
In the first part of this article, existing methods for the estimation of loss of life that are
used in different regions and for different types of floods (e.g. for dam breaks, coastal
floods, tsunamis) have been reviewed. This showed that the existing models do not take
into account all of the most relevant determinants of loss of life and that they are often to a
limited extent based on empirical data of historical flood events. Therefore, a new method
has been proposed for the estimation of loss of life due to the flooding of low-lying areas
due to breaching of flood defences. The method is primarily developed for the Netherlands
but it is expected to be applicable to similar low-lying areas in other parts of the world. The
method takes into account the characteristics of the flood, the extent of the exposed
population and mortality amongst those exposed. Based on empirical data from historical
flood events, mortality functions have been developed. The method takes into account the
Fig. 15 Fatalities by neighbourhood and water depths for the flood scenario with breaches at Den Haag andTer Heijde
Table 8 Summary of the results for the flood scenario with breaches at Den Haag and Ter Heijde
Number of inhabitants in flooded area 706,650
Number of evacuated people (in case of organized evacuation) 59,230
Number of exposed people 647,420
Estimated number of fatalities 3,170
Fatalities in the breach zone 0a
Fatalities in the zone with rapidly rising water 1,900
Fatalities in the remaining zone 1,270
a The area covered by the breach zone is relatively small and does not cover populated areas
384 Nat Hazards (2008) 46:353–389
123

most relevant characteristics that determine loss of life and it has a strong empirical
foundation. Comparison of the outcomes of the proposed method with information from
historical flood events shows that it gives an accurate approximation of the number of
fatalities. For most of the considered validation cases, the predicted loss of life deviates
less than a factor two from the observed mortality. The method can thereby be used to give
an indicative estimate of the loss of life for a flood event.
The outcomes of the method are sensitive to the chosen flood scenario (especially the
number of breaches and the size of the flooded area) and the rise rate of the floodwater.
Analysis of available data suggests that the level of warning of the population and the
collapse of buildings could have an effect on the mortality. Further investigation of these
and other factors based on empirical data is recommended. One important factor that needs
further investigation is the effect of the rise rate on the loss of life. Therefore it is needed to
further collect and analyse data of flood events. Standardized collection and reporting of
the available data for flood disasters are recommended as a basis for further analysis (WHO
2002; Hajat et al. 2003; Jonkman and Kelman 2005). It is strongly recommended to
analyse the available data for the flooding of New Orleans in the year 2005 within the
framework presented in this article. Some preliminary findings related to the loss of life
due to flooding of New Orleans are discussed in Jonkman (2007).
Application of the method to a hypothetical but possible flood scenario for the area of
South Holland in the Netherlands shows that a large-scale flood in this area could lead to
more than 3,000 fatalities. Similar estimates of the consequences have been made for other
flood scenarios in this area (Jonkman and Cappendijk 2006). Results indicate that flooding
of South Holland can result in hundreds or (for some scenarios) even thousands of fatal-
ities. Based on these results further investigation of possibilities for improvement of
evacuation of the population of South Holland, and development of alternative strategies,
e.g. for shelter in place, is strongly recommended. Information regarding the elaborated
flood scenarios and consequence estimates can be used for the development and
improvement of such emergency management strategies.
By combination of the loss of life estimates with available information regarding the
probability of occurrence of flood scenarios, the flood risks can be estimated. These results
can be used as input for the decision-making regarding flood protection levels and strat-
egies. Eventually, it has to be decided in a societal and political debate whether the level of
flood risk is acceptable and if risk reduction is necessary.
Acknowledgements This work was supported by Rijkswaterstaat, the Dutch Directorate General of PublicWorks and Water Management.
Open Access This article is distributed under the terms of the Creative Commons Attribution Noncom-mercial License which permits any noncommercial use, distribution, and reproduction in any medium,provided the original author(s) and source are credited.
Appendix: Summary of the approach for loss of life estimation
This appendix briefly summarizes the areas of application of the derived mortality func-
tions. Mortality for the different hazard zones can be estimated as follows:
Mortality in the breach zone:
FD ¼ 1 if hv� 7 m2/s and v� 2 m/s
Nat Hazards (2008) 46:353–389 385
123

Mortality in the zone with rapidly rising water:
FDðhÞ ¼ UN
lnðhÞ � lN
rN
� �
lN ¼ 1:46 rN ¼ 0:28
if h� 2:1 m and w� 0:5 m/hð Þ and hv\7 m2/s or v\2 m/s� �
The function for the zone with rapidly rising water is only used when it gives higher mortality
fractions than the function for the remaining zone, so for water depths larger than 2.1 m.
The mortality function for the zone with rapidly rising water can be corrected for improved
building quality to current standards. For a first-order estimate of this effect, the following
constants can be assumed in the lognormal mortality function: lN = 1.68, rN = 0.37.
Mortality in the remaining zone:
FDðhÞ ¼ UN
lnðhÞ � lN
rN
� �
lN ¼ 7:60 rN ¼ 2:75
if w\0:5 m/h or ðw�0:5 m/h and h\2:1 mÞð Þ and hv\7 m2/s or v\2 m/s� �
The range of flood conditions for which the above mortality functions can be applied are
indicated in Fig. 16. For clarity, a distinction is made between situations with rise rates
below and above the threshold value of w = 0.5 m/h. The proposed mortality functions
Flow velocity: v [m/s]
Water depth h [m]
2 m/s
hv=7 m2/sRemaining zone
Rise rate w<0,5 m/h
2 m/s
hv=7 m2/s
Rise rate w>0,5 m/h
2.1 m
Zone with rapidly rising water
Breach zone
legend
Remaining zone
Zone with rapidly rising water
Breach zone
Water depth h [m]
Flow velocity: v [m/s]
Breach zone
Remaining zone
Fig. 16 Area of application of mortality functions, as a function water depth, rise rate and flow velocity
386 Nat Hazards (2008) 46:353–389
123

can be easily implemented into computer code, for example the standardized damage
model used in the Netherlands (Kok et al. 2005).
References
Aboelata M, Bowles DS, McClelland DM (2002) GIS model for estimating dam failure life loss.In: Proceedings of the 10th engineering foundation conference on risk-based decisionmaking. SantaBarbara, pp 126–145
Abt SR, Wittler RJ, Taylor A, Love DJ (1989) Human stability in a high flood hazard zone. Water ResourBull 25(4):881–890
Ahern M, Kovats SR, Wilkinson P, Few R, Matthies F (2005) Global health impacts of floods: epidemi-ologic evidence. Epidemiol Revi 27:36–46
Assaf, H, Hartford DND (2002) A virtual reality approach to public protection and emergency preparednessplanning in dam safety analysis. In: Proceedings of the Canadian dam association conference, Victoria
Asselman NEM (2005) Consequences of floods—damage to buildings and casualties, WL Delft Hydraulicsreport Q3668
Asselman NEM, Heynert K (2003) Consequences of floods: 2D hydraulic simulations for the case study areaof Central Holland, Delft Cluster report DC 1-233-5
Barendregt A, van Noortwijk JM, van der Doef M, Holterman SR (2005) Determining the time available forevacuation of a dike-ring area by expert judgement. In: Proceedings of the international symposium onstochastic hydraulics (ISSH), 23–24 May, Nijmegen
Bern C, Sniezek J, Mathbor GM, Siddiqi MS, Ronsmans C, Chowdhury AMR, Choudhury AE, Islam K,Bennish M, Noji E, Glass RI (1993) Risk factors for mortality in the Bangladesh cyclone of 1991. BullWHO 71:73–78
Berz G, Kron W, Loster T, Rauch E, Schimetschek J, Schmieder J, Siebert A, Smolka A, Wirtz A (2001)World map of natural hazards – a global view of the distribution and intensity of significant exposures.Nat Hazards 23(2–3):443–465
Boyd E (2005) Toward an empirical measure of disaster vulnerability: storm surges, New Orleans, andHurricane Betsy. Poster presented at the 4th UCLA conference on public health and disasters, LosAngeles, 1–4 May 2005
Boyd E, Levitan M, van Heerden I (2005) Further specification of the dose-response relationship for floodfatality estimation. Paper presented at the US-Bangladesh workshop on innovation in windstorm/stormsurge mitigation construction. National Science Foundation and Ministry of Disaster & Relief,Government of Bangladesh. Dhaka, 19–21 December 2005
Brown CA, Graham WJ (1988) Assessing the threat to life from dam failure. Water Resour Bull 24(6):1303–1309
CDMC (Central Disaster Management Council) (2003) Damage estimation method for the Tonankai andNankai Earthquakes. http://www.bousai.go.jp/jishin/chubou/nankai/10/sankou_siryou.pdf. AccessedJanuary 2006
Chowdhury A, Mushtaque R, Bhuyia AU, Choudhury AY, Sen R (1993) The Bangladesh cyclone of 1991:why so many people died. Disasters 17(4):291–304
Clausen, LK (1989) Potential dam failure: estimation of consequences, and implications for planning.Unpublished M.Phil. thesis at the School of Geography and Planning at Middlesex Polytechnic col-laborating with Binnie and Partners, Redhill
Coates L (1999) Flood fatalities in Australia, 1788–1996. Aust Geogr 30(3):391–408DeKay ML, McClelland GH (1993) Predicting loss of life in cases of dam failure and flash flood. Risk Anal
13(2):193–205Doocy S, Rofi A, Moodie C, Spring E, Bradley S, Burnham G, Robinson C (2007) Tsunami mortality in
Aceh Province. Indonesia. Bull WHO 85:273–278Duiser JA (1989) Een verkennend onderzoek naar methoden ter bepaling van inundatieschade bij doorbraak,
TNO report ref. 82-0644EM-DAT (Emergency events database) (2004) OFDA/CRED International Disaster Database from
http://www.cred.be/emdat, Universite Catholique de Louvain, Brussels. Accessed December 2004Frieser B (2004) Probabilistic evacuation decision model for river floods in the Netherlands. MSc thesis, TU
DelftGraham, WJ (1999) A procedure for estimating loss of life caused by dam failure. Dam safety office report
DSO-99-6Green C (2001) Assessing vulnerability to flooding. Draft working paperGrieve H (1959) The great tide. Waterlow & Sons Limited
Nat Hazards (2008) 46:353–389 387
123

Guha-Sapir D, Parry LV, Degomme O, Joshi PC, Saulina Arnold JP (2007) Risk factors for mortality andinjury: post-tsunami epidemiological findings for Tamil Nadu. Centre for Research on the Epidemi-ology of Diasters (CRED) report, April 2006, Brussels, Belgium
Hajat S, Ebi KL, Kovats S, Menne B, Edwards S, Haines A (2003) The human health consequences offlooding in Europe and the implications for public health. J Appl Environ Sci Public Health 1(1):13–21
Hartford DND, Baecher GB (2004) Risk and uncertainty in dam safety. Thomas Telford Publishing, LondonHayward, JS (1986) The physiology of immersion hypothermia. In: The nature and treatment of hypo-
thermia, University of Minnesota Press, pp 3–19IPET (Interagency Performance Evaluation Task Force) (2007) Performance evaluation of the New Orleans
and Southeast Louisiana hurricane protection system—volume VII: the consequences, Final report 26March 2007
Johnstone W, Assaf H, Sakamoto D, Hartford D (2003) Analysis of the Malpasset dam failure using GIS andengineering models. In: Proceedings of GeoTec 2003. Vancouver
Johnstone WM, Sakamoto D, Assaf H, Bourban S (2005) Architecture, modelling framework and validationof BC Hydro’s virtual reality life safety model. In: Vrijling et al (eds) Proceedings of the internationalsymposium on stochastic hydraulics, Nijmegen, 23–24 May 2005
Jonkman SN (2001) Overstromingsrisico’s: een onderzoek naar de toepasbaarheid van risicomaten. MSc. Thesis,TU Delft
Jonkman SN (2004) Methode voor de bepaling van het aantal slachtoffers ten gevolge van een grootschaligeoverstroming. DWW report DWW-2004-042
Jonkman SN (2005) Global perspectives of loss of human life caused by floods. Nat Hazards 34:151–175Jonkman SN (2007) Loss of life estimation in flood risk assessment—theory and applications. PhD thesis,
Delft UniversityJonkman SN, Cappendijk P (2006) Veiligheid Nederland in kaart – inschatting van het aantal slachtoffers
ten gevolge van overstroming, DWW report DWW-2006-012Jonkman SN, Kelman I (2005) An analysis of causes and circumstances of flood disaster deaths. Disasters
29(1):75–97Jonkman SN, van Gelder PHAJM, Vrijling JK (2002) Loss of life models for sea- and river floods. In: Wu
et al (eds) Proceedings of flood defence, vol 1. Science Press, New York Ltd., New York, USA,pp 196–206
JWF (Japan Water Forum) (2005) Typhoon Isewan (Vera) and its lessons. Japan Water Forum reportKarvonen RA, Hepojoki A, Huhta HK, Louhio A (2000) The use of physical models in dam-break analysis,
RESCDAM Final Report. Helsinki University of Technology, HelsinkiKato F (2002) A review of flood damage estimation in Japan. Draft working documentKelman I (2002) Physical vulnerability of residential properties in coastal, eastern England. PhD disserta-
tion, Cambridge UniversityKelman I (2003) CURBE fact sheet 3: U.K. Deaths from the 1953 Storm Surge. Version 3, 5 July 2003.
http://www.arct.cam.ac.uk/curbe/CURBEFactSheet3UK1953Deaths.doc. Accessed August 2003Kelman I, Spence R (2004) An overview of flood actions on buildings. Eng Geol 73:297–309Kok M, Huizinga HJ, Meijerink TC, Vrouwenvelder ACWM, Vrisou van Eck N (2002) Standaardmethode
2002: Schade en slachtoffers als gevolg van overstromingen. HKV and TNO Report PR582.10Kok M, Huizinga HJ, Vrouwenvelder ACWM, van den Braak WEW (2005) Standaardmethode 2005 schade
en slachtoffers als gevolg van overstromingen. HKV report PR999.10Koshimura S, Katada T, Mofjeld HO, Kawata Y (2006) A method for estimating casualties due to the
tsunami inundation flow. Nat Hazards 39:265–274Lind N, Hartford D (2000) Probability of human instability in a flooding: a hydrodynamic model.
In: Melchers E, Stewart MG (eds) Proceedings of ICASP 8, applications of statistics and probability,Balkema, Rotterdam, the Netherlands, pp 1151–1156
Lind N, Hartford D, Assaf H (2004) Hydrodynamic models of human instability in a flood. J Am WaterResour Assoc 40(1):89–96
McClelland DM, Bowles DS (1999) Life-loss estimation: what can we learn from case histories.In: Proceedings of the Australian committee on large dams (ANCOLD) annual meeting. Jindabyne,November 1999
McClelland DM, Bowles DS (2002) Estimating life loss for dam safety risk assessment—a review and newapproach. IWR report 02-R-3
Nishikiori N, Abe T, Costa DGM, Dharmaratne SD, Kunii O, Moji K (2006) Who died as a result of thetsunami? Risk factors of mortality among internally displaced persons in Sri Lanka: a retrospectivecohort analysis. BMC Public Health No. 6, Art. No. 73, 20 March 2006
Penning-Rowsell E, Floyd P, Ramsbottom D, Surendran S (2005) Estimating injury and loss of life in floods:A deterministic framework. Nat Hazards 36(1–2):43–64
388 Nat Hazards (2008) 46:353–389
123

Pollard M (1978) North Sea surge: the story of the east coast floods of 1953. Terence Dalton Limited,Lavenham and Suffolk
Ramsbottom D, Floyd P, Penning-Rowsell E (2003) Flood risks to people—phase 1. R&D Technical reportFD2317TR
Ramsbottom D, Wade S, Bain V., Hassan M, Penning-Rowsell E, Wilson T, Fernandez A, House M, FloydP (2004) R&D outputs: flood risks to people. Phase 2. FD2321/IR2. Department for the Environment,Food and Rural Affairs/Environment Agency
Reiter P (2001) Rescdam: loss of life caused by dam failure, the Rescdam LOL method and its application toKyrkosjarvi dam in Seinajoki (summary of the final report), 19 June 2001
Rijkswaterstaat (2006) Flood risks and safety in the Netherlands—full report. Rijkswaterstaat report DWW2006-014. ISBN 90-369-5604-9
Rofi A, Doocy S, Robinson C (2006) Tsunami mortality and displacement in Aceh province, Indonesia.Disasters 30(3):340–350
Roos W (2003) Damage to buildings. Delft Cluster report DC1-233-9Simonovic SP, Ahmad S (2005) Computer-based model for flood evacuation emergency planning. Nat
Hazards 24(1):25–51Slager K (1992) De ramp – een reconstructie – 200 ooggetuigen over de watersnood van 1953, verhalen om
nooit te vergeten. Goes: De koperen tuinSuetsugi K (1998) Control of floodwater and improvements of evacuation system for floodplain manage-
ment. In: Fukuoka S (ed) Floodplain risk management, Proceedings of an international workshop.Hiroshima, 11–13 November 1996, pp 191–207
Sugimoto T, Murakami H, Yozuki K, Nishikawa K, Shimada T (2003) A human damage prediction methodfor tsunami disasters incorporating evacuation activities. Nat Hazards 29(3):585–600
Summers D (1978) The east coast floods. David & Charles (Publishers) Limited, LondonTakikawa K (2001) Storm surge damage caused by Typhoon No. 9918 in the area of Shiranui Sea, JSCE
publication. http://www.jsce-int.org/civil_engineering/2001/typhoon.pdf. Accessed December 2005Tsuchiya Y, Kawata Y (1981) Risk to life, warning systems, and protective construction against past storm
surges in Osaka Bay. J Nat Disaster Sci 3(1):33–56Tsuchiya Y, Yasuda T (1980) High tide and life risk, refuge warning in relation to the Ise Bay Typhoon.
J Nat Disaster Sci 2(2):27–60USBR (U.S. Bureau of Reclamation, U.S. Department of the Interior) (1988) Downstream hazard classi-
fication guidelines. Acer technical memorandum no. 11Van den Hengel D (2006) Slachtoffers bij overstromingen: analyse van een slachtoffermodel aan de hand
van de Watersnoodramp van 1953 en overstromingssimulaties. MSc thesis, Delft UniversityVan der Doef M, Cappendijk P (2006) Veiligheid Nederland in Kaart – modellering en analyse van
evacuatie. Report DWW-2006-007. Rijkswaterstaat DWWVan Manen SE, Brinkhuis M (2005) Quantitative flood risk assessment for polders. Reliab Eng Syst Saf
90(2–3):229–237Van Zuilekom KM, van Maarsseveen MFAM, van der Doef MR (2005) A decision support system for
preventive evacuation of people. In: Proceedings of the first international symposium on geo-information for disaster management. Delft, the Netherlands, 21–23 March 2005, Springer Verlag
Vrouwenvelder ACWM, Steenhuis CM (1997) Tweede waterkeringen Hoeksche Waard, berekening van hetaantal slachtoffers bij verschillende inundatiescenario’s. Report TNO 97-CON-R0332
Waarts P (1992) Methode voor de bepaling van het aantal doden als gevolg van inundatie. Report TNOB-91-1099
Watson D, Serrer M, Crookshank N (2001) BC Hydro life safety model—a two dimensional model forestimating dam breach survival probabilities. Draft Technical Report Canadian Hydraulics Centre
WHO (World Health Organization) (2002) Floods: climate change and adaptation strategies for humanhealth. WHO, Copenhagen
Wood M (2007) Wentworth river flood hazard assessment. Environment Waikito Technical Report 2007/16(draft)
Zhai G, Fukuzono T, Ikeda S (2006) An empirical model of fatalities and injuries due to floods in Japan.J Am Water Resour Assoc 42:863–875
Nat Hazards (2008) 46:353–389 389
123