Embed Size (px)
Citation preview
- 1-
California Test 357 STATE OF CALIFORNIA—BUSINESS, TRANSPORTATION AND HOUSING AGENCY March 2014
DEPARTMENT OF TRANSPORTATION DIVISION OF ENGINEERING SERVICES Transportation Laboratory 5900 Folsom Boulevard Sacramento, California 95819 – 4612
METHOD OF TEST FOR OBTAINING DEFLECTION MEASUREMENTS AND LAYER THICKNESS INFORMATION FOR REHABILITATION DESIGN OF HOT MIX
ASPHALT SURFACED PAVEMENTS USING MECHANISTIC-EMPIRICAL DESIGN AND ANALYSIS PROCEDURES
A. SCOPE
This test method presents the basic methodology for collecting deflection data by performing
Falling Weight Deflectometer (FWD) testing and pavement coring needed for rehabilitation
design of Hot Mix Asphalt (HMA) surfaced pavements using the California Department of
Transportation (Caltrans) Mechanistic-Empirical (ME) design procedures. The FWD and pavement layer thickness data are used for back calculation of the existing pavement layer moduli using the Caltrans software CalBack. The Caltrans ME based design software CalME
uses the backcalculated layers moduli for designing rehabilitation strategies.
B. EQUIPMENT
FWD EQUIPMENT
The FWD is commercially available in both vehicle and trailer mounted models. FWD models
vary amongst manufacturers, both in terms of the magnitude and duration of the load pulse as
well as the manner and accuracy of the deflection measurement system. All FWD models
operate on an impulse loading principle while stationary. An FWD provides an impulse load
that can be varied depending on the height of fall and mass used. The kinetic energy is
transferred to the pavement with a load pulse in approximately a half-sine wave form of 20 to 60 milliseconds duration through a plate that establishes a known load contact area. The
deflection sensors are placed at the center of the loading plate and at radial distances from the
center to measure the motion induced in the pavement. The pavement surface deflections and
load are displayed on a computer screen located in the vehicle and stored in a data file.
Pavement coring rigs are also commercially available in vehicle and trailer mounted units.
Various manufacturers produce a variety of coring rigs with different operational characteristics. However, all require manual information gathering and recording of pavement
layer thickness.
FWD SETUP
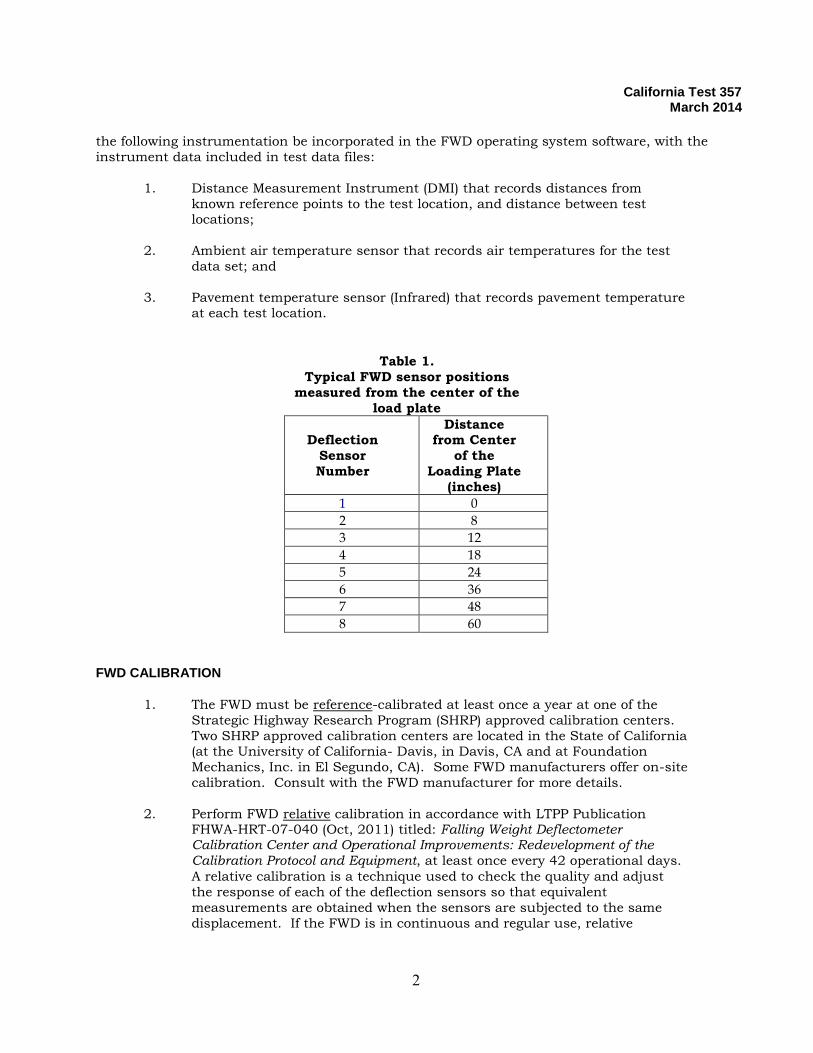
The FWD must be setup with at least eight sensors spaced as shown in Table 1. An additional
sensor(s) can be placed at a 72 in. distance, or at other distances if required by the Engineer. The FWD should also be equipped with a 12 in. loading plate. Caltrans also employs sensor 9
at minus 12 in., and sensor 10 at minus 8 in. from center of the load plate.
Caltrans recommends that the FWD operating system software be capable of saving the time
history for at least one drop per test point. Time histories can be valuable in the analysis of the
pavement.
If feasible, equip the FWD with a Differential Global Positioning System (DGPS) to record the
coordinates for every FWD test point (latitude, longitude and elevation). Caltrans requires that
California Test 357
March 2014
2
the following instrumentation be incorporated in the FWD operating system software, with the
instrument data included in test data files:
1. Distance Measurement Instrument (DMI) that records distances from
known reference points to the test location, and distance between test locations;
2. Ambient air temperature sensor that records air temperatures for the test
data set; and
3. Pavement temperature sensor (Infrared) that records pavement temperature at each test location.
Table 1.
Typical FWD sensor positions
measured from the center of the
load plate
Deflection
Sensor
Number
Distance from Center
of the
Loading Plate
(inches)
1 0
2 8
3 12
4 18
5 24
6 36
7 48
8 60
FWD CALIBRATION
1. The FWD must be reference-calibrated at least once a year at one of the
Strategic Highway Research Program (SHRP) approved calibration centers.
Two SHRP approved calibration centers are located in the State of California (at the University of California- Davis, in Davis, CA and at Foundation
Mechanics, Inc. in El Segundo, CA). Some FWD manufacturers offer on-site
calibration. Consult with the FWD manufacturer for more details.
2. Perform FWD relative calibration in accordance with LTPP Publication FHWA-HRT-07-040 (Oct, 2011) titled: Falling Weight Deflectometer Calibration Center and Operational Improvements: Redevelopment of the Calibration Protocol and Equipment, at least once every 42 operational days.
A relative calibration is a technique used to check the quality and adjust
the response of each of the deflection sensors so that equivalent
measurements are obtained when the sensors are subjected to the same
displacement. If the FWD is in continuous and regular use, relative

California Test 357
March 2014
3
calibration must be performed on a nominal monthly interval. Relative
calibration is not performed during periods when the FWD is idle.
3. If a major component such as a deflection sensor, multi-signal cable, or an
electronic board is replaced, the FWD should undergo reference calibration before continuing to collect data, regardless of the interval since the
previous reference calibration.
4. Ensure that the Distance Measuring Instrument (DMI) is calibrated. Check
that the temperature sensors are operational in accordance with the
manufacturer’s specifications. Perform calibrations or send the temperature sensors back to the manufacturer for repair/calibration if the temperatures
are not within the specified calibration limits.
PAVEMENT CORING RIG SETUP
1. The Pavement Coring Rig must be set up for the diameter of cores that are
required by the Engineer. In addition to layer thickness, material properties
may be evaluated by the Engineer. If feasible, the coring rig should be
equipped with Differential Global Positioning System (DGPS), a Distance
Measurement Instrument (DMI), a digital camera, and a core tray to obtain pavement core information (Note that some cameras have GPS capabilities).
2. Caltrans Districts may have waste water recovery requirements in place.
The coring rig must also be capable of recovering waste water, and have the
necessary spill prevention supplies to contain waste water.
C. BACKGROUND DATA AND SELECTION OF TESTING LEVEL
PRELIMINARY OFFICE WORK
1. Caltrans staff should review computerized Road view Explorer videos
(http://onramp.dot.ca.gov/photolog/roadview/roadview.php) and Pavement
Condition Survey files to determine the type of alignment, nature of distress and their locations, and unusual drainage conditions. If these files are not
available to the engineer, or are outdated, the project must be visually
inspected by the engineer to obtain these data prior to the deflection testing.
2. Determine the existing structural section (layer materials and thicknesses)
from contract records, previous deflection studies, or obtain it from
investigative field work, or from Ground Penetrating Radar (GPR) data for the project location. Note that Caltrans staff may contact the Office of
Pavement Management and Performance, Pavement Program, Division of
Maintenance to check if GPR thickness data is available, and/or request the
Office of Pavement Management and Performance to process available GPR
traces for the lanes under consideration.
2. Determine, through contacting the District Materials Engineer, District
Maintenance Engineer, and Project Engineer whether additional work has
been performed on the pavement since the last available Pavement
Condition Survey (PCS) or since the last GPR data were collected.

California Test 357
March 2014
4
3. Review Traffic Accident Surveillance System [TASAS] files (post-mile log) for
the project location to determine locations of structures, intersecting
streets, railroad crossings, etc.
4. Based on the pavement layer thicknesses and types obtained from
construction history, drawings, coring and/or GPR, and the pavement condition survey data, identify the uniform sections that have similar layer
thicknesses and types as well as a relatively uniform pavement surface
condition.
5. Determine the required level of testing (denoted by Levels AAA, AA, and A)
based on the design criteria obtained from the District Materials Engineer or the Project Engineer, where the level indicates the testing intensity as
discussed below.
6. Check maximum permissible and/or feasible length of lane closures the
traffic control crew can provide, and consider the time constraints to
determine the FWD testing and coring plans development. If testing cannot
be performed on all lanes due to traffic control and/or time restrictions,
plan testing priorities based on rehabilitation design needs. When testing
cannot be performed on all lanes, plan to start testing the highest priority lanes first.
7. Caltrans staff needs to work with District Maintenance to arrange and
schedule the required personnel and equipment to perform traffic control,
coring, GPR, and deflection testing, as well as any other
pavement/materials investigations.
PRELIMINARY FIELD WORK
The pavement design and analysis engineer should conduct a project field review to identify,
photograph, and record the nature, extent, and limits of the various distresses (e.g., cracks, rutting, bleeding, raveling, patching, potholes, and localized failures). Also record the crack
widths as hairline, 1/8 in. wide, ¼ in. wide, or greater than ½ in. wide for all longitudinal,
transverse, alligator, and block cracking. Record the crack frequency as isolated, occasional,
intermittent, nearly continuous, or continuous. Note the limits of any structural section
changes that are visible (e.g., an HMA pavement change to PCC), local drainage problems, any vertical controls (e.g., curbs, gutters, structures, etc.), and any roadway intersections. During
the project’s field review, determine if some of the above field activities may be done in
conjunction with the deflection data collection.
DETERMINE METHOD AND LEVEL OF TESTING
There are two methods of collecting deflection data: (1) Continuous Method, and (2)
Representative Section Method. In the Continuous Method, deflection testing is started at the beginning of the test section and continued at equal intervals to the end of the test section. In
the Representative Section Method, a test section of a certain length (e.g., 1000 ft., one-quarter
mile, or one-half mile) is identified in each lane-mile to represent the entire lane-mile, and testing is only done in the representative test section. The Continuous Method is the preferred
method that should be used on any project. However, local conditions, sight distance, traffic
control safety considerations, and the type of facility may not allow the use of this method. In this case, the Representative Section Method must be used. Additionally, the Representative

California Test 357
March 2014
5
Section Method should be used for all road segments less than 1.0 lane-mile in length. Once
field conditions improve for the next lane-mile segment, the Continuous Method should be
resumed. The two testing methods are further described below.
CONTINUOUS METHOD
With the Continuous Method, there are three levels of testing varying in the testing intensity that may be used. For a given project, an appropriate testing level is selected based on design
life and traffic data. Use this method for all road segments greater than 1.0 lane-mile in length
(unless conditions dictate otherwise). The three testing levels are described below.
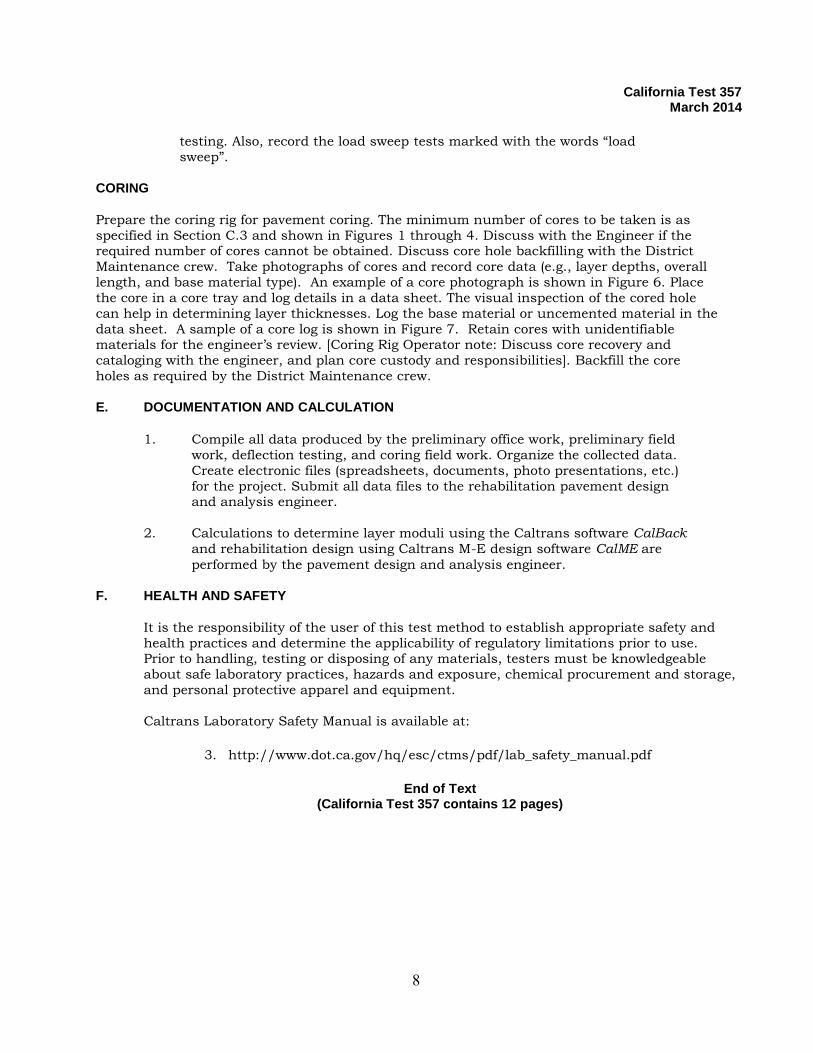
1. Level AAA
For all lanes considered for rehabilitation, measure deflections at 105 ft.
intervals in the safest wheel track to obtain 50 deflection measurements per 1.0 lane-mile. If the project is shorter than 1.0 lane-mile, use the
Representative Section Method discussed below. Begin testing at one Post
Mile limit of the project, and proceed toward the other Post Mile limit using
the 105 ft test intervals. Take 5 cores per lane mile. Longitudinally stagger
the testing pattern and core locations between adjacent lanes by 50 ft. as shown in Figure 1. [Safety note: For multilane divided facility outside lanes,
the right wheel track should be tested, and the left wheel track should be
tested for the inside lanes. This should help keep personnel and equipment
away from live traffic.] Discuss wheel track or center of lane testing with the
engineer. Level AAA also requires testing with load sweeps (see Section D).
For any given roadway segment where the Continuous Method cannot be done, perform the Representative Section Method described below.
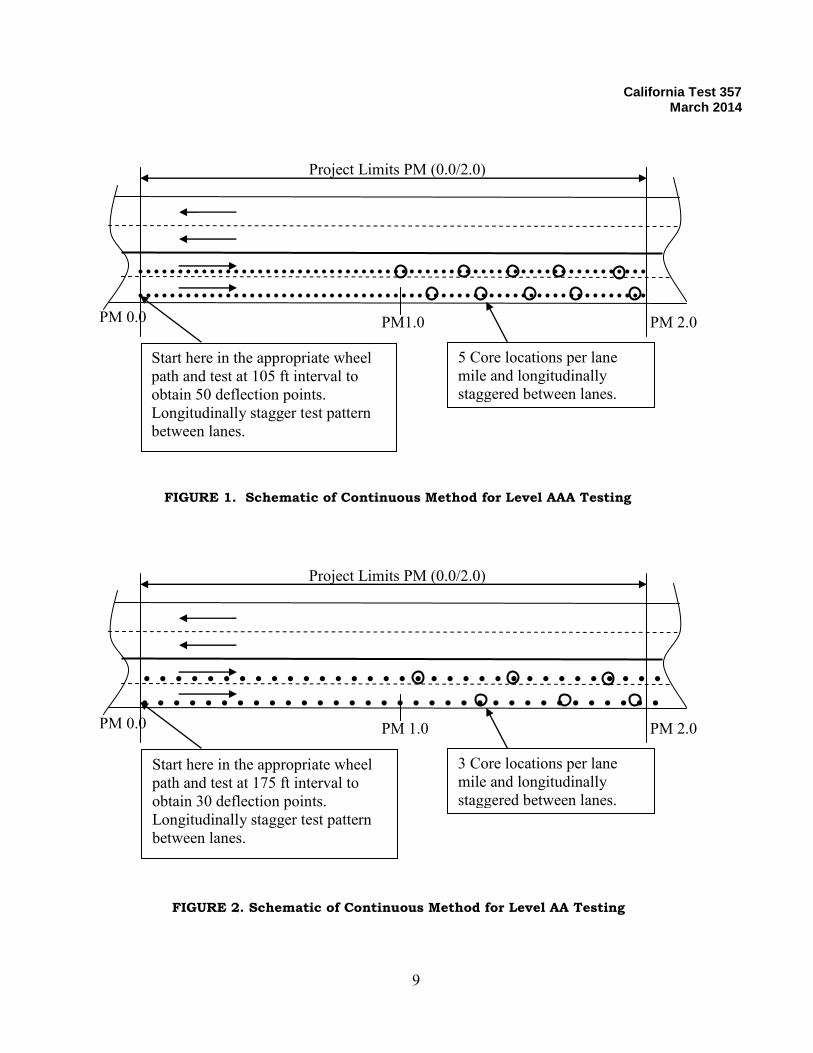
2. Level AA
For all lanes considered for rehabilitation, measure deflections at 175 ft.
intervals in the safest wheel track to obtain 30 deflection measurements per
1.0 lane-mile. If the project is shorter than 1.0 mile, use the Representative Section Method discussed below. Begin testing at one Post Mile limit of the
project, and proceed toward the other Post Mile limit using the 175 ft. test
intervals. Take 3 cores per lane mile. Longitudinally stagger the testing
pattern and core locations between adjacent lanes by 85 ft as shown in
Figure 2. Discuss wheel track or center of lane testing with the engineer.
Level AA also requires testing with load sweeps (see Section D). For any given roadway segment where the Continuous Method cannot be done,
perform the Representative Section Method described below.
3. Level A
For all lanes considered for rehabilitation, measure deflections at 250 ft.
intervals in the safest wheel track to obtain 21 deflection measurements per 1.0 lane-mile. If the project is shorter than 1.0 mile, use the Representative Section
Method. Begin testing at one Post Mile limit of the project, and proceed toward
the other Post Mile limit using the 250 ft. test intervals. Take 2 cores per lane
mile. Longitudinally stagger the testing pattern and core locations between
adjacent lanes, by 125 ft. as shown in Figure 3. Discuss wheel track or center of
lane testing with the engineer. For any given roadway segment where the

California Test 357
March 2014
6
Continuous Method cannot be done, perform the Representative Section Method
described below.
REPRESENTATIVE SECTION METHOD
1. With the Representative Section Method, the same three levels of testing
intensity apply (along with their respective design life and traffic data requirements). However, this method is used only when the Continuous
Method is not feasible.
2. For each lane considered for rehabilitation, select one of the possible test
intervals as given in Table 2 as “representative” of every 1.0 lane-mile of
roadway, or portion thereof if under 1.0 lane-mile.
3. Select test sections for each change in structural section or a change in overall surface distress condition. Obtain 2 cores in the tested wheel track
within the representative section; one core at each end. Figure 4 shows a
schematic of this testing method. Discuss wheel track or center of lane
testing with the engineer. Note: Multiple test sections per lane-mile are
possible.
Table 2.
Typical Test Sections and Testing Intervals
for Representative Section Method
Test Section Length
Testing Interval (ft)
Level AAA Level AA Level A Legacy 1000 ft 20 30 50
¼ mile 1320 ft 25 45 65
½ mile 2640 ft 50 90 125
¾ mile 3960 ft 80 130 185
Others Measure Calculate interval for 50 tests*
Calculate interval for 30 tests*
Calculate interval for 21 tests*
*Note: Round interval to nearest 5 ft.
D. DEFLECTION TESTING AND CORING FIELD WORK
GENERAL
1. Reference each test section to a known Post Mile as identified on TASAS
(e.g., structures, intersections, etc.)
2. For safety considerations, discuss the test sections with traffic control
personnel to include sufficient sight distance in both directions. Set up traffic control limits to avoid hazardous situations, but also to maintain
logical test sections.

California Test 357
March 2014
7
3. Obtain representative photographs of each test section and all areas of
major localized distress. Identify the project, lane, direction, Post Miles, and
date the photographs. An example of a test section photograph is shown in
Figure 5. Photograph and identify any other important roadway features.
Record all observed pavement conditions, road intersections, locations of large cuts and fills, vertical control features, post mile markers, air
temperature, and pavement surface temperatures. Also record any localized
drainage and/or embankment settlement problems, and any existing
structural section data. [Safety note: Should testing occur during night
work, traffic control may need to be arranged for photographs during the
day.]
4. Review all data for the test section’s direction, lane number, and
completeness before leaving the project site, and correct as necessary.
DEFLECTION DATA COLLECTION
***WARNING: DO NOT TEST OR CORE ON STRUCTURES***
1. Prepare the FWD equipment for deflection testing. Set up the test file with the appropriate information: project, lane, direction, Post Mile, date, etc.
2. Exercise the hydraulic system at the beginning of the shift (i.e., warm up
the system).
3. Bring the FWD to a stopped position at the beginning of the test section,
centered on the appropriate wheel track, and take a measurement. Apply
the loads using the following sequence:
a. One seating drop to ensure proper contact, usually 6 kips ±
10 %. This drop is not recorded.
b. Three drops with an applied load of 9 kips 10 %. [Engineer’s note: Drop sequence may need the loading increased to 12 kips or 15 kips] All
three drops are recorded.
4. Ensure that deflections are recorded from all of the sensors.
5. Run a deflection load sweep at 9, 12, and 15 kips at three locations per lane mile when continuously testing per Level AAA or Level AA. [Deflection Testing
Operator note: The load sweep tests will probably require a separate file and
test run in the test section. Use a 6 kip seating drop (unrecorded), followed by
the three drop load sweep (recorded).]
6. After each measurement, move the FWD forward to the next measurement point using the DMI.
7. Make sure that the deflections are being transferred electronically from all
sensors. Record the surface distress type in the vicinity of the test point, the
ambient air and pavement surface temperatures during testing, the test
location description, the equipment identification, and the date and time of
California Test 357
March 2014
8
testing. Also, record the load sweep tests marked with the words “load
sweep”.
CORING
Prepare the coring rig for pavement coring. The minimum number of cores to be taken is as
specified in Section C.3 and shown in Figures 1 through 4. Discuss with the Engineer if the required number of cores cannot be obtained. Discuss core hole backfilling with the District
Maintenance crew. Take photographs of cores and record core data (e.g., layer depths, overall
length, and base material type). An example of a core photograph is shown in Figure 6. Place
the core in a core tray and log details in a data sheet. The visual inspection of the cored hole
can help in determining layer thicknesses. Log the base material or uncemented material in the
data sheet. A sample of a core log is shown in Figure 7. Retain cores with unidentifiable materials for the engineer’s review. [Coring Rig Operator note: Discuss core recovery and
cataloging with the engineer, and plan core custody and responsibilities]. Backfill the core
holes as required by the District Maintenance crew.
E. DOCUMENTATION AND CALCULATION
1. Compile all data produced by the preliminary office work, preliminary field
work, deflection testing, and coring field work. Organize the collected data.
Create electronic files (spreadsheets, documents, photo presentations, etc.)
for the project. Submit all data files to the rehabilitation pavement design and analysis engineer.
2. Calculations to determine layer moduli using the Caltrans software CalBack and rehabilitation design using Caltrans M-E design software CalME are
performed by the pavement design and analysis engineer.
F. HEALTH AND SAFETY
It is the responsibility of the user of this test method to establish appropriate safety and
health practices and determine the applicability of regulatory limitations prior to use. Prior to handling, testing or disposing of any materials, testers must be knowledgeable
about safe laboratory practices, hazards and exposure, chemical procurement and storage,
and personal protective apparel and equipment.
Caltrans Laboratory Safety Manual is available at:
3. http://www.dot.ca.gov/hq/esc/ctms/pdf/lab_safety_manual.pdf
End of Text
(California Test 357 contains 12 pages)
California Test 357
March 2014
9
FIGURE 1. Schematic of Continuous Method for Level AAA Testing
Project Limits PM (0.0/2.0)
Start here in the appropriate wheel
path and test at 105 ft interval to
obtain 50 deflection points.
Longitudinally stagger test pattern
between lanes.
5 Core locations per lane
mile and longitudinally
staggered between lanes.
PM 0.0 PM1.0 PM 2.0
FIGURE 2. Schematic of Continuous Method for Level AA Testing
……………………………
………….
……………………………
………….
Project Limits PM (0.0/2.0)
Start here in the appropriate wheel
path and test at 175 ft interval to
obtain 30 deflection points.
Longitudinally stagger test pattern
between lanes.
3 Core locations per lane
mile and longitudinally
staggered between lanes.
PM 0.0 PM 1.0 PM 2.0

California Test 357
March 2014
10
FIGURE 3. Schematic of Continuous Method for Level A Testing
. . . . . . . . . . . . . . . . . . . . . . PM 0.0 PM 1.0
. . . . . . . . . . . . . . . . . . . . . .
Project Limits PM (0.0/2.0)
Start here in the appropriate wheel
path and test at 250 ft interval to
obtain 21 deflection points.
Longitudinally stagger test pattern
between lanes.
2 Core locations per lane
mile and longitudinally
staggered between lanes.
PM 2.0
FIGURE 4. Schematic of Representative Section Method
PM 0.0
Project Limits PM (0.0/2.0)
Core location at
beginning and end
of representative
test section.
Select a 1000 ft long representative section for every
1.0 mile long segment of the pavement, and perform
deflection testing at the interval specified in Table 2 to
obtain 50, 30, and 21 deflection points, respectively for
Levels AAA, AA, and A. Consider additional sections
if pavement structure or surface distress condition
change within each 1.0 mile long segment (i.e.,
multiple test sections per lane mile are possible).
PM 2.0 PM 1.0

California Test 357
March 2014
11
FIGURE 5. An Example Photograph of a Test Section
FIGURE 6. An Example Photograph of Core Sample

- 12-
STATE OF CALIFORNIA, DEPARTMENT OF TRANSPORTATION
Sheet 1 of 1
Division of Engineering Services Materials Engineering and Testing
Services
District-County-Route-PM/PM: 08-SBD. RT.138 0.0-.5 AND 10.7 T0 14.
Expense Authorization (EA): 08-4697V1
LOG OF CORE HOLES
DeflecTrack Number:
Core Rig Operator:
FRANCES CARSON D-08
Date of Coring:
1-20 TO 23-2004
Total Number of Cores: 14
Deflection Test Operator:
G. PAYNTAR
Date of Deflection Test: 1-20- TO 23-2004
Test Section
Core Hole Location (PM, Lane No.,
Direction)
Layer 1 (Seal
Coat?)
Layer 2 (Struct. Sect.)
Layer 3 (Struct. Sect.)
Layer 4 (Struct. Sect.)
Layer 5 (Base
Material) Total Core Thickness Remarks
1 PM. 0.80 LN. 1 WB 0.8 0.15 RM 0.95 AC + RM./ORG. GROUND
2 PM. 0.200 LN. 1 EB 0.53 0.2 RM 0.73 AC + RM./ORG. GROUND
3 PM. 1.150 LN. 1 EB 0.6 ORG. GROUND 0.6
3 PM. 1.550 LN. 1 EB 0.6 ORG. GROUND 0.6
4 PM. 1.800 LN. 1 WB 0.5 0.15 RM 0.65 AC + RM./ORG. GROUND
5 PM. 2.230 LN. 1 EB 0.6 0.25 RM AC + RM./ORG. GROUND
6 PM. 2.500 LN. 1 WB 0.5 0.33 RM 0.83 AC + RM./ORG. GROUND
7 PM. 3.200 LN. 1 EB 0.6 0.25 RM 0.85 AC + RM./ORG. GROUND
8 PM. 3.850 LN. 1 WB 0.55 0.2 RM 0.75 AC + RM./ORG. GROUND
9 PM. 4.658 LN. 1 WB 0.65 ORG. GROUND 0.65
10 PM. 4.140 LN. 1 EB 0.66 ORG. GROUND 0.66
12 PM. 13.750 LN. 1 WB 0.2 0.25 RM 0.45 AC + RM./ORG. GROUND
13 PM. 13.440 LN. 1 WB 0.4 0.3 RM 0.7 AC + RM./ORG. GROUND SAMI AT .07
14 PM. 11.450 LN. 1 EB 0.45 0.35 RM 0.8 AC + RM. / ORG GROUND SAMI AT .15
Core Log Prepared By: GEORGE PAYNTAR 1-26-04
(Name and Date)
FIGURE 7. Example of Core Log