Embed Size (px)
Citation preview

METHOD DEVOLOPMENT AND VALIDATION FOR
ESTIMATION OF CURCUMIN IN POLY HERBAL
FORMULATION BY RP-HPLC
Dissertation
Submitted to
THE TAMILNADU Dr. M. G. R. MEDICAL UNIVERSITY,
CHENNAI
in partial fulfillment for the award of the degree of
MASTER OF PHARMACY
IN
PHARMACEUTICAL ANALYSIS
DEPARTMENT OF PHARMACEUTICAL ANALYSIS
K. M. COLLEGE OF PHARMACY MELUR ROAD, UTHANGUDI,
MADURAI – 625107.
APRIL-2012

Certificate
This is to certify that the dissertation entitled “METHOD DEVELOPMENT
AND VALIDATION FOR ESTIMATION OF CURCUMIN IN POLY HERBAL
FORMULATION BY RP-HPLC” submitted by Mr. RAVIKISHORE. KV
(Reg.No: 26101727) in partial fulfillment for the degree of Master of Pharmacy in
Pharmaceutical Analysis under The Tamil Nadu Dr. M.G.R. Medical University,
Chennai at K. M College of pharmacy, Madurai-107. It is a bonafide work carried
out by him under my guidance and supervision during the academic year 2011-2012.
This dissertation partially or fully has not been submitted for any other degree or
diploma of this university or other universities.
GUIDE HOD Dr. M. Sundara pandian., M. pharm., Ph.D., Dr. S. Meena., M.pharm.,ph.D., Asst. Professor, Professor, Dept., of Pharmaceutical Analysis, Dept.,of PharmaceuticalAnalysis, K. M. College of Pharmacy, K. M. College of Pharmacy, Madurai – 625107. Madurai – 625107.
PRINCIPAL
Dr. S. JAYAPRAKASH., M. Pharm., Ph.D., Professor,
Dept. of Pharmaceutics, K.M. College of Pharmacy, Madurai- 625107.

Acknowledgement
Completing a task is never a one man effort. It is often a result of invaluable
contributions of a number of individuals in a direct or indirect manner. This suitably
applies to my dissertation work.
First and foremost i thank the Almighty God and my parents for all the
blessings bestowed upon me, which enabled me to successfully complete my project.
I extend my extreme sense of gratitude and profound thanks to my guide
Dr. M. Sundara pandian., M. Pharm., ph.D., Asst.professor, Department of
Pharmaceutical analysis, K.M college of pharmacy, Madurai, for his precious
guidance, encouragement and abundant help. His enthusiastic and inspiring
discussion and timely suggestions which proved for the success of this work.
With due respect, I express my profound indulge and praise to my most
Honorable Chairman, Prof. M. Nagarajan., M. Pharm., MBA., DMS(IM).,
DMS(BM)., and Honorable Principal, Dr. S. Jayaprakash., M. Pharm., Ph. D.,
K. M. College of Pharmacy, Madurai for their incentive co-operation and
encouragement.
It is my pleasant duty to express my extreme sense of gratitude and
indebtedness to Prof. Dr. S. Meena., M. Pharm., Ph.D., Head of the Department,
Department of Pharmaceutical Analysis, K. M. College of Pharmacy, Madurai for her
efficient guidance, administration, invaluable advice and constant encouragement in
nurturing up this project work, a grand success.
I explain my extreme sense of gratitude profound thanks to
Prof. M.S. Prakash, M. Pharm., department of pharmaceutical analysis, K.M
College of pharmacy, Madurai for his incentive corroboration and encouragement.
I’m deeply indebeted to Mr.M. Boopathi, M. Pharm., lecturer, department
of of pharmaceutical analysis, K.M.College of pharmacy, Madurai for his valuable
support.

I extend my heartfelt thanks to Prof. K. V. Ramseshu, M.Sc., Dept. of
Biochemistry, K. M. College of Pharmacy, Madurai, for his invaluable advice,
suggestion and encouragement extended throughout the work.
I express my deep sense of gratitude to my industrial guide Mr. P. Kumar,
Msc.,M.phill., Scientist-1. General product development, apex Laboratories
Limited for his valuable guidance throughout the entire project work.
I feel immensely delighted expressing my copious, sincere thanks
from the core of my heart and deep sense of my indelible gratitude to
Mr. G. K. SIVARAMAN, Msc., MBA., Deputy General Manager – product
Development, apex Laboratories Limited for providing necessary facilities,
encouragement, constructive suggestions and constant inspirations throughout the
entire dissertation work.
I express my hearty geratitude and sincere thanks to Mr. Ramkumar,
scientist-2, Mr.K. Senthil Nathan, scientist-1, Mr. Esakia raja selvan, scientist-
1,and Mr. J. Henald John JayaKumar, Research associate-2, product Development,
apex Laboratories Limited for their Keen interest and Kind co-operation in helping
me to complete the work successfully
Thank you is a very small word to express my gratitude to Mr.
Ravichandran, M.pharm., Mr. Yuvaraj, M.pharm., Mr. Saravana kumar,
M.pharm., Mr. Bharani, M.pharm., Mr.Thangavelu pandian, M.pharm., Mr.
Purnachandra rao, M,pharm., Mr. Shakthi kumar, M.pharm and Miss. Aarthi
rajeswran, M.pharm., Research associate-1. General product development, apex
Laboratories Limited, who had been a constant guide to me thought this work and
taught me the nuances of experimentation and the interpretation of results which has
shaped up my dissertation in to its present form.
My sincere thanks goes to M. Shanthi, B.A, M.Li.Sc., Librarian, and Mrs. Angelo
Merina, Mrs. S. Kalpana Devi, Lab Assistant and Mrs. J. Sridevi and all other non
teaching staff members of our college for their co-operation.

With great pleasure I extend my heartfelt thanks to my grandfather
Mr.K.V. Narayana, M.D., of narayana pearls, and my uncle Mr. Kotte
Venkatachary for giving this tremendous opportunity to do this project in this
esteemed organization.
I specially thank all my batch mates K. Kiran kumar, P. Mallikharjun,
G. Somavel, Jothibasu, K. Sravani, Y. Kinnera, D. Jyothi, Princy prasanna.and
my senior P.Rajasing .and my junior’s Krishna reddy, Sasi kumar and Lalith
who helped me directly and indirectly for the successful completion of my project
work.
I owe my thanks to my friends, Rama.v, vijaya lakshmi, bindhu madhavi,
Dayakar babu, madhu Krishna and ravi kumar for their help during my work.
I sincerely acknowledge the authorities of apex Laboratories Limited. GPD,
Alathur, kanchipuram (dt), Tamilanadu. For providing necessary to carry out my
project work.
As a final word, I would like to thank each and every individual whose name I
may have forgotten to mention and who have been a source of support and
encouragement and helped me to achieve my goal and complete my dissertation work
successfully.
Ravikishore.KV…..

Chapter-1 Introduction to analytical chemistry
Department of Pharmaceutical analysis, K.M college of pharmacy, Madurai. Page 1
1. INTRODUCTION
1.1 Introduction to analytical chemistry (1)
The pharmaceutical analysis defined as “the branch of practical chemistry
which deals with the resolution, separation, identification, determination and
purification of a given sample of a medicine, the detection and estimation of
impurities, which may be present in drug substance (or) given sample of medicine”.
The substance may be a single compound or a mixture of compounds and may
be in the form a tablet, pill, capsule, ampoule, liquid, mixture or an ointment.
The quality control tests involve methods which embrace chemicals, physio -
chemical/ instrumental, microbiological (or) biological procedures.
The pharmaceutical analysis deals with the subject of determining the
composition of material in terms of the elements or compound (drug) present in the
system.
Any type of analysis involves two steps
Identification (qualitative)
Estimation (quantitative)
In qualitative analysis, a reaction is performed in such a way as to indicate the
formation of a precipitate, a change of a colour, the dissolution of a precipitate/
complex formation and the evaluation of a gas.
Quantitative analysis is performed ordinarily through five steps. They are
sampling, dissolution, precipitation, measurement and calculation.

Chapter-1 Introduction to analytical chemistry
Department of Pharmaceutical analysis, K.M college of pharmacy, Madurai. Page 2
Analytical Techniques (2, 3,4)
1) Titrimetric methods
a) Acid – Base titrations
b) Redox titrations
c) Precipitation titrations
d) Non-aqeous titrations
e) Diazotisation titrations
2) Gravimetric methods
a) Weighing of drug after extraction.
b) Weighing of derivative after separation.
c) Weighing residue after ignition.
3) Spectrophotometric Methods
a) Colourimetric method
b) Ultra violet method
c) Fluorimetric method
d) Flame photometry
e) Atomic absorption spectroscopy.
f) Infrared spectrophotometry
g) Raman spectroscopy
h) X-ray spectroscopy
i) Mass spectroscopy

Chapter-1 Introduction to analytical chemistry
Department of Pharmaceutical analysis, K.M college of pharmacy, Madurai. Page 3
4) Electro analytical methods
a) Potentiometry
b) Voltametry
c) Amperometry
d) Electrogravimetry
e) Conductometry
f) Polarography
5) Chromatographic methods
a) Thin layer chromatography
b) Paper chromatography
c) Column chromatography
d) Gas chromatography
e) High Performance Liquid Chromatography
6) Hyphenated techniques a) GC-MS (Gas chromatography – Mass spectrometry)
b) LC-MS (Liquid chromatography – Mass spectrometry)
c) GC-IR (Gas chromatography – Infrared spectroscopy)
d) ICP-MS (Inductively coupled plasma – Mass spectrometry)
7) Miscellaneous methods a) Thermal analysis
b) Kinetic techniques
c) Enzyme assay
d) Microbiological procedure
e) Biological procedure

Chapter-1 Introduction to analytical chemistry
Department of Pharmaceutical analysis, K.M college of pharmacy, Madurai. Page 4
Different instrumental methods with basic principle
Sr. N0. MEHTOD BASIC PRINCIPLE
A ELECTROANALYTICAL METHODS
1 Potentiometry
Concerned with change in electrical properties of the system measures the change in electrode potential during a chemical reaction of the system
2 Conductometry Measures the change in electrical conductivity during a chemical reaction
3 Polarography Measures the current at various applied potential indicating the polarization at indicator electrode
4 Amperometry Measures the change (or decrease) in current at a fixed potential during addition of titrant
B SPECTROSCOPIC METHODS
1 Absorption spectroscopy (Ultraviolet – visible and infrared)
Measures the absorbance or percent transmittance during the interaction of monochromatic radiation (or particular wavelength) by the same
2 Fluorimetry Measures the intensity of fluorescence caused by emission of electromagnetic radiation due to absorption of UV radiation
3 Flame Photometry Measures the intensity of emitted light of particular wave length emitted by particular element
4 Turbidimetry Measures the turbidity of a system by passing light beam in a turbid media

Chapter-1 Introduction to analytical chemistry
Department of Pharmaceutical analysis, K.M college of pharmacy, Madurai. Page 5
Sr. N0.
MEHTOD BASIC PRINCIPLE
5 Nephlometry Measures the opalescence of the medium by reflection of light by a colloidal solution
6 Atomic Absorption Spectroscopy
Measures the intensity of absorption when atoms absorbs the monochromatic radiation
7 X-Ray Spectroscopy
Measures the position and intensity of spectral lines during emission of X-ray spectrum by atoms under influence of X-rays
8 Refractometry Measures the refractive index by causing refraction of light by matter
9 Polarimetry Measures optical reaction by causing the rotation of plane polarized light
C Mass Spectroscopy Observe the position and intensity of signals in mass spectrum by causing the ionization of molecules
D NMR Spectroscopy
Observe the position and intensity lines in NMR spectrum when proton interact with electromagnetic radiation in radio frequency region
E Thermal Methods
Measures the physical parameters of the system as a function of temperature. It includes thermo gravimetry, derivative gravimetry and differential thermal analysis
F Radiometric Methods Measure the radioactivity either present naturally or induced artificially

Chapter-1 Introduction to analytical chemistry
Department of Pharmaceutical analysis, K.M college of pharmacy, Madurai. Page 6
PHASES IN ANALYTICAL CHEMISTRY (5)
Phase 1: Fast screening phase eg: Immuno assay, gas chromatography and
Liquid chromatography.
Phase 2: Identification phase eg : GC – MS.
Phase 3: Qualification phase eg : Spectrophotometer and gas chromatography.
IMPORTANT CONSIDERATIONS IN ANALYTICAL METHODS (6)
The instrument is the most visible and exciting element of the analytical method
and it is only one component of the total analysis.
• The analyst should determine the nature of the sample, the end use of the
analytical results, the species to be analyzed.
• Quantitative information may include elemental composition, oxidation state,
functional groups, major components, minor components, complete
identification in the given sample.
• Quantitative data include accuracy, precision and range of expected analyte.
• Methods such as controlling the atmosphere to which the sample is exposed,
controlling the temperature of the sample, buffering the pH of sample
solutions.
SENSITIVITY AND DETECTION LIMITS (7)
TECHNIQUES DETECTION LIMITS IDENTIFICATION
LIMITS
Gas chromatography
Infrared spectrophotometry
Ultraviolet spectroscopy
N.M.R(time averaged)
Mass spectrometry
(batch inlet)
Mass spectrometry
(direct probe )
10-6-1012
10-7
10-7
10-7
10-6
10-12
-
10-6
10-6
10-5
10-5
10-11

Chapter-1 Introduction to analytical chemistry
Department of Pharmaceutical analysis, K.M college of pharmacy, Madurai. Page 7
Factors Affecting the Choice of Analytical Methods (8)
The type of analysis required.
Problem arising from the nature of the material.
Possible interference from components of the material other than those of
interest.
The concentration range which needs to be investigated.
The accuracy required.
The facilities available.
The time required for complete analysis.
Similar type of analysis performed.

Chapter-1.2 Chromatography
Department of Pharmaceutical analysis, K.M college of pharmacy, Madurai. Page 8
1.2 CHROMATOGRAPHY INTRODUCTION
Chromatography is a technique for the separation of the compounds of
mixtures by their continuous distribution between two phases. One is stationary phase
and the other is mobile phase. As a general rule, highly polar materials are best
separated using partition chromatography, while very nonpolar materials are separated
using adsorption chromatography. Between extremes, either process might be
applicable.
In this two mutually immiscible phases are brought in to contact one phase is
stationary and other is mobile. Species in the sample undergo repeated interactions
(partitions) between the mobile phase & stationary phase. The components are
gradually separated in to bands in mobile phase. It is an analytical chromatographic
technique that is useful for separating ions / molecule that are dissolved in a solvent.
Classification of chromatography
Gas chromatography Liquid chromatography
Gas liquid Gas solid Liquid- liquid Liquid solid Ion
exchange
exchange exchange
GLC GSC LLC LSC IEC
Bonded Phase Ion pair

Chapter-1.3 High performance Liquid Chromatography
Department of Pharmaceutical analysis, K.M college of pharmacy, Madurai. Page 9
1.3 HIGH PERFORMANCE LIQUID CHROMATOGRAPHY (9)
High performance liquid chromatography is the fasted growing analytical
technique for the analysis of drugs. Its simplicity, high specificity and wide range of
sensitivity make it ideal for the analysis of many drugs in both dosage forms and
biological fluids. The rapid growth of HPLC has been facilitated by the development
of reliable, moderately priced instruments and efficient columns.
High performance liquid chromatography is a convenient separation
technique used for wide types of samples, with exceptional resolving power, speed
and nano molecular detection levels. It is presently used in pharmaceutical research
and developments in the following ways:
To purify synthetic or natural products.
To characterize the metabolites.
To assay active ingredients, impurities, degradation products and in
dissolution assays.
In pharmacodynamic and pharmacokinetic studies.
Chromatography encompasses a diverse group of methods that are utilized for
the separation of closely related components of mixtures. In all chromatographic
separations, the sample is transported within the mobile phases, which may be a gas
(GC), a liquid (LC) or a supercritical fluid chromatography (SFC). In column
chromatography, the stationary phase is contained within a narrow tube through
which the mobile phase is forced by gravity or under pressure. The components of
the mixture to be analyzed distribute themselves between the mobile phase and
stationary phase in varying proportions. Compounds that interact strongly with the
stationary phase migrate very slowly with the mobile phase in contrast; compounds
that are weakly retained by the packing material migrate rapidly with the mobile
phase. As a consequence of the differences in mobility between the individual
components of a mixture, the sample components are separated into discrete bands (or
zones) that emerge from the column at specific ‘retention times. These bands may be
identified qualitatively and /or further analyzed quantitatively using an appropriate
detector.

Chapter-1.3 High performance Liquid Chromatography
Department of Pharmaceutical analysis, K.M college of pharmacy, Madurai. Page 10
Early, liquid chromatography was carried out in glass columns with diameter
of 1 to 0.5 cm and length of 50 to 500 cm. The average diameter of the solid
stationary phase particles was usually in the 100 to 200 micron range. Recent
technology has allowed for the development of packing material with relatively small
particles size diameter (3-10 µ). This technology resulted in the development of
columns with very high efficiencies and consequently has involved the use of more
sophisticated instrumentation to perform at increased pressures and flows hence the
term High Performance Liquid Chromatography (HPLC) was given to this technique.
The typical HPLC separation is based on the selective distribution of analytes
between a liquid mobile phase and an immiscible stationary phase. The sample is first
introduced by means of an injection port into the mobile phase stream that is delivered
by a high-pressure pump.
The method is popular because it is non-destructive and may be applied to
thermally liable compounds (unlike GC); it is also a very sensitive technique since it
incorporates a wide choice of detection methods. With the use of post-column
derivatisation methods, selectivity and detection limits are improved. HPLC can
easily be extended to trace determination of compounds that do not usually provide
adequate detector response. The wide applicability of HPLC as a separation method
makes it valuable separation tool in many scientific fields.
Advantages:
• Separation is fast and efficient
• Continuous monitoring of the column effluent
• Can be applied to the separation and analysis of very complex mixture
• Accurate quantitative measurements
• Repetitive and reproducible analysis using the same column
• Adsorption, partition, ion exchange and exclusion column separations are
excellently made
• Automation of the analytical procedure and data handling
• Both aqueous and non aqueous samples can be analysed
• Providing a high degree of selectivity for specific analysis
Chapter-1.3 High performance Liquid Chromatography
Department of Pharmaceutical analysis, K.M college of pharmacy, Madurai. Page 11
• Determination of multiple components in a single analysis
Principle of separation in HPLC (6)
The principle of separation in normal phase and reverse phase mode is the
adsorption. When a mixture of components is introduced in to a HPLC column, they
travel according to their relative affinities towards the stationary phase. The
component which has more affinity towards the adsorbent travels slower. The
components which have less affinity towards the stationary phase travel faster. Since
no two components have the same affinity towards the stationary phase and so the
components are separated.
Types of HPLC techniques
a) Based on modes of chromatography
• Normal phase mode
• Reverse phase mode
b) Based on principle of separation
• Adsorption chromatography
• Ion exchange chromatography
• Ion pair chromatography
• Size exclusion or gel permeation chromatography
• Affinity chromatography
• Chiral phase chromatography
c) Based on elution technique
• Isocratic separation
• Gradient separation
d) Based on scale of operation
• Analytical HPLC
• Preparative HPLC
Chapter-1.3 High performance Liquid Chromatography
Department of Pharmaceutical analysis, K.M college of pharmacy, Madurai. Page 12
Normal phase chromatography In normal phase mode, the stationary phase (silica gel) is polar in nature and
the mobile phase is non-polar. In this technique, non-polar compounds travel faster and eluted first. This is because of less affinity between solute and stationary phase. Polar compounds are retained for longer time in the column because of more affinity towards stationary phase and take more time to be eluted from column. Reverse phase chromatography In reverse phase technique, a non polar stationary phase is used. The mobile phase is polar is in nature hence polar components get eluted first and non-polar compounds are retained for a longer time. Since most of the drugs and pharmaceuticals are polar in nature, they are not retained for a longer time and eluted faster, which is advantageous. Different columns used are ODS (octadecyl silane) or C18, C8 and C4 etc. Adsorption chromatography The principle of separation is adsorption. The separation of components takes place because of the difference in affinity of compounds towards stationary phase. Ion exchange chromatography
The principle of separation is ion exchange which is reversible exchange of functional groups. In ion exchange chromatography, an ion exchange resin is used to separate a mixture of similar charged ions.
Ion pair chromatography
In ion pair chromatography a reverse phase column is converted temporarily in to ion exchange column by using ion pairing agents like pentane, hexane, heptanes, octane, sulphonic acid sodium salt, tetramethyl or tetraethyl ammonium hydroxide.
Size exclusion or gel permeation chromatography
In this type of chromatography, a mixture of components with different molecular sizes is separated by using gels. The gel used acts as molecular sieve and hence a mixture of substance with different molecular sizes is separated. Soft gels like dextran, agarose or polyacrylamide are used. Semi rigid gels like polystyrene, alkyl dextran in non aqueous medium are also used.

Chapter-1.3 High performance Liquid Chromatography
Department of Pharmaceutical analysis, K.M college of pharmacy, Madurai. Page 13
Affinity chromatography
Affinity chromatography uses the affinity of the sample with specific
stationary phase. This technique is mostly used in the field of biotechnology,
microbiology and biochemistry.
Chiral phase chromatography
Separation of optical isomer can be done by using chiral stationary phases.
Different principles operate for different types of stationary phases and for different
samples. The stationary phases used for this type of chromatography are mostly
chemically bonded silica gel.
Isocratic separation
In this technique, the same mobile phase combination is used throughout the
process of separation. The same polarity or elution strength is maintained throughout
the process.
Gradient separation
In this technique, a mobile phase combination of lower polarity or elution
strength is used followed by gradually increasing the polarity or elution strength.
Analytical HPLC
Where only analysis of the samples are done. Recovery of the samples for
reusing is normally not done, since the sample used is very low. eg. µg quantities.
Preparative HPLC
Where the individual fractions of pure compounds can be collected using
fraction collector. The collected samples are reused. eg. Separation of few grams of
mixtures by HPLC.

Chapter-1.3 High performance Liquid Chromatography
Department of Pharmaceutical analysis, K.M college of pharmacy, Madurai. Page 14
INSTRUMENTATION (6)
The general instrumentation for HPLC incorporates the following components
• There is a solvent reservoir for the mobile phase.
• The mobile phase must be delivered to the column by some type of pump. To
obtain separations either based on short analysis time or under optimum
pressure, a wide range of pressure and flows is desirable. The pumping system
must be pulse-free or else have a pulse damper to avoid generating base line
instability in the detector.
• Sampling valves or loops are used to inject the sample into the flowing mobile
phase just at the head of the separation column. Samples should be dissolved
in a portion of the mobile phase (if possible) to eliminate an unnecessary
solvent peak .
• A head of the separation column there may be a guard column or an in –line
filter to prevent contamination of the main column by small particles.
• To measure column inlet pressure a pressure gauge is inserted in front of the
separation column.
• The separation column contains the packing needed to accomplish the desired
HPLC separation. These may be silicas for adsorption chromatography,
bonded phases for liquid-liquid chromatography, ion-exchange
chromatography, gels of specific porosity for exclusion chromatography or
some other unique packing for a particular separation method.
• A detector with some type of data handling devise completes the basic
instrumentation.
The essential parts of the high performance liquid chromatography are the
solvent reservoir, tubing, pump, Injection device, column, detector and recorders.
Chapter-1.3 High performance Liquid Chromatography
Department of Pharmaceutical analysis, K.M college of pharmacy, Madurai. Page 15
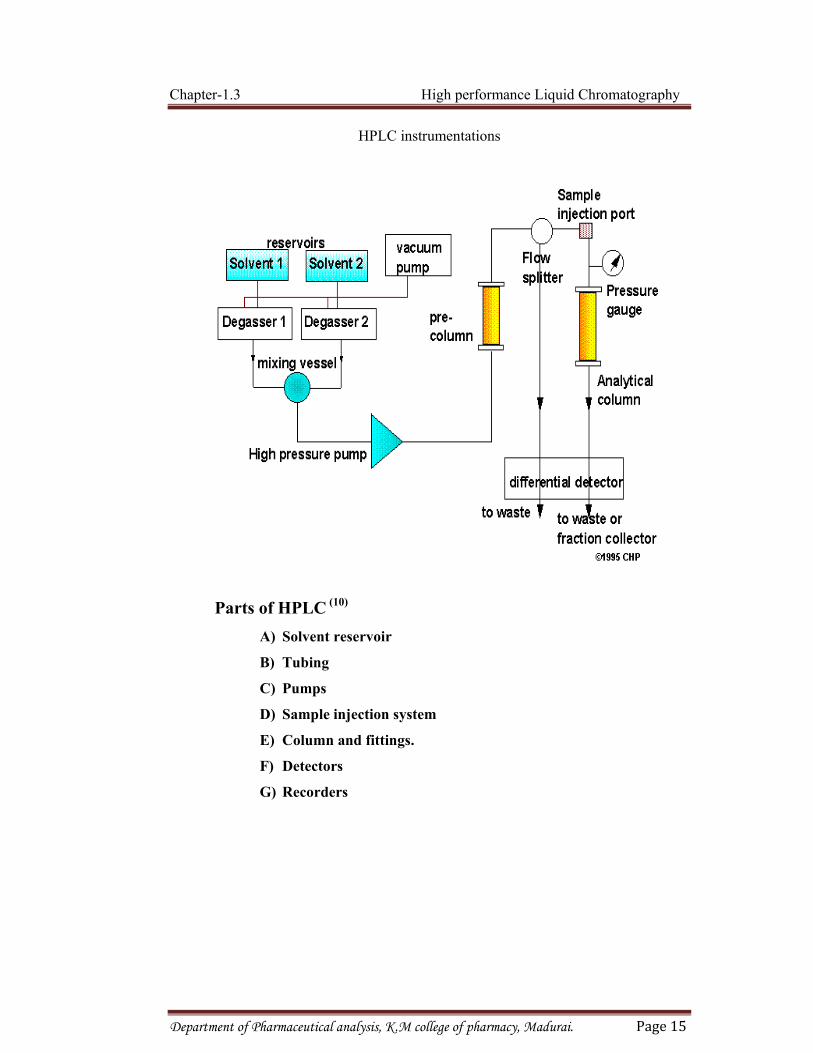
HPLC instrumentations
Parts of HPLC (10)
A) Solvent reservoir
B) Tubing
C) Pumps
D) Sample injection system
E) Column and fittings.
F) Detectors
G) Recorders

Chapter-1.3 High performance Liquid Chromatography
Department of Pharmaceutical analysis, K.M college of pharmacy, Madurai. Page 16
A) Solvent reservoir
The solvent reservoir should posses several characteristics. The composition of
the reservoir should render it inert to a variety of aqueous and non aqueous mobile
phases and should be clean. The volume capacity of reservoir of the reservoir should
be greater than 500 ml. Since mobile phase velocities are typically 1-2 ml/min this
volume provides for 4 hr of operation. It should have cap that allow the tubing inlet
line to pass through it in to reservoir. In many cases, aqueous solvents and some
organic solvents are degassed prior to use. This is done to prevent formation of gas
bubbles in the detectors. Stirring of mobile phase under the vacuum or sparing with
helium gas is effective ways of degassing. If the reservoir made up of the glass,
precaution should be taken to prevent to solvent spills in case of breakage of
reservoir. The reservoir should be placed in plastic containers.
B) Tubing
The nature of the tubing is used to connect all the parts of system deserves
some attention. The inside diameter of the tubing prior to the injection device is not
critical but tubing should be inert, have the ability to withstand pressure and be able to
carry sufficient volume. The length of the tubing, L that can be used with a maximum
band width increase of 5% can be calculated from.
40 VR2 Dm
L = --------------
Π F d4 N
Where,
VR – Is the volume retention in ml.
Dm – Is the solute diffusivity in cm2/sec
F – Is the flow rate in ml/sec.
d – Is the diameter of tube in cm
N – Is the column plate number.

Chapter-1.3 High performance Liquid Chromatography
Department of Pharmaceutical analysis, K.M college of pharmacy, Madurai. Page 17
C) Pumps
There are a number of different types of pumps that can provide the necessary
pressure and flow- rate required by the modern liquid chromatography. In the early
years of the LC renaissance, there were two types of pump in common use; they were
the pneumatic amplification and the syringe pump, which was simply a large, strongly
constructed syringe with a plunger that was driven by a motor. Today the majority of
modern chromatographs are fitted with reciprocating pump with either pistons or
diaphragms.
Pneumatic pump
The pneumatic pump has a much larger flow capacity than the piston type
pumps but, nowadays, is largely used for column packing and not for general
analysis. The pneumatic pump can provide extremely high pressures and is
relatively inexpensive, but the high pressure models are a little cumbersome
and, at high flow rates, can consume considerable quantities of compressed air.
Syringe pump
The syringe pump is a large, electrically operated simulation of a hypodermic
syringe. Although used in the early days of LC renaissance, it is rarely used today as,
due to its design, it can provide only a limited pressure and the volume of mobile
phase available pump is able for use is restricted to the pump volume. Unless the
separation is stopped while the pump is refilled and the development subsequently
continued. It only elute solutes that have retention volumes equal or less than the
pump capacity.
D) Sample injecting system (8)
Introduction of the sample is generally achieved is one of two ways, either by
using syringe injection or through a sampling valve. Septum injectors allow sample
introduction by a high pressure syringe through a self sealing elastomer septum. One
of the problems associated with septum injectors is the leaching effect of the mobile
phase in contact with the septum, which may give rise to ghost peaks. In general,
syringe injection for HPLC is more troublesome than in gas chromatography.

Chapter-1.3 High performance Liquid Chromatography
Department of Pharmaceutical analysis, K.M college of pharmacy, Madurai. Page 18
Although the problems associated with septum injectors can be eliminated by
using stop flow septum less injection. Currently the most widely used devices in
commercial chromatographs are the micro volume sampling valves. Which enable
sample to be introduced reproducibly in to pressurized columns without significantly
interrupting the flow of the mobile phase. The sample is loaded at atmospheric
pressure in to an external loop in the valve and introduced into the mobile phase by an
appropriate rotation of the valve. The volume of sample introduced, ranging from 2 µl
to over 100 µl, may be varied by changing the volume of the sample loop or by using
special variable volumes sample valves. Automatic sample injectors are also available
which allow unattended operation of the instrument. Valve injection is preferred for
quantitative work because of its higher precision compared to syringe injection.
E) Column
Since columns are tubular, column dimensions usually take the following
format, internal diameter X length (4.6mm X 250mm). As a mass spectroscopist you
will encounter columns ranging in internal diameter from 0.050 to 4.6 mm or even
larger if you are performing large scale preparative chromatography. For mass
spectrometry a short reverse phase column will work nearly as well as a longer
column and this is an important fact because shorter columns are generally cheaper
and generate less back pressure. Why is less back pressure important? If a column
runs at low pressure it allows the user more flexibility to adjust the flow rate.
Sometimes shorter columns are used to do fast chromatography at higher than normal
flow rates. In terms of length we routinely run 100 mm columns; however 50 mm or
30 mm columns may be adequate for many LC/MS separation needs.
The most common columns are packed with silica particles. The beads or
particles are generally characterized by particle and pore size. Particle sizes
generally range between 3 and 50 microns, with 5 µm particles being the most
popular for peptides. Larger particles will generate less system pressure and smaller
particles will generate more pressure. The smaller particles generally give higher
separation efficiencies. The particle pore size is measured in angstroms and generally

Chapter-1.3 High performance Liquid Chromatography
Department of Pharmaceutical analysis, K.M college of pharmacy, Madurai. Page 19
range between 100-1000 angstroms. 300 angstroms is the most popular pore size for
proteins and peptides and 100 angstroms is the most common for small molecules.
Silica is the most common particle material. Since silica dissolves at high pH,
it is not recommended to use solvents that exceed pH 7. However, recently some
manufactures have introduced silica based technology that is more resistant to high
pH, it is important to take note of the manufactures suggested use recommendations.
The stationary phase is generally made up of hydrophobic alkyl chains (-CH2-
CH2-CH2-CH3) that interact with the analyte. There are three common chain lengths,
C4, C8 and C18. C4 is generally used for proteins and C18 is generally used to capture
peptides or small molecules. The idea here is that the larger protein molecule will
likely have more hydrophobic moieties to interact with the column and thus a shorter
chain length is more appropriate. Peptides are smaller and need the more
hydrophobic longer chain lengths to be captured, so C8 and C18 are used for peptides
or small molecules. Here is an interesting note: Observations have been made that C8
columns are actually better for capturing smaller hydrophilic peptides, the theory here
is that the longer C18 chains lay down during the early aqueous period of the gradient
and the more hydrophilic peptides are not captured. We use C8 routinely for all
peptide work and this particular alkyl chain length works equally well if not better
than C18 for all peptides.
Chapter-1.3 High performance Liquid Chromatography
Department of Pharmaceutical analysis, K.M college of pharmacy, Madurai. Page 20
F) Detectors
Detector is the eye of LC system and measures the compounds after the
separation on the column. Before the first sample is injected, during method
development the chromatographer must ensure that the detector so selected is capable
of responding to changes in the concentration of all the components in the sample
with adequate sensitivity even to measure trace substances.
There are basically two types of detectors.
-Bulk property detectors
-Solute property detectors
The Bulk property detectors functions based on some bulk property of the
eluent, such as refractive index and are not suitable for gradient elution and are
usually less sensitive than solute property detectors. The solute property detectors
perform by measuring some type of physical or chemical property. Solute property
detectors are significantly more sensitive than bulk property detectors. Over 70% of
the HPLC detectors are solute property detectors.
Various detectors are used in HPLC they are,
(1) UV absorbance detector
(2) Fluorescence detector
(3) Electrochemical detector
(4) Conductivity detectors
(5) Refractive index detector
(6) Mass spectrometer.
UV Absorbance detectors:
The mobile phase is passed through a small flow cell, where the radiation
beam of a UV/visible photometer or spectrophotometer is located. As a UV-absorbing
solute passes through the flow cell, a signal is generated that is proportional to the
solute concentration. Only UV-absorbing compounds, such as alkenes, aromatics and
compounds that have multiple bonds between C and O, N or S are detected. The

Chapter-1.3 High performance Liquid Chromatography
Department of Pharmaceutical analysis, K.M college of pharmacy, Madurai. Page 21
mobile phase components should be selected carefully so that they absorb little or no
radiation.
Absorption of radiation as a function of concentration, c is described by the
beer-lamberts law.
A = εbc
Where, A = absorbance,
ε = molar extinction coefficient,
b = flow cell path length.
Three types of absorbance detectors are available: fixed-wavelength,
variable wavelength, and photodiode array. A fixed – wavelength detector uses a light
source that emits maximum light intensity at one or several discrete wavelength that is
isolate by appropriate filters. For example, with a commonly used mercury lamp, the
wavelengths of 254, 280, 313, 334 and 365 nm can be selected. A fixed-wavelength
detector is the most sensitive and least expensive of the three, but it is inflexible in
wavelength selection. A variable-wavelength detector uses a relatively wide band-
pass UV/visible spectrophotometer. It offers an increased number of UV and visible
wavelength, but it is more expensive than the fixed-wavelength detector. In order to
generate real-time spectra for each solute as it is eluted, a photodiode array is used.
UV LAMP UV DETECTOR
G) Computer, Integrator or Recorder:
A data collection device such as a computer, integrator or recorder is
connected to the detector. It takes the electronic signal produced by the detector and
plots it as a chromatogram, which can be evaluated by the user. Recorders are rarely
used today because they are unable to integrate the data. Both integrators and

Chapter-1.3 High performance Liquid Chromatography
Department of Pharmaceutical analysis, K.M college of pharmacy, Madurai. Page 22
computers can integrate the peaks in the chromatograms and computers have the
further advantage that they electronically save chromatograms for later evaluation
Isocratic and gradient elution
A separation in which the mobile phase composition remains constant
throughout the procedure is termed isocratic (meaning constant composition). The
mobile phase composition does not have to remain constant. A separation in which
the mobile phase composition is changed during the separation process is described as
a gradient elution. One example is a gradient starting at 10% methanol and ending at
90% methanol after 20 minutes. The two components of the mobile phase are
typically termed "A" and "B"; A is the "weak" solvent which allows the solute to elute
only slowly, while B is the” strong" solvent which rapidly elutes the solutes from the
column. Solvent A is often water, while B is an organic solvent miscible with water,
such as acetonitrile, methanol, THF or isopropanol.
Normal phase chromatography:
Normal phase HPLC (NP-HPLC) or adsorption chromatography, this method
separates analytes based on adsorption to a stationary surface chemistry and by
polarity. It was one of the first kinds of HPLC that chemists developed. NP-HPLC
uses a polar stationary phase and a non-polar, non-aqueous mobile phase and works
effectively for separating analytes readily soluble in non-polar solvents. The analyte
associates with and is retained by the polar stationary phase. Adsorption strengths
increase with increased analyte polarity and the interaction between the polar analyte
and the polar stationary phase (relative to the mobile phase) increases the elution time.
The interaction strength depends not only on the functional groups in the analyte

Chapter-1.3 High performance Liquid Chromatography
Department of Pharmaceutical analysis, K.M college of pharmacy, Madurai. Page 23
molecule, but also on steric factors. The effect of sterics on interaction strength allows
this method to resolve (separate) structural isomers. Use of more polar solvents in the
mobile phase will decrease the retention time of the analytes, whereas more
hydrophobic solvents tend to increase retention times. Very polar solvents in a
mixture tend to deactivate the stationary phase by creating a stationary bound water
layer on the stationary phase surface. This behavior is somewhat peculiar to normal
phase because it is most purely an adsorptive mechanism (the interactions are with a
hard surface rather than a soft layer on a surface).
Reverse phase chromatography:
Reversed-phase chromatography (RPC or RP-HPLC) includes any
chromatographic method that uses a non-polar stationary phase. Liquid
chromatography was done on non-modified silica or alumina with a hydrophilic
surface chemistry and a stronger affinity for polar compounds - hence it was
considered "normal". The introduction of alkyl chains bonded covalently to the
support surface reversed the elution order. Now polar compounds are eluted first
while non-polar compounds are retained – hence called as "reversed phase”
chromatography. RPC operates on the principle of hydrophobic interactions, which
result from repulsive forces between a polar eluent, the relatively non-polar analyte
and the non-polar stationary phase. The binding of the analyte to the stationary phase
is proportional to the contact surface area around the non-polar segment of the analyte
molecule upon association with the ligand in the aqueous eluent. The retention can be
decreased by adding a less polar solvent (methanol, acetonitrile) into the mobile phase
to reduce the surface tension of water. Gradient elution uses this effect by
automatically changing the polarity of the mobile phase during the course of the
analysis.
Retention characteristic in reverse phase chromatography:
Structural properties of the analyte molecule play an important role in its retention characteristics. In general, an analyte with a larger hydrophobic surface area (C-H, C-C and generally non-polar atomic bonds, such as S-S and others) results in a longer retention time because it increases the molecule's non-polar surface area, which is non-interacting with the water structure. On the other hand, polar groups, such as -

Chapter-1.3 High performance Liquid Chromatography
Department of Pharmaceutical analysis, K.M college of pharmacy, Madurai. Page 24
OH, -NH2, COO- or -NH3+ reduce retention as they are well integrated into water.
Very large molecules, however, can result in an incomplete interaction between the large analyte surface and the ligand's alkyl chains and can have problems entering the pores of the stationary phase. Retention time increases with hydrophobic (non-polar) surface area. Branched chain compounds elute more rapidly than their corresponding linear isomers because the overall surface area is decreased. Similarly organic compounds with single C-C-bonds elute later than those with a C=C or C≡C as the double or triple bond is shorter than a single C-C-bond.
Stationary phases in reverse phase chromatography: Any inert non-polar substance that achieves sufficient packing can be used for reversed-phase chromatography. The most popular column is a C18 bonded silica (USP classification L1) followed by C8 bonded silica (L7), pure silica (L3), cyano bonded silica (L10) and phenyl bonded silica (L11). That C18, C8 and phenyl are dedicated reversed phase packings while cyano columns can be used in a reversed phase mode depending on analyte and mobile phase conditions. Surface functionalization of silica can be performed in a monomeric or a polymeric reaction with different short-chain organosilanes used in a second step to cover remaining silanol groups (end-capping)
Mobile phase consideration in reverse phase chromatography: Mixtures of water or aqueous buffers and organic solvents are used to elute analytes from a reversed phase column. The solvents have to be miscible with water and the most common organic solvents used are acetonitrile, methanol or tetrahydrofuran (THF).
Other Solvents can be used such as ethanol, 2-propanol (iso-propyl alcohol). Elution can be performed isocratic (the water-solvent composition does not change during the separation process) or by using a gradient (the water-solvent composition does change during the separation process). The pH of the mobile phase can have an important role on the retention of an analyte and can change the selectivity of certain analytes. Charged analytes can be separated on a reversed phase column by the use of ion-pairing (also called ion-interaction). This technique is known as reversed phase ion-pairing chromatography.

Chapter-1.3 High performance Liquid Chromatography
Department of Pharmaceutical analysis, K.M college of pharmacy, Madurai. Page 25
VARIOUS METHODS OF QUANTITATIVE ANALYSIS IN HPLC (11, 12)
The sample or solute is analysed quantitatively in HPLC by either peak height
or peak area measurements. Peak areas are proportional to the amount of constant
rate. Peak heights are proportional to the amount of material only when peak width
are constant and are strongly affected by the sample injection techniques. Once the
peak height or the peak areas are measured, there are five principle evaluation
methods for quantifying the solute.
a) Calibration by Standards
Calibration curves for each component are prepared from pure standards,
using identical injection volumes of operating conditions for standards and samples.
The concentration of solute is read from its curve if the curve is linear.
X = K x Area.
Where, X = Concentration of solute.
K = Proportionality constant (slope of the curve).
In this evaluation method only the area of the peaks of interest is measured.
Relative response factors must be considered when converting areas to volume and
when the response of a given detector differs for each molecular type of compounds.
b) Internal Standard Method
In this technique a known quantity of the internal standard is chromatographed
and area versus concentration is ascertained. Then a quantity of the internal standard
is added to the raw sample prior to any sample pretreatment or separation operations.
The peak area of the standard in the sample run is compared with the peak
area when the standard is run separately. This ratio serves as a correction factor for
variation in sample size, for losses in any preliminary pretreatment operations or for
incomplete elution of the sample. The material selected for the internal standard must
be completely resolved from adjacent sample components, must not interfere with the
sample components and must never be present in samples.
Chapter-1.3 High performance Liquid Chromatography
Department of Pharmaceutical analysis, K.M college of pharmacy, Madurai. Page 26
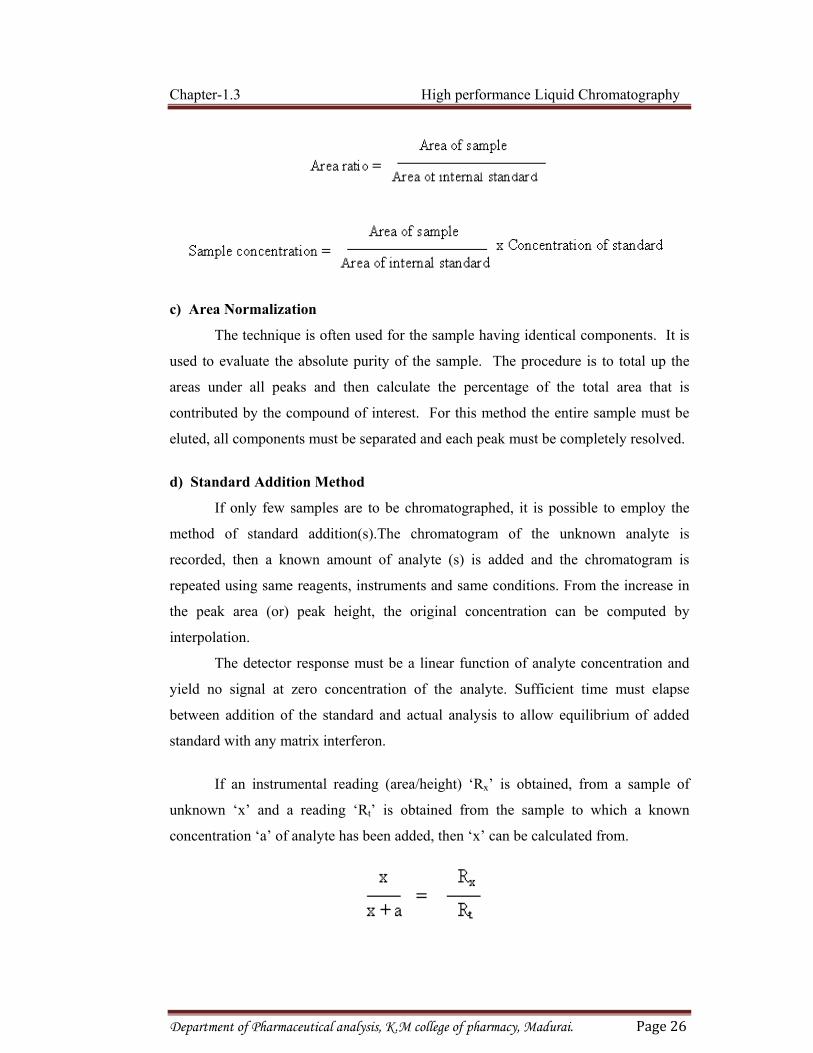
c) Area Normalization
The technique is often used for the sample having identical components. It is
used to evaluate the absolute purity of the sample. The procedure is to total up the
areas under all peaks and then calculate the percentage of the total area that is
contributed by the compound of interest. For this method the entire sample must be
eluted, all components must be separated and each peak must be completely resolved.
d) Standard Addition Method
If only few samples are to be chromatographed, it is possible to employ the
method of standard addition(s).The chromatogram of the unknown analyte is
recorded, then a known amount of analyte (s) is added and the chromatogram is
repeated using same reagents, instruments and same conditions. From the increase in
the peak area (or) peak height, the original concentration can be computed by
interpolation.
The detector response must be a linear function of analyte concentration and
yield no signal at zero concentration of the analyte. Sufficient time must elapse
between addition of the standard and actual analysis to allow equilibrium of added
standard with any matrix interferon.
If an instrumental reading (area/height) ‘Rx’ is obtained, from a sample of
unknown ‘x’ and a reading ‘Rt’ is obtained from the sample to which a known
concentration ‘a’ of analyte has been added, then ‘x’ can be calculated from.

Chapter-1.3 High performance Liquid Chromatography
Department of Pharmaceutical analysis, K.M college of pharmacy, Madurai. Page 27
A correction for dilution must be made if the amount of standard added
changes the total sample volume significantly. It is always advisable to check the
result by adding at least one other standard.
e) External Standard Method
It employs a separate injection of a fixed volume of sample and standard solution. The peaks are integrated and concentration is calculated.
The selection of suitable chromatographic (HPLC) system for a given
mixtures of solutes cannot be made with certainty and must be confirmed by
experiment. If the chemical nature of the sample components is known, then the phase
system can be selected from the literature references. If nothing is known about the
chemical nature of sample, then the sample solubility will give some indication as to
which chromatographic method to employ. The essential parts of high performance
liquid chromatographic system are solvent reservoir, pump, injection port, column,
detector and recorders.
1.4 SYSTEM SUITABILITY PARAMETERS (12)
System suitability testing is an integral part of many analytical procedures.
The tests are based on the concept that the equipment, electronics, analytical
operations, and samples to be analyzed constitute an integral system that can be
evaluated as such. System suitability test parameters to be established for a particular
procedure depend on the type of procedure being validated.
The parameters that are affected by the changes in chromatographic conditions
are,
• Column capacity factor (KA)
• Resolution (Rs)
• Selectivity (α)
• Column efficiency (N)
• Peak asymmetry factor (As)

Chapter-1.3 High performance Liquid Chromatography
Department of Pharmaceutical analysis, K.M college of pharmacy, Madurai. Page 28
i) Column capacity factor (KA)
The retention of a drug with a given packing material and eluent can be
expressed as retention time or retention volume, but both of these are dependent on
flow rate, column length and column diameter.
The retention is best described as a column capacity ratio (K), which is
independent of these factors. The column capacity ratio of a compound (A) is defined
as
0
0A
0
0AA t
ttV
VVK −=
−=
Where,
VA = Elution volume of A
V0 = Elution volume of a non retained compound (void volume)
At constant flow rate, retention times (tA and to) can be used instead of
retention volumes. Retention data is sometimes expressed, relative to a known
internal standard (B). The ratio of retention times (tA/tB) can be used, but the ratio of
adjusted retention times ⎟⎟⎠
⎞⎜⎜⎝
⎛−−
oB
oA
tttt
is better when data need to be transferred
between different chromatographs.
The values of k’ of individual bands increase or decrease with changes in
solvent strength. In reversed phase HPLC, solvent strength increases with the increase
in the volume of organic phase in the water / organic mobile phase. Typically an
increase in percentage of the organic phase by 10 % by volume will decrease k’ of the
bands by a factor of 2-3.

Chapter-1.3 High performance Liquid Chromatography
Department of Pharmaceutical analysis, K.M college of pharmacy, Madurai. Page 29
ii) Resolution (Rs)
The resolution, Rs of two neighboring peaks is defined by the ratio of the
distance between the two peak maxima. It is the difference between the retention
times of two solutes divided by their average peak width. For baseline separation, the
ideal value of Rs is 2.0. It is calculated by using the formula,
)WW(5.0RtRt
R21
12f +
−=
Where,
Rt1 and Rt2 are the retention times of components 1 and 2
W1 and W2 are peak widths of components 1 and 2.
iv) Selectivity (α)
The selectivity (or separation factor),α, is a measure of relative retention of
two components in a mixture. The ideal value of selectivity is 2. It can be calculated
by using the formula,

Chapter-1.3 High performance Liquid Chromatography
Department of Pharmaceutical analysis, K.M college of pharmacy, Madurai. Page 30
01
02
VVVV
−−
=α
Where, V0 is the void volume of the column and V2 and V1 are the retention
volumes of the second and the first peak, respectively.
v) Column efficiency
Efficiency, N, of a column is measured by the number of theoretical plates per
meter. It is a measure of band spreading of a peak. Smaller the band spread, higher is
the number of theoretical plates, indicating good column and system performance.
Columns with N ranging from 5,000 to 100,000 plates/meter are ideal for a good
system. Efficiency is calculated by using the formula,
2
2
16WRtN =
Where, Rt is the retention time and W is the peak width.
vi) Peak asymmetry factor (As)
Peak asymmetry factor, As can be used as a criterion of column performance.
The peak half width b of a peak at 10 % of the peak height, divided by the
corresponding front half width a gives the asymmetry factor.

C S
R
sc
ch
it
ea
co
o
b
x
v
C
pr
tw
P
Chapter-1.3
TATISTIC
Regression e
The l
cattered diag
It is u
haracterstic
t will be evid
ach to descr
oefficients w
f Y & X; b i
The re
= the slope
= an arbitra
alue of the c
Correlation c
A me
rovided by t
wo variables
Pearson’s co
The co
Where
AL PARAM
equation:
inear relatio
gram to clust
used to descr
(X), both X
dent that tw
ibe the depe
which shows
is the regress
egressive co
of the regres
arily chosen
criterion vari
coefficient:
easure of th
the coefficien
s is of the lin
orrelation:
orrelation co
e the values
METERS (1
onship is ch
ter along a s
ribe the depe
X,Y represent
o regression
endence of o
s change exp
sive coeffici
efficient of b
ssion line an
n value of th
iable is desir
he strength
nt of correla
near form. It
oefficient ca
of Correla
Correla
High pe
3)
haracterized
traight line,
Y=a + bX
endence of o
t values of t
n lines can b
one character
pected in Y f
ent of Y& X
b is estimate
nd is calculat
he predictor v
red.
of the rela
ation, denote
is also calle
lculation for
ation coeffic
ation coeffic
erformance L
by attenden
known as th
one characte
two characte
e computed
r to another.
for unit chan
X.
ed,
ted by this fo
variable for
ationship be
ed by r, if the
d the coeffic
r data values
ient are +1 –
ient is -1 – n
Liquid Chro
ncy of the
he regression
eristic (Y) up
ers, a,b are t
for every se
b is known
nge in X, it i
ormula
which the c
etween two
e relationship
cient of linea
s should be +
– positive
negative
omatography
points of th
n line.
p on the othe
two constan
et of data-on
n as regressiv
is dependenc
correspondin
o variables
p between th
ar correlation
+1 or -1
y
he
er
nts
ne
ve
ce
ng
is
he
n

Chapter-1.3 High performance Liquid Chromatography
Department of Pharmaceutical analysis, K.M college of pharmacy, Madurai. Page 32
1)( 2
−−Σ
nxx
Where,
X – Value of one character
Y – Value of another character
Standard deviation:
It is the square root of the average of the squared deviations of the
observations. From the arithmetic mean, it is used for measures of dispersion.
It is denoted by
Standard Deviation = -
R.S.D (%) = 100x
S.D×
Where Σ = Sum of observations
x = Mean or arithmetic average (Σx / n)
x = Individual observed value
x – x = Deviation of a value from the mean
n = Number of observations
Standard error of mean (S.E):
The population of standard deviation is not given, but the size of s is large, so
the sample standard deviation is representing the population of standard deviation.
S.E. = n
S.D
Where,
S.D = Standard deviation
n = no. of observation

Chapter-1.3 High performance Liquid Chromatography
Department of Pharmaceutical analysis, K.M college of pharmacy, Madurai. Page 33
1.5 ICH GUIDELINES FOR ANALYTICAL METHOD VALIDATION(14)
Method validation is the process to confirm that the analytical procedure
employed for a specific test is suitable for its intended use. Methods need to be
validated or revalidated,
Before their introduction into routine use
Whenever the conditions change for which the method has been validated,
e.g., instruments with different characteristics.
Whenever the method is changed and the change is outside the original scope
of the method. The International Conference on Harmonization (ICH) of
Technical Requirements for the Registration of Pharmaceutical for human use
has developed a consensus text on the validation of analytical procedures.
REASONS FOR VALIDATION
1. Enables scientists to communicate scientifically and effectively on technical
matters.
2. Setting standards of evaluation procedures for checking complaints and taking
remedial measures
3. Retrospective validation is useful for trend comparison of results compliance to
cGMP/GLP.
4. Closer interaction with pharmacopoeia harmonization particularly in respect of
impurities determination and their limits.
5. For taking appropriate action in case of non – compliance.
6. To provide high degree of confidence that the same level of quality is consistently
built into each unit of finished product from batch to batch.
As quality control process is not static, some form of validation / Verification
should continue till the validated process is in use.
Chapter-1.3 High performance Liquid Chromatography
Department of Pharmaceutical analysis, K.M college of pharmacy, Madurai. Page 34
The parameters as defined by the ICH and by other organizations Specificity Selectivity Precision
o Repeatability o Intermediate precision o reproducibility
Accuracy Linearity Range Limit of detection Limit of quantification Robustness Ruggedness
A) Specificity and selectivity i. Selectivity is the ability to measure accurately and specifically the analyte
in the presence of components that may be expected to be present in the sample matrix.
ii. Specificity for an assay ensures that the signal measured comes from the substance of interest and that there is no interference from excipient and/or degradation products and/or impurities.
iii. Determination of this can be carried out by assessing the peak identity and purity.
iv. Diode array detectors can facilitate the development and validation of HPLC assays. Spectra] data obtained from diode array detectors, effectively supplement the retention time data for peak identification, also spectral manipulation often provides information about the peak purity. The table below lists several of the techniques available for assessing peak identity and purity.
v. The purity index is a measure of the peak's relative purity, measured using a full comparison of spectral data for the leading and training edge of the peak. A value of 1.5 is commonly accepted to indicate a pure peak but >1.5 would indicate the presence of an impurity.
Chapter-1.3 High performance Liquid Chromatography
Department of Pharmaceutical analysis, K.M college of pharmacy, Madurai. Page 35
B) Precision
The precision of an analytical procedure expresses the closeness of agreement
between a series of measurement obtained from multiple sampling of the same
homogenous sample under the prescribed conditions. Precision of an analytical
procedure is usually expressed at the variance, standard deviation or coefficient of
variation of a series of measurements.
Validation of tests for assay and for quantitative determination of impurities
includes an investigation of precision.
Precision is a measure of the reproducibility of the whole analytical method
(including sampling, sample preparation and analysis) under normal operating
circumstances. Precision is determined by using the method to assay a sample for a
sufficient number of times to obtain statistically valid results (ie between 6 - 1
0). The precision is then expressed as the relative standard deviation
STD dev x 100% %RSD =
Mean
Repeatability
Express the precision under the same operating conditions over a short interval
of time. Repeatability is also termed as intra - assay precision. It should be assessed
using a minimum of nine determinations covering the specified range for the
procedure (e.g. three concentration/three replicates each) or a minimum of
determinations at 100% of the test concentration.
Intermediate precision
The extent to which intermediate precision should be established depends on
the circumstances under which the procedure is intended to be used. The applicant
should establish the effects of random events on the precision of the analytical
procedure. Typical variations to be studied include days, analysts, equipment, etc.
Chapter-1.3 High performance Liquid Chromatography
Department of Pharmaceutical analysis, K.M college of pharmacy, Madurai. Page 36
Reproducibility
Reproducibility is assessed by means of an inter-laboratory trial.
Reproducibility should be considered in case of the standardization of an analytical
procedure, for instance inclusion of procedures in Pharmacopoeias.
C) Accuracy
The accuracy of an analytical procedure expresses the closeness of agreement
between the value which is accepted either as a conventional true value or on an
accepted reference value and the value found.
Assay
- Assay of Active Substance
- Assay of Medicinal products
Several methods are available to determine the accuracy.
a) Application of an analytical procedure to an analyte of known purity (e.g.
reference material).
b) Comparison of the results of the proposed analytical procedure with those of a
second well-characterized procedure, the accuracy of which is stated and/or
defined (independent procedure)
c) Application of the analytical procedure to synthetic mixtures of the product
components to which known quantities of the substance to be analyzed have
been added.
Impurity (Quantification) Accuracy should be assessed on sample (substance /products) spiked with known amounts of impurities. It should be clear how the individual or total impurities are to be determined.
E.g. Weight / Weight or area percent.
D) Linearity and range Linearity of an analytical procedure is its ability (with in a given range) to
obtain test results which are directly proportional to the concentration (amount) of analyte in the sample.

Chapter-1.3 High performance Liquid Chromatography
Department of Pharmaceutical analysis, K.M college of pharmacy, Madurai. Page 37
Linearity should be evaluated by visual inspection of a plot of signals as a function of analyte concentration or content. If there is a linear relationship, test results should be evaluated by appropriate statistical methods. For example, calculation of a regression line by the method of least square. Therefore data from regression line itself may be helpful to provide mathematical estimates of the degree of linearity. Range of an analytical procedure is the interval between the upper and lower concentration (amounts) of analyte in the sample including these concentrations for which it has been demonstrated that the analytical procedure has a suitable level of precision, accuracy and linearity. The following minimum specified ranges should be considered
• For the assay of an active substance or a finished product normally from 80-120 percent of the test concentration.
• For the content uniformity, covering a minimum of 70-130 percent of the test concentration.
• For dissolution testing, 20% over the specified range (e.g.), If the specifications for a controlled release product cover a region from 20% after 1 hour, upto 90% after 24 hours, the validated range would be 0-110% of label claim.
• For the determination of an impurity, the reporting level of an impurity to 120% of the specifications.
E) Limit of Detection The detection limit is determined by the analysis of samples with known
concentration of analyte and by establishing that minimum level at which the analyte can reliably detected.
i. Based on visual evaluation Visual evaluation may be used for non-instrumental methods but may be used with instrumental methods.

Chapter-1.3 High performance Liquid Chromatography
Department of Pharmaceutical analysis, K.M college of pharmacy, Madurai. Page 38
ii. Based on signal to noise ratio Determination of the signal-to-noise ratio is performed by comparing
measured signals from samples with known low concentrations of analyte with those of blank samples and establishing the minimum concentration at which the analyte can be reliably detected. A signal-to-noise ratio 3 or 2:1is generally considered acceptable for estimating the detection limit.
iii. Based on the standard deviation of the response and the slope The detection limit (DL) may be expressed as
D L = 3.3σ/S Where,
σ = the standard deviation of the response S = the slope of the calibration curve The slope, S may be estimated from the calibration curve of the analyte. The
estimate of σ may be carried out in a variety of ways. a. Based on the Standard Deviation of the Blank Measurement of the magnitude of analytical background response is performed by analyzing an appropriate number of blank samples and calculating the standard deviation of these responses. b. Based on the calibration curve A specific calibration curve should be studied using samples containing an analyte in the range of DL. The residual standard deviation of a regression line or the standard deviation of y-intercept of regression lines may be used as the standard deviation F) Limit of Quantification
The quantification limit is generally determined by the analysis of samples with known concentrations of analyte and by establishing the minimum level at which the analyte can be quantified with acceptable accuracy and precision i. Based on visual evaluation Visual evaluation may be used for non-instrumental methods but may also be used with instrumental methods.

Chapter-1.3 High performance Liquid Chromatography
Department of Pharmaceutical analysis, K.M college of pharmacy, Madurai. Page 39
ii. Based on Signal- to-Noise ratio Determination of the Signal-to-Noise ratio is performed by comparing
measured signals from samples with known low concentrations of analyte with those of blank samples and by establishing the minimum concentration at which the analyte can be reliably quantified. A typical Signal- to-Noise ratio is 10:1.
iii. Based on the Standard Deviation of the Response and the slope The quantification limit (Q L) may be expressed as
S10σQL =
Where,
σ = the standard deviation of the response S = the slope of the calibration curve The slope S may be estimated from the calibration curve of the analyte. The estimation may be carried out in a variety of ways including, a. Based on standard deviation of the blank Measurement of the magnitude of analytical background response is performed by an appropriate number of blank samples and calculating the standard deviation of these responses. b. Based on the Calibration Curve
A specific calibration curve should be studied using samples containing an analyte in the range of QL. The residual standard deviation of a regression line or the standard deviation of y-intercepts of regression lines may be used as the standard deviation G) Robustness
The evaluation of robustness should be considered during the development
phase and depends on the type of procedure under study. It should show the
reliability of an analysis with respect to deliberate variations in method parameters.
Examples of typical variations are
Stability of analytical solutions.
Extraction time.
In case of liquid chromatography, examples of typical are

Chapter-1.3 High performance Liquid Chromatography
Department of Pharmaceutical analysis, K.M college of pharmacy, Madurai. Page 40
• Influence of variation of pH in a mobile phase,
• Influence of variations in mobile phase composition,
• Different columns (different lots and / or suppliers),
• Temperature,
• Flow rate.
In the case of gas-chromatography, examples of typical variations are
• Different columns (different lots and/or suppliers),
• Temperature,
• Flow rate.
F) Ruggedness
The United States pharmacopoeia (USP) define ruggedness as the degree of
reproducibility of test results obtained by the analysis of the same samples under a
variety of normal test conditions such as different labs, different analysis, different
lots of reagents etc. Ruggedness is a measure of reproducibility of test results under
normal expected operational conditions from laboratory to laboratory and from
analyst to analyst.
Chapter-1.3 High performance Liquid Chromatography
Department of Pharmaceutical analysis, K.M college of pharmacy, Madurai. Page 41

Chapter-2 Plant and drug profile
Department of Pharmaceutical analysis, K.M college of pharmacy, Madurai. Page 41
2.1 PLANT PROFILE Curcuma longa (Turmeric) is dried rhizomes of Curcuma longa Linn, family
Zingiberaceae. It is native to tropical South Asia and also cultivated all states in India,
needs temperatures between 20 °C and 30 °C and a considerable amount of annual
rainfall to thrive.
Synonyms:
Turmeric, Indian saffron, Curcuma, Haridra.
Other names:
San : Haridra, Nisa
Bengal, Hindi : Haldi
Gujarat : Halad
Kannada& Tamil : manjal
Telugu : Pasupu
Scientific classification:
Kingdom: Plantae
Order: Zingibaracea
Family: Zingibarecea
Genes: Curcumalong
Species: C.Long.
Curcuma Longa plant
Chapter-2 Plant and drug profile
Department of Pharmaceutical analysis, K.M college of pharmacy, Madurai. Page 42
Description:
Colour : yellowish – Brown colour,
Odour : Characteristic odour,
Taste : Bitter Taste,
Shape : Round, Cylindrical.
Chemical constituents:
Curcumalonga contain 5% of Diaryl heptanoid colouring material know as
Curcuminoids. They are Curcumin, Demethoxy Curcumin, Bis- Demethoxy
Curcumin. All pharmacological actions Curcumalonga due to Curcumin only.
- Curcuminoids 0.8 to 2%
- Starch 30 to 40 %
- Volatile oil 3 to 12%

C
D
D
w
D
re
ta
so
D
(1
Chapter-2
Department of P
DRUG NAM
Curcu
which is a me
Demethoxy a
esponsible f
automeric fo
olution(15).
DRUG STRU
1E, 6E)-1, 7
Pharmaceutical
ME: CURCU
umin is the
ember of Gin
and Bis-dem
for the yel
orms. The en
UCTURE:
7-bis (4-hydr
CHEMICA
MOLECU
APPEARA
MELTING
SOLUBIL
l analysis, K.M
2.2 DRUGUMIN
principal c
nger family
methxy Curcu
llow colour
nol form is m
roxy-3-meth
AL FORMU
ULAR MASS
ANCE
G POINT
ITY
college of phar
G PROFI
curcuminoid
(Zingiberac
umin. The c
of turmer
more energet
hoxyphenyl
LA : C2
: 36
: Bri
: 18
: Ins
Ace
rmacy, Madurai
LE
of popular
eae). The ot
curcuminoids
ic. Curcum
tically stable
) -1, 6-hepta
21H20O6
68.38 g/mol
ight yellow-
3 °C (361 °F
soluble in W
etonitrile, me
Plant and d
i.
r Indian spi
ther two curc
s are natura
min can exis
e in the solid
adiene-3, 5-
-orange pow
F) (456.15 K
Water and solu
ethanol.
drug profile
Page 4
ice Turmeri
cuminoids ar
l phenols an
st in sever
d phase and i
-Dione.
der K)
uble in THF
43
ic,
re
nd
ral
in
F,

Chapter-2 Plant and drug profile
Department of Pharmaceutical analysis, K.M college of pharmacy, Madurai. Page 44
PHARMACO KINETICS:
Pharmacokinetic studies in animal have demonstrated that 40-85 percent of an oral dose of Curcumin passes through the gastrointestinal track uncharged, with most of the absorbed flavonoid being metabolized in the intestinal mucosa and liver. Due to its low rate of absorption, Curcumin is often formulated with bromelain for increased absorption and enhanced anti-inflammatory effect. MECHANISAM OF ACTION:
Anti oxidant effect Water- and fat-soluble extracts of turmeric and its curcumin component exhibit strong antioxidant activity, comparable to vitamins C and E. A study of ischemia in the feline heart demonstrated that curcumin pretreatment decreased ischemia-induced changes in the heart. An in vitro study measuring the effect of curcumin on endothelial heme oxygenase-1, an inducible stress protein, was conducted utilizing bovine aortic endothelial cells. Incubation (18 hours) with curcumin resulted in enhanced cellular resistance to oxidative damage.
Hepato protective effect Turmeric has been found to have a hepatoprotective characteristic similar to silymanrin. Animal studies have demonstrated turmeric’s hepatoprotective effects from a variety of hepatotoxic insults, including carbon tetrachloride (CCl4), galctosamine acetaminophen and Aspergillus aflotoxin. Turmeric’s hepatoprotective effect is mainly a result of its antioxidant properties, as well as its ability to decrease the formation of proinflamatory cytokines. Turmeric and Curcumin also reserved billiary hyperplasia, fatty changes and necrosis induced by aflatoxin production. Ant carcinogenic Effects
Animal studies involving rats and mice, as well as in vitro studies utilizing human cell lines, have demonstrated curcumin’s ability to inhibit carcinogenesis at three stages: tumor promotion, angiogenesis and tumor growth. In two studies of colon and prostate cancer, curcumin inhibited cell proliferation and tumor growth.
Turmeric and curcumin are also capable of suppressing the activity of several common mutagens and carcinogens in a variety of cell types in both in vitro and in vivo studies.
The anticarcinogenic effects of turmeric and curcumin are due to direct antioxidant

Chapter-2 Plant and drug profile
Department of Pharmaceutical analysis, K.M college of pharmacy, Madurai. Page 45
and free-radical scavenging effects as well as their ability to indirectly increase glutathione levels, thereby aiding in hepatic detoxification.
Gastrointestinal Effects
Constituents of Curcuma longa exert several protective effects on the gastrointestinal tract. Sodium curcuminate inhibited intestinal spasm and p-tolymethylcarbinol, a turmeric component, increased gastrin, secretin, bicarbonate and pancreatic enzyme secretion. Turmeric has also been shown to inhibit ulcer formation caused by stress, alcohol, indomethacin, pyloric ligation and reserpine, significantly increasing gastric wall mucus in rats subjected to these gastrointestinal insults.
Anti microbial effect Turmeric extract and the essential oil of Curcuma longa inhibit the growth of a variety of bacteria, parasites and pathogenic fungi. A study of chicks infected with the caecal parasite Eimera maxima demonstrated that diets supplemented with 1-percent turmeric resulted in a reduction in small intestinal lesion scores and improved weight gain. Another animal study, in which guinea pigs were infected with dermatophytes, pathogenic molds or yeast, found that topically applied turmeric oil did not inhibit dermatophytes and pathogenic fungi, but neither curcumin nor turmeric oil affected the yeast isolates. Improvements in lesions were observed in the dermatophyte and fungi-infected guinea pigs and at seven days post-turmeric application the lesions disappeared. Curcumin has also been found to have moderate activity against Plasmodium falciparum and Leishmania major organisms.
Cardiovascular Effects Turmeric’s protective effects on the cardiovascular system include lowering
cholesterol and triglyceride levels, decreasing susceptibility of low density lipoprotein (LDL) to lipid peroxidation and inhibiting platelet aggregation. These effects have been noted even with low doses of turmeric. A study of 18 atherosclerotic rabbits given low-dose (1.6-3.2 mg/kg body weight daily) turmeric extract demonstrated decreased susceptibility of LDL to lipid peroxidation, in addition to lower plasma cholesterol and triglyceride levels. The higher dose did not decrease lipid peroxidation of LDL, but cholesterol and triglyceride level decreases were noted, although to a lesser degree than with the lower dose. Turmeric extract’s effect on cholesterol levels may be due to decreased cholesterol uptake in the intestines and increased conversion

Chapter-2 Plant and drug profile
Department of Pharmaceutical analysis, K.M college of pharmacy, Madurai. Page 46
of cholesterol to bile acids in the liver. Inhibition of platelet aggregation by C. longa constituents is thought to be via potentiation of prostacyclin synthesis and inhibition of thromboxane synthesis.
Dosage
Doses of 500-8,000 mg of powdered turmeric per day have been used in human
studies. Standardized extracts are typically used in lower amounts, in the 250-2,000
mg range.
Side Effects and Toxicity
No significant toxicity has been reported following either acute or chronic
administration of turmeric extracts at standard doses. At very high doses (100 mg/kg
body weight), curcumin may be ulcerogenic in animals, as evidenced by one rat study.
Contra indications
Those taking blood thinner (Coumadin, etc) should avoid Curcumin, as it may
add to their anti- clotting effects. Extended use is not recommended, as it may result
in stomach distress. Normal therapeutic doses of Curcumin protect from ulcers, but at
very high doses, it may induce ulcer. Curcumin is not recommended for persons with
biliary track obstruction, as the Curcumin stimulates bile secretion.
This is why it is very important to take only the recommended dose of this
herbal remedy. Since Curcumin is considered a uterine stimulant, pregnant women
should not use it. Curcumin is said to work best when taken on an empty stomach.
Medicinal uses
Anti microbial, Anti inflammatory, Hepato protective, Anti carcinogenic, Anti
bacterial, Anti oxidant, Anti mutagenic, lower blood cholesterol level.
Chapter-3 Literature Review
Department of Pharmaceutical analysis, K.M college of pharmacy, Madurai. Page 47
3. LITERATURE REVIEW
1. AK Dwivedi, et al (16), developed a combined thin-layer chromatography-densitometry for the quantitation of curcumin in pharmaceutical dosage forms and in serum, A new TLC Densitometric method for the quantitative estimation of a nonsteroidal anti-inflammatory agent curcumin in bulk drug samples, pharmaceutical dosage forms and in human serum had been worked out. The assay combined TLC on Silicagel 60 F254 with spot visualisation by single wavelength reflection mode, excitation 265 nm and emission UV D2 filter and densitometry. 2. Jayaprakasha GK et al (17), reported a HPLC Method for the determination of
Curcumin, Demethoxycurcumin, and Bis-demethoxycurcumin. HPLC separation was performed on a C18 column using three solvents, methanol, 2% AcOH, and Acetonitrile (30:50:20) with detection at 425 nm. Four different commercially available varieties of turmeric samples (Salem, Erode, Balasore, and local market samples) were analyzed to detect the percentage of these three curcuminoids. The percentages of Curcumin, Demethoxycurcumin and Bis-demethoxycurcumin as estimated using their calibration curves were found to be 1.06 +/- 0.061 to 5.65 +/- 0.040, 0.83 +/- 0.047 to 3.36 +/- 0.040, and 0.42 +/- 0.036 to 2.16 +/- 0.06, respectively, in four different samples. The total percentages of curcuminoids were 2.34 +/- 0.171 to 9.18 +/- 0.232%. 3. Jayant K. Verma et al (18), reported a Rapid HPTLC method for identification and quantification of curcumin, piperine and thymol in an ayurvedic formulation, Chromatography was performed on silica gel 60 F 254 plates with toluene-ethyl acetate-methanol, 9 + 1 + 0.5( v/v), as mobile phase. Plates were developed to a distance of 8 cm at room temperature without chamber saturation. The plates were scanned and the compounds were quantified at their wavelengths of maximum absorption, 420, 333 and 277 nm for Curcumin, piperine and thymol respectively. The respective Rf values of Curcumin, piperine and thymol were 0.23, 0.30 and 0.64. Response was a linear function of the amount applied to the plate in the ranges 50–250 ng, 10–60 ng and 100–700 ng for curcumin, piperine and thymol respectively. LOD for Curcumin, piperine and thymol were 25, 5 and 50 ng respectively. The mean results from assay of Curcumin, piperine and thymol in the ayurvedic formulation were found to be 0.85, 12.93 and 3.29 mg g −1 respectively. The respective covariance for Curcumin, piperine and thymol was 0.78, 0.51 and 0.69% respectively. Recovery was 100.41, 99.52 and 101.21% for Curcumin, piperine and thymol respectively.

Chapter-3 Literature Review
Department of Pharmaceutical analysis, K.M college of pharmacy, Madurai. Page 48
Rapid identification of curcumin, piperine and thymol was also possible by spraying the plate with anisaldehyde in sulfuric acid reagent. 4. Zengshuan Ma, et al (19), reported High-performance liquid chromatography
analysis of Curcumin in rat plasma application to pharmacokinetics of polymeric
micellar formulation of Curcumin. Separation was achieved on a Waters µ
Bondapak™ C18 column (3.9 × 300 mm, 5 µm) using Acetonitrile (55%) and citric
buffer, pH 3.0 (45%) as the mobile phase (flow rate = 1.0 mL/min). The UV detection
wavelength was 300 and 428 nm for IS and Curcumin, respectively. The extraction
efficiencies were 97.08, 95.69 and 94.90% for 50, 200 and 1000 ng/mL of Curcumin
in rat plasma, respectively. The calibration curve was linear over the range 0.02–1
µg/mL with a correlation coefficient of r2 > 0.999. The intra and inter-day
coefficients of variation were less than 13% and mean intra- and inter-day errors were
less than ±6% at 50, 200 and 1000 ng/mL of Curcumin.
5. M paramasivam , et al (20), standardized the occurrence of curcuminoids in
Curcumalonga by using HPTLC. A simple performance thin layer chromatographic
(HPTLC) method had been developed for the simultaneous determination of the
pharmacologically import active curcuminoids such as Curcumin DMC and BDMC in
Curcumalonga L. The assay combined the separation and quantification of the
analytes on silica gel 60 GF245 HPTLC plates with visualization under UV and
scanned at 425 nm.
6. Tanaka K et al (21), developed a near infrared spectroscopic analysis for
Quantization of curcuminoids in curcuma rhizome. This study was investigated a
nondestructive and rapid quantization of the curcuminoids, including Curcumin,
Demethoxycurcumin, and Bis-demethoxycurcumin, present in turmeric using near-
infrared (NIR) spectroscopy and multivariate statistics. In the second derivatives of
the NIR spectra of turmeric samples, two characteristic absorptions of curcuminoids
were detected around 1700 and 2300-2320 nm. Partial least-squares regression (PLS-
R) analysis was applied to the NIR spectra obtained from 34 turmeric samples and
PLS models for the quantization of Curcumin, Demethoxycurcumin, Bis-
demethoxycurcumin and total curcuminoid contents in the pulverized turmeric
samples were constructed. Combination usage of the Standard Normal Variate (SNV)
and second derivatives were obviously superior to other preprocessing methods. The

Chapter-3 Literature Review
Department of Pharmaceutical analysis, K.M college of pharmacy, Madurai. Page 49
lowest root mean squared error of cross-validation (RMSECV) values were detected
at 6, 6, 6, and 6 PLS factors, for the quantitative subjects Curcumin,
Demethoxycurcumin, Bis-demethoxycurcumin and total curcuminoid contents.
7. Zhang J, et al (22), developed a simple HPLC-fluorescence method for quantitation
of curcuminoids and its application to turmeric products. This method involved a
simple ultrasonic extraction with methanol as a pretreatment of turmeric products.
The separation of curcuminoids and 2,5-xylenol (internal standard) was achieved
within 30 min on a Cadenza CD-C18 column (250 x 4.6 mm; i.d., 3 micron) with a
mixture of acetate buffer and CH3 CN. The calibration curves of standard
curcuminoids showed good linearities of more than 0.993 of the correlation
coefficient. The instrumental detection limits for C, DMC and BDMC (signal-to-noise
ratio = 3) were 1.5, 0.9 and 0.09 ng mL(1), respectively. The relative standard
deviations of intra and inter-day assays by curcuminoids spiked to turmeric powder
were less than 6.1%. The proposed method was successfully applied to determine
curcuminoids in commercial turmeric products, such as turmeric powders, a tablet, a
dressing, a beverage, tea and crude drugs.
8. M. Paramasivam, et al (23), developed and reported a High-performance thin layer
chromatographic method for quantitative determination of curcuminoids in Curcuma
longa germplasm. Phytochemical investigation of the rhizomes of Curcuma
longa leaded to the isolation of pharmacologically active curcuminoids viz Curcumin,
Demethoxycurcumin and Bis-demethoxycurcumin. These were isolated from turmeric
rhizomes by soxhlet extraction followed by column chromatography, crystallization
and identified by spectroscopic studies. The purity of the curcuminoids was analysed
by HPTLC method. The method employed TLC aluminium plates precoated with
silica gel 60GF254 as the stationary phase. The solvent system consisted of
chloroform: methanol (48:2, v/v). This system was found to give compact spots for
Curcumin, Demethoxycurcumin and Bis-demethoxycurcumin (RF value of 0.66 ±
0.02, 0.48 ± 0.02 and 0.30 ± 0.02), respectively. Densitometric analysis of
curcuminoids was carried out in the absorption–reflection detection mode at 425 nm.
Seven different germplasm of turmeric were analysed to detect the percentage of these
three curcuminoids.

Chapter-3 Literature Review
Department of Pharmaceutical analysis, K.M college of pharmacy, Madurai. Page 50
9. Wichitnithad W, et al (24), described a simple isocratic HPLC method for the
simultaneous determination of curcuminoids in commercial turmeric extracts. The
sample was prepared by dissolving the extract in acetonitrile and subsequently
diluting with 50% acetonitrile. This solution was analyzed by reverse-phase
chromatography on an Alltima C18 column with isocratic elution of Acetonitrile and
2% v/v acetic acid (40:60, v/v) at a flow rate of 2.0 mL/min, a column temperature of
330C and UV detection at 425 nm. The method was validated and applied for
quantification of individual curcuminoids in commercial turmeric extracts. The
method allowed simultaneous determination of Curcumin, Demethoxycurcumin and
Bis-demethoxycurcumin in the concentration ranges of 10-60, 4-24 and 0.5-3.0
µg/mL, respectively. The limits of detection and quantification were 0.90 and 2.73
µg/mL, for Curcumin, 0.84 and 2.53 µg/mL, for Demethoxycurcumin and 0.08 and
0.23 µg/mL, for Bis-demethoxycurcumin and the percentage recoveries were 99.16-
101.75 (%RSD < or = 1.11%), 99.50-101.01 (%RSD < or = 1.74%) and 99.67-101.92
(RSD < or = 1.31%).
10. B. k. Jadhav, et al (25), developed and validated a Isocratic Reversed Phase-
HPLC Method for simultaneous determination of Curcumin, Demethoxycurcumin
and Bis Demethoxycurcumin using RP C18 column. Mobile phase consisted of
Acetonitrile: 0.1% trifluro-acetic acid (50:50) and flow rate was 1.5 ml/min and
elution was monitored at 420 nm. Validation in selected condition showed that the
chosen method was sensitive, selective, precise and reproducible with linear response
of detector for the simultaneous determination of Curcumin (C), Demethoxycurcumin
(DMC) and Bis-demethoxycurcumin (BDMC). The limits of detection were 27.99,
31.91, 21.81 ng/ml for C, DMC and BDMC, respectively. Linear range was from 100
to 600 ng/ml, the mean ± SD percent recoveries of curcuminoids were 99.87± 0.34,
100.09± 0.48 and 100.10 ± 0.60% of C, DMC and BDMC, respectively. Further the
method was used for quantification of curcuminoids from turmeric rhizome.
11. Li J, Jiang Y, et al (26), developed a rapid and simple HPLC method for the
determination of Curcumin in rat plasma: assay development, validation and
application to a pharmacokinetic study of curcumin liposome, Curcumin and the IS
emodin were separated on a Diamonsil C18 analytical column (4.6 x 100 mm, 5
microm) using Acetonitrile :5% acetic acid (75:25, v/v) as mobile phase at a flow rate

Chapter-3 Literature Review
Department of Pharmaceutical analysis, K.M college of pharmacy, Madurai. Page 51
of 1.0 mL/min. The method was sensitive with a lower limit of quantitation of 1
ng/mL, with good linearity (r (2) >or= 0.999) over the linear range 1-500 ng/mL. The
assay method was successfully applied to the study of the pharmacokinetics of
Curcumin liposome in rats.
12. Yadav Vivek Ramshankar, et al (27), developed and reported a sensitive
Reversed Phase HPLC Method for the determination of Curcumin. Chromatographic
separation was achieved by using Merck C15 (250 cm X 4.6 mm) Column with mobile
phase acetonitril: tetrahydrofuran: 2% acetic acid (50:30:20). The flow rate was 0.7
ml/min. The retention time was 4.587 minutes. The limit of detection and limit of
quantification of Curcumin were between 3.68 to 8.125ng/ml for 50μL injection
volumes. The percentage recovery of Curcumin was found to be 97.2 to 98.4 and
relative standard deviation was 0.345 % and 1.160 %. The developed HPLC method
could be therefore be applied to both in vitro studies of Curcumin formulations as
well as drug estimation in biological samples.
13. Rubesh Kumar S et al (28), reported a simultaneous spectrophotometric
estimation of Curcuminoids and Gallic Acid in bulk drug and Ayurvedic Polyherbal
tablet dosage Form, In the present study, an attempt had been made to develop a
Spectrophotometric method for the simultaneous estimation of curcuminoids and
gallic acid in commercially marketed ayurvedic polyherbal formulation Nisha
Amalaki vatti. Simultaneous equations ( Vierodt’s method) were performed by
UV/Visible Spectrophotometric method. Curcuminoids had absorbance maxima at
about 427 nm and Gallic acid maxima at about 227nm in methanol. The linearity
was obtained in the concentration range of 10-50 mcg/mL for both curcuminoids
and Gallic acid. The results of the analysis were validated statistically and by the
recovery studies as per ICH guidelines.
14. Archana A Bele, et al (29), developmed and validated a HPTLC method for
estimation of Curcumin, Ellagic acid in Gel Formulation. Gel formulation was
chromatographed on silica gel 60 F254 TLC plate using toluene: ethyl acetate:
methanol: formic acid (2.5: 2.5: 0.2: 0.8) as mobile phase. The method was found to
give compact spots for the drug (Rf=0.5 ellagic acid, Rf for Curcumin 0.6).

Chapter-3 Literature Review
Department of Pharmaceutical analysis, K.M college of pharmacy, Madurai. Page 52
15. Niraj Vyas, et al (30), reported a HPTLC method for simultaneous estimation of
Curcumin and piperine in their crude powder mixture and Ayurvedic formulation. The
separation was performed on TLC aluminum plates precoated with silica gel G60
F254. Good separation was achieved in the mobile phase of Chloroform: Methanol
(9.6:0.4 v/v) at Rf = 0.57 and 0.82 for curcumin and piperine respectively.
Densitometric scanning of both compounds was carried out at 373 nm. The
calibration curves showed a good linear relationship with r = 0.9998 and 0.9986 for
curcumin and piperine respectively.
16. Arun gantait, et al (31), developed and validated HPTLC method for estimation
of Curcumin in turmeric powder. The HPTLC separation was performed on precoated
aluminum backed HPTLC plates of 0.2 mm layer thickness up to 80 mm at
temperature of 20 ± 40C with 10 min. of chamber saturation. Under this condition the
retention factor (Rf) of Curcumin was 0.43 and the compound was quantified at its
absorbance maxima 427 nm. The limit of quantification was found to be 49 ng and
148 ng per spot, respectively. The response of Curcumin was linear over the range of
0.8 μg to 1.3 μg per spot with correlation coefficient 0.99395 indicated good
relationship b/w peak area versus concentration. Recovery values from 99.60 to
99.73% showed that the reliability and reproducibility of the method were excellent.
,

Chapter-4 Aim and plan of work
Department of Pharmaceutical analysis, K.M college of pharmacy, Madurai. Page 53
4. AIM AND PLAN OF WORK The drug analysis plays an important role in the development, manufacture
and therapeutic use of drug. Most of the pharmaceutical industries do the quantitative
chemical analysis to ensure that the raw material used and the final product thus
obtained meet certain specifications and to determine how much of each components
are present in the final product.
From the literature survey, it was found that there are some analytical methods
reported for Curcumin either individually (or) in combination with other drugs by
HPLC, HPTLC in raw drug, herbal extract and turmeric powder. Still now, no RP-
HPLC method is available for the estimation of Curcumin in pharmaceutical Dosage
form. So an attempt is made to develop RP-HPLC method for the estimation of
Curcumin in Poly Herbal formulation.
The plan of present Work is as fallows
Method Development
Selection of wavelength
Selection of initial separation conditions
Selection of mobile phase (pH, peak modifier, solvent strength,
ratio and flow rate)
Nature of the stationary phase
Selection of separation method and agent
Validation of the developed method
The developed method should be validated as per ICH Guidelines by using the
various validation parameters such as,
Accuracy
Precision
Linearity and of detection (LOD) / Limit of quantitation (LOQ)
Selectivity / Specify
Robustness / ruggedness
System suitability.
.

Chapter-5.1 Materials and instruments used
Department of Pharmaceutical analysis, K.M college of pharmacy, Madurai. Page 54
5.1 MATERIALS AND INSTRUMENTS USED Materials:
a) Curcumin standard :
Curcumin standard was brought from the VEEDISH
CHEMICALS, pune.
b) Drug sample :
Diazen Tablets was formulated by APEX LABORATORIES,
Herbal division, Alathure,kanchipuram(Dt),Tamilanadu.
c) chemicals and solvents used :
S. No Name Grade
1. Tetrahydrofuron Merck (HPLC Grade)
2. Water Millipore
3. Citric acid AR grade
4. Methanol HPLC grade
5. Acetonitrile HPLC grade

Chapter-5.1 Materials and instruments used
Department of Pharmaceutical analysis, K.M college of pharmacy, Madurai. Page 55
d) Instruments used :
S. No EQUIPMENT MANUFACTURE MODEL
1
2
3
4
5
6
7
8
9
10
11
12
Electronic balance-1
Electronic balance-2
HPLC
pump
Uv visible detector
Column C18
[150 mm X 4.6 mm, 5µ]
Sonicator
pH meter
Membrane filter
Tablet tester
Milli pore water
Hot air oven
HPTLC
HPTLC scanner
Moisture analyzer
Mettle Toledo
Mettle Toledo
Excellence
waters
waters
phenomonex
sonorex
Elico
AXIVA, NewDelhi
Campabell
Milli -Q
Lab serve
CAMAG linomat 4
CAMAG TLC
scanner-3
Metter Toledo
Classic plus
D value -0.1 mg
Xs205
D value -0.01 mg
E 2695
2489
Phen -s
Sonorex dig 10 p
SRP15, 0.45mcm
.025 mcm
DHT-25c
Q-POD
HR84 halogen

Chapter-5.2 Methodology
Department of Pharmaceutical analysis, K.M college of pharmacy, Madurai. Page 56
5.2 METHODOLOGY
ANALYTICAL METHOD DEVELOPMENT AND
OPTIMIZATION OF CHROMATOGRAPHIC CONDITIONS
(1)Selection of stationary phase
Proper selection of the stationary phase depends up on the nature of the
sample and chemical profile. The drug selected for the present study was polar
compound and could be separated either by normal phase chromatography or reverse
phase chromatography.
From literature survey, it was found that octadecyl silane column C18 could be
appropriately used for the separation of Curcumin.
(2)Selection of Wavelength
The sensitivity of the HPLC depends upon the selection of detection
wavelength. An ideal wavelength is one that gives good response for the drugs to be
detected. The wavelength for measurement was selected as 425 nm from the
absorption spectrum.
(3)Selection of Mobile phase Different mixtures of mobile phase with different ratios were selected and their
chromatograms were recorded, many trails were done on Curcumin.
Traial-1
Preparation of mobile phase:
Measured accurately 12 ml of acetic acid and dissolved in 600 ml Millipore
water. The mixed this solution to 400 ml of acetonitrile (ACN). pH was adjusted to
3.5 by using orthophosphoric acid and filtered through 0.45 µ m nylon membrane
filter and degassed.

Chapter-5.2 Methodology
Department of Pharmaceutical analysis, K.M college of pharmacy, Madurai. Page 57
Chromatographic conditions:
Column : symmetry C18, 250 x 4.6mm x 5μ
Mobile phase : Acetonitrile: 2% Acetic acid (400:600)
Flow rate : 0.750 ml/min
Column temp : 33oC
Detection wavelength : 425 nm
Run time : 50 min
pH : 3.5
Injection volume : 20 μl
Chromatogram-1
Observation: peak separation was not good, Rt was shifted to 35th minute
and peak shape was not good.

Chapter-5.2 Methodology
Department of Pharmaceutical analysis, K.M college of pharmacy, Madurai. Page 58
Trail -2
Chromatographic conditions:
Column : symmetry C18, 150 x 4.6mm x 5μ
Mobile phase : Acetonitrile: 2% Acetic acid (400:600)
Flow rate : 1 ml/min
Column temp : 33oC
Detection wavelength : 425 nm
Run time : 25 min
pH : 4.2
Injection volume : 20 µl
Chromagram-2
Observation: peak separation was not good and peak height was very low.

Chapter-5.2 Methodology
Department of Pharmaceutical analysis, K.M college of pharmacy, Madurai. Page 59
Trail -3
Chromatographic conditions:
Column : symmetry C18, 150 x 4.6mm x 5μ
Mobile phase : Acetonitrile: 2% Acetic acid (500:500)
Flow rate : 1 ml/min
Column temp : 44 oC
Detection wavelength : 425 nm
Run time : 25 min
pH : 2.8
Injection volume : 20 μl
Chromagram-3
Observation: peaks were not separated.

Chapter-5.2 Methodology
Department of Pharmaceutical analysis, K.M college of pharmacy, Madurai. Page 60
Trail -4
Chromatographic conditions:
Column : symmetry C18, 150 x 4.6mm x 5μ
Mobile phase : THF: 1% citric Acid: ACN (300:600:100)
Flow rate : 1 ml/min
Column temp : Ambient Temp
Detection wavelength : 425 nm
Run time : 25 min
pH : 2.8
Injection volume : 20 μl
Chromagram-4
Observation: peak fronting was observed.

Chapter-5.2 Methodology
Department of Pharmaceutical analysis, K.M college of pharmacy, Madurai. Page 61
Trail -5
Chromatographic conditions:
Column : symmetry C18, 150 x 4.6mm x 5μ
Mobile phase : THF: 1% Citric acid (600:400)
Flow rate : 1 ml/min
Column temp : Ambient
Detection wavelength : 425 nm
Run time : 25 min
pH : 2.8
Injection volume : 20 μl
Chromagram-5
Observation: peaks were not separated

Chapter-5.2 Methodology
Department of Pharmaceutical analysis, K.M college of pharmacy, Madurai. Page 62
Trail -6
Chromatographic conditions:
Column : symmetry C18, 150 x 4.6mm x 5μ
Mobile phase : THF : 1% Citric acid (500:500)
Flow rate : 1 ml/min
Column temp : Ambient
Detection wavelength : 425 nm
Run time : 25 min
pH : 2.8
Injection volume : 20 μl
Chromagram-6
Observation: 3 peaks were merged in single peak.

Chapter-5.2 Methodology
Department of Pharmaceutical analysis, K.M college of pharmacy, Madurai. Page 63
Optimized method:
Based on the above studies, the method development was carried out. Various
proportions of Mobile phases were used in trails with the concentrations of solvents
and various pH ranges (2-5) were tried with different flow rate (0.75 ml, 1.5 ml, 1 ml)
and temperature (33 0C, 44 0C, 40 0C and ambient temp). Among these trails,
following condition presented below had given the expected results
Chromatographic conditions:
Column : symmetry C18, 150 x 4.6mm x 5μ
Mobile phase : THF: 1% Citric acid (450:550)
Flow rate : 1 ml/min
Column temp : Ambient
Detection wavelength : 425 nm
Run time : 25 min
pH : 2.8
Injection volume : 20 μl
Elution technique : Isocratic technique
Chromagram-7
Observation: peaks were well separated and RSD was passed.
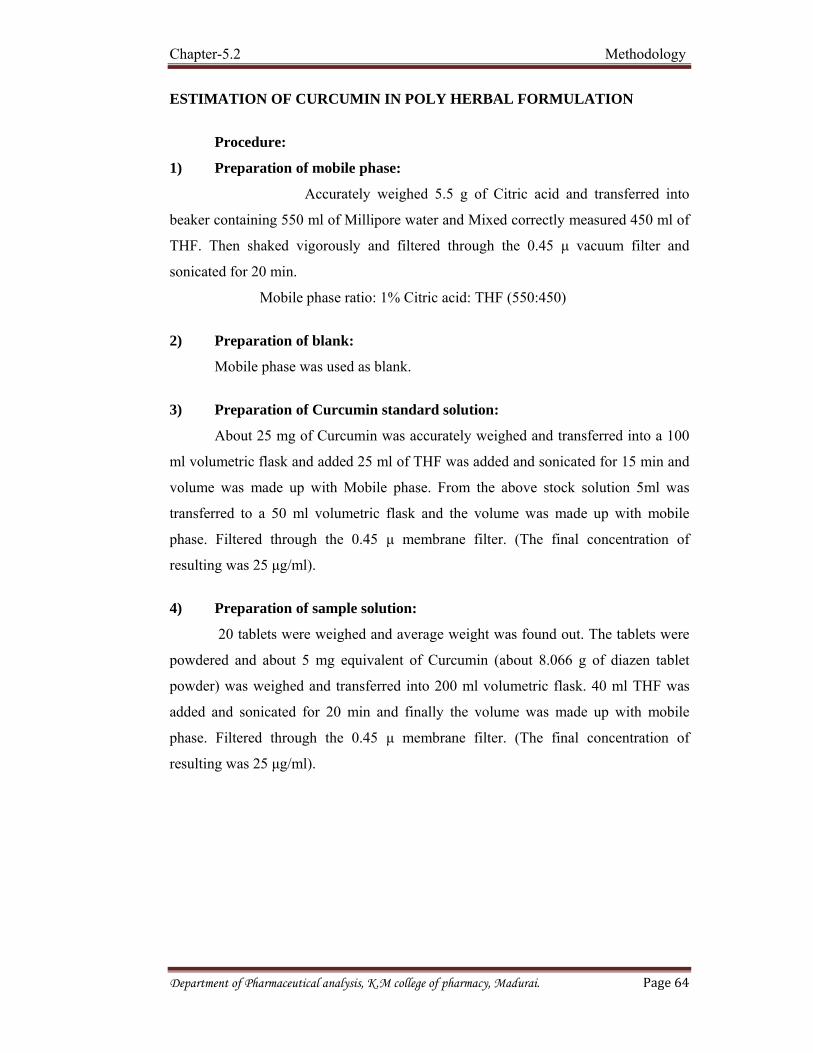
Chapter-5.2 Methodology
Department of Pharmaceutical analysis, K.M college of pharmacy, Madurai. Page 64
ESTIMATION OF CURCUMIN IN POLY HERBAL FORMULATION
Procedure:
1) Preparation of mobile phase:
Accurately weighed 5.5 g of Citric acid and transferred into
beaker containing 550 ml of Millipore water and Mixed correctly measured 450 ml of
THF. Then shaked vigorously and filtered through the 0.45 μ vacuum filter and
sonicated for 20 min.
Mobile phase ratio: 1% Citric acid: THF (550:450)
2) Preparation of blank:
Mobile phase was used as blank.
3) Preparation of Curcumin standard solution:
About 25 mg of Curcumin was accurately weighed and transferred into a 100
ml volumetric flask and added 25 ml of THF was added and sonicated for 15 min and
volume was made up with Mobile phase. From the above stock solution 5ml was
transferred to a 50 ml volumetric flask and the volume was made up with mobile
phase. Filtered through the 0.45 μ membrane filter. (The final concentration of
resulting was 25 μg/ml).
4) Preparation of sample solution:
20 tablets were weighed and average weight was found out. The tablets were
powdered and about 5 mg equivalent of Curcumin (about 8.066 g of diazen tablet
powder) was weighed and transferred into 200 ml volumetric flask. 40 ml THF was
added and sonicated for 20 min and finally the volume was made up with mobile
phase. Filtered through the 0.45 μ membrane filter. (The final concentration of
resulting was 25 μg/ml).

Chapter-5.2 Methodology
Department of Pharmaceutical analysis, K.M college of pharmacy, Madurai. Page 65
5) Chromatographic conditions:
Column : symmetry C18, 150 x 4.6mm x 5μ
Mobile phase : THF: 1% Citric acid (450:550)
Flow rate : 1 ml/min
Column temp : Ambient temperature
Detection wavelength : 425 nm
Run time : 25 min
pH : 2.8
Injection volume : 20 μl
Elution technique : Isocratic technique
Procedure:
System was stabilized for 60 minutes with mobile phase and injected 20 μl of
BLANK, STANDARD AND ASSAY preparations into the Chromatograph and
measured the response of major peak.
System suitability:
1. The tailing factor of Curcumin peak is not more than 2.0
2. The relative standard deviation for replicate injection is not more than 2.0%
3. The column efficiency as number of theoretical plates for Curcumin standard
preparation should not be less than 2000.
Chromagram-7, Blank preparation

Chapter-5.2 Methodology
Department of Pharmaceutical analysis, K.M college of pharmacy, Madurai. Page 66
Chromagram-7, Curcumin standard preparation

Chapter-5.2 Methodology
Department of Pharmaceutical analysis, K.M college of pharmacy, Madurai. Page 67
Chromagram-8,
Assay preparation

Chapter-5.2 Methodology
Department of Pharmaceutical analysis, K.M college of pharmacy, Madurai. Page 68
Calculation: The percentage of the labeled amount of Curcumin in the portion of
tablet was calculated by the formula.
Formulation: Diazen tablet
Label claim: 0.294 mg of Curcumin and also contain 10% overage.
AT WS 5 200 P
‐‐‐‐‐‐ x ‐‐‐‐‐‐‐‐ X ‐‐‐‐‐‐‐‐ x ‐‐‐‐‐‐‐‐‐‐ x ‐‐‐‐‐‐‐‐‐ x AW
AS 100 50 WT 100
= ‐‐‐‐‐‐‐‐‐‐‐‐‐‐‐‐‐‐ mg of Curcumin per tablet
Where,
AS : Average peak area for standard preparation
AT : Average peak area for sample preparation
WS : Weight of Curcumin taken in mg for standard preparation
WT : Weight of tablets taken in mg
AW : Average weight of tablets
P : Purity of Curcumin working standard

Chapter-5.2 Methodology
Department of Pharmaceutical analysis, K.M college of pharmacy, Madurai. Page 69

Chapter- 5.3 Analytical method validation
Department of Pharmaceutical analysis, K.M college of pharmacy, Madurai Page 70
5.3 ANALYTICAL METHOD VALIDATION
After the development of RP-HPLC method for estimation of CURCUMIN in
poly herbal formulation that method was validated by using following parameters
1) Parameters:
1.1 Specificity
1.2 Precision
a.Repeatability / method precision
b.Intermediate precision / ruggedness
1.3 Linearity & range
1.4 Accuracy / Recovery studies
1.5 System suitability
1.6 Robustness
2) Validation procedure:
2.1 Preparation of mobile phase:
Accurately weighed 5.5 g of Citric acid and transferred into beaker containing
550 ml of Millipore water and Mixed correctly measured 450 ml of THF. Then
shaked vigorously and filtered through the 0.45 μ vacuum filter and sonicated for 20
min.
Mobile phase ratio: 1% Citric acid: THF (550:450)
2.2 Preparation of blank:
Mobile phase was used as blank.
2.3 Preparation of Curcumin standard solution:
About 25 mg of Curcumin was accurately weighed and transferred into a 100
ml volumetric flask and added 25 ml of THF and sonicated for 15 min then up the
volume was made up with mobile phase. From the above stock solution 5 ml was
transferred to a 50 ml volumetric flask and the volume was made up with mobile
phase. Filtered through the 0.45 μ membrane filter. (The final concentration of
resulting was 25 μg/ml).

Chapter- 5.3 Analytical method validation
Department of Pharmaceutical analysis, K.M college of pharmacy, Madurai Page 71
2.4 Preparation of sample solution:
20 tablets were weighed and average weight was found out. The tablets were
powdered, about 5 mg equivalent of Curcumin (about 8.066 g of diazen tablet
powder) weighed and transferred into 200 ml volumetric flask, 40 ml THF was
added and sonicated for 20 min. Finally the volume was made up with mobile phase.
Filtered through the 0.45 μ membrane filter. (the final concentration of resulting was
25 μg/ml).
Chromatographic conditions:
Column : symmetry C18, 150 x 4.6mm x 5μ
Mobile phase : THF: 1% Citric acid (450:550)
Flow rate : 1 ml/min
Column temp : Ambient temperature
Detection wavelength : 425 nm
Run time : 25 min
pH : 2.8
Injection volume : 20 μl
Elution technique : Isocratic technique
1.1 SPECIFICITY:
1.1.1 SELECTIVITY:
Preparation of analytical solutions
a.Blank : Mobile phase was used as blank
b.Standard preparation : prepared as described under 2.3.
c.Assay preparation : prepared as described under 2.4.
d.Placebo preparation : Transferred an accurately weighed quantity of
about 8.06 g of placebo (diazen tablets excipient mixture) into a 200 ml volumetric
flask and added 40 ml of the tetra hydro furan and sonicated for 20 minutes. The
volume was made up with mobile phase. Filtered the resulting solution through 0.45
μm membrane filter.

Chapter- 5.3 Analytical method validation
Department of Pharmaceutical analysis, K.M college of pharmacy, Madurai Page 72
Table-1: Sequence for selectivity
S. No. Sample name Number of injections
1 Blank 1 2 Standard preparation 6 3 Blank for carry over 1 4 Placebo preparation 2 6 Assay preparation 2 7 Standard preparation (Closing) 1
1.1.2 Procedure: Separately injected 20 µl each of all the above solutions
described under 1.1.1 into the chromatograph and continued the chromatography until
the retention time of Curcumin peak. Measure the responses the peak for all the
solutions. (Refer Table-1 for sequence of injections).
1.1.3 Acceptance criteria: The interference between peaks obtained for all the
solutions should be NIL. The peaks should well separate from the peaks obtained
with blank, placebo, standard and test solution.
Chromagram-10 Blank preparation
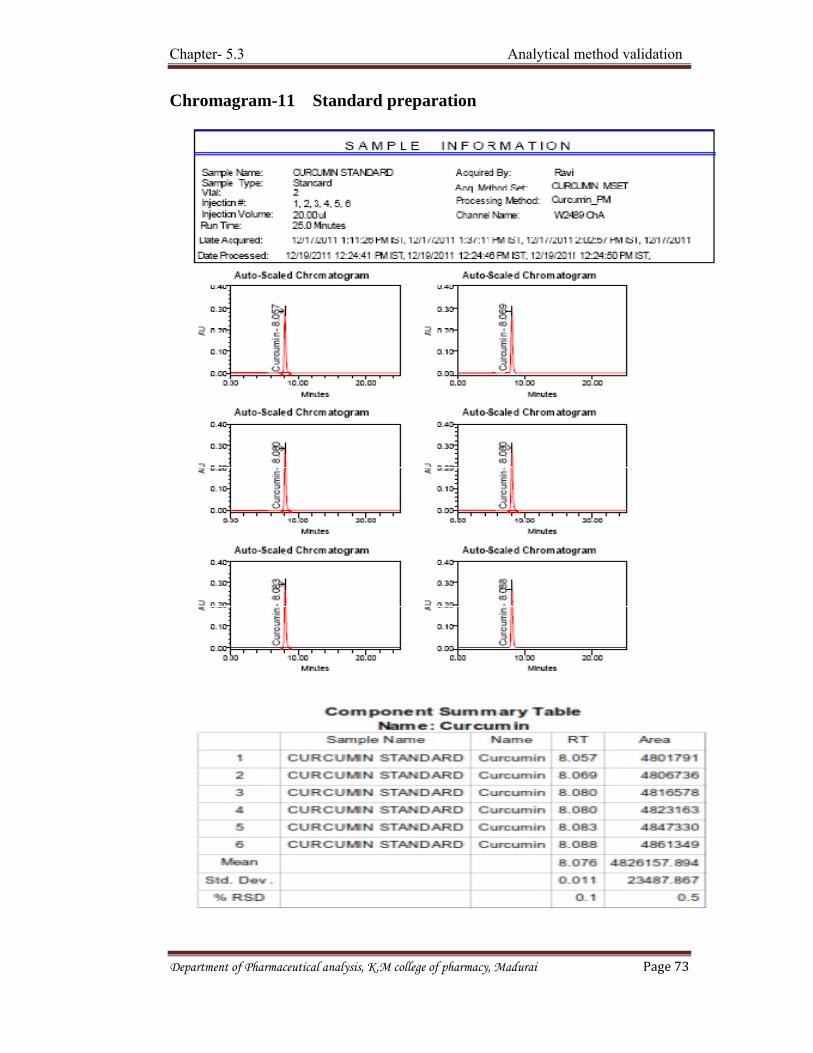
Chapter- 5.3 Analytical method validation
Department of Pharmaceutical analysis, K.M college of pharmacy, Madurai Page 73
Chromagram-11 Standard preparation

Chapter- 5.3 Analytical method validation
Department of Pharmaceutical analysis, K.M college of pharmacy, Madurai Page 74
Chromagram-12 placebo preparation

Chapter- 5.3 Analytical method validation
Department of Pharmaceutical analysis, K.M college of pharmacy, Madurai Page 75
Chromagram-13 Assay Preparation

Chapter- 5.3 Analytical method validation
Department of Pharmaceutical analysis, K.M college of pharmacy, Madurai Page 76
1.2) PRECISION Objective: Establish the precision of the analytical method using the two
methods. .
A) Repeatability: Establish the repeatability of the analytical method by estimating
the assay for six different sample preparations of same batch. Calculate percentage
content for all six-sample preparations and the %RSD was reported for the same.
B) Intermediate precision (Ruggedness): Establish the ruggedness of the analytical
method by estimating the assay for six different sample preparations of same batch by
a different analyst using a different HPLC system with different lot of column on a
different day. Calculate percentage content for all six-sample preparations and report
the %RSD for the same.
A) REPEATABILITY
a) Blank: Mobile phase was used as blank
b) Standard preparation: prepared as described under 2.3.
c) Assay preparation : prepare as described under 2.4.
S. No. Sample name Number of injections
1 Blank 1
2 Standard preparation 6
3 Assay preparation-1 2
4 Assay preparation-2 2
5 Assay preparation-3 2
6 Standard preparation (Bracketing) 1
7 Assay preparation-4 2
8 Assay preparation-5 2
9 Assay preparation-6 2
10 Standard preparation (Closing) 1
Procedure: Separately injected 20 µl of standard preparation in replicate and assay
preparations in duplicate into the chromatograph and measure the peak responses for
the major peak. The percentage of the labeled amount of Curcumin in the portion of
tablets was calculated by the formula.

Chapter- 5.3 Analytical method validation
Department of Pharmaceutical analysis, K.M college of pharmacy, Madurai Page 77
Chromagram-16 standard preparation for repeatability
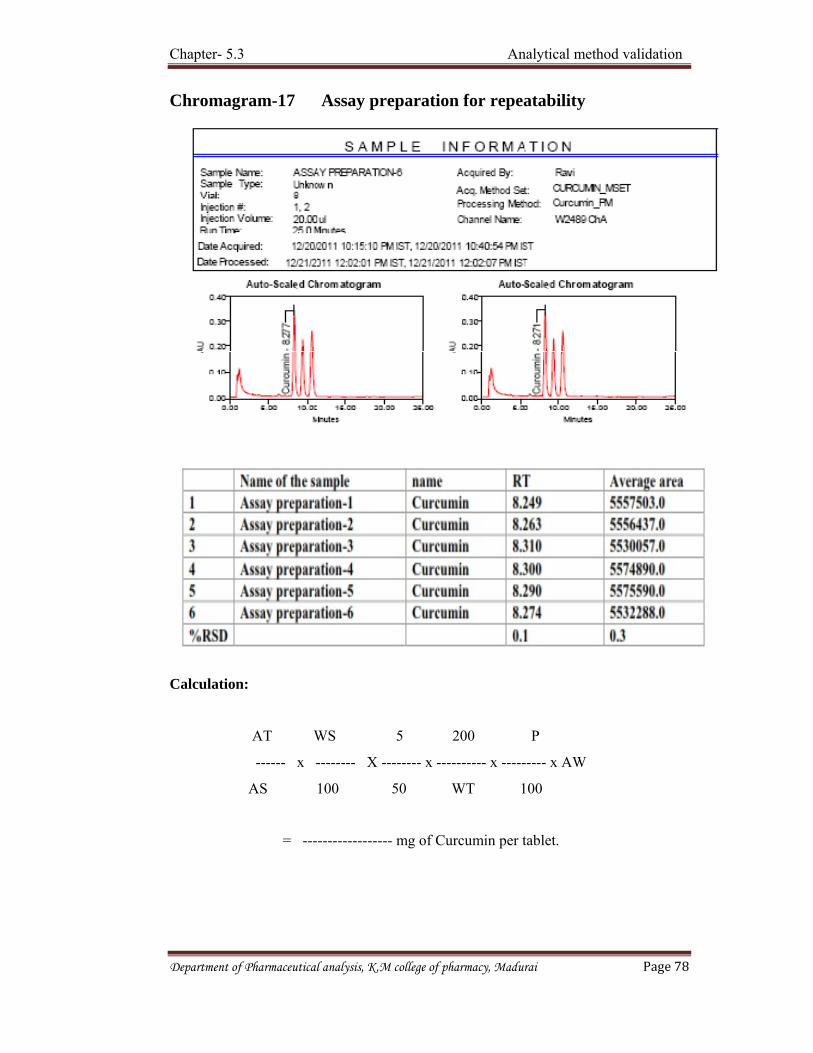
Chapter- 5.3 Analytical method validation
Department of Pharmaceutical analysis, K.M college of pharmacy, Madurai Page 78
Chromagram-17 Assay preparation for repeatability
Calculation:
AT WS 5 200 P
------ x -------- X -------- x ---------- x --------- x AW
AS 100 50 WT 100
= ------------------ mg of Curcumin per tablet.

Chapter- 5.3 Analytical method validation
Department of Pharmaceutical analysis, K.M college of pharmacy, Madurai Page 79

Chapter- 5.3 Analytical method validation
Department of Pharmaceutical analysis, K.M college of pharmacy, Madurai Page 80
B) INTERMEDIATE PRECISION (RUGGEDNESS)
Raggedness was done by different analyst using a different HPLC system with
a different lot of column on a different day should carried out this experiment.
a) Blank: Mobile phase was used as blank.
b) Standard preparation: Prepare as described under 2.3.
c) Assay preparation: Prepare as described under 2.4
d) Table-4: Intermediate precision / Ruggedness sequence for curcumin
Tablets
S. No. Sample name Number of injections
1 Blank 1
2 Standard preparation 6
3 Assay preparation-1 2
4 Assay preparation-2 2
5 Assay preparation-3 2
6 Standard preparation (Bracketing) 1
7 Assay preparation-4 2
8 Assay preparation-5 2
9 Assay preparation-6 2
10 Standard preparation (Closing) 1
Procedure: Separately injected 20 µl of standard preparation in replicate and assay
preparations in duplicate into the chromatograph and measured the peak responses for
the major peak. The percentage of the labeled amount of diazen tablet was calculated
Acceptance criteria 1.2.2 for repeatability
RSD of the assay of all six-sample preparations of same batch should not be
more than 2.0%.
1.2.1 For intermediate precision (Ruggedness)
a) The relative standard deviation for the assay values of six sample preparations
of same batch should not be more than 2.0%.
b) The difference in the assay of same batch between two analysts should not be
more than 5.0%.

Chapter- 5.3 Analytical method validation
Department of Pharmaceutical analysis, K.M college of pharmacy, Madurai Page 81
Chromagram-18 Assay preparation for intermediate precision

Chapter- 5.3 Analytical method validation
Department of Pharmaceutical analysis, K.M college of pharmacy, Madurai Page 82

Chapter- 5.3 Analytical method validation
Department of Pharmaceutical analysis, K.M college of pharmacy, Madurai Page 83
1.3) LINEARITY & RANGE Objective: Using the following two methods the linearity of the analytical assay
was established.
Linearity & range of Curcumin in standard preparations from of 80% to 120%
of test concentration: Demonstrate the linearity of the analytical method for assay by
injecting the various concentrations of standard preparation prepared in the range of
80% to 120%, into the chromatograph, covering 5 different concentrations. A plot
between the Concentrations in ppm vs peak response of Curcumin was constructed.
The slope, intercept and regression coefficient from the plot obtained for
concentration vs. Peak response of Curcumin in standard preparation were reported.
1.3.1. Preparation of analytical solutions for linearity & range of Curcumin in
standard preparation:
a) Blank: Mobile phase was used as blank.
b) Standard preparation: Prepare as described under 2.3.
c) Stock standard preparation: Transferred an accurately weighed quantity of
about 25 mg of Curcumin working standard into a 100 ml volumetric flask.
25ml of tetra hydro furan was added and sonicated to dissolve and the volume
was made up with mobile phase.
d) 80% linearity solution: 4.0ml of standard stock solution was pipetted out in
50ml volumetric flask and diluted to volume with mobile phase. Filtered the
solution through 0.45µm membrane filter.
e) 90% linearity solution: 4.5 ml of standard stock solution was pipetted out in
50ml volumetric flask and diluted to volume with mobile phase. Filtered the
solution through 0.45µm membrane filter.
f) 100% linearity solution: 5.0ml of standard stock solution was pipetted out in
50ml volumetric flask and diluted to volume with mobile phase. Filtered the
solution through 0.45µm membrane filter.
g) 110% linearity solution: 5.5ml of standard stock solution was pipetted out in
50ml volumetric flask and diluted to volume with mobile phase. Filtered the
solution through 0.45µm membrane filter.

Chapter- 5.3 Analytical method validation
Department of Pharmaceutical analysis, K.M college of pharmacy, Madurai Page 84
h) 120% linearity solution: 6.0ml of standard stock solution was pipetted out in
50ml volumetric flask and diluted to volume with mobile phase. Filtered the
solution through 0.45µm membrane filter.
Table-5: Linearity sequence
S. No. Sample name Number of injections
1 Blank 1
2 Standard preparation 6
3 80% linearity solution 3
4 90% linearity solution 3
5 Standard preparation (Bracketing) 1
6 100% linearity solution 3
7 110% linearity solution 3
8 120% linearity solution 3
9 Standard preparation (Closing) 1
1.3.1 Procedure: Separately injected 20 µl of standard preparation in replicate into
the chromatograph and measure the peak responses for the major peak.RSD for the 6
replicate injections was calculated. Continued the injections of 20µl in triplicate for
all preparations described above into the chromatograph and the chromatograms were
recorded. Measured the peak responses for the major peak for all the solutions. A plot
between the concentrations vs the average peak responses of Curcumin was drawn.
The slope, intercept and regression coefficient from the plot were calculated.
1.3.2 Calculations: A plot of concentrations vs the average peak responses for
Curcumin standard solutions was drawn and the slope, intercept and regression
coefficient from the plot obtained were reported.

Chapter- 5.3 Analytical method validation
Department of Pharmaceutical analysis, K.M college of pharmacy, Madurai Page 85
1.3.3 Acceptance Criteria: The relationship between the concentration and
response of Curcumin should be linear in the specified range and the regression
coefficient should not be less than 0.995.
Chromagram-19 Curcumin standard for linearity

Chapter- 5.3 Analytical method validation
Department of Pharmaceutical analysis, K.M college of pharmacy, Madurai Page 86
Chromate gram- 20 Curcumin 80% linearity

Chapter- 5.3 Analytical method validation
Department of Pharmaceutical analysis, K.M college of pharmacy, Madurai Page 87
Chromatogram- 21 Curcumin 90% linearity

Chapter- 5.3 Analytical method validation
Department of Pharmaceutical analysis, K.M college of pharmacy, Madurai Page 88
Chromatogram -22 Curcumin 100% linearity

Chapter- 5.3 Analytical method validation
Department of Pharmaceutical analysis, K.M college of pharmacy, Madurai Page 89
Chromatogram -23 Curcumin 110% linearity

Chapter- 5.3 Analytical method validation
Department of Pharmaceutical analysis, K.M college of pharmacy, Madurai Page 90
Chromatogram -24 Curcumin 120% linearity
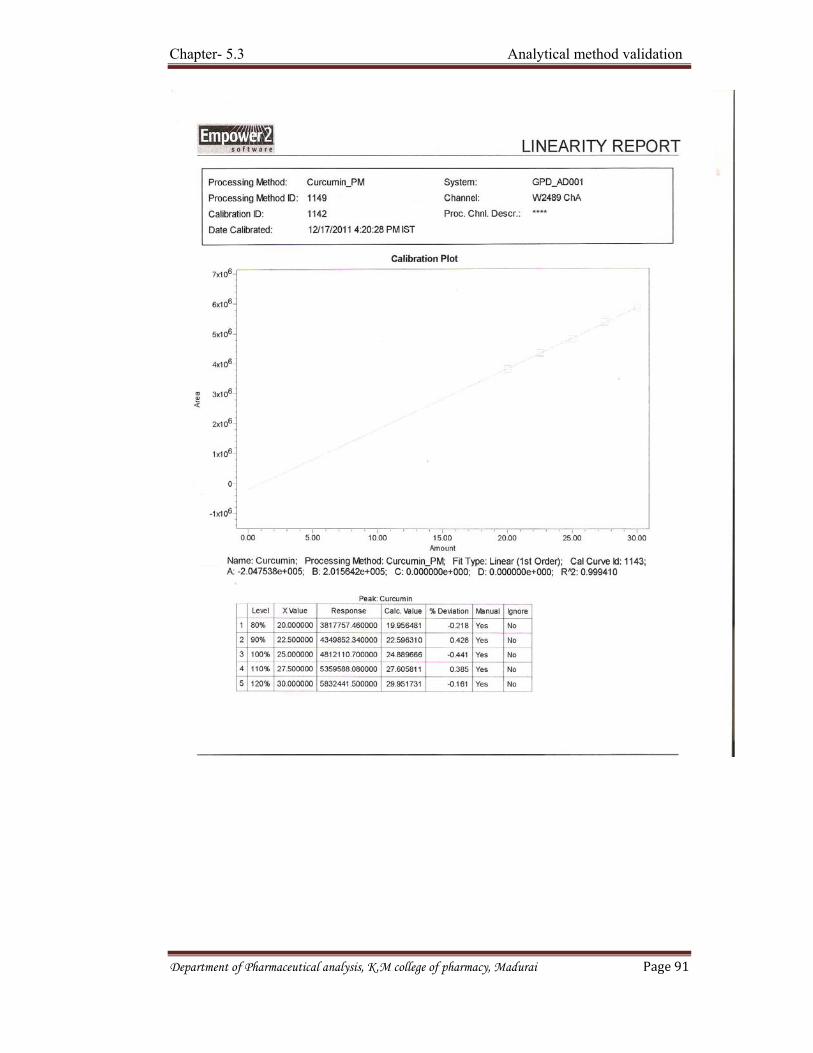
Chapter- 5.3 Analytical method validation
Department of Pharmaceutical analysis, K.M college of pharmacy, Madurai Page 91

Chapter- 5.3 Analytical method validation
Department of Pharmaceutical analysis, K.M college of pharmacy, Madurai Page 92
1.4 ACCURACY 1.4.1 The accuracy of the analytical method was calculated by using the following
method.
Recovery experiments: Performed the recovery studies by adding known quantities
of Curcumin working standard to known quantity of placebo (diazen Tablets excipient
mixture) in the range of 80% - 120% of the test concentration specified in the method
of analysis. The percentage recovery in presence of placebo and relative standard
deviations for all the values of % recovery was reported.
1.4.2 Preparation of analytical solutions for recovery of Curcumin in presence of
placebo:
a) Blank : mobile phase was used as blank.
b) Standard preparation : Prepare as described under 2.3.
Preparation of recovery solutions in presence working standard of placebo in
diazen Tablets
1) Preparation of 80% recovery solution: Transferred an accurately weighed
quantity of about 4mg of Curcumin working standard into a 200 ml volumetric flask
containing 8.098 g of placebo, 40 ml of tetra hydro furan was added and sonicated for
20 minutes and the volume was made up with mobile phase. Filtered through 0.45 μm
membrane filter. (Prepared in triplicate).
2) Preparation of 100% recovery solution: Transferred an accurately weighed
quantity of about 5 mg of Curcumin working standard into 200 ml volumetric flask
containing 8.098 g of placebo, 40 ml of tetra hydro furan was added and sonicated
for 20 minutes and the volume was made up with mobile phase. Filtered through 0.45
μm membrane filter. (Prepared in triplicate).
3) Preparation of 120% recovery solution: Transferred an accurately weighed
quantity of about 6mg of Curcumin working standard into a 200 ml volumetric flask
containing 8.098 g of placebo, 40 ml of tetra hydro furan was added and Sonicated for
20 minutes and the volume was made up with mobile phase. Filtered through 0.45 μm
membrane filter. (Prepared in triplicate).

Chapter- 5.3 Analytical method validation
Department of Pharmaceutical analysis, K.M college of pharmacy, Madurai Page 93
Table-6: Sequence for recovery in presence of placebo of diazen tablet.
S. No. Sample name Number of injections
1 Blank 1
2 Standard preparation 6
3 Blank for carry over 1
4 80% recovery solution_1 3
5 80% recovery solution_2 3
6 80% recovery solution_3 3
7 Standard preparation (Bracketing) 1
8 100% recovery solution_1 3
9 100% recovery solution_2 3
10 100% recovery solution_3 3
11 120% recovery solution_1 3
12 120% recovery solution_2 3
13 120% recovery solution_3 3
14 Standard preparation (closing) 1
1.4.3 Procedure: Separately injected 20 µl of standard preparation in replicate and
recovery solutions into the chromatograph and the peak responses for the major peaks
was measured. The percentage recovery in recovery solutions was calculated using
the following expression. (Refer Table-6 for sequence of injections)
1.4.4 Calculations
AT WS 5 200 100
--------x -------- x ------- x ------- x --------
AS 200 50 1 10
= ____________mg of Curcumin WS recovered
mg of Curcumin WS recovered
% of recovery = --------------------------------------------- X 100
mg of Curcumin WS added

Chapter- 5.3 Analytical method validation
Department of Pharmaceutical analysis, K.M college of pharmacy, Madurai Page 94
1.4.5 Acceptance criteria: The percentage recovery should lie between 98% and
102%. The relative standard deviation of all recovery values should not be more than
2.0%.
Chromagram-25 Standard preparation for recovery

Chapter- 5.3 Analytical method validation
Department of Pharmaceutical analysis, K.M college of pharmacy, Madurai Page 95
Chromagram-26 80% of assay preparation-1 for recovery

Chapter- 5.3 Analytical method validation
Department of Pharmaceutical analysis, K.M college of pharmacy, Madurai Page 96
Chromagram-27 80% of assay preparation-2 for recovery

Chapter- 5.3 Analytical method validation
Department of Pharmaceutical analysis, K.M college of pharmacy, Madurai Page 97
Chromagram-28 80% of assay preparation-3 for recovery

Chapter- 5.3 Analytical method validation
Department of Pharmaceutical analysis, K.M college of pharmacy, Madurai Page 98
Calculation for 80% recovery preparation

Chapter- 5.3 Analytical method validation
Department of Pharmaceutical analysis, K.M college of pharmacy, Madurai Page 99
Chromagram-29 100% of assay preparation-1 for recovery
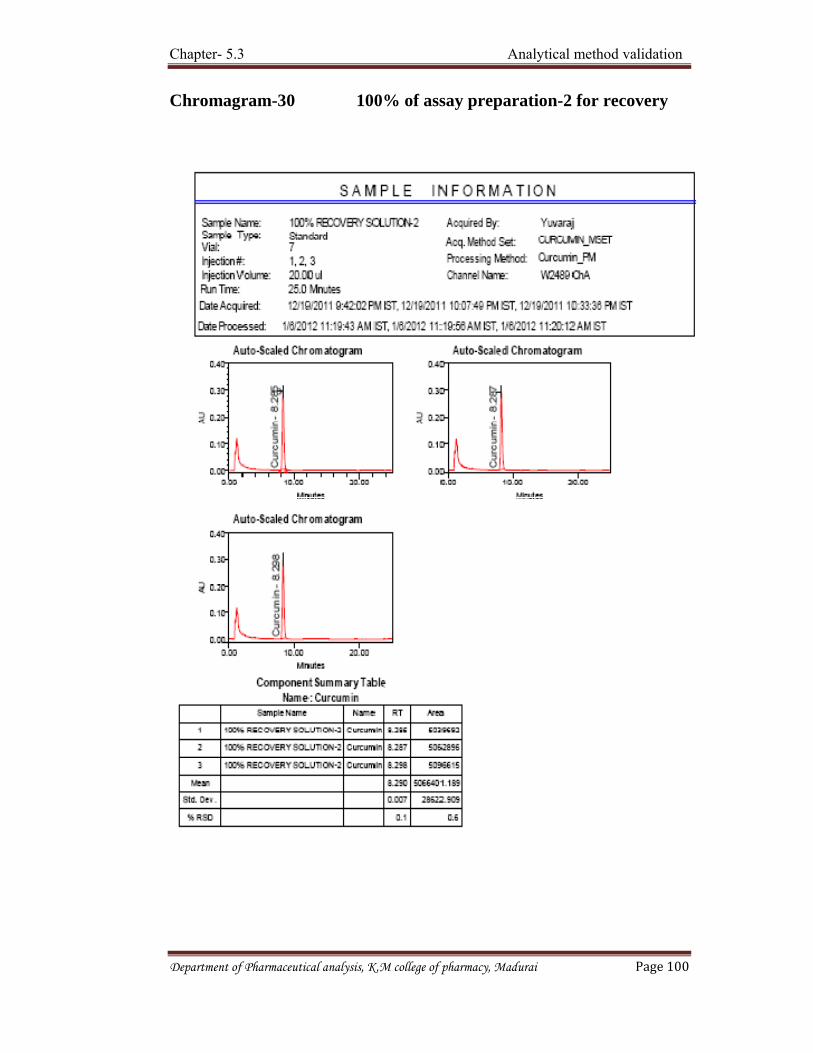
Chapter- 5.3 Analytical method validation
Department of Pharmaceutical analysis, K.M college of pharmacy, Madurai Page 100
Chromagram-30 100% of assay preparation-2 for recovery
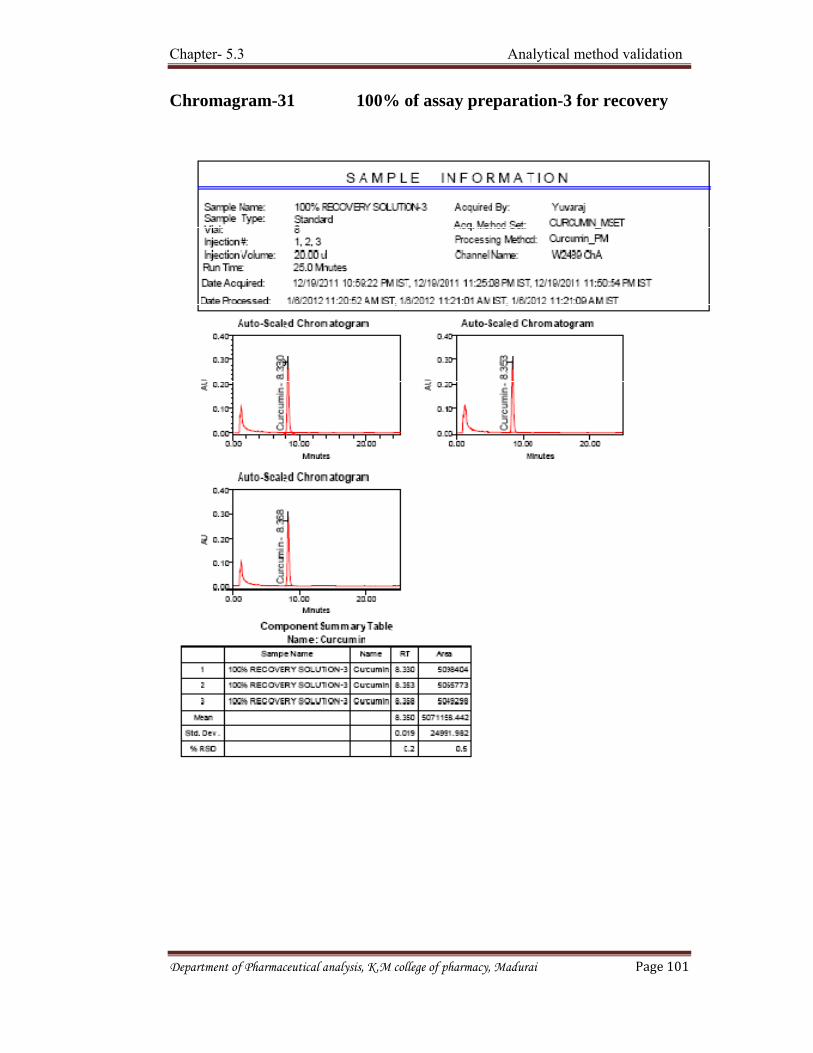
Chapter- 5.3 Analytical method validation
Department of Pharmaceutical analysis, K.M college of pharmacy, Madurai Page 101
Chromagram-31 100% of assay preparation-3 for recovery

Chapter- 5.3 Analytical method validation
Department of Pharmaceutical analysis, K.M college of pharmacy, Madurai Page 102
Calculation for 100% recovery preparation
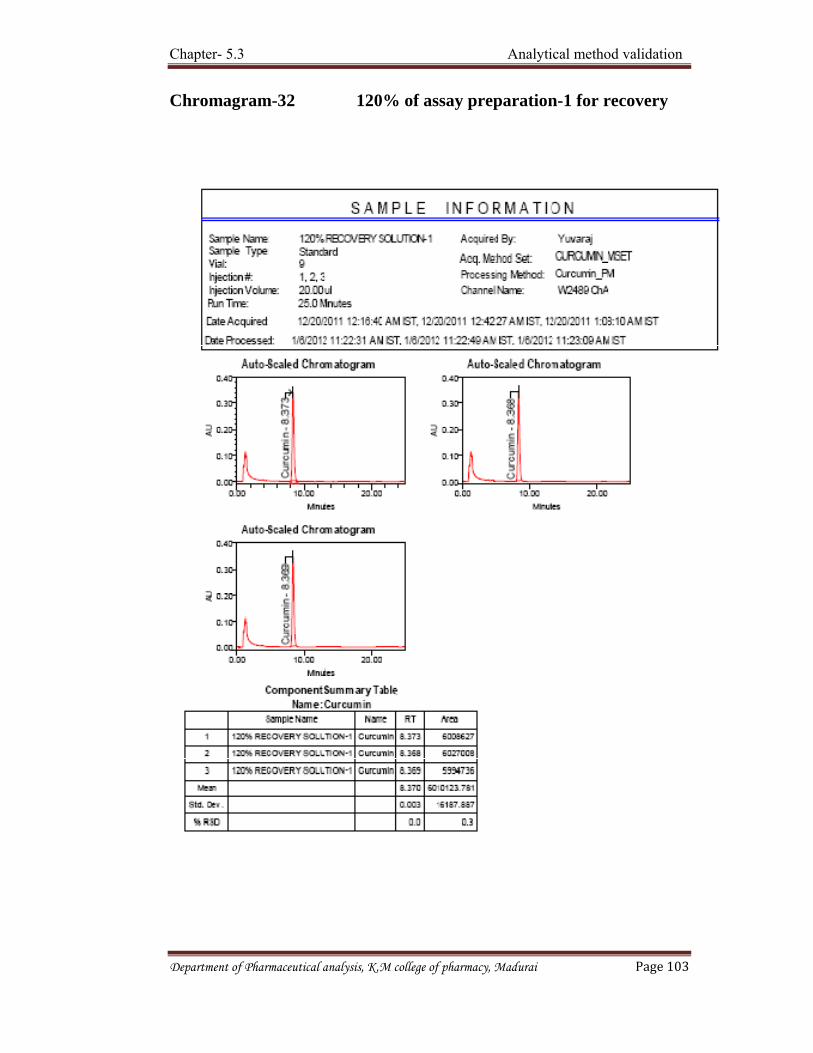
Chapter- 5.3 Analytical method validation
Department of Pharmaceutical analysis, K.M college of pharmacy, Madurai Page 103
Chromagram-32 120% of assay preparation-1 for recovery

Chapter- 5.3 Analytical method validation
Department of Pharmaceutical analysis, K.M college of pharmacy, Madurai Page 104
Chromagram-33 120% of assay preparation-2 for recovery

Chapter- 5.3 Analytical method validation
Department of Pharmaceutical analysis, K.M college of pharmacy, Madurai Page 105
Chromagram-34 120% of assay preparation-3 for recovery

Chapter- 5.3 Analytical method validation
Department of Pharmaceutical analysis, K.M college of pharmacy, Madurai Page 106
Calculation for 120% recovery preparation

Chapter- 5.3 Analytical method validation
Department of Pharmaceutical analysis, K.M college of pharmacy, Madurai Page 107
1.5 SYSTEM SUITABILITY 1.5.1 Objective: The suitability of chromatographic system was determined by the method
of analysis by establishing system suitability test parameters like relative retention
times, resolution, tailing factor and number of theoretical plates for system suitability
preparation and % RSD of Curcumin standard preparation. This parameters needs to
be observed on daily basis.
1.5.2
Procedure: Separately injected 20 μl of standard preparation (6.1.3.) in to the
chromatograph and the chromatogram was recorded and the relative retention times,
tailing factor and number of theoretical plates and % RSD of standard preparation
were measured.
1.5.3
Calculation: The relative retention times & tailing factor were calculated for system
suitability preparation and % RSD for replicate injections of standard preparation
1.5.4
Acceptance criteria:
a) Peak symmetry as tailing factor for Curcumin peak for standard preparation
should not be more than 2.0.
b) % RSD for standard preparation should not be more than 2.0%.Column
efficiency as number of theoretical plates for Curcumin peak for standard
preparation should not be less than 2000.

Chapter- 5.3 Analytical method validation
Department of Pharmaceutical analysis, K.M college of pharmacy, Madurai Page 108
Chromagram-35

Chapter- 5.3 Analytical method validation
Department of Pharmaceutical analysis, K.M college of pharmacy, Madurai Page 109
Chromagram-36

Chapter-6 Results and discussion
Department of Pharmaceutical analysis, K.M college of pharmacy, Madurai. Page 110
6. RESULTS AND DISCUSSION
The RP-HPLC method was developed for estimation of Curcumin in poly
herbal tablet dosage form and validation was performed in accordance with ICH
guidelines for the following parameters such as system suitability linearity and range,
precision, accuracy, ruggedness and specificity. The summary of results obtained in
analytical method development and validation were shown in table 1.
Table 1: Data and Results
Parameters Acceptance Results
System suitability 1.% RSD NMT 2%
2. Tailing factor NMT 2
3.Theoretical plates NLT
2000
0.5%
1.2
Passes
Specificity No interference with
blank and placebo
preparation
No interference
Precision (Repeatability) % RSD NMT 2% 0.3
Accuracy 98-102% 101.73
Linearity Correlation co-efficient
NLT 0.999
0.9994
Ruggedness % RSD NMT 2% 0.2
Validation summary report:
The observations and results obtained for each of the parameters like system
suitability, linearity and range, precision (repeatability), intermediate precision,
specificity and ruggedness lies well within the acceptance criteria. So the given method
was simple, specific, linear, precise, accurate and rugged and extensively used for the
estimation Curcumin in poly herbal tablet dosage form.

Chapter-6 Results and discussion
Department of Pharmaceutical analysis, K.M college of pharmacy, Madurai. Page 111
Discussion:
The Reverse Phase High Performance Liquid Chromatography method was
developed. Pure drug chromatogram was run in different mobile phases containing
acetonitrile, tetrahydrofuron and 1% citric acid also by using acetic acid. Different
columns like C8 & C18 were used. The mobile phase with THF: 1% citric acid in the
ratio of 45:55 was used. Phenolex C18 analytical column was selected which gives a
sharp peak and a symmetrical peak with 1.51 tailing. Calibration graph was found to be
linear at range 20 µg/ml to 30 µg/ml. Five different concentrations of Curcumin in
range above were prepared and 20 µl of each concentration injected in HPLC. The
correlation of coefficient (r2) was found to be 0.9994. It was observed that the
concentration range showed a good relationship. The percentage assay or average
amount of Curcumin in formulation was found to be 109.23% the low values of
standard deviation and coefficient of variation at each level of the recovery experiment
indicate high precision of the method.

Chapter -7 Summary and Conclusion
Department of Pharmaceutical analysis, K.M college of pharmacy, Madurai. Page 112
CONCULSION Curcumin is a (1E, 6E)-1, 7-bis (4-hydroxy-3-methoxyphenyl) -1, 6-
heptadiene-3, 5-Dione. It is an herbal drug which is used as an Anti microbial, Anti
inflammatory, Hepato protective, Anti carcinogenic, Anti bacterial, Anti oxidant, Anti
mutagenic. A simple, sensitive and cost effective RP-HPLC method with better
system suitability parameters has been developed for the estimation of Curcumin in
formulation. This method can be employed for the estimation of formulations
containing poly herbal combinations.
From the experimental data results and parameters it was concluded that the
developed RP-HPLC method has the following advantages:
The standard and sample preparation requires less time
No tedious extraction procedure was involved in the analytical process.
Suitable for the analysis of raw materials, marketing samples and
formulations.
Hence, the chromatographic method developed for Curcumin was found to be
simple, precise, accurate and cost effective and it could be effectively applied
for routine analysis in research institutions, quality control department in
industries, approved testing laboratories, bio-pharmaceutics and bio-
equivalence studies and in clinical pharmacokinetic studies.

BIBILOGRAPHY 1. Kamboj P. C. Pharmaceutical Analysis. 2nd edition. New Delhi: Vallabh
Publication; Volume I. 2003. Pg.1–3.
2. Willard H, Metrit L. L, Dean J.A , Settle F.A. Instrumental methods of
Analysis. 7th edn. New Delhi: CBS publishers and distributors; 1986. Pg.11.
3. Sethi P. D. Quantitative analysis of pharmaceutical formulation. 1st edn. New
Delhi: Sathish kumar Jain for CBS publishers and distributors; 2001. Pg. 3-
12.
4. Douglas A, Skoog, Donald M, James E, Holler, Stanley Crouch.Fundamental
of Analytical Chemistry. 8th edn. Singapore: Thomson Asia Pvt. Ltd; 2006.
Pg. 2. 344-346, 677. 5. Gary D. Christian Analytical chemistry. 6th edn. New Delhi: John Willey and
Sons Ltd; 2003. Prefix 5. 6. Willard, Meritt, Dean, Settle. Instrumental Methods of Analysis.7th edn. New
Delhi: CBS Publishers and Distributors; 1986. Pg. 1, 592, 622-628. 7. Sharma B. K. Organic Spectroscopy. Meerut(U.P): Goel Publishing House;
2002. S-75. 8. Mendham J, Denney R. C, Barnes J. D and Thomas M. J. K. Vogel’s Text
Book of Quantitative Chemical Analysis. 6thedition. New Delhi: Pearson
education; 2002. Pg. 133 – 140, 269 – 275, 653. 9. Raymond P, Scott w. Liquid chromatography. 2003. Pg 6-12.
10. James W, Munson. Pharmaceutical analysis modern methods. Mumbai:
international medical book distributors; part-B. 2001. Pg 36-50. 11. Beckett A. H and stenlake J. B.Practical Pharmaceutical Chemistry. 4th edn.
New Delhi: Publishers and Distributors; 2007. (II). Pg.259, 260, 278-290, 293-
297.

12. Sundar Rao. Pharmaceutical analysis. 3rd edn. New Delhi: CBS publication
and distributors; 2006. Pg.250- 265. 14. Code Q2B.Validation of analytical procedures methodology. Geneva,
Switzerland: ICH Harmonized Tripartite Guidelines; 6th November. 1996. Pg
1 - 8. 15. Anonymous. The Merck Index. 14th edn. USA: Merck Research Laboratories
Division of Merck & Co. Inc; 2006. Pg.3521, 3568, 9151.
16. Dwivedi A. K. Combined thin-layer chromatography-densitometry for the
quantitation of Curcumin in pharmaceutical dosage forms and in serum. Indian
journal of pharmaceutical science. 1993; 55 (5): 174-177.
17. Jayaprakasha GK, Jagan Mohan Rao L, Sakariah KK. Improved HPLC
method for the determination of Curcumin, Demethoxycurcumin, and
Bisdemethoxycurcumin. J Agric Food Chem. 2002; 50(13); 3668-72.
18. Jayant K. Verma et al. Rapid HPTLC method for identification and
quantification of Curcumin, piperine and thymol in an ayurvedic formulation.
JPC. 2006; 19: 398-400.
19. Zengshuan Ma et al., High-performance liquid chromatography analysis of
Curcumin in rat plasma application to pharmacokinetics of polymeric micellar
formulation of Curcumin. Biomed Chromatography. 2007; 21(5): 546-52.
20. Paramasivam M. Occurrence of Curcuminoids in Curcumalonga quality
standardization by HPTLC. Bangladesh J Pharmacol. 2008; 3: 55-58.
21. Tanaka.K.Quantitation of curcuminoids in curcuma rhizome by near-infrared
spectroscopic analysis. J Agric Food Chem. 2008; 56(19): 8787-92.
22. Zhang J. A simple HPLC-fluorescence method for quantitation of curcuminoids
and its application to turmeric products. Anal Sci. 2009; 25(3): 385-8.
23. Paramasivam M, Poi R, Banerjee H, Bandyopadhyay A. High-performance thin
layer chromatographic method for quantitative determination of Curcuminoids
in Curcuma longa germplasm. Food chemistry. 2009; 113(2): 640–644.
24. Wichitnithad W. A simple isocratic HPLC method for the simultaneous
determination of curcuminoids in commercial turmeric extracts. Phytochem
Anal. 2009; 20(4): 314-319.
25. Jadhav B. K. Development and validation of Improved Reversed Phase-HPLC
Method for simultaneous determination of Curcumin, Demethoxycurcumin and
Bis- Demethoxycurcumin. Chromatographia. 2007; 65: 483-488.
26. Li J, Jiang Y. A rapid and simple HPLC method for the determination of
curcumin in rat plasma assay development, validation and application to a
pharmacokinetic study of Curcumin liposome. Biomed Chromatogr. 2009;
23(11): 1201-7.
27. Yadav Vivek Ramshankar. A Sensitive Reversed Phase HPLC Method for the
Determination of Curcumin. Biochem cogn. 2009; 5(17): 71-74.
28. Rubesh Kumar S. Simultaneous Spectrophotometric Estimation of
Curcuminoids and Gallic Acid in Bulk Drug and ayurvedic Polyherbal Tablet
Dosage Form. International Journal of Pharmaceutical Quality Assurance.
2010; 2(1): 56-59.
29. Archana, Bele A. Development and Validation of HPTLC Method for
Estimation of Curcumin, Ellagic acid in Gel Formulation. International
Journal of Research in Pharmaceutical and Biomedical Sciences ISSN: 2229-
3701. 2011; 2 (1): 75-77.
30. Niraj vyas. Simultaneous estimation of Curcumin and piperine in their crude
powder mixture and Ayurvedic formulation using High Performance Thin
Layer Chromatography. International journal of Research in pharmaceuticals
and Biomedical Science ISSSN: 2229-3701. 2011; 2(1): 95-99.

31. Arun gantait. Validated method for estimation of Curcumin in turmeric
powder by HPTLC. Indian journal of traditional knowledge. 2011; 10 (2);
247-25.
Web References 1. WWW.shn.ifas.ufl.edu/faculty/mrmarshall.
2. http://www.ncbi.nlm.nih.gov/pubmed/12059141
3. http://www.ncbi.nlm.nih.gov/pubmed/19488971
4. http://www.ncbi.nlm.nih.gov/pubmed/19402187
5. www.ijrpbsonline.com,
6. www.ijrpbsonline.com