Embed Size (px)
Citation preview

8261 - 1 Revision 0February 2007
METHOD 8261
VOLATILE ORGANIC COMPOUNDS BY VACUUM DISTILLATION IN COMBINATIONWITH GAS CHROMATOGRAPHY/MASS SPECTROMETRY (VD/GC/MS)
SW-846 is not intended to be an analytical training manual. Therefore, methodprocedures are written based on the assumption that they will be performed by analysts who areformally trained in at least the basic principles of chemical analysis and in the use of the subjecttechnology.
In addition, SW-846 methods, with the exception of required method use for the analysisof method-defined parameters, are intended to be guidance methods which contain generalinformation on how to perform an analytical procedure or technique which a laboratory can useas a basic starting point for generating its own detailed standard operating procedure (SOP),either for its own general use or for a specific project application. The performance dataincluded in this method are for guidance purposes only, and are not intended to be and mustnot be used as absolute QC acceptance criteria for purposes of laboratory accreditation.
1.0 SCOPE AND APPLICATION
1.1 This method is used to determine the concentrations of volatile organiccompounds, and some low-boiling semivolatile organic compounds, in a variety of liquid, solid,and oily waste matrices, as well as animal tissues. This method is applicable to nearly all typesof matrices regardless of water, soil, sediment, sludge, oil, and biota content. The followingRCRA compounds have been determined by this method:
Compound CAS Registry No.a
Acetone 67-64-1Acetonitrile 75-05-8Acetophenone 98-86-2Acrolein 107-02-8Acrylonitrile 107-13-1Allyl chloride 107-05-1t-Amyl ethyl ether (TAEE, 4,4-Dimethyl-3-oxahexane)
919-94-8
t-Amyl methyl ether (TAME) 994-05-8 Aniline 62-53-3Benzene 71-43-2Bromochloromethane 74-97-5Bromodichloromethane 75-27-4Bromoform 75-25-2Bromomethane 74-83-92-Butanone 78-93-3t-Butyl alcohol (TBA) 75-65-0n-Butylbenzene 104-51-8

Compound CAS Registry No.a
8261 - 2 Revision 0February 2007
sec-Butylbenzene 135-98-8tert-Butylbenzene 98-06-6Carbon disulfide 75-15-0Carbon tetrachloride 56-23-5Chlorobenzene 108-90-7Chlorodibromomethane 124-48-1Chloroethane 75-00-3Chloroform 67-66-3Chloromethane 74-87-32-Chlorotoluene 95-49-84-Chlorotoluene 106-43-41,2-Dibromo-3-chloropropane 96-12-8Dibromomethane 74-95-31,2-Dichlorobenzene 95-50-11,3-Dichlorobenzene 541-73-11,4-Dichlorobenzene 106-46-7cis-1,4-Dichloro-2-butene 764-41-0trans-1,4-Dichloro-2-butene 110-57-6Dichlorodifluoromethane 75-71-81,1-Dichloroethane 75-34-31,2-Dichloroethane 107-06-21,1-Dichloroethene 75-35-4trans-1,2-Dichloroethene 156-60-5cis-1,2-Dichloroethene 156-59-21,2-Dichloropropane 78-87-51,3-Dichloropropane 142-28-92,2-Dichloropropane 594-20-71,1-Dichloropropene 563-58-6cis-1,3-Dichloropropene 10061-01-5trans-1,3-Dichloropropene 10061-02-6Diethyl ether 60-29-7Diisopropyl ether (DIPE) 108-20-31,4-Dioxane 123-91-1Ethanol 64-17-5Ethyl acetate 141-78-6Ethylbenzene 100-41-4Ethyl t-butyl ether (ETBE) 637-92-3Ethyl methacrylate 97-63-2

Compound CAS Registry No.a
8261 - 3 Revision 0February 2007
Hexachlorobutadiene 87-68-32-Hexanone 591-78-6Iodomethane 74-88-4Isobutyl alcohol 78-83-1Isopropylbenzene 98-82-8p-Isopropyltoluene 99-87-6Methacrylonitrile 126-98-7Methyl t-butyl ether (MTBE) 1634-04-4Methylene chloride 75-09-2Methyl methacrylate 80-62-61-Methylnaphthalene 90-12-02-Methylnaphthalene 91-57-64-Methyl-2-pentanone (MIBK) 108-10-1Naphthalene 91-20-3N-Nitrosodibutylamine 924-16-3N-Nitrosodiethylamine 55-18-5N-Nitrosodimethylamine 62-75-9N-Nitrosodi-n-propylamine 621-64-7N-Nitrosomethylethylamine 10595-95-6Pentachloroethane 76-01-72-Picoline 109-06-8Propionitrile 107-12-0n-Propylbenzene 103-65-1Pyridine 110-86-1Styrene 100-42-51,1,2,2-Tetrachloroethane 79-34-5Tetrachloroethene 127-18-4Tetrahydrofuran 109-99-9Toluene 108-88-3o-Toluidine 95-53-41,2,3-Trichlorobenzene 87-61-61,2,4-Trichlorobenzene 120-82-11,1,1-Trichloroethane 71-55-61,1,2-Trichloroethane 79-00-5Trichloroethene 79-01-6Trichlorofluoromethane 75-69-41,2,3-Trichloropropane 96-18-41,2,4-Trimethylbenzene 95-63-6

Compound CAS Registry No.a
8261 - 4 Revision 0February 2007
1,3,5-Trimethylbenzene 108-67-8Vinyl chloride 75-01-4o-Xylene 95-47-6m-Xylene 108-38-3p-Xylene 106-42-3
a Chemical Abstract Service Registry Number
1.2 This method can be used to quantitate most volatile organic compounds that havea boiling point below 245 EC and a water-to-air partition coefficient below 15,000, whichincludes compounds that are miscible with water. Note that this range includes compounds notnormally considered to be volatile analytes (e.g., nitrosamines, aniline, and pyridine).
1.3 This method is based on a vacuum distillation and cryogenic trapping procedure(Method 5032) followed by gas chromatography/mass spectrometry (GC/MS). The methodincorporates surrogate-based matrix correction, where the analysis of multiple surrogates isused to predict matrix effects. As a result, the calculations involved are specific to this method,and may not be used with data generated by another method. This method includes all of thenecessary steps from sample preparation through instrumental analysis.
1.4 Prior to employing this method, analysts are advised to consult the base methodfor each type of procedure that may be employed in the overall analysis (e.g., Methods 3500,3600, 5000, and 8000) for additional information on quality control procedures, development ofQC acceptance criteria, calculations, and general guidance. Analysts also should consult thedisclaimer statement at the front of the manual and the information in Chapter Two for guidanceon the intended flexibility in the choice of methods, apparatus, materials, reagents, andsupplies, and on the responsibilities of the analyst for demonstrating that the techniquesemployed are appropriate for the analytes of interest, in the matrix of interest, and at the levelsof concern.
In addition, analysts and data users are advised that, except where explicitly specified in aregulation, the use of SW-846 methods is not mandatory in response to Federal testingrequirements. The information contained in this method is provided by EPA as guidance to beused by the analyst and the regulated community in making judgments necessary to generateresults that meet the data quality objectives for the intended application.
1.5 This method is restricted to use by, or under the supervision of, appropriatelyexperienced personnel who are familiar with the techniques of vacuum distillation andexperienced in the use of gas chromatography and mass spectrometry. Each analyst mustdemonstrate the ability to generate acceptable results with this method.
2.0 SUMMARY OF METHOD
2.1 An aliquot of a liquid, solid, or tissue sample is transferred to a sample flask, whichis then attached to the vacuum distillation apparatus (see Figure 1). The sample sizes given inthe method may be varied, depending on analytical requirements, while using the samecalibration curve. The surrogate corrections will compensate for variations in sample size. Reagent water is added to the aliquot of soil, tissue, or oil.

8261 - 5 Revision 0February 2007
2.2 The sample chamber pressure is reduced using a vacuum pump and remains atapproximately 10 torr (the vapor pressure of water) as water is removed from the sample. Thevapor is passed over a condenser coil chilled to 5 EC, which results in the condensation of watervapor. The uncondensed distillate is cryogenically trapped in a section of stainless steel tubingchilled to the temperature of liquid nitrogen (-196 EC).
2.3 After an appropriate distillation period, which may vary due to matrix or analytegroup, the condensate contained in the cryotrap is thermally desorbed and transferred to thegas chromatograph using helium as a carrier gas.
2.4 Analytes eluted from the gas chromatographic column are introduced into the massspectrometer via a jet separator or a direct connection. (Wide-bore capillary columns normallyrequire a jet separator, whereas narrow-bore capillary columns may be directly interfaced to theion source.)
2.5 Quantitation is accomplished in three specific steps.
2.5.1 The first step is the measurement of the response of each analyte at themass spectrometer. The amount (mass) of analyte introduced into the mass spectrometeris determined by comparing the response (area) of the quantitation ion for the analyte froma sample analysis to the quantitation ion response generated during the initial calibration.
2.5.2 The second step is the determination of surrogate and analyte recovery. The recommended surrogates are listed in Table 3. The surrogate recovery is equal tothe total response for a sample divided by its average response during initial calibration. The surrogate recoveries are used to determine the recovery of each analyte using therecovery-properties relationship solutions (see Sec. 11.11.8).
2.5.3 Finally, using the predicted recovery, sample size, and quantity of analytedetected at the mass spectrometer, the concentration of analyte is calculated.
2.5.4 The software that generates the matrix corrections is freely available fromthe EPA at http://www.epa.gov/nerlesd1/chemistry/vacuum/default.htm.
2.6 The method includes specific calibration and quality control steps that supersedethe general requirements provided in Methods 8000 and 8260.
2.7 It must be emphasized that the vacuum distillation conditions are optimized toremove analytes from the sample matrix and to isolate water from the distillate. The conditionsmay be varied to optimize the method for a given analyte or group of analytes. The length oftime required for distillation may vary due to matrix effects or the analyte group of interest. Operating parameters may be varied to achieve optimum analyte recovery.
3.0 DEFINITIONS
α-effect -- The effect of the matrix on the relative volatility of a compound.
α-surrogate -- see "Gas-liquid partitioning surrogates."
β-effect -- The effect of the matrix on recovery as a function of boiling point of a compound. Also known as boiling point effects.
β-surrogates -- See condensation surrogates.

8261 - 6 Revision 0February 2007
Class I compounds -- Those compounds with boiling points generally below 160 EC and α-values (or K-values) below 50. Class I compounds include the permanent gases and mostvolatiles.
Class II compounds -- Those with boiling points greater than 160 EC. Class II compoundsinclude the neutral semivolatiles.
Class III compounds -- Those with α-values greater than 50. Class III compounds include thewater-soluble volatiles.
Class IV compounds -- The basic compounds that are susceptible to degradation and have alow detector response. Class IV compounds include the basic semivolatiles.
Condensation surrogates (boiling point or β-surrogates) -- The β-surrogates are added to thesample to measure the recovery of analytes relative to how the compounds condense onapparatus and sample surfaces during a vacuum distillation. The β-surrogates are identified inTable 3.
Distillation performance surrogates -- See "Gas-liquid partitioning surrogates."
Gas-liquid partitioning surrogates (α-surrogates) -- The α-surrogates are added to the sample tomeasure the recovery of analytes relative to how the compound partitions between gas andliquid (partition coefficient K). Compounds that are going to be used as α-surrogates that haveboiling points above 40 EC must first be evaluated for potential losses due to condensation anda correction made to their recoveries when condensation is evident. α-Surrogates are alsoknown as distillation performance surrogates.
Relative volatility (α) -- The property of an analyte that determines its presence in the vaporphase above an aqueous sample. The relative volatility is proportional to the gas-liquid partitioncoefficient (K) of the compound. Either α- or K-values can be used to describe this effect andTable 3 lists α-values for the compounds in Table 1 that are equivalent to K (Reference 7).
4.0 INTERFERENCES
4.1 Solvents, reagents, glassware, and other sample processing hardware may yieldartifacts and/or interferences to sample analysis (e.g., an elevated baseline in thechromatograms). All of these materials must be demonstrated to be free from interferencesunder the conditions of the analysis by analyzing method blanks. Specific selection of reagentsand purification of solvents by distillation in all-glass systems may be necessary. Refer to eachmethod to be used for specific guidance on quality control procedures and to Chapter Four forgeneral guidance on the cleaning of glassware. Also refer to Method 8000 for a discussion ofinterferences.
4.1.1 Interferences distilled from the sample will vary from source to source,depending on the particular sample or matrix. The analytical system should be checked toinsure freedom from interferences by analyzing method blanks utilizing the identicalanalytical conditions used for samples.
4.1.2 The apparatus can be decontaminated with a 10-min evacuation of thedistillation apparatus while the condenser coils are heated to 95 EC or higher.
4.2 The laboratory where the analysis is to be performed should be completely free ofsolvents. Many common solvents, most notably acetone and methylene chloride, are frequently

8261 - 7 Revision 0February 2007
found in laboratory air at low levels. The sample receiving chamber should be loaded in a cleanenvironment to eliminate the potential for contamination from ambient sources.
4.3 Samples may be contaminated during shipment. Field and trip blanks should beanalyzed to insure integrity of the transported sample. It is recommended that whereverpossible, sample aliquots and surrogates are transferred directly to sample flasks in the field,weighed and sealed using Viton® (or equivalent) O-ring connections.
4.4 Impurities in purge gas and from organic compounds out-gassing from plumbingaccount for the majority of contamination problems. The analytical system must bedemonstrated to be free from contamination under the conditions of the analysis by includinglaboratory reagent blanks. All gas lines should be equipped with traps to remove hydrocarbonsand oxygen.
5.0 SAFETY
5.1 This method does not address all safety issues associated with its use. Thelaboratory is responsible for maintaining a safe work environment and a current awareness fileof OSHA regulations regarding the safe handling of the chemicals specified in this method. Areference file of material safety data sheets (MSDSs) should be available to all personnelinvolved in these analyses.
5.2 The following analytes have been tentatively classified as known or suspectedhuman or mammalian carcinogens: benzene, carbon tetrachloride, chloroform, 1,4-dichlorobenzene, 1,2-dichloroethane, hexachlorobutadiene, 1,1,2,2-tetrachloroethane,trichloroethene, vinyl chloride, 1,1,2-trichloroethane, N-Nitrosodibutylamine,–Nitrosodiethylamine, N-Nitrosodimethylamine, N-Nitrosodi-n-propylamine, and N-Nitrosomethylethylamine. Pure standard materials and stock standard solutions containingthese compounds should be handled in a hood and a NIOSH/MESA-approved toxic gasrespirator should be worn when the analyst handles high concentration solutions of thesecompounds.
5.3 This method employs liquid nitrogen as a cryogenic coolant. Liquid nitrogen cancause burns to exposed skin, and should be handled with care. Employ insulated gloves ortongs when using this material.
6.0 EQUIPMENT AND SUPPLIES
The mention of trade names or commercial products in this manual is for illustrativepurposes only, and does not constitute an EPA endorsement or exclusive recommendation foruse. The products and instrument settings cited in SW-846 methods represent those productsand settings used during method development or subsequently evaluated by the Agency. Glassware, reagents, supplies, equipment, and settings other than those listed in this manualmay be employed provided that method performance appropriate for the intended applicationhas been demonstrated and documented.
This section does not list common laboratory glassware (e.g., beakers and flasks).
6.1 Microsyringes – 10-µL, 25-µL, 100-µL, 250-µL, 500-µL, and 1000-µL. Each ofthese syringes should be equipped with a 20-gauge (0.006 in ID) needle.
6.2 Syringe -- 5-mL and 10-mL gas-tight, with Luer Lock tip and needles.

8261 - 8 Revision 0February 2007
6.3 Balances
6.3.1 Analytical balance capable of accurately weighing to 0.0001 g.
6.3.2 Top-loading balance capable of weighing to 0.1 g.
6.4 Balance weights -- Stainless steel S-class weights ranging from 5 mg to 100 g.
6.5 Sample flask -- 100-mL borosilicate bulb joined to a 15-mm ID borosilicate O-ringconnector, or equivalent. The flask must be capable of being evacuated to a pressure of10 millitorr without implosion. The flask is sealed for sample storage with an O-ring capable ofmaintaining the vacuum in the chamber, a 15-mm ID O-ring connector cap, and a pinch clamp.
6.6 Vacuum distillation apparatus (See Figure 1) -- The basic apparatus consists of asample chamber connected to a condenser which is attached to a heated six-port valve (V4)and is available from Cincinnati Analytical Instruments, Cincinnati, OH. The sampling valve isconnected to the following;
1) condenser (by way of vacuum pump valve - V3) 2) vacuum pump3) cryotrap 4) gas chromatograph/mass spectrometer
The six-port sampling valve (V4) should be heated to at least 120 EC to prevent condensationand potential carryover.
6.6.1 The condenser is operated at two different temperatures. The lowertemperature is between -5 EC and 10 EC, and the upper temperature is greater than 45EC. The lower temperature is used to condense water and should be a consistenttemperature throughout the interior surface. The condenser is heated to the uppertemperature to remove water and potential contaminants. The initial apparatus describedin Reference 9 used circulating fluids (see Fig 1) but other means of controllingtemperatures may be used.
6.6.2 The apparatus is heated to a temperature sufficient to preventcondensation of analytes onto condenser walls, valves, and connections. The transfer linefrom the sampling valve to the gas chromatograph should be heated to a temperaturebetween 150 EC and the upper temperature utilized by the GC program.
6.6.3 The vacuum of the system should be monitored for integrity. Improperlyseated seals or errors in operation will cause elevated pressure readings.
6.6.4 The cryotrap condenser distillate in 1/8-in stainless steel tubing. Thetubing can be blocked when condenser temperature is not sufficient to trap water or asample contains a large amount of volatile compounds. These problems are diagnosedby a rapid drop in pressure readings recorded in vacuum distillation log file.
6.6.5 Any apparatus used must demonstrate appropriate performance for theintended application (see Tables 6 through 8).

8261 - 9 Revision 0February 2007
6.7 Gas chromatograph/mass spectrometer system
6.7.1 Gas chromatograph – An analytical system complete with a temperature-programmable gas chromatograph and all required accessories including syringes,analytical columns, and gases.
6.7.2 The column listed in this section was the column used in developing themethod. The listing of this column in this method is not intended to exclude the use ofother columns that are available or that may be developed. Laboratories may use thiscolumn or other columns provided that the laboratories document method performancedata (e.g., chromatographic resolution, analyte breakdown, and sensitivity) that areappropriate for the intended application.
Column -- 60 m x 0.53-mm ID, 3.0-µm film thickness VOCOL fused-silica capillarycolumn (Supelco, Bellefonte, PA), or equivalent.
6.7.3 Mass spectrometer -- Capable of scanning from 35-350 amu every 2 secor less, using 70 volts (nominal) electron energy in the electron impact mode andproducing a mass spectrum that meets the criteria listed in Table 1 when 50 ng of 4-bromofluorobenzene (BFB) is injected through the gas chromatograph inlet.
6.7.4 Gas chromatograph/mass spectrometer heated jet separator interface --A heated glass jet separator interface capable of removing from 10 to 40 mL/min of heliumfrom the exit end of the wide-bore capillary column. The interface should have the abilityto be heated through a range of 100 EC to 220 EC.
6.8 Containers for liquid nitrogen -- Dewars or other containers suitable for holding theliquid nitrogen used to cool the cryogenic trap and sample loop.
7.0 REAGENTS AND SUPPLIES
7.1 Reagent-grade chemicals must be used in all tests. Unless otherwise indicated, itis intended that all reagents conform to the specifications of the Committee on AnalyticalReagents of the American Chemical Society, where such specifications are available. Othergrades may be used, provided it is first ascertained that the reagent is of sufficiently high purityto permit its use without lessening the accuracy of the determination. Reagents should bestored in glass to prevent the leaching of contaminants from plastic containers.
7.2 Organic-free reagent water -- All references to water in this method refer toorganic-free reagent water, as defined in Chapter One.
7.3 Methanol -- CH3OH, purge-and-trap grade, or equivalent. Store away from othersolvents.
7.4 Standard solutions
The following sections describe the preparation of stock, intermediate, and workingstandards for the compounds of interest. This discussion is provided as an example, and otherapproaches and concentrations of the target compounds may be used, as appropriate for theintended application. See Method 8000 for additional information on the preparation ofcalibration standards.

8261 - 10 Revision 0February 2007
Stock solutions may be prepared from pure standard materials or purchased as certifiedsolutions. Prepare stock standard solutions in methanol, using assayed liquids or gases, asappropriate.
7.4.1 Place about 9.8 mL of methanol in a 10-mL tared, ground-glass-stoppered volumetric flask. Allow the flask to stand, unstoppered, for about 10 min or untilall alcohol-wetted surfaces have dried. Weigh the flask to the nearest 0.1 mg.
7.4.2 Add the assayed reference material, as described below.
7.4.2.1 Liquids -- Using a 100-µL syringe, immediately add two ormore drops of assayed reference material to the flask, then reweigh. The liquidmust fall directly into the alcohol without contacting the neck of the flask.
7.4.2.2 Gases -- To prepare standards for any compounds that boilbelow 30 EC (e.g., bromomethane, chloroethane, chloromethane, or vinyl chloride),fill a 5-mL valved gas-tight syringe with the reference standard to the 5.0 mL mark. Lower the needle to 5 mm above the methanol meniscus. Slowly introduce thereference standard above the surface of the liquid. The heavy gas will rapidlydissolve in the methanol. Standards may also be prepared by using a lecturebottle equipped with a septum. Attach polytetrafluoroethylene (PTFE) tubing to theside-arm relief valve and direct a gentle stream of gas onto the methanolmeniscus.
7.4.3 Reweigh, dilute to volume, stopper, and mix by inverting the flask severaltimes. Calculate the concentration in micrograms per microliter (µg/µL) from the net gainin weight. When compound purity is assayed to be 96% or greater, the weight may beused without correction to calculate the concentration of the stock standard. Commerciallyprepared stock standards may be used at any concentration if they are certified by themanufacturer or by an independent source.
7.4.4 Transfer the stock standard solution into a PTFE-sealed screw cap bottle. Store, with minimal headspace, at -10 EC to -20 EC and protect from light.
7.4.5 Prepare fresh gas standards every two months. Reactive compoundssuch as 2-chloroethyl vinyl ether and styrene may need to be prepared more frequently. All other standards should be replaced after six months, and must be replaced sooner ifcomparison with check standards indicates a problem.
7.5 Secondary dilution standards -- Using stock standard solutions, prepare inmethanol secondary dilution standards containing the compounds of interest, either singly ormixed together. Secondary dilution standards must be stored with minimal headspace andshould be checked frequently for signs of degradation or evaporation, especially just prior topreparing calibration standards from them.
7.6 Surrogate standards
This method incorporates surrogates that are added to each sample prior to analysis andare used to monitor and correct for matrix effects such as gas-liquid partitioning andcondensation. Additional surrogates are used to monitor the effectiveness of the surrogatecorrections. The specific surrogates used are described in the following sections. Additionalinformation is provided in the glossary. A stock solution containing all of the surrogates shouldbe prepared in methanol at the concentrations listed in Table 3 (15-150 ng/mL). Each sampleshould be spiked with 5 µL of the surrogate spiking solution prior to analysis.

8261 - 11 Revision 0February 2007
7.6.1 Gas-liquid partitioning surrogates (α-surrogates) -- The followingcompounds are recommended for use as α-surrogates:
Hexafluorobenzene 1,2-Dichloroethane-d4
Pentafluorobenzene 1,2-Dibromoethane-d4
Fluorobenzene Ethyl acetate-13C2
1,4-Difluorobenzene Acetone-d6
o-Xylene-d10 1,4-Dioxane-d8
Chlorobenzene-d5 (may also be used as a β-surrogate) Pyridine-d5
7.6.2 Condensation surrogates (boiling point or β-surrogates) -- The followingcompounds are recommended for use as β-surrogates:
Toluene-d8 1,2,4-Trichlorobenzene-d3
Chlorobenzene-d5 (may also be used as an α-surrogate) 1,2-Dichlorobenzene-d4
Bromobenzene-d5 1-Methylnaphthalene-d10
Decafluorobiphenyl
7.6.3 Additional surrogates
Additional surrogates (check surrogates) should be analyzed to monitor theeffectiveness of the matrix corrections. The recommended check surrogates are listedbelow, along with the aspects of the vacuum distillation process that they may be used toevaluate.
7.6.3.1 Benzene-d6, 1,1,2-trichloroethane-d3, and 1,2-dichloropropane-d6 are low-boiling, volatile analytes. Their recoveries representthe adequacy of the relative volatility-recovery relationship for most analytes.
7.6.3.2 Methylene chloride-d2 is similar to benzene-d6 and 1,2-dichloropropane-d6 (see Sec. 7.6.3.1), but is more sensitive to the presence ofexcessive methanol. Low recovery of this analyte may indicate a large amount ofpolar solvents in a sample.
7.6.3.3 Diethyl ether-d10 is a volatile low-boiling surrogate thatcoelutes with methanol. This compound is used to identify when the concentrationof methanol begins to affect the GC/MS determination step.
7.6.3.4 4-Bromo-1-fluorobenzene and naphthalene-d8 are higher-boiling analytes and their recoveries are an indication of the adequacy ofcorrections for their boiling-point range.
7.6.3.5 Acetophenone-d5 and nitrobenzene-d5 are higher-boiling andless volatile analytes and their recoveries are an indication of the adequacy ofmatrix corrections for the less volatile analytes.
7.6.3.6 Acetone-d6 is used to check the adequacy of the surrogatecorrections for the less volatile analytes.
7.6.3.7 Ethyl acetate-13C2 is a less volatile analyte that has beenobserved to degrade in some media and is also affected by the presence ofmethanol. Its recovery should be considered with the recovery of other surrogates.

8261 - 12 Revision 0February 2007
7.6.3.8 Pyridine-d5 is the least volatile of the surrogates and itsrecovery is an excellent indication of the limits of the method. It is very sensitive tomatrix variations and can be poorly (or excessively) recovered when all othersurrogates (and analytes) are recovered adequately.
7.7 4-Bromofluorobenzene (BFB) standard -- A solution containing 25 ng/µL of BFB inmethanol should be prepared. If a more sensitive mass spectrometer is employed to achievelower detection levels, then a more dilute BFB standard solution may be required.
7.8 Calibration standards
Calibration standards at a minimum of five concentrations should be prepared from thesecondary dilution of stock standards (see Secs. 7.4 and 7.5). Prepare these solutions inreagent water or purge-and-trap grade methanol. At least one of the calibration standardsshould correspond to a sample concentration at or below that necessary to meet the dataquality objectives of the project. The remaining standards should correspond to the range ofconcentrations found in typical samples but should not exceed the working range of the GC/MSsystem. Store for one week or less at -10 EC to -20 EC in a vial with minimal headspace.
7.8.1 It is the intent of EPA that all target analytes for a particular analysis beincluded in the calibration standard(s). These target analytes may not include the entirelist of analytes (see Sec. 1.1) for which the method has been demonstrated. However, thelaboratory must not report a quantitative result for a target analyte that was not included inthe calibration standard(s).
7.8.2 The calibration standards must also contain the surrogates chosen for theanalysis.
7.9 Great care must be taken to maintain the integrity of all standard solutions. It isrecommended that all standards be stored at -10 EC to -20 EC in screw-cap or crimp-top amberbottles equipped PTFE liners.
7.10 Liquid nitrogen -- For use in cooling the cryogenic trap (see Figure 1) and thecondenser described in Reference 9, if employed.
8.0 SAMPLE COLLECTION, PRESERVATION, AND HANDLING
8.1 See the introductory material to Chapter Four, "Organic Analytes."
8.2 Aqueous samples should be stored with minimal or no headspace to minimize theloss of highly volatile analytes.
8.3 Samples to be analyzed for volatile compounds should be stored separately fromstandards and other samples.
9.0 QUALITY CONTROL
9.1 Refer to Chapter One for guidance on additional quality assurance (QA) andquality control (QC) protocols. When inconsistencies exist between QC guidelines, method-specific QC criteria take precedence over both technique-specific criteria and those criteriagiven in Chapter One, and technique-specific QC criteria take precedence over the criteria inChapter One. Any effort involving the collection of analytical data should include development

8261 - 13 Revision 0February 2007
of a structured and systematic planning document, such as a Quality Assurance Project Plan(QAPP) or a Sampling and Analysis Plan (SAP), which translates project objectives andspecifications into directions for those that will implement the project and assess the results. Each laboratory should maintain a formal quality assurance program. The laboratory shouldalso maintain records to document the quality of the data generated. All data sheets and qualitycontrol data should be maintained for reference or inspection.
9.2 Refer to Method 8000 for specific determinative method QC procedures. Refer toMethod 3500 for QC procedures to ensure the proper operation of the various samplepreparation techniques. If an extract cleanup procedure is performed, refer to Method 3600 forthe appropriate QC procedures. Any more specific QC procedures provided in this method willsupersede those noted in Methods 8000, 3500, or 3600.
9.3 Quality control procedures necessary to evaluate the GC system operation arefound in Method 8000 and include evaluation of retention time windows and calibrationverification. In addition, discussions regarding the instrument QC requirements listed below canbe found in the referenced sections of this method:
9.3.1 The GC/MS must be tuned to meet the BFB criteria in Table 1, prior toinitial calibration and each 12-hr period during which analyses are performed, asdiscussed in Secs. 11.3 and 11.8.1, respectively.
9.3.2 The GC/MS must undergo an initial calibration, as described in Sec. 11.4.The initial calibration data must be evaluated as described in Secs. 11.5 - 11.7.
9.3.3 The GC/MS system must meet the calibration verification acceptancecriteria in Sec. 11.8.
9.4 Initial demonstration of proficiency
Each laboratory must demonstrate initial proficiency with each sample preparation anddeterminative method combination it utilizes by generating data of acceptable accuracy andprecision for target analytes in a clean matrix. If an autosampler is used to perform sampledilutions, before using the autosampler to dilute samples, the laboratory should satisfy itself thatthose dilutions are of equivalent or better accuracy than is achieved by an experienced analystperforming manual dilutions. The laboratory must also repeat the demonstration of proficiencywhenever new staff members are trained or significant changes in instrumentation are made. See Method 8000 for information on how to accomplish this demonstration.
9.5 Sample quality control for preparation and analysis
The laboratory must also have procedures for documenting the effect of the matrix onmethod performance (precision, accuracy, and detection/quantitation limit). At a minimum, thisincludes the analysis of QC samples including a method blank and a laboratory control sample(LCS) in each analytical batch and the addition of surrogates to each field sample and QCsample. Any method blanks, matrix spike samples, and replicate samples should be subjectedto the same analytical procedures (Sec. 11.0) as those used on actual samples.
9.5.1 Initially, before processing any samples, the analyst should demonstrate,that all parts of the equipment in contact with the sample and reagents are interference-free. This is accomplished through the analysis of a method blank. As a continuingcheck, each time samples are extracted, cleaned up, and analyzed, and when there is achange in reagents, a method blank should be prepared and analyzed for the compoundsof interest as a safeguard against chronic laboratory contamination. If a peak is observed

8261 - 14 Revision 0February 2007
within the retention time window of any analyte that would prevent the determination ofthat analyte, determine the source and eliminate it, if possible, before processing thesamples. The blanks should be carried through all stages of sample preparation andanalysis. When new reagents or chemicals are received, the laboratory should monitorthe preparation and/or analysis blanks associated with samples for any signs ofcontamination. It is not necessary to test every new batch of reagents or chemicals priorto sample preparation if the source shows no prior problems. However, if reagents arechanged during a preparation batch, separate blanks need to be prepared for each set ofreagents.
9.5.2 The various surrogates added to the sample are used to document theeffect of the sample matrix on the overall analysis. Therefore, the use of matrixspike/matrix spike duplicate samples is not necessary.
9.5.3 A laboratory control sample (LCS) should be included with each analyticalbatch. The LCS consists of an aliquot of a clean (control) matrix similar to the samplematrix and of the same weight or volume. When the surrogate recoveries in a sampleindicate a potential problem due to the sample matrix itself, the LCS results are used toverify that the laboratory can perform the analysis in a clean matrix. Consult Method 8000for information on developing acceptance criteria for the LCS.
9.6 Surrogate recoveries
The laboratory must evaluate surrogate recovery data from individual samples versus thesurrogate control limits developed by the laboratory. See Method 8000 for information ondeveloping and updating surrogate limits. Matrix effects and distillation performance may bemonitored separately through the use of surrogates. The effectiveness of using the α- and β-surrogates to correct matrix effects is monitored using the check surrogates identified in Sec.7.6.3.
9.7 The experience of the analyst performing GC/MS analyses is invaluable to thesuccess of the methods. Each day that analysis is performed, the calibration verificationstandard should be evaluated to determine if the chromatographic system is operating properly. Questions that should be asked are: Do the peaks look normal? Is the response obtainedcomparable to the response from previous calibrations? Careful examination of the standardchromatogram can indicate whether the column is still performing acceptably, the injector isleaking, the injector septum needs replacing, etc. If any changes are made to the system (e.g.,the column changed), recalibration of the system must take place.
9.8 It is recommended that the laboratory adopt additional quality assurance practicesfor use with this method. The specific practices that are most productive depend upon theneeds of the laboratory and the nature of the samples. Whenever possible, the laboratoryshould analyze standard reference materials and participate in relevant performance evaluationstudies.
10.0 CALIBRATION AND STANDARDIZATION
See Sec 11.4 for information on calibration and standardization.

8261 - 15 Revision 0February 2007
11.0 PROCEDURE
11.1 Sample preparation
Other sample volumes or weights may be employed, provided that the sensitivity of themethod is adequate for project needs. Given the inherent recovery correction, changes insample size do not necessitate recalibration of the instrument.
11.1.1 Aqueous samples
Quickly transfer a 5-mL aliquot of the sample to the distillation flask, taking care notto introduce air bubbles or agitate the sample during the transfer. Add 10 µL of thesurrogate spiking solution to the sample in the flask, and attach the flask to the vacuumdistillation apparatus.
11.1.2 Solid and soil samples
In order to minimize potential target analyte losses, an approximately 5-g aliquot ofsample should be extruded with minimal exposure to the air directly from a suitablesample collection device into the tared sample chamber and immediately capped in orderto attain the sample weight. Once the sample chamber is weighed, quickly remove thecap and add 10 µL of the surrogate spiking solution to the sample in the flask, and attachthe flask to the vacuum distillation apparatus. Refer to Method 5035 for more informationon sample collection and handling procedures for volatile organic compounds.
NOTE: The tared sample chamber or flask weight must also include the cap device. Thesample weight can then be obtained by subtracting the tared flask plus capweight from the flask and cap plus sample weight.
11.1.2.1 Determination of percent dry weight -- When sample resultsare to be calculated on a dry weight basis, e.g., for fish tissue, a second aliquot ofsample (5 - 10 g) must be collected.
WARNING: The drying oven should be contained in a hood or be vented. Significant laboratory contamination may result from drying a heavilycontaminated sample.
Dry this aliquot overnight at 105E C. Allow to cool in a desiccator beforeweighing. Calculate the % dry weight as described in Sec. 11.11.6.
11.1.2.2 If necessary, at least one additional aliquot of sample must becollected for high concentration analysis.
11.1.3 Tissue samples
Tissue samples which are fleshy may have to be minced into small pieces to getthem through the neck of the sample chamber. This is best accomplished by freezing thesample in liquid nitrogen before any additional processing takes place. Biota containingleaves and other softer samples may be minced using clean scissors. Weigh out a 5-galiquot and then rapidly transfer it to the sample chamber. Add 10 µL of the surrogatespiking solution to the sample in the flask, and attach the flask to the vacuum distillationapparatus.

8261 - 16 Revision 0February 2007
11.1.4 Oil samples
Weigh out 0.2 to 1.0 g of oil, and then rapidly transfer it to the sample chamber. Add 10 µL of the surrogate spiking solution to the sample in the flask, and attach the flaskto the vacuum distillation apparatus.
11.2 Establish both the vacuum distillation and the GC/MS operating conditions, usingthe following information as guidance. Optimize the conditions for selectivity and sensitivity. Once established, the same operating conditions must be used for all analyses, includingcalibrations, blanks, and samples.
11.2.1 Recommended vacuum distillation operating conditions:
Condenser1: -5 EC to + 5 ECCondenser bakeout: 95 ECCryotrap: <-150 ECCryotrap desorb1: 100 EC to 150 ECCryotrap bakeout: 200 ECMultiport valve: 150 EC to 200 ECTransfer to GC line: 150 EC to 200 ECSystem and autosampler lines: 95 ECVacuum distillation time: 7.5 min.Transfer time 1: 3 min. to 6 min.nitrogen flush condenser of water: 7 min.System flush cycles: 16 Nitrogen inlet time: 0.05 to 0.1 min. Evacuation time: 1.2 min.Log sampling2: per 15 sec.
1 Set parameter or optimize as per vendor instructions. 2 An electronic log file of all system readings should be saved as per vendor instructions.
11.2.2 Recommended GC/MS operating conditions:
Electron energy: 70 volts (nominal)Mass range: 38 - 270 amuScan time: To give 8 scans/peak but not to exceed 3
sec/scanJet separator temperature: 210 ECTransfer line temperature: 280 ECInjector inlet temperature: 240 ECInlet pressure: 10 psiInitial column temperature: 10 ECInitial hold time: 3.0 minTemperature Program #1: 50 EC/min to 40 ECTemperature Program #2: 5 EC/min to 120 ECTemperature Program #3: 20 EC/min to 220 ECFinal column temperature: 220 ECFinal hold time: 3.4 min
11.3 Prior to the initial calibration, the GC/MS system must be hardware-tuned to meetthe criteria in Table 1 for a 5-50 ng injection of 4-bromofluorobenzene (2-µL injection of the BFBstandard). Analyses must not begin until these criteria are met.

8261 - 17 Revision 0February 2007
11.4 Initial calibration
As with techniques such as purge-and-trap GC/MS, the initial calibration involves carryingthe calibration standards through the entire distillation and analysis procedure.
11.4.1 Add 5 mL of reagent water to the sample flask and spike the water withthe appropriate standards and surrogates, and reconnect the flask to the apparatus.
11.4.2 Perform the vacuum distillation and introduce the distillate into theGC/MS, as described in Sec. 11.10.
11.4.3 Repeat the procedure for the remaining calibration standards.
11.4.4 Calculate a calibration factor (CF) for each target analyte and surrogate ineach of the five initial calibration standards as described in Sec. 11.11, using externalstandard calibration techniques (see Method 8000).
11.5 System performance check compounds (SPCCs)
A system performance check should be made before the initial calibration data are used. The surrogates chlorobenzene-d5, 1,2-dichlorobenzene-d4, and tetrahydrofuran-d8 are used asreference compounds against which other analytes (the system performance check compoundsor SPCCs) are evaluated as relative responses. This provides assurance that the system issufficiently sensitive to determine the analytes presented in Table 2. The relative response(RR) for each SPCC in the calibration standards is calculated as described in Sec. 11.11.2.
There are four classes of compounds that are determined using this method. Class Icompounds include those compounds with boiling points generally below 160 EC and α-values(or K-values) below 50 (i.e., the permanent gases and volatiles). Class II compounds are thosewith boiling points greater than 160 EC (i.e., the neutral semivolatiles). Class III compounds arethose with α-values greater than 50 (i.e., the water soluble volatiles). Class IV compounds arethe basic compounds that are susceptible to degradation and have a low detector response(i.e., the basic semivolatiles).
11.5.1 Class I compounds are monitored using four compounds (the systemperformance check compounds, or SPCCs for Class I) that are checked for a minimumaverage response relative to chlorobenzene-d5. These compounds are chloromethane,1,1-dichloroethane, bromoform, and 1,1,2,2-tetrachloroethane. These compounds areused to check compound instability and to check for degradation caused by contaminatedlines or active sites in the system. Example problems include:
11.5.1.1 Chloromethane is an analyte likely to be lost if the cryotrap isnot properly cooled or if there is a significant air leak in the system.
11.5.1.2 Bromoform is a compound that can be poorly recovered if thesystem is under a required vacuum or there are significant cold spots.
11.5.1.3 1,1,2,2-Tetrachloroethane and 1,1-dichloroethane may bedegraded in the apparatus or by system contamination.

8261 - 18 Revision 0February 2007
11.5.1.4 The minimum mean relative responses for the various Class ISPCCs are as follows:
Chloromethane 0.051,1-Dichloroethane 0.10Bromoform 0.101,1,2,2-Tetrachloroethane 0.30
11.5.2 Class II compounds are monitored using two compounds (SPCCs forClass II) that are checked for a minimum average response relative to 1,2-dichlorobenzene-d4. These compounds are hexachlorobutadiene, and 2-methyl-naphthalene.
11.5.2.1 Hexachlorobutadiene is likely to be lost if there is a cold spotor degradation due to system contamination.
11.5.2.2 2-Methyl naphthalene is very sensitive to cold spots andcontamination.
11.5.2.3 The minimum mean relative responses for the Class II SPCCsare as follows:
Hexachlorobutadiene 0.302-Methylnaphthalene 0.30
11.5.3 Class III compounds are monitored using two compounds (SPCCs forClass III) that are checked for a minimum average response to tetrahydrofuran-d8. Thesecompounds are 1,4-dioxane and pyridine.
11.5.3.1 1,4-Dioxane can be lost due to a poor system vacuum. Thecompound may also have a low response due to poor chromatography.
11.5.3.2 Pyridine can be lost due to poor system vacuum and systemcontamination. Too much water in the cryoloop will also depress the relativeresponse.
11.5.3.3 The minimum mean relative responses for the Class III SPCCsare as follows:
1,4-Dioxane 0.10Pyridine 0.10
11.5.4 Class IV compounds are monitored using two compounds (SPCCs forClass IV) and are checked for a minimum average response relative to tetrahydrofuran-d8. These compounds are aniline, N-nitrosodimethylamine and N-nitrosodiethylamine.
11.5.4.1 Each of the SPCCs for Class IV is easily lost if there is a poorvacuum, system contamination, or active sites. The SPCC compounds may alsohave low responses due to poor chromatography.

8261 - 19 Revision 0February 2007
11.5.4.2 The minimum mean relative responses for the Class III SPCCsare as follows:
Aniline 0.010N-Nitrosodimethylamine 0.005N-Nitrosodiethylamine 0.010
11.6 The calibration check compound (CCC) data must be evaluated before the initialcalibration data are employed. As with the SPCC criteria, the CCC criteria are based on fourclasses of compounds (I, II, III, and IV). The CCCs are evaluated on the basis of the relativestandard deviation (RSD) of the calibration factors of each compound determined by an externalstandard calibration procedure. Calculate the standard deviation and relative standarddeviation (RSD) of the calibration factors for each compound in the initial calibration, asdescribed in Sec. 11.11.4.
11.6.1 The CCCs for the Class I compounds are:
Vinyl chlorideChloroformTolueneEthylbenzene1,2-DichloroethaneBromobenzene
In practice, the calculated RSD for each Class I CCC should be #20%, and it mustbe #35%.
11.6.2 The CCCs for the Class II compounds are:
1,3-Dichlorobenzene1,2,3-TrichlorobenzeneNaphthalene
In practice, the calculated RSD for each Class II CCC should be #25 % and it mustbe #35%.
11.6.3 The CCCs for the Class III compounds are:
4-Methyl-2 pentanoneMethacrylonitrile1,4-Dioxane
In practice, the calculated RSD for each Class III CCC should be #20% and it mustbe #35%.
11.6.4 The CCCs for the Class IV compounds are:
N-NitrosomethylethylamineN-Nitrosodi-n-propylamine
In practice, the calculated RSD for each Class IV CCC should be #35% and it mustbe #45%. These compounds may be better addressed using by using a quadraticcalibration curve.

8261 - 20 Revision 0February 2007
11.6.5 If any CCC fails the criteria listed in Secs. 11.6.1 - 11.6.4, then correctiveaction to eliminate a system leak and/or column reactive sites is necessary beforereattempting calibration.
11.7 Initial calibration linearity
11.7.1 If the RSD of the calibration factors for any compound is 20% or less,then the instrument response is assumed to be constant over the calibration range, andthe average calibration factor may be used for quantitation (Secs. 11.11.3 and 11.11.8.5).
11.7.2 If the RSD of the calibration factors for any compound is greater than20%, see Method 8000 for options on dealing with non-linear calibrations. One of theoptions must be applied to GC/MS calibration in this situation, or a new initial calibrationmust be performed.
11.7.3 When the RSD exceeds 20%, the plotting and visual inspection of acalibration curve can be a useful diagnostic tool. The inspection may indicate analyticalproblems, including errors in standard preparation, the presence of active sites in thechromatographic system, analytes that exhibit poor chromatographic behavior, etc.
NOTE: The RSD is used as a measure of linearity of each compound's responseirrespective of the CCC criteria in Sec. 11.6. If the CCC criteria are met, thenthe results from the initial calibration may be used to calculate subsequentsample results. However, the calculations for each analyte must take intoaccount the linearity of the calibration factors for that analyte in determiningwhich of the calibration approaches described in Method 8000 are to beemployed.
11.8 Calibration verification
The initial calibration must be verified at the beginning of each 12-hr analytical shift duringwhich samples are to be analyzed. The verification involves the analysis of the mid-concentration standard from the initial calibration, using the procedures described in Secs.11.4.1 through 11.4.5.
11.8.1 Prior to the analysis of standards, blanks or samples, inject or introduce5-50 ng of the 4-bromofluorobenzene standard into the GC/MS system using the sameintroduction method as is used for samples. The resultant mass spectra for the BFB mustmeet the criteria given in Table 1 before sample analysis begins. These criteria must bedemonstrated each 12-hr shift during which samples are analyzed.
11.8.2 The initial calibration curve (Sec.11.4) for each compound of interest mustbe verified once every 12 hrs during analysis, using the introduction technique used forsamples. This is accomplished by analyzing a calibration standard that is at aconcentration either near the midpoint concentration for the working range of the GC/MSor near the action level for the project, and by checking the SPCCs and CCCs, asdescribed in Secs. 11.8.3 and 11.8.4.
NOTE: A method blank should be analyzed prior to the calibration standard to ensurethat the total system (introduction device, transfer lines, and GC/MS system) isfree of contaminants.
11.8.2.1 For each analyte in the calibration verification standard,calculate the calibration factor, as described in Sec. 11.11.1. Calculate the relative
8261 - 21 Revision 0February 2007
response for each SPCC in the calibration verification standard, as described inSec. 11.11.2.
11.8.2.2 Evaluate the SPCCs and CCCs as described in Secs. 11.8.3and 11.8.4. The analysis of samples should not proceed until the calibration hasbeen verified.
11.8.3 System performance check compounds (SPCCs)
A system performance check must be made during every 12-hr analytical shift. Each SPCC compound in the calibration verification standard must meet its minimumresponse factor (see Secs. 11.5.1 - 11.5.4). This is the same check that is applied duringthe initial calibration. If the minimum response factors are not met, the system must beevaluated, and corrective action must be taken before sample analysis begins. Possibleproblems include standard mixture degradation, injection port inlet contamination,contamination at the front end of the analytical column, and active sites in the column orchromatographic system. This check must be met before sample analysis begins.
11.8.4 Calibration check compounds (CCCs)
11.8.4.1 After the system performance check is met, the CCCs listedin Secs. 11.6.1 - 11.6.4 are used to check the validity of the initial calibration. Calculate the percent difference as described in Sec. 11.11.5.
11.8.4.2 If the percent difference for each CCC is #35% for the Class Iand Class II CCCs, #40% for the Class III CCCs, and #45% for the Class IV CCCs,then the initial calibration is assumed to be valid, and analyses may continue. Ifthe criteria are not met for any one CCC, then corrective action must be taken priorto the analysis of samples.
11.8.4.3 Problems similar to those listed under SPCCs could affect theCCCs. If the problem cannot be corrected by other measures, a new five-pointinitial calibration must be generated. The CCC criteria must be met before sampleanalysis begins.
11.9 The responses of the surrogates and their retention times must be evaluatedimmediately after or during data acquisition. If the retention time for any surrogate changes bymore than 30 seconds from the last calibration verification (12 hrs), the chromatographic systemmust be inspected for malfunctions and corrections must be made, as required. If the EICParea for any of the surrogates changes by a factor of two (-50% to +l00%) from the previouscalibration verification standard, the mass spectrometer must be inspected for malfunctions andcorrections must be made, as appropriate. When corrections are made, reanalysis of samplesanalyzed while the system was malfunctioning is necessary.
11.10 Analysis
11.10.1 The vacuum distiller should be operated as specified by vendor. Be surethat all connections are complete and sealed properly.
NOTE: IF PIRANI GAUGES ARE USED, after 5 mins of distillation, the Pirani gauge atthe vacuum pump should indicate # 0.3 torr. If this pressure is not attained, aleak may be present and the distillation may not be successful. Distillationperformance surrogates should be evaluated for acceptability of distillation.
8261 - 22 Revision 0February 2007
Calibration factor 'Peak Area (or Height) of the Compound in the Standard
Amount of the Compound Injected (in nanograms)
11.10.2 Set up the data system for acquisition of the data file. This may be doneprior to 11.10.1. While distillation times may vary depending on sample matrix, the datasystem should be ready and the GC oven should be at equilibrium by the time thedistillation is complete.
11.10.3 GC/MS analyses may be performed once the distillation is complete. Transfer distillate to GC/MS and commence GC/MS data acquisition.
11.10.4 Once acquisition has begun, the sample chamber valve may be closedand the sample flask removed.
11.11 Data analysis and calculations
The quantitation routine employed in this method differs significantly from that used inMethod 8260 (using the Method 5032 sample preparation). Where Method 8260 uses oneinternal standard to correct injection/preparation variations for a given analyte, this method usesa series of surrogates to define the relationships of compound recoveries to their physicalproperties. Those relationships are used to extrapolate target analyte recoveries. Each targetanalyte and surrogate is calibrated using an external standard calibration procedure. Theconcentration of the analyte in the sample is determined using the predicted analyte recovery,sample size, and amount of analyte detected by the mass spectrometer. The relationships aresolved using multiple surrogates and the errors associated with these relationships can becalculated and can be used as indicators of data accuracy for the analyses. The quantitationlimits for those analytes that are not detected are also corrected to reflect matrix effects.
The quantitation algorithms and sequence presented here are available from the EPA athttp://www.epa.gov/nerlesd1/chemistry/vacuum/default.htm. The quantitation routine presentedis a stepwise procedure that initially estimates the α-effects on the β-surrogates, calculates theboiling point effects, and then calculates the relative volatility effects. After the analyterecoveries are calculated, the amount of analyte detected by the mass spectrometer iscorrected by the recovery and sample size to provide the analyte concentration. Table 3 liststhe α- and β-surrogates. Additional surrogates can be used to improve the solution of the matrixeffects-recovery relationship.
Other surrogate correction approaches may be employed when they have beendemonstrated to improve the assessment of matrix effects. Large samples of biota (10 g ormore) may require that the analyst address the partitioning of analytes between air and theorganic phase. Such an approach is described in References 8 and 9.
11.11.1 Calculation of calibration factors
The response of the mass spectrometer to a given concentration of a surrogate ortarget analyte is used to calculate a calibration factor (CF) in a fashion analogous to theexternal calibration procedures used in GC methods.
The following equation is used to calculate the calibration factor for each targetanalyte and surrogate.

8261 - 23 Revision 0February 2007
Relative response 'CF of SPCC
CF of the surrogate compound
mean RR '
jn
i'1RRi
n
mean CF '
jn
i'1CFi
n
SD '
jn
i'1(CFi&CF)2
n&1RSD '
SDCF
× 100
11.11.2 Calculation of relative response for SPCCs
The relative response (RR) is simply the ratio of the response of an SPCC to theresponse of the surrogate compound used as a reference (see Table 3), calculated asshown below:
11.11.3 Calculate the mean RR for each SPCC using the five RR values from theinitial (5-point) calibration curve in Sec. 11.11.2, as follows:
Calculate the mean calibration factor for each target analyte (including theSPCCs), as follows:
11.11.4 Calculate the standard deviation (SD) and relative standard deviation(RSD) of the calibration factors for each compound from the initial calibration, as follows:

8261 - 24 Revision 0February 2007
% Difference 'CF & CFv
CF× 100
% dry weight 'g of dry sample
g of sample× 100
where:
CFi = CF for each of the calibration standardsC&F& = Mean CF for each compound from the initial calibrationn = Number of calibration standards, e.g., 5
11.11.5 Calculate the percent difference (%D) of the calibration factor determinedduring the calibration verification and the mean calibration factor from the most recentinitial calibration, using the equation below:
where:
C&F& = Mean CF from the initial calibrationCFv = CF from the calibration verification standard
11.11.6 Where appropriate, calculate the percent dry weight of a solid sampleusing the equation below and the weights determined in Sec. 11.1.2.
11.11.7 Qualitative analysis
The qualitative identification of compounds determined by this method is based onretention time, and on comparison of the sample mass spectrum, after backgroundcorrection, with characteristic ions in a reference mass spectrum. The reference massspectrum must be generated by the laboratory using the conditions of this method. Thecharacteristic ions from the reference mass spectrum are defined to be the three ions ofgreatest relative intensity, or any ions over 30% relative intensity if less than three suchions occur in the reference spectrum. Compounds are identified as present when thefollowing criteria are met.
11.11.7.1 The intensities of the characteristic ions of a compoundmaximize in the same scan or within one scan of each other. Selection of a peakby a data system target compound search routine, where the search is based onthe presence of a target chromatographic peak containing ions specific for thetarget compound at a compound-specific retention time, will be accepted asmeeting this criterion.

8261 - 25 Revision 0February 2007
11.11.7.2 The retention time (RT) of the sample component is within±30 seconds of the RT of the standard component.
11.11.7.3 The relative intensities of the characteristic ions agree within
30% of the relative intensities of these ions in the reference spectrum. (Example: For an ion with an abundance of 50% in the reference spectrum, the correspondingabundance in a sample spectrum can range between 20% and 80%.)
11.11.7.4 Structural isomers that produce very similar mass spectrashould be identified as individual isomers if they have sufficiently different GCretention times. Sufficient GC resolution is achieved if the height of the valleybetween two isomer peaks is less than 25% of the sum of the two peak heights. Otherwise, structural isomers are identified as isomeric pairs.
11.11.7.5 Identification is hampered when sample components are notresolved chromatographically and produce mass spectra containing ionscontributed by more than one analyte. When gas chromatographic peaksobviously represent more than one sample component (i.e., a broadened peak withshoulder(s) or a valley between two or more maxima), appropriate selection ofanalyte spectra and background spectra is important.
11.11.7.6 Examination of extracted ion current profiles of appropriateions can aid in the selection of spectra, and in qualitative identification ofcompounds. When analytes coelute (i.e., only one chromatographic peak isapparent), the identification criteria may be met, but each analyte spectrum willcontain extraneous ions contributed by the coeluting compound.
11.11.7.7 For samples containing components not associated with thecalibration standards, a library search may be made for the purpose of tentativeidentification. The necessity to perform this type of identification will be determinedby the purpose of the analyses being conducted. Data system library searchroutines should not use normalization routines that would misrepresent the libraryor unknown spectra when compared to each other.
For example, the RCRA permit or waste delisting requirements mayrequire the reporting of non-target analytes. Only after visual comparison ofsample spectra with the nearest library searches may the analyst assign a tentativeidentification. Use the following guidelines for making tentative identifications:
(1) Relative intensities of major ions in the reference spectrum (ions greater than10% of the most abundant ion) should be present in the sample spectrum.
(2) The relative intensities of the major ions should agree within ±20%. (Example: For an ion with an abundance of 50% in the standard spectrum, thecorresponding sample ion abundance must be between 30 and 70%).
(3) Molecular ions present in the reference spectrum should be present in thesample spectrum.
(4) Ions present in the sample spectrum but not in the reference spectrum shouldbe reviewed for possible background contamination or presence of coelutingcompounds.

8261 - 26 Revision 0February 2007
ln(Rα) ' e (c1 × αk) % c2
Rβ ' (c3 × [bp & bp0]) % c4
(5) Ions present in the reference spectrum but not in the sample spectrum shouldbe reviewed for possible subtraction from the sample spectrum because ofbackground contamination or coeluting peaks. Data system library reductionprograms can sometimes create these discrepancies.
11.11.8 Quantitative analysis
Quantitation of target analytes requires four distinct steps: calculation of the α-effects on the β-surrogates, calculations of the boiling point effects, calculation of therelative volatility effects on recovery, and finally, recovery correction of the quantity ofanalyte measured by the mass spectrometer to reflect these three effects. An explanationof these effects and the use of the following equations are given in greater detail inReferences 5 and 6.
11.11.8.1 Calculation of α-effects on the β-surrogates
The initial approximation of the α-effect on the β-surrogates isaccomplished by using the α-surrogates, fluorobenzene and 1,2-dichloroethane-d4(boiling points of 85 EC and 84 EC, respectively), with the assumption that β-effectsare minimal at 85 EC. The equation used is:
where:
Rα = The surrogate's relative recovery corresponding to its αK-valueαK = Relative volatility of the surrogate (describes the α-effect versus
recovery relationship). c1, c2 = Empirically-derived constants
The relative recoveries of the β-surrogates (toluene-d8, chlorobenzene-d5,bromobenzene-d5 and 1,2-dichlorobenzene-d4) are adjusted for their α-effects (Rβ= measured recovery/Rα). The resulting relative recovery represents thecomponent of the relative recovery related to β-effects. Similarly, the α-surrogates(1,2-dichloroethane-d4 and 1,4-dioxane-d8) are used to interpolate Rβ for the β-surrogate 1-methylnaphthalene-d10.
11.11.8.2 Calculation of boiling point effects
Using the β-surrogate Rβ values, the Rβ-boiling point relationship isdescribed using the equation:
where:
Rβ= The β-surrogate's relative recovery corresponding to the boiling point
8261 - 27 Revision 0February 2007
ln(Rα) ' e (c1 × αx) % c2
RT ' Rα × Rβ
bp = The analyte's boiling pointbp0 = The lowest boiling point of the β-surrogate used in the solutionc3, c4 = Empirically-derived constants
The impact of a single β-surrogate relative-recovery measurement error isminimized by calculating three solutions to the equation above for each analyte. The β-surrogate pairs used to solve this equation for groups of analytes by boilingpoint are identified in Table 5. The average and standard deviation of the three Rβvalues (only two solutions for the 80 EC to 111 EC and 220 EC to 250 EC ranges)generates the predicted analyte relative recovery range, R&β ± rβ, corresponding toβ-effects. The resultant R&β for each α-surrogate is used to correct their measuredrelative responses (Rα = measured recovery/R&β) to isolate the relative recoveriesrelated to α-effects.
11.11.8.3 Calculation of the relative volatility effects on recovery
The α-surrogate corrections are performed by grouping analytes withsimilar αK-values. The α-effects exhibited by those compounds at the limits of agroup are the best data to describe the α-effects for those analytes within thesegroups and therefore pairs of α-surrogates are selected to represent the extremesof each group's range of αK-values (i.e., the surrogates hexafluorobenzene andfluorobenzene represent the lower and upper ends of the grouping of α-valuesbetween 0.07 and 3).
One lower-value α-surrogate and one higher-value α-surrogate areselected to calculate the relationship of relative recovery to αK-values within thegroup. Using the four possible combinations of surrogates to solve the equation in11.11.8.1, each analyte will have four α-effect measurements. The equation usedis:
where:
Rα = The surrogate's relative recovery corresponding to its αK-valueαx = Relative volatility of compound X (describes the α-effect versus
recovery relationship). c1, c2 = Empirically-derived constants
11.11.8.4 The predicted relative recovery relating to α-effects for ananalyte is R&α ± rα. The predicted total relative recovery that includes α- and β-effects is:
where:

8261 - 28 Revision 0February 2007
rT2 ' rα
2 % rβ2
Amount (ng) '(As)(D)
(CF)
Concentration '(ng analyte detected)RT × (sample size)
R&α = Average relative recovery using the equation in 11.11.8.3.R&β = Average relative recovery using the equation in 11.11.8.2 for the
combinations of β-surrogates in the analytes boiling point grouping.RT = Predicted total relative recovery
The associated variance term is:
where the r values are the standard deviations of the corresponding relativerecoveries.
11.11.8.5 Calculation of sample concentration
The calculation of the concentration in a sample is a three-step process.
11.11.8.5.1 The amount (mass in ng) of the analyte detectedby the mass spectrometer is calculated using an external standardapproach, such that:
where:
As = Area (or height) of the peak for the analyte in the sample.D = Dilution factor, if the sample or extract was diluted prior to
analysis. If no dilution was made, D = 1. The dilution factor isalways dimensionless.
C&F& = Mean calibration factor from the initial calibration (area per ng).
11.11.8.5.2 The relative recovery (RT) is predicted from theequations in Secs. 11.11.8.1 - 11.11.8.4.
11.11.8.5.3 The third step is to perform the recoverycorrection on the amount of analyte detected and to relate that amount tothe size of the actual sample, as described below:

8261 - 29 Revision 0February 2007
Recovery '(ng check surrogate detected)
RT × (ng of check surrogate spiked)
For aqueous samples, the sample size is expressed in mL, leading to aconcentration in ng/mL, which is equivalent to µg/L. For solid samples, oilsamples, and tissues, the sample size is expressed in g, leading to aconcentration in ng/g, which is equivalent to µg/kg.
Using the variance term in Sec. 11.11.8.4, a concentration range can becalculated for each analyte.
11.11.9 Calculation of check surrogate recovery
The check surrogates are used to monitor the overall performance of the analyticalsystem. The recovery of each check surrogate is calculated in a fashion similar to theanalyte concentrations, correcting the mass spectrometer response for the recoveries ofthe other surrogates and the sample size, such that:
11.11.10 Reporting matrix corrections
A graphical representation of the effect of the sample matrix on the recovery of theanalytes may prove useful in evaluating method performance. Although not required,Figure 2 provides an example of one form of such documentation.
12.0 DATA ANALYSIS AND CALCULATIONS
See Sec. 11.11 for information on data analysis and calculations.
13.0 METHOD PERFORMANCE
13.1 Performance data and related information are provided in SW-846 methods only asexamples and guidance. The data do not represent required performance criteria for users ofthe methods. Instead, performance criteria should be developed on a project-specific basis,and the laboratory should establish in-house QC performance criteria for the application of thismethod. These performance data are not intended to be and must not be used as absolute QCacceptance criteria for purposes of laboratory accreditation.
13.2 The recovery of the target analytes spiked into three soils is summarized in Table6, along with the relative error of replicate recovery measurements and the precision of thesurrogate recoveries in these spiked samples. These data are provided for guidance purposesonly.
13.3 Recovery data from an oil sample spiked with the target analytes are presented inTable 7. These data are provided for guidance purposes only.
13.4 Target analytes were spiked into water containing salt, soap, and glycerine, as atest of the effects of ionic strength, surfactants, etc., on the VD/GC/MS procedure. The

8261 - 30 Revision 0February 2007
recovery data from these analyses are provided in Table 8. These data are provided forguidance purposes only.
14.0 POLLUTION PREVENTION
14.1 Pollution prevention encompasses any technique that reduces or eliminates thequantity and/or toxicity of waste at the point of generation. Numerous opportunities for pollutionprevention exist in laboratory operations. The EPA has established a preferred hierarchy ofenvironmental management techniques that places pollution prevention as the managementoption of first choice. Whenever feasible, laboratory personnel should use pollution preventiontechniques to address their waste generation. When wastes cannot be feasibly reduced at thesource, the Agency recommends recycling as the next best option.
14.2 For information about pollution prevention that may be applicable to laboratoriesand research institutions consult Less is Better: Laboratory Chemical Management for WasteReduction available from the American Chemical Society's Department of GovernmentRelations and Science Policy, 1155 16th St., N.W. Washington, D.C. 20036, http://www.acs.org.
14.3 Standards should be prepared in volumes consistent with laboratory use tominimize the volume of expired standards that will require disposal.
15.0 WASTE MANAGEMENT
The Environmental Protection Agency requires that laboratory waste managementpractices be conducted consistent with all applicable rules and regulations. The Agency urgeslaboratories to protect the air, water, and land by minimizing and controlling all releases fromhoods and bench operations, complying with the letter and spirit of any sewer discharge permitsand regulations, and by complying with all solid and hazardous waste regulations, particularlythe hazardous waste identification rules and land disposal restrictions. For further informationon waste management, consult The Waste Management Manual for Laboratory Personnelavailable from the American Chemical Society at the address listed in Sec. 14.2.
16.0 REFERENCES
1. M. H. Hiatt, "Analysis of Fish and Sediment For Volatile Priority Pollutants," AnalyticalChemistry 1981, 53 (9), 1541.
2. M. H. Hiatt, "Determination of Volatile Organic Compounds in Fish Samples by VacuumDistillation and Fused Silica Capillary Gas Chromatography/Mass Spectrometry,"Analytical Chemistry, 1983, 55 (3), 506.
3. United States Patent 5,411,707, May 2, 1995. "Vacuum Extractor with CryogenicConcentration and Capillary Interface," assigned to the United States of America, asrepresented by the Administrator of the Environmental Protection Agency. Washington,DC.
4. Michael H. Hiatt, David R. Youngman and Joseph R. Donnelly, "Separation and Isolationof Volatile Organic Compounds Using Vacuum Distillation with GC/MS Determination,"Analytical Chemistry, 1994, 66 (6), 905.

8261 - 31 Revision 0February 2007
5. Michael H. Hiatt and Carole M. Farr, "Volatile Organic Compound Determination UsingSurrogate-Based Correction for Method and Matrix Effects," Analytical Chemistry, 1995,67 (2), 426.
6. Michael H. Hiatt, "Vacuum Distillation Coupled with Gas Chromatography/MassSpectrometry for the Analyses of Environmental Samples," Analytical Chemistry, 1996,67(22), 4044-4052.
7. "The Waste Management Manual for Laboratory Personnel," American Chemical Society,Department of Government Regulations and Science Policy, Washington, DC.
8. Michael H. Hiatt, "Analyses of Fish Tissue by Vacuum Distillation/GasChromatography/Mass Spectrometry," Analytical Chemistry, 1997, 69(6), 1127-1134.
9. Michael H. Hiatt, "Bioconcentration Factors for Volatile Organic Compounds inVegetation," Analytical Chemistry, 1998, 70(5), 851-856.
17.0 TABLES, DIAGRAMS, FLOWCHARTS, AND VALIDATION DATA
The following pages contain the tables and figures referenced by this method.

8261 - 32 Revision 0February 2007
TABLE 1
BFB (4-BROMOFLUOROBENZENE) MASS INTENSITY CRITERIAa
m/z Required Intensity (relative abundance)
50 15 to 40% of m/z 95
75 30 to 60% of m/z 95
95 Base peak, 100% relative abundance
96 5 to 9% of m/z 95
173 Less than 2% of m/z 174
174 Greater than 50% of m/z 95
175 5 to 9% of m/z 174
176 Greater than 95% but less than 101% of m/z 174
177 5 to 9% of m/z 176
aAlternative tuning criteria may be used, (e.g. CLP, Method 524.2, or manufacturer'sinstructions), provided that method performance is not adversely affected.
8261 - 33 Revision 0February 2007
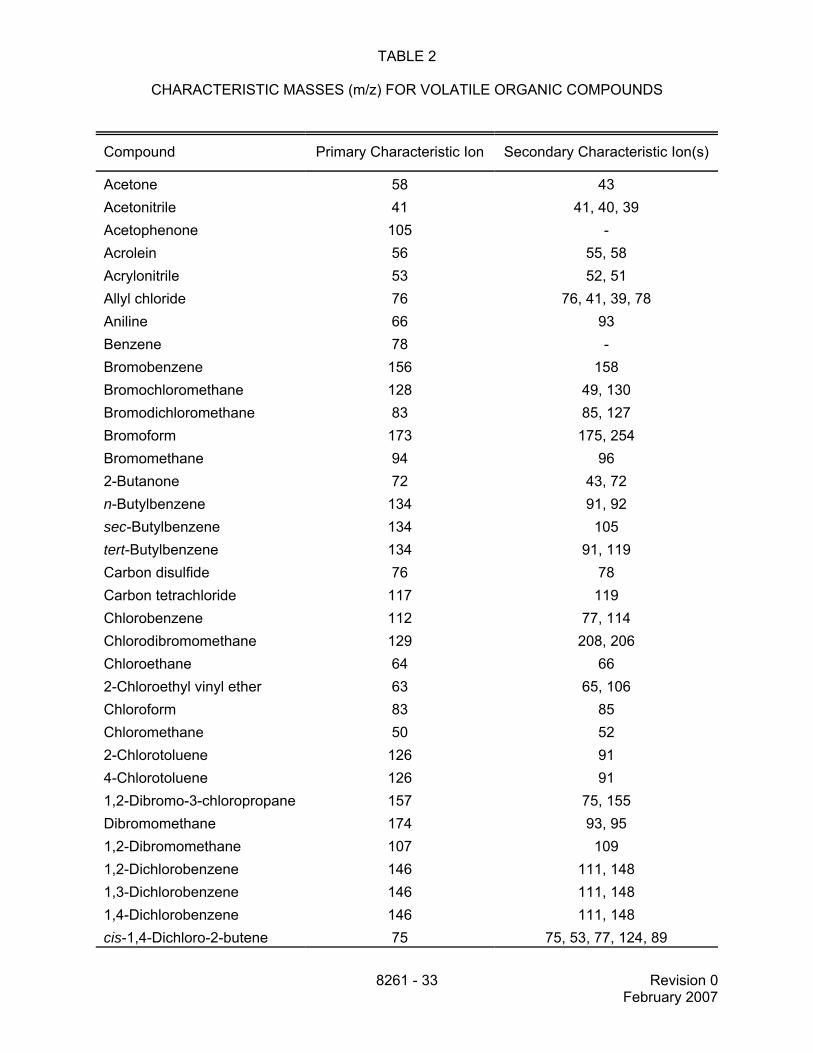
TABLE 2
CHARACTERISTIC MASSES (m/z) FOR VOLATILE ORGANIC COMPOUNDS
Compound Primary Characteristic Ion Secondary Characteristic Ion(s)
Acetone 58 43Acetonitrile 41 41, 40, 39Acetophenone 105 -Acrolein 56 55, 58Acrylonitrile 53 52, 51Allyl chloride 76 76, 41, 39, 78Aniline 66 93Benzene 78 -Bromobenzene 156 158Bromochloromethane 128 49, 130Bromodichloromethane 83 85, 127Bromoform 173 175, 254Bromomethane 94 962-Butanone 72 43, 72n-Butylbenzene 134 91, 92sec-Butylbenzene 134 105tert-Butylbenzene 134 91, 119Carbon disulfide 76 78Carbon tetrachloride 117 119Chlorobenzene 112 77, 114Chlorodibromomethane 129 208, 206Chloroethane 64 662-Chloroethyl vinyl ether 63 65, 106Chloroform 83 85Chloromethane 50 522-Chlorotoluene 126 914-Chlorotoluene 126 911,2-Dibromo-3-chloropropane 157 75, 155Dibromomethane 174 93, 951,2-Dibromomethane 107 1091,2-Dichlorobenzene 146 111, 1481,3-Dichlorobenzene 146 111, 1481,4-Dichlorobenzene 146 111, 148cis-1,4-Dichloro-2-butene 75 75, 53, 77, 124, 89

TABLE 2(continued)
Compound Primary Characteristic Ion Secondary Characteristic Ion(s)
8261 - 34 Revision 0February 2007
trans-1,4-Dichloro-2-butene 53 88, 75Dichlorodifluoromethane 85 871,1-Dichloroethane 63 65, 831,2-Dichloroethane 62 981,1-Dichloroethene 96 61, 63cis-1,2-Dichloroethene 96 61, 98trans-1,2-Dichloroethene 96 61, 981,2-Dichloropropane 63 1121,3-Dichloropropane 76 782,2-Dichloropropane 77 971,1-Dichloropropene 75 110, 77cis-1,3-Dichloropropene 75 77, 39trans-1,3-Dichloropropene 75 77, 39Diethyl ether 74 45, 591,4-Dioxane 88 88, 58, 43, 57Ethanol 31 45,27,46Ethyl acetate 88 43, 45, 61Ethylbenzene 91 106Ethyl methacrylate 69 69, 41, 99, 86, 114Hexachlorobutadiene 225 223, 2272-Hexanone 58 100Iodomethane 142 127, 141Isobutyl alcohol 74 43, 41, 42Isopropylbenzene 120 105p-Isopropyltoluene 134 91, 119Methacrylonitrile 67 41, 39, 52, 66Methyl-t-butyl ether 73 57Methylene chloride 84 86, 49Methyl methacrylate 69 69, 41, 100, 391-Methylnaphathalene 142 1412-Methylnaphathalene 142 1414-Methyl-2-pentanone 100 43, 58, 85Naphthalene 128 127Nitrobenzene 123 -N-Nitrosodibutylamine 84 158

TABLE 2(continued)
Compound Primary Characteristic Ion Secondary Characteristic Ion(s)
8261 - 35 Revision 0February 2007
N-Nitrosodiethylamine 102 57N-Nitrosodimethylamine 74 42N-Nitrosodi-n-propylamine 130 70N-Nitrosomethylethylamine 88 56, 42Pentachloroethane 167 167, 130, 132, 165, 1692-Picoline 93 93, 66, 92, 78Propionitrile 54 54, 52, 55, 40n-Propylbenzene 120 91Pyridine 79 52Styrene 104 781,2,3-Trichlorobenzene 180 182, 1451,2,4-Trichlorobenzene 180 182, 1451,1,1,2-Tetrachloroethane 131 1331,1,2,2-Tetrachloroethane 83 131, 85Tetrachloroethene 166 129, 131, 164Toluene 92 91o-Toluidine 106 1071,2,3-Trichlorobenzene 180 1821,2,4,-Trichlorobenzene 180 1821,1,1-Trichloroethane 97 99, 611,1,2-Trichloroethane 97 83, 85Trichloroethene 130 95, 97, 132Trichlorofluoromethane 101 151, 1531,2,3-Trichloropropane 110 75, 771,2,4-Trimethylbenzene 120 1051,3,5-Trimethylbenzene 120 105Vinyl chloride 62 64o-Xylene 106 91m-Xylene 106 91p-Xylene 106 91SurrogatesAcetone-d6 64 46Acetophenone-d5 110 82Benzene-d6 84 83Bromobenzene-d5 82 162

TABLE 2(continued)
Compound Primary Characteristic Ion Secondary Characteristic Ion(s)
8261 - 36 Revision 0February 2007
4-Bromofluorobenzene 174 95, 176Chlorobenzene-d5 117 119Decafluorobiphenyl 256 2341,2-Dibromomethane-d4 111 1131,2-Dichlorobenzene-d4 152 115, 150Dichloroethane-d4 65 1021,2-Dichloropropane-d6 67 69Diethyl ether-d10 84 66, 501,4-Difluorobenzene 114 631,4-Dioxane-d8 96 64Ethyl acetate-13C2 71 62Fluorobenzene 96 77Hexafluorobenzene 186 117Methylene chloride-d2 88 90Methylnaphthalene-d10 152 150Naphthalene-d8 136 108Nitrobenzene-d5 128 82Nitromethane-d3 64 46Pentafluorobenzene 168 -Pyridine-d5 84 56Tetrahydrofuran-d8 78 801,2,4-Trichlorobenzene-d3 183 1851,1,2-Trichloroethane-d3 100 -Toluene-d8 98 -o-Xylene-d10 98 116
The ions listed above are those recommended, but not required, for use in this method. Ingeneral, the ions listed as the primary characteristic ion provide a better response or suffer fromfewer interferences. However, either the primary ion or one of the secondary ions listed heremay be used for quantitation of the analytes, provided that the same ions are used for bothcalibrations and sample analyses. In some instances, sample-specific interferences may occurthat complicate the use of the characteristic ion that was used for the calibration. If suchinterferences occur, the use of a secondary ion for quantitation must be clearly documented andsupported by multi-point calibration factors derived from the same ion.

8261 - 37 Revision 0February 2007
TABLE 3
RELATIVE VOLATILITY VALUES (αK)
CompoundSurrogate
Typeab.p.b
(EC)Conc.c
(ppb) Kd
αk-valueAvg.e SDf
Permanent gases (Class I)Dichlorodifluoromethane -30 80 0.07 0.02Trichlorofluoromethane 24 80 0.20 0.02Vinyl chloride -13 80 0.48 0.06Chloroethane 12 80 1.01 0.02Chloromethane -24 80 1.37 0.07Bromomethane 4 80 1.82 0.12Volatiles (Class I)1,1-Dichloroethene 37 40 0.63 0.07Carbon tetrachloride 76 40 0.64 0.02Hexafluorobenzene α 82 25 0.86 0.061,1-Dichloropropene 104 40 0.88 0.031,1,1-Trichloroethane 74 40 1.41 1.31 0.04Allyl chloride 45 100 1.34 0.452,2-Dichloropropane 69 40 1.37 0.18Tetrachloroethene 121 40 1.55 1.43 0.03Pentafluorobenzene α 85 9 1.51 0.04Iodomethane 42 100 2.29 0.43trans-1,2-Dichloroethene 48 40 2.3 0.46Trichloroethene 87 40 2.34 0.09Isopropylbenzene 152 40 2.20 2.75 0.05Fluorobenzene α 85 9 3.5 0.21Benzene 80 40 4.36 3.55 0.27Ethylbenzene 136 40 3.28 3.6 0.121,4-Difluorobenzene α 88 9 3.83 0.07Toluene 111 40 3.93 3.88 0.12m+p-Xylenes 138 40 3.91 0.11Benzene-d6 c 79 26 4.4 3.92 0.271,1-Dichloroethane 57 40 4.12 0.08Toluene-d8 β 111 25 4.28 0.09n-Propylbenzene 159 40 2.49 2.43 0.04cis-1,2-Dichloroethene 60 40 5.34 0.07o-Xylene 144 40 5.11 5.54 0.09o-Xylene-d10 α 143 25 5.1 6.14 0.2Chlorobenzene-d5 α + β 131 25 6.27 0.17Volatiles (continued)Chloroform 62 40 5.85 6.39 0.09Styrene 145 40 6.87 0.36

TABLE 3(continued)
CompoundSurrogate
Typeab.p.b
(EC)Conc.c
(ppb) Kd
αk-valueAvg.e SDf
8261 - 38 Revision 0February 2007
Chlorobenzene 132 40 6.07 0.24Bromobenzene 156 40 7.89 0.73Bromobenzene-d5 β 155 25 7.93 0.594-Bromo-1-fluorobenzene c 152 25 8.05 0.7Methylene chloride 40 40 9.33 10.1 1.6Methylene chloride-d2 c 40 24 11.1 1.91,2-Dichloropropane 96 40 10.9 0.21,2-Dichloropropane-d6 c 95 21 11 0.11,1,1,2-Tetrachloroethane 130 40 11.6 0.6Bromodichloromethane 90 40 12.3 0.6trans-1,3-Dichloropropene 112 40 14.1 0.7Bromochloromethane 68 40 15.4 0.41,2-Dichloroethane 84 40 20.23 18.7 0.9Dibromochloromethane 120 40 19.2 1.4cis-1,3-Dichloropropene 104 40 19.6 1.41,2-Dichloroethane-d4 α 84 25 20.0 20.0Bromoform 150 40 23.4 2.4Dibromomethane 97 40 23.9 1.71,3-Dichloropropane 120 40 24.9 1.91,2-Dibromoethane-d4 α 131 26 26.0 1.71,1,2-Trichloroethane 114 40 26.2 2.41,1,2-Trichloroethane-d3 c 112 20 26.6 0.71,2-Dibromoethane 132 40 26.7 2.01,1,2,2-Tetrachloroethane 146 40 30.3 2.8cis-1,4-Dichloro-2-butene 152 100 33.3 8.11,2,3-Trichloropropane 157 40 33.6 2.9trans-1,4-Dichloro-2-butene 156 100 33.8 7.4Neutral semivolatiles (Class II)n-Butylbenzene 183 40 1.65 1.88 0.08sec-Butylbenzene 173 40 1.91 0.04Hexachlorobutadiene 215 40 2.08 0.06p-Isopropyltoluene 183 40 2.25 2.5 0.07tert-Butylbenzene 169 40 2.72 0.05Neutral semivolatiles (continued)Decafluorobiphenyl β 206 25 3.03 0.061,3,5-Trimethylbenzene 165 40 3.52 3.75 0.182-Chlorotoluene 159 40 4.04 0.171,2,4-Trimethylbenzene 169 40 4.5 0.44-Chlorotoluene 162 40 4.78 0.43

TABLE 3(continued)
CompoundSurrogate
Typeab.p.b
(EC)Conc.c
(ppb) Kd
αk-valueAvg.e SDf
8261 - 39 Revision 0February 2007
1,3-Dichlorobenzene 173 40 5.72 0.731,4-Dichlorobenzene 174 40 6.14 0.841,2,4-Trichlorobenzene 214 40 7.73 1.221,2-Dichlorobenzene 180 40 7.86 1.191,2,4-Trichlorobenzene-d3 β 213 25 7.88 1.191,2-Dichlorobenzene-d4 β 181 24 8.03 1.231,2,3-Trichlorobenzene 218 40 11.3 1.6Pentachloroethane 162 100 13.2 3.3Naphthalene 218 40 16.7 2.2Naphthalene-d8 c 217 25 18 3.71,2-Dibromo-3-chloropropane 196 40 38.9 4.91-Methylnaphthalene-d10 β 241 100 672-Methylnaphthalene 245 500 67 17Soluble volatiles (Class III)Diethyl ether 35 80 34.9 5.7Ethyl methacrylate 117 100 48.4 2.8Methyl methacrylate 101 100 71.4 4.1Methacrylonitrile 90 100 102.9 2.4Acrolein 53 200 180 116.8 14-Methyl-2-pentanone 117 100 119.9 8.42-Hexanone 128 100 131.1 2.1Ethyl acetate-13C2 α 77 250 150 150Acrylonitrile 78 100 161 32.0Acetophenone-d5 c 202 100 161 20.0Isobutyl alcohol 108 100 1750 156.0Tetrahydrofuran 66 N/A 456 67.0Acetonitrile 82 100 1200 545 103.0Acetone 56 100 580 600 32.0Acetone-d6 α 57 490 600 6002-Butanone 80 100 380 770 110Soluble volatiles (continued)Propionitrile 97 100 1420 3201,4-Dioxane-d8 α 101 240 5800 58001,4-Dioxane 101 100 5750 6200 7002-Picoline 129 100 6800 5200Pyridine 116 100 13100 600Pyridine-d5 α 115 100 15000 15000Basic semivolatiles (Class IV)N-Nitrosodimethylamine 154 500 129 37.3

TABLE 3(continued)
CompoundSurrogate
Typeab.p.b
(EC)Conc.c
(ppb) Kd
αk-valueAvg.e SDf
8261 - 40 Revision 0February 2007
N-Nitrosomethylethylamine 165 500 1900 800N-Nitrosodi-n-propylamine 206 500 2400 2000N-Nitrosodiethylamine 177 500 4900 2200Aniline 184 500 13700 2300o-Toluidine 200 500 15200 2100N-Nitrosodibutylamine 240 500 21000 5000
aSurrogate type: α = α-surrogateβ = β-surrogatec = check surrogate
bBoiling point of analyte
cConcentration of analyte in solutions used to determine α-values
dPartition coefficient of analyte between headspace and water at 20 EC
eAverage of 3 to 4 replicates
fOne standard deviation

8261 - 41 Revision 0February 2007
TABLE 4
RELATIVE VOLATILITY RANGES OF THE GAS-LIQUID PARTITIONING (α-) SURROGATES
Relative Volatility Range Surrogate Pairs
0.07 to 3.0 Hexafluorobenzene Fluorobenzene
Hexafluorobenzene 1,4-Difluorobenzene
Pentafluorobenzene Fluorobenzene
Pentafluorobenzene 1,4-Difluorobenzene
3.0 to 6.3 Fluorobenzene o-Xylene-d10
Fluorobenzene Chlorobenzene-d5
1,4-Difluorobenzene o-Xylene-d10
1,4-Difluorobenzene Chlorobenzene-d5
6.3 to 20 o-Xylene-d10 1,2-Dichloroethane-d4
o-Xylene-d10 1,2-Dibromoethane-d4
Chlorobenzene-d5 1,2-Dichloroethane-d4
Chlorobenzene-d5 1,2-Dibromoethane-d4
20 to 600 1,2-Dichloroethane-d4 Tetrahydrofuran-d8
1,2-Dichloroethane-d4 1,4-Dioxane-d8
1,2-Dibromoethane-d4 Tetrahydrofuran-d8
1,2-Dibromoethane-d4 1,4-Dioxane-d8
600 to 6000 Tetrahydrofuran-d8 1,4-Dioxane-d8
Nitromethane-d3 1,4-Dioxane-d8

8261 - 42 Revision 0February 2007
TABLE 5
BOILING POINT RANGES OF THE BOILING POINT (β-) SURROGATES
Boiling Point Range (EC) Surrogate Pairs
80 to 111 Toluene-d8 80 ECa
Chlorobenzene-d5 80 ECa
111 to 131 Toluene-d8 Chlorobenzene-d5
Toluene-d8 Bromobenzene-d5
Chlorobenzene-d5 80 ECa
131 to 155 Toluene-d8 Bromobenzene-d5
Chlorobenzene-d5 Bromobenzene-d5
Chlorobenzene-d5 1,2-Dichlorobenzene-d4
155 to 181 Chlorobenzene-d5 1,2-Dichlorobenzene-d4
Bromobenzene-d5 1,2-Dichlorobenzene-d4
Bromobenzene-d5 Decafluorobiphenyl
181 to 206 Bromobenzene-d5 Decafluorobiphenyl
1,2-Dichlorobenzene-d4 Decafluorobiphenyl
1,2-Dichlorobenzene-d4 1,2,4-Trichlorobenzene-d3
206 to 220 1,2-Dichlorobenzene-d4 1,2,4-Trichlorobenzene-d3
Decafluorobiphenyl 1,2,4-Trichlorobenzene-d3
Decafluorobiphenyl 1-Methylnaphthalene-d10
220 to 250 Decafluorobiphenyl 1-Methylnaphthalene-d10
Decafluorobiphenyl 1-Methylnaphthalene-d10
a The boiling point effects relating to an analyte with a boiling point of # 80 EC are assumed tobe negligible.

8261 - 43 Revision 0February 2007
TABLE 6
EXAMPLE DATA FOR RECOVERY OF ANALYTES SPIKED INTO THREE SOILSAND ANALYZED BY VACUUM DISTILLATION GC/MS
Soil #1a Soil #2b Soil #3c
Compound%
RecdRel
ErroreSurPref
%Recd
RelErrore
SurPref
%Recd
RelErrore
SurPref
Dichlorodifluoromethane 128 28 0 122 30 92 22 4 4Chloromethane 116 9 0 109 13 74 71 6 12Vinyl chloride 114 14 0 118 18 87 94 7 15Bromomethane 106 12 0 101 12 62 24 1 2Chloroethane 109 11 0 110 11 75 15 0 2Trichlorofluoromethane 111 11 0 125 14 98 12 0 2Diethyl ether 20 8 1 18 8 6 10 1 1Acetone 112 3 6 102 4 75 139 21 601,1-Dichloroethene 110 4 0 120 17 91 68 7 10Iodomethane 106 6 0 96 15 56 94 3 6Allyl chloride 116 8 0 111 12 77 88 4 10Methylene chloride-d6 105 6 2 96 6 60 101 3 2Methylene chloride 104 5 2 94 4 57 94 4 2Acrylonitrile 106 5 7 93 4 60 135 9 62trans-1,2-Dichloroethene 99 8 0 93 9 53 85 5 61,1-Dichloroethane 109 5 1 103 2 66 179 0 0Methacrylonitrile 106 3 6 69 7 35 152 2 112-Butanone 112 11 6 102 4 77 152 9 64Propionitrile 122 4 6 109 2 83 167 6 642,2-Dichloropropane 105 1 0 115 7 83 89 1 10cis-1,2-Dichloroethene 101 2 2 97 0 59 101 1 2Chloroform 99 2 3 98 2 62 103 0 2Isobutyl alcohol 103 9 6 105 6 75 NA NA NABromochloromethane 98 0 2 93 2 59 105 1 21,1,1-Trichloroethane 99 1 0 112 6 78 85 1 101,1-Dichloropropene 102 2 2 120 7 87 83 1 12Carbon tetrachloride 93 3 0 112 8 78 83 1 12Benzene-d6 102 1 1 99 1 60 102 1 11,2-Dichloroethane 99 1 2 94 0 108 108 1 3Benzene 101 1 1 98 1 101 101 1 1Trichloroethene 90 2 1 94 1 95 95 2 61,2-Dichloropropane-d6 102 1 2 101 1 103 103 1 21,2-Dichloropropane 102 2 3 101 1 102 102 1 2Methyl methacrylate 152 2 9 149 11 145 145 4 13Bromodichloromethane 94 2 2 95 1 103 103 1 21,4-Dioxane 110 1 5 103 1 123 123 2 29Dibromomethane 93 2 5 93 1 105 105 1 94-Methyl-2-pentanone 125 2 8 112 6 147 147 4 13

TABLE 6(continued)
Soil #1a Soil #2b Soil #3c
Compound%
RecdRel
ErroreSurPref
%Recd
RelErrore
SurPref
%Recd
RelErrore
SurPref
8261 - 44 Revision 0February 2007
trans-1,3-Dichloropropene 99 1 3 99 0 101 101 1 2Toluene 99 0 3 99 1 96 96 1 1Pyridine 95 5 8 119 1 71 71 3 43cis-1,3-Dichloropropene 91 2 2 93 1 102 102 1 3N-Nitrosodimethylamine 68 5 4 54 11 20 20 1 21,1,2-Trichloroethane-d3 95 3 5 100 4 102 102 1 82-Hexanone 125 6 6 110 4 145 145 8 131,1,2-Trichloroethane 93 2 5 96 2 103 103 1 9Tetrachloroethene 98 7 2 105 2 123 123 8 141,3-Dichloropropane 99 1 6 101 1 103 103 1 9Dibromochloromethane 92 2 3 95 0 103 103 1 32-Picoline 71 5 3 66 20 62 62 8 151,2-Dibromoethane 104 1 5 108 1 108 109 0 9Chlorobenzene 96 1 4 97 1 109 104 1 21,1,1,2-Tetrachloroethane 96 1 3 97 1 98 98 1 2Ethylbenzene 102 0 2 99 1 52 96 1 1N-Nitrosomethylethylamine 84 6 4 92 13 46 29 1 10m+p-Xylenes 101 1 2 99 1 52 94 1 1Styrene 97 1 3 96 1 49 96 0 3o-Xylene 102 1 2 100 1 53 97 1 2Isopropylbenzene 101 2 1 98 1 49 87 1 4Bromoform 94 0 5 103 2 64 101 1 8cis-1,4-Dichloro-2-butene 106 5 6 115 1 79 116 1 9N-Nitrosodiethylamine 104 13 4 128 16 84 45 1 111,1,2,2-Tetrachloroethane 93 2 5 100 1 61 101 2 84-Bromo-1-fluorobenzene 94 2 3 93 1 45 99 0 21,2,3-Trichloropropane 111 6 6 120 1 86 115 1 9n-Propylbenzene 100 3 1 95 0 45 85 1 5trans-1,4-Dichloro-2-butene 103 4 5 114 3 76 119 1 101,3,5-Trimethylbenzene 103 1 1 93 2 42 91 1 2Bromobenzene 97 1 3 98 0 50 102 0 22-Chlorotoluene 98 1 1 90 2 41 94 1 14-Chlorotoluene 98 3 2 93 1 43 95 1 2Pentachloroethane 88 2 2 86 3 39 72 4 2tert-Butylbenzene 103 2 2 99 1 47 83 1 41,2,4-Trimethylbenzene 104 1 2 96 2 44 91 1 2sec-Butylbenzene 99 4 2 93 3 43 83 1 8Aniline 106 16 10 143 29 106 15 1 10p-Isopropyltoluene 104 2 3 101 3 48 87 2 71,3-Dichlorobenzene 94 3 3 88 1 38 100 1 41,4-Dichlorobenzene 94 2 4 90 1 41 100 1 4

TABLE 6(continued)
Soil #1a Soil #2b Soil #3c
Compound%
RecdRel
ErroreSurPref
%Recd
RelErrore
SurPref
%Recd
RelErrore
SurPref
8261 - 45 Revision 0February 2007
n-Butylbenzene 97 5 3 89 4 38 83 1 81,2-Dichlorobenzene 95 2 4 93 0 42 103 1 5Benzyl alcohol 98 6 8 128 30 82 22 1 9N-Nitrosodi-n-propylamine 120 16 9 185 27 168 108 3 38Acetophenone-d5 104 10 9 167 11 136 270 7 124o-Toluidine 118 21 12 172 45 149 19 1 141,2-Dibromo-3-chloropropane
104 7 8 143 10 106 185 3 24
Hexachlorobutadiene 88 3 14 81 12 58 75 2 81,2,4-Trichlorobenzene 88 2 13 81 1 38 104 1 8Naphthalene-d8 88 5 17 109 5 69 141 2 12Naphthalene 88 4 18 109 2 70 132 2 121,2,3-Trichlorobenzene 83 0 18 77 2 40 111 1 10N-Nitrosodibutylamine 133 30 44 152 51 149 11 1 112-Methylnaphthalene 60 5 20 60 0 36 62 3 29
aGarden soil with 37% moisture and 21% organic matter. Three replicates were analyzed.bGarden soil with 15% moisture and 16% organic matter. Three replicates were analyzed.cDesert soil with 3% moisture and 1% organic matter. Seven replicates were analyzed.d% Rec = Average of replicate accuracy results using surrogate corrections. eRel Error = Relative standard deviation of replicate analyses. fSurr Prec = Average variation between the predicted analyte recoveries of the surrogate
pairs for the replicate analyses. This precision value provides a measure of theinherent error in the overall measurement.
NA = Analyte not significantly present in vacuum distillate.These data are provided for guidance purposes only.

8261 - 46 Revision 0February 2007
TABLE 7
EXAMPLE DATA FOR RECOVERY OF ANALYTES SPIKED INTO OILAND ANALYZED BY VACUUM DISTILLATION GC/MS
Compound % Reca Relative ErrorbSurrogatePrecisionc
Dichlorodifluoromethane 3 0 0
Chloromethane 141 18 2
Vinyl chloride 137 11 2
Bromomethane 120 29 0
Chloroethane 128 44 2
Trichlorofluoromethane 313 176 0
Diethyl ether 103 5 3
Acetone-d6 70 8 12
Acrolein 526 166 28
Acetone 323 125 42
1,1-Dichloroethene 116 4 1
Iodomethane 105 6 1
Allyl chloride 119 16 1
Acetonitrile 24 4 4
Methylene chloride-d6 104 7 2
Methylene chloride 106 10 2
Acrylonitrile 88 7 14
trans-1,2-Dichloroethene 116 4 0
1,1-Dichloroethane 103 2 1
Methacrylonitrile 94 4 4
2-Butanone 92 9 13
Propionitrile 85 4 13
Ethyl acetate-13C2 84 5 3
2,2-Dichloropropane 97 2 1
cis-1,2-Dichloroethene 105 2 1
Chloroform 97 2 2
Isobutyl alcohol 115 11 20
Bromochloromethane 98 3 2
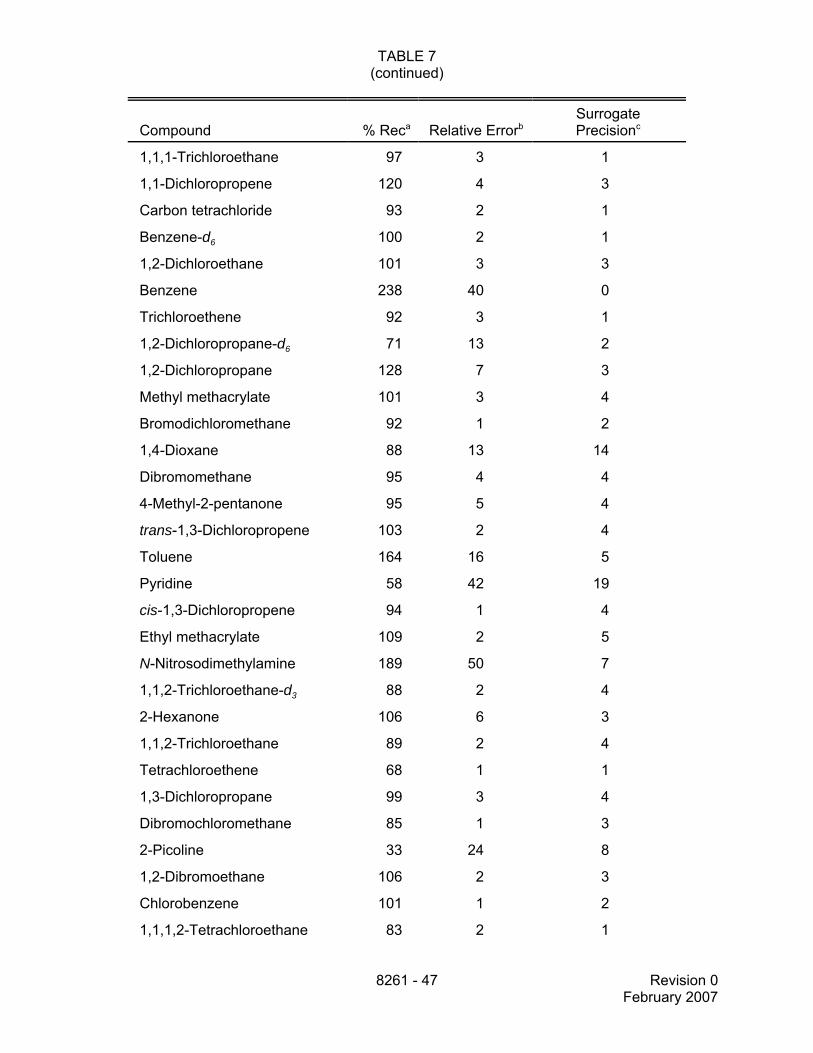
TABLE 7(continued)
Compound % Reca Relative ErrorbSurrogatePrecisionc
8261 - 47 Revision 0February 2007
1,1,1-Trichloroethane 97 3 1
1,1-Dichloropropene 120 4 3
Carbon tetrachloride 93 2 1
Benzene-d6 100 2 1
1,2-Dichloroethane 101 3 3
Benzene 238 40 0
Trichloroethene 92 3 1
1,2-Dichloropropane-d6 71 13 2
1,2-Dichloropropane 128 7 3
Methyl methacrylate 101 3 4
Bromodichloromethane 92 1 2
1,4-Dioxane 88 13 14
Dibromomethane 95 4 4
4-Methyl-2-pentanone 95 5 4
trans-1,3-Dichloropropene 103 2 4
Toluene 164 16 5
Pyridine 58 42 19
cis-1,3-Dichloropropene 94 1 4
Ethyl methacrylate 109 2 5
N-Nitrosodimethylamine 189 50 7
1,1,2-Trichloroethane-d3 88 2 4
2-Hexanone 106 6 3
1,1,2-Trichloroethane 89 2 4
Tetrachloroethene 68 1 1
1,3-Dichloropropane 99 3 4
Dibromochloromethane 85 1 3
2-Picoline 33 24 8
1,2-Dibromoethane 106 2 3
Chlorobenzene 101 1 2
1,1,1,2-Tetrachloroethane 83 2 1

TABLE 7(continued)
Compound % Reca Relative ErrorbSurrogatePrecisionc
8261 - 48 Revision 0February 2007
Ethylbenzene 114 3 1
N-Nitrosomethylethylamine 192 48 0
m+p-Xylenes 122 3 1
Styrene 102 1 2
o-Xylene 115 3 1
Isopropylbenzene 109 5 1
Bromoform 88 2 3
cis-1,4-Dichloro-2-butene 103 3 4
N-Nitrosodiethylamine 222 44 30
1,1,2,2-Tetrachloroethane 83 5 3
4-Bromo-1-fluorobenzene 93 2 2
1,2,3-Trichloropropane 103 4 4
n-Propylbenzene 122 4 1
trans-1,4-Dichloro-2-butene 95 3 4
1,3,5-Trimethylbenzene 93 9 2
Bromobenzene 98 2 2
2-Chlorotoluene 78 2 1
4-Chlorotoluene 93 2 2
Pentachloroethane 81 4 2
tert-Butylbenzene 120 55 3
1,2,4-Trimethylbenzene 127 8 3
sec-Butylbenzene 89 10 3
Aniline NA NA NAd
p-Isopropyltoluene NA NA NA
1,3-Dichlorobenzene 70 2 2
1,4-Dichlorobenzene 87 3 4
n-Butylbenzene 105 4 6
1,2-Dichlorobenzene 119 14 7
Benzyl alcohol NA NA NA
n-Nitroso-di-n-propylamine 270 58 51

TABLE 7(continued)
Compound % Reca Relative ErrorbSurrogatePrecisionc
8261 - 49 Revision 0February 2007
Acetophenone-d5 175 31 34
o-Toluidine 108 69 36
1,2-Dibromo-3-chloropropane 84 14 6
Hexachlorobutadiene 119 6 20
1,2,4-Trichlorobenzene 94 5 14
Naphthalene-d8 132 16 29
Naphthalene 123 15 32
1,2,3-Trichlorobenzene 80 3 21
n-Nitrosodibutylamine 2000 3600 3200
2-Methylnaphthalene 667 1644 4900
aAverage of seven replicate analyses of 1 g of cod liver oil.
bRelative standard deviation of replicate analyses.
cAverage variation between the predicted analyte recoveries of the surrogate pairs for thereplicate analyses. This precision value provides a measure of the inherent error in theoverall measurement.
dNA = Compound could not be accurately measured due to spectral interferences.

Revision 0February 20078261 - 50
TABLE 8EXAMPLE RECOVERY OF ANALYTES SPIKED INTO WATER SOLUTIONS AND ANALYZED BY VACUUM DISTILLATION
GC/MS
Watera Water/Glycerinb Water/Saltc Water/Soapd
Compound% Rece Rel
ErrorfSurrPrecg
% Rece
RelErrorf
SurrPrecg
% Rece RelErrorf
SurrPrecg
%Rece
RelErrorf
SurrPrecg
Dichlorodifluoromethane 76 9 1 84 8 1 85 6 1 56 7 1
Chloromethane 81 6 1 86 8 1 83 10 1 77 3 1
Vinyl chloride 78 5 1 81 3 1 74 4 1 81 4 1
Bromomethane 101 5 1 103 2 0 116 47 1 102 4 1
Chloroethane 95 5 1 96 2 1 112 52 1 95 5 1
Trichlorofluoromethane 122 52 1 98 1 1 120 58 1 96 3 1
Diethyl ether 106 17 2 98 12 1 14 8 0 17 14 1
Acrolein 111 16 3 114 5 1 20 10 2 49 6 2
Acetone 114 17 5 286 41 16 88 5 20 71 10 3
1,1-Dichloroethene 102 10 1 98 6 1 20 12 0 93 9 1
Iodomethane 103 7 1 104 7 0 98 4 1 103 2 0
Allyl chloride 102 10 1 101 6 1 95 4 1 101 3 1
Acetonitrile 122 21 6 189 2 7 82 11 17 99 8 4
Methylene chloride-d2 103 7 1 104 9 0 99 7 1 102 6 2
Methylene chloride 99 9 1 101 10 0 95 10 1 98 8 2
Acrylonitrile 97 1 7 95 3 7 112 21 27 93 3 4
trans-1,2-Dichloroethane 100 4 1 100 5 0 94 8 1 93 6 1
1,1-Dichloroethane 102 5 1 102 5 0 101 4 0 101 1 1
Methacrylonitrile 101 3 2 101 1 1 108 7 7. 104 2 4
2-Butanone 68 43 7 106 31 10 105 27 25 97 2 4
Propionitrile 100 6 6 109 9 14 111 31 22 103 3 4
2,2-Dichloropropane 100 1 1 99 1 1 100 1 1 102 1 1
cis-1,2-Dichloroethene 100 1 1 100 1 0 97 2 0 103 0 1

TABLE 8 (continued)
Watera Water/Glycerinb Water/Saltc Water/Soapd
Compound% Rece Rel
ErrorfSurrPrecg
% Rece
RelErrorf
SurrPrecg
% Rece RelErrorf
SurrPrecg
%Rece
RelErrorf
SurrPrecg
Revision 0February 20078261 - 51
Chloroform 100 1 1 100 2 1 100 2 0 103 1 2
Isobutyl alcohol 86 7 5 137 17 5 116 21 30 76 10 3
Bromochloromethane 102 1 1 102 1 0 100 0 1 102 1 1
1,1,1-Trichloroethane 100 1 1 99 1 1 98 3 1 99 1 1
1,1-Dichloropropene 95 3 1 96 3 1 94 3 1 99 3 1
Carbon tetrachloride 100 0 1 100 2 1 100 2 1 88 2 1
Benzene-d6 99 1 1 99 1 1 99 1 0 100 1 1
1,2-Dichloroethane 101 1 1 101 1 1 99 1 1 100 1 2
Benzene 99 0 1 100 1 1 99 2 0 99 1 1
Trichloroethene 100 1 1 99 1 0 98 1 1 109 1 0
1,2-Dichloropropane-d6 99 2 1 99 2 0 99 2 1 101 2 2
1,2-Dichloropropane 100 1 1 100 1 0 99 1 1 101 1 2
Methyl methacrylate 106 7 2 128 10 1 114 4 5 106 2 5
Bromodichloromethane 102 1 1 100 1 0 102 2 1 101 1 2
1,4-Dioxane 101 8 8 156 15 83 96 18 16 102 3 14
Dibromomethane 102 1 2 101 1 1 99 1 3 100 1 5
4-Methyl-2-pentanone 102 5 3 102 3 1 116 1 9 110 2 5
trans-1,3-Dichloropropene 99 1 1 100 0 1 99 2 1 103 1 1
Toluene 98 2 1 99 1 1 97 3 1 97 1 1
Pyridine 61 20 16 NA NA NA 104 24 37 128 7 36
cis-1,3-Dichloropropene 99 1 1 99 1 1 97 2 1 100 1 2
Ethyl methacrylate 109 9 2 156 17 1 109 25 3 105 2 4
N-Nitrosodimethylamine 75 8 2 97 8 1 105 32 10 69 9 4
1,1,2-Trichloroethane-d3 100 1 2 100 2 1 101 2 3 99 1 5
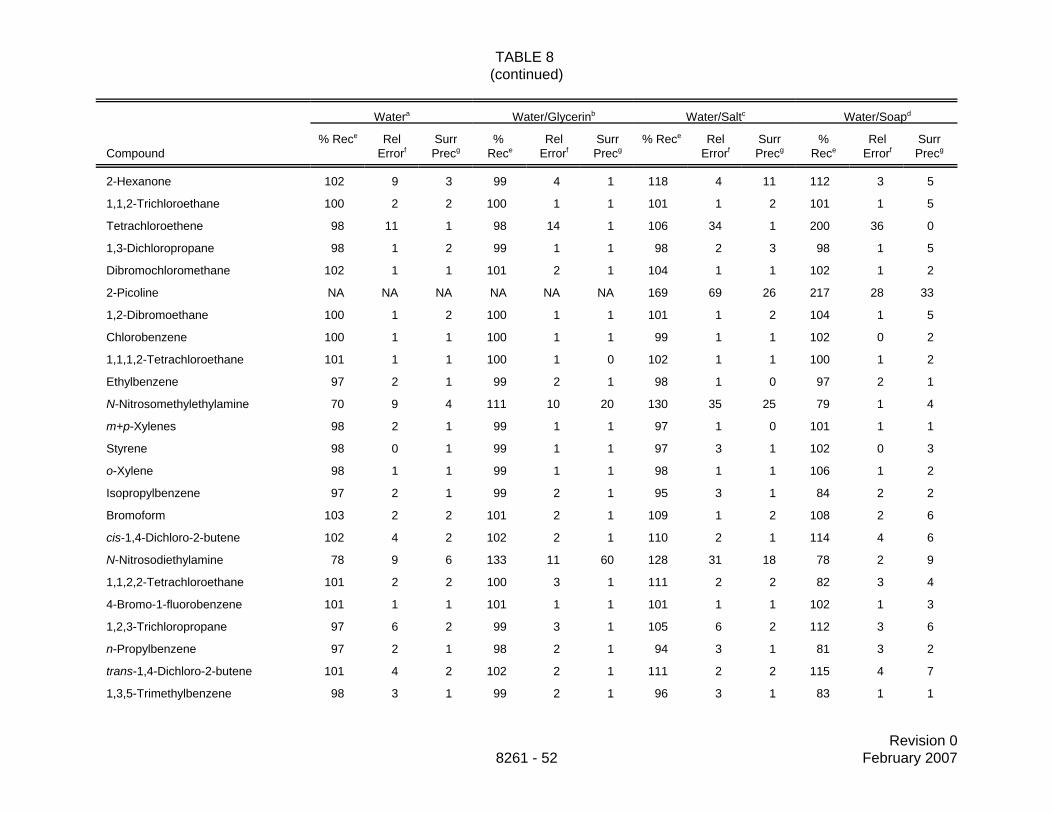
TABLE 8 (continued)
Watera Water/Glycerinb Water/Saltc Water/Soapd
Compound% Rece Rel
ErrorfSurrPrecg
% Rece
RelErrorf
SurrPrecg
% Rece RelErrorf
SurrPrecg
%Rece
RelErrorf
SurrPrecg
Revision 0February 20078261 - 52
2-Hexanone 102 9 3 99 4 1 118 4 11 112 3 5
1,1,2-Trichloroethane 100 2 2 100 1 1 101 1 2 101 1 5
Tetrachloroethene 98 11 1 98 14 1 106 34 1 200 36 0
1,3-Dichloropropane 98 1 2 99 1 1 98 2 3 98 1 5
Dibromochloromethane 102 1 1 101 2 1 104 1 1 102 1 2
2-Picoline NA NA NA NA NA NA 169 69 26 217 28 33
1,2-Dibromoethane 100 1 2 100 1 1 101 1 2 104 1 5
Chlorobenzene 100 1 1 100 1 1 99 1 1 102 0 2
1,1,1,2-Tetrachloroethane 101 1 1 100 1 0 102 1 1 100 1 2
Ethylbenzene 97 2 1 99 2 1 98 1 0 97 2 1
N-Nitrosomethylethylamine 70 9 4 111 10 20 130 35 25 79 1 4
m+p-Xylenes 98 2 1 99 1 1 97 1 0 101 1 1
Styrene 98 0 1 99 1 1 97 3 1 102 0 3
o-Xylene 98 1 1 99 1 1 98 1 1 106 1 2
Isopropylbenzene 97 2 1 99 2 1 95 3 1 84 2 2
Bromoform 103 2 2 101 2 1 109 1 2 108 2 6
cis-1,4-Dichloro-2-butene 102 4 2 102 2 1 110 2 1 114 4 6
N-Nitrosodiethylamine 78 9 6 133 11 60 128 31 18 78 2 9
1,1,2,2-Tetrachloroethane 101 2 2 100 3 1 111 2 2 82 3 4
4-Bromo-1-fluorobenzene 101 1 1 101 1 1 101 1 1 102 1 3
1,2,3-Trichloropropane 97 6 2 99 3 1 105 6 2 112 3 6
n-Propylbenzene 97 2 1 98 2 1 94 3 1 81 3 2
trans-1,4-Dichloro-2-butene 101 4 2 102 2 1 111 2 2 115 4 7
1,3,5-Trimethylbenzene 98 3 1 99 2 1 96 3 1 83 1 1

TABLE 8 (continued)
Watera Water/Glycerinb Water/Saltc Water/Soapd
Compound% Rece Rel
ErrorfSurrPrecg
% Rece
RelErrorf
SurrPrecg
% Rece RelErrorf
SurrPrecg
%Rece
RelErrorf
SurrPrecg
Revision 0February 20078261 - 53
Bromobenzene 101 0 1 101 0 1 100 1 1 104 1 3
2-Chlorotoluene 96 4 1 99 3 1 95 3 1 88 2 2
4-Chlorotoluene 101 2 1 100 2 1 98 1 1 94 2 2
Pentachloroethane 103 10 1 100 9 1 94 18 1 29 8 1
tert-Butylbenzene 99 3 1 100 3 1 95 5 1 66 2 1
1,2,4-Trimethylbenzene 98 2 1 99 2 1 96 2 1 88 2 2
sec-Butylbenzene 98 3 1 99 2 1 93 3 2 74 2 2
Aniline 119 40 18 74 15 65 79 37 30 97 9 29
p-Isopropyltoluene 97 0 2 98 4 2 93 3 2 81 2 4
1,3-Dichlorobenzene 101 1 1 100 1 1 99 1 1 98 1 3
1,4-Dichlorobenzene 101 1 1 101 1 1 100 2 1 105 1 3
n-Butylbenzene 97 2 2 98 3 2 91 2 2 74 2 3
1,2-Dichlorobenzene 100 1 1 100 1 1 100 1 2 102 1 5
Benzyl alcohol 128 28 19 167 14 125 65 35 15 93 5 23
N-Nitroso-di-n-propylamine 68 14 5 108 9 25 56 15 29 112 5 15
Acetophenone-d5 71 20 7 81 7 7 99 66 23 156 7 17
o-Toluidine 127 42 21 66 20 61 97 49 41 115 15 37
1,2-Dibromo-3-chloropropane 101 9 3 99 5 3 111 25 4 156 7 15
Hexachlorobutadiene 101 2 2 102 4 3 92 3 3 74 2 4
1,2,4-Trichlorobenzene 101 1 2 100 1 3 102 1 3 104 1 5
Naphthalene-d8 102 5 2 100 2 4 112 5 5 127 3 10
Naphthalene 101 4 2 101 2 4 110 2 5 125 3 9
1,2,3-Trichlorobenzene 100 2 2 100 1 4 100 3 5 93 3 8
N-Nitrosodibutylamine 208 109 43 400 32 384 90 69 67 98 21 43

TABLE 8 (continued)
Watera Water/Glycerinb Water/Saltc Water/Soapd
Compound% Rece Rel
ErrorfSurrPrecg
% Rece
RelErrorf
SurrPrecg
% Rece RelErrorf
SurrPrecg
%Rece
RelErrorf
SurrPrecg
Revision 0February 20078261 - 54
2-Methylnaphthalene 84 6 8 91 10 12 98 27 24 55 3 11a5-mL water samplesb1 g of glycerin added to 5 mL of waterc1 g of salt added to 5 mL of waterd0.2 g of concentrated soap added to 5 mL of watereAverage of four replicate analysesfRelative standard deviation of replicate analysesgAverage variation between the predicted analyte recoveries of thesurrogate pairs for the replicate analyses. This precision value providesa measure of the inherent error in the overall measurement.hNA = compound not significantly present in vacuum distillate.
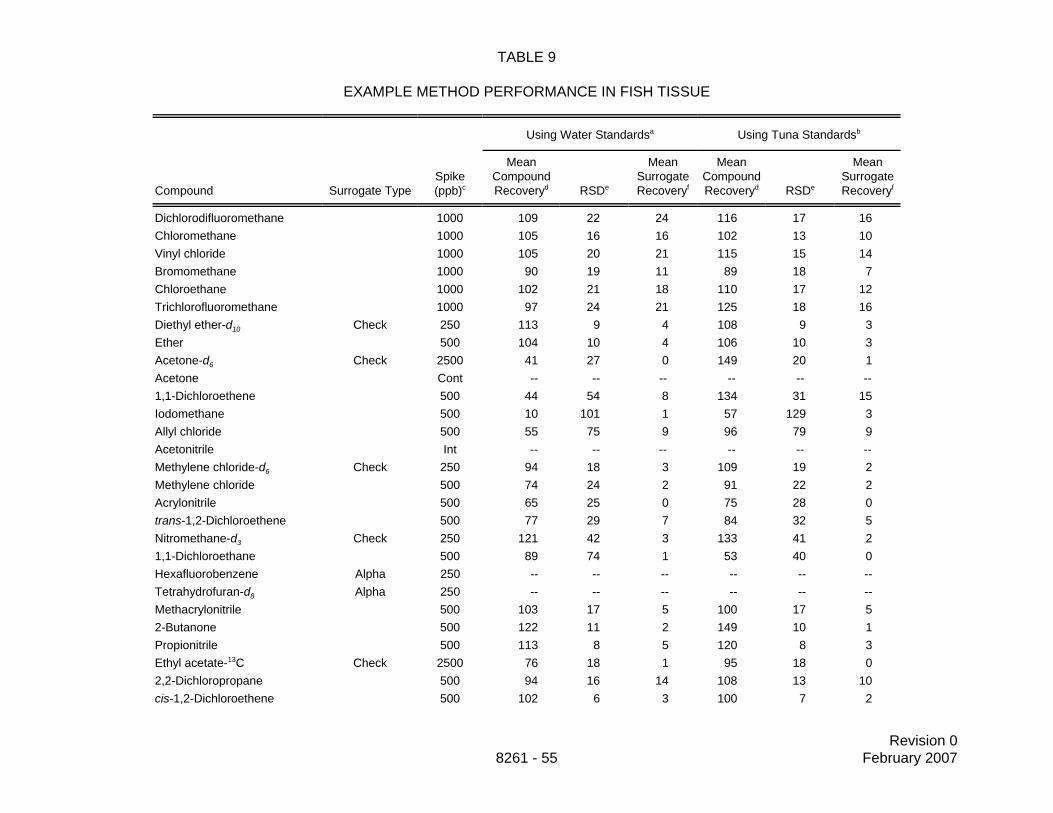
Revision 0February 20078261 - 55
TABLE 9
EXAMPLE METHOD PERFORMANCE IN FISH TISSUE
Using Water Standardsa Using Tuna Standardsb
Compound Surrogate TypeSpike(ppb)c
MeanCompoundRecoveryd RSDe
MeanSurrogateRecoveryf
MeanCompoundRecoveryd RSDe
MeanSurrogateRecoveryf
Dichlorodifluoromethane 1000 109 22 24 116 17 16Chloromethane 1000 105 16 16 102 13 10Vinyl chloride 1000 105 20 21 115 15 14Bromomethane 1000 90 19 11 89 18 7Chloroethane 1000 102 21 18 110 17 12Trichlorofluoromethane 1000 97 24 21 125 18 16Diethyl ether-d10 Check 250 113 9 4 108 9 3Ether 500 104 10 4 106 10 3Acetone-d6 Check 2500 41 27 0 149 20 1Acetone Cont -- -- -- -- -- --1,1-Dichloroethene 500 44 54 8 134 31 15Iodomethane 500 10 101 1 57 129 3Allyl chloride 500 55 75 9 96 79 9Acetonitrile Int -- -- -- -- -- --Methylene chloride-d6 Check 250 94 18 3 109 19 2Methylene chloride 500 74 24 2 91 22 2Acrylonitrile 500 65 25 0 75 28 0trans-1,2-Dichloroethene 500 77 29 7 84 32 5Nitromethane-d3 Check 250 121 42 3 133 41 21,1-Dichloroethane 500 89 74 1 53 40 0Hexafluorobenzene Alpha 250 -- -- -- -- -- --Tetrahydrofuran-d8 Alpha 250 -- -- -- -- -- --Methacrylonitrile 500 103 17 5 100 17 52-Butanone 500 122 11 2 149 10 1Propionitrile 500 113 8 5 120 8 3Ethyl acetate-13C Check 2500 76 18 1 95 18 02,2-Dichloropropane 500 94 16 14 108 13 10cis-1,2-Dichloroethene 500 102 6 3 100 7 2

TABLE 9(continued)
Using Water Standardsa Using Tuna Standardsb
Compound Surrogate TypeSpike(ppb)c
MeanCompoundRecoveryd RSDe
MeanSurrogateRecoveryf
MeanCompoundRecoveryd RSDe
MeanSurrogateRecoveryf
Revision 0February 20078261 - 56
Chloroform 500 101 6 4 100 7 3Pentafluorobenzene Alpha 250 -- -- -- -- -- --Bromochloromethane 500 100 5 2 99 5 21,1,1-Trichloroethane 500 91 18 14 113 13 101,1-Dichloropropene 500 99 21 18 128 15 15Carbon tetrachloride 500 80 22 15 122 17 14Benzene-d6 Alpha 500 -- -- -- -- -- --1,2-Dichloroethane-d4 Alpha 250 -- -- -- -- -- --1,2-Dichloroethane 500 100 3 2 99 3 2Benzene 500 102 3 1 101 3 1Fluorobenzene Alpha 250 -- -- -- -- -- --1,4-Difluorobenzene Alpha 250 -- -- -- -- -- --Trichloroethene 500 71 10 6 86 8 51,2-Dichloropropane-d6 Check 250 93 2 3 94 2 21,2-Dichloropropane 500 93 3 3 93 2 2Methyl methacrylate 500 102 13 5 99 13 41,4-Dioxane-d8 Alpha 2500 -- -- -- -- -- --Bromodichloromethane 500 75 10 2 86 11 21,4-Dioxane 500 115 3 22 108 3 11Dibromomethane 500 92 4 4 99 4 34-Methyl-2-pentanone 1000 128 20 8 108 21 6trans-1,3-Dichloropropene 500 61 36 2 61 36 2Toluene-d8 Beta 250 -- -- -- -- -- --Toluene 500 101 4 4 98 4 2Pyridine-d5 Check/Alpha 2500 51 25 25 72 16 21Pyridine 500 62 21 27 81 13 20cis-1,3-Dichloropropene 500 61 27 2 66 27 2Ethyl methacrylate 500 100 12 5 95 12 4N-Nitrosodimethylamine 3350 657 28 39 160 30 10

TABLE 9(continued)
Using Water Standardsa Using Tuna Standardsb
Compound Surrogate TypeSpike(ppb)c
MeanCompoundRecoveryd RSDe
MeanSurrogateRecoveryf
MeanCompoundRecoveryd RSDe
MeanSurrogateRecoveryf
Revision 0February 20078261 - 57
1,1,2-Trichloroethane-d3 Check 250 80 6 4 93 6 32-Hexanone 500 141 23 9 114 23 71,1,2-Trichloroethane 500 82 5 4 93 5 3Tetrachloroethene 500 73 16 11 106 12 101,3-Dichloropropane 500 99 2 5 97 2 3Dibromochloromethane 500 61 11 3 90 19 31,2-Dibromoethane-d4 250 -- -- -- -- -- --2-Picoline 500 163 16 38 131 11 161,2-Dibromoethane 500 99 4 6 99 4 4Chlorobenzene-d5 Beta 250 -- -- -- -- -- --Chlorobenzene 500 95 3 6 99 3 41,1,1,2-Tetrachloroethane 500 88 4 5 95 5 3Ethylbenzene 500 111 7 4 110 7 2N-Nitrosomethylethylamine 3350 516 31 31 182 27 7m+p-Xylenes 500 107 6 4 107 6 2Styrene 500 94 3 4 95.7 3 3o-Xylene-d10 250 -- -- -- -- -- --o-Xylene 500 102 4 4 101 4 3Isopropylbenzene 500 116 16 8 124 15 6Bromoform 500 53 30 2 118 38 4cis-1,4-Dichloro-2-butene 500 5 134 0 5 134 0N-Nitrosodiethylamine 3350 356 31 62 168 28 181,1,2,2-Tetrachloroethane 500 37 62 2 144 72 54-Bromofluorobenzene Check 250 92 4 4 97 3 41,2,3-Dichloropropane 500 103 10 5 98 11 4Propylbenzene 500 113 17 10 125 16 8trans-1,4-Dichloro-2-butene 500 0 0 0 0 0 01,3,5-Trimethylbenzene 500 115 9 4 113 10 3Bromobenzene-d5 Beta 250 -- -- -- -- -- --

TABLE 9(continued)
Using Water Standardsa Using Tuna Standardsb
Compound Surrogate TypeSpike(ppb)c
MeanCompoundRecoveryd RSDe
MeanSurrogateRecoveryf
MeanCompoundRecoveryd RSDe
MeanSurrogateRecoveryf
Revision 0February 20078261 - 58
Bromobenzene 500 96 4 5 97 3 42-Chlorotoluene 500 105 4 3 107 4 34-Chlorotoluene 500 101 4 3 104 5 3Pentachloroethane 500 28 54 1 135 75 5tert-Butylbenzene 500 118 19 10 126 19 81,2,4-Trimethylbenzene 500 112 9 5 107 10 4sec-Butylbenzene 500 114 24 15 134 22 13Aniline 500 80 36 37 57 38 15p-Isopropyltoluene 500 124 21 16 127 20 121,3-Dichlorobenzene 500 94 5 7 98 4 51,4-Dichlorobenzene 500 93 6 7 96 5 6n-Butylbenzene 500 109 22 17 128 20 151,2-Dichlorobenzene-d4 Beta 250 -- -- -- -- -- --1,2-Dichlorobenzene 500 91 10 10 96 9 7Decafluorobiphenyl Beta 250 -- -- -- -- -- --N-Nitrosodi-n-propylamine 3350 288 51 47 179 50 21Nitrobenzene-d5 Check 250 374 105 283 176 58 40Acetophenone-d5 Check 1000 216 47 29 187 47 19o-Toluidine 3350 67 39 34 58 41 181,2-Dibromo-3-chloropropane 500 97 39 12 107 40 10Hexachlorobutadiene 500 108 27 20 122 28 181,2,4-Trichlorobenzene-d3 Beta 250 -- -- -- -- -- --1,2,4-Trichlorobenzene 500 94 12 14 94 9 11Naphthalene-d8 Check 500 85 14 18 93 12 14Naphthalene 1000 95 11 22 95 9 161,2,3-Trichlorobenzene 500 88 8 23 96 9 18N-Nitrosodibutylamine 3350 25 99 19 25 115 122-Methylnaphthalene 3350 194 21 74 96 23 261-Methylnaphthalene-d10 Beta 1000 -- -- -- -- -- --

TABLE 9(continued)
Revision 0February 20078261 - 59
aCalibration standards were prepared using 5 mL of water as the matrix.bCalibration standards were prepared using 1 g of tuna as the matrix.c1-g samples were spiked, mixed ultrasonically, and allowed to equilibrate overnight (>1000 min) prior to analysis.dAverage percent recovery of seven replicate analyses of fish tissue taken from canned, water-packed tuna.eRelative standard deviationND = Not determinedInt = Spectral interferences prevented accurate integrations.Cont = The spike could not be distinguished from the background levels.

Revision 0February 20078261 - 60
TABLE 10AEXAMPLE SURROGATE DATA
First Pass Relative Volatility vs. Recovery(Used to Estimate Relative Volatility Effects on BP Surrogates)
Compound Boiling Point Relative Volatility Recovery (%)
Fluorobenzene 40 3.5 99.1
1,2-Dichloroethane-d4 37 20.0 101.2
Recovery vs. Boiling Point(First-Pass Relative Volatility Corrections)
Compound Boiling Point Relative Volatility Recovery (%)
Toluene-d8 111 4.28 102.0
Chlorobenzene-d5 131 6.27 101.3
Bromobenzene-d5 155 7.93 102.8
1,2-Dichlorobenzene-d4 181 8.03 103.2
Decafluorobiphenyl 206 3.03 103.3
1,2,4-Trichlorobenzene-d3 213 7.88 102.8
1-Methylnapthalene-d10 241 67.00 94.0
Slope (% per degree) 0.000143
Recovery at 140 EC 102.2%
Correction coefficient 0.758352
Recovery (BP corrected) vs. Relative VolatilityCompound Boiling Point Relative Volatility Recovery (%)
Hexafluorobenzene 82 0.86 99.7
Pentafluorobenzene 85 1.51 99.2
Fluorobenzene 85 3.50 98.8
1,4-Difluorobenzene 89 3.83 98.7
o-Xylene-d10 143 6.14 100.0
Chlorobenzene-d5 131 6.27 99.5
1,2-Dichloroethane-d4 84 20.00 100.9
1,2-Dibromoethane-d4 131 26.00 101.6
Tetrahydrofuran-d10 66 355.00 103.7
1,4-Dioxane-d8 101 5800.00 97.0
Pyridine-d5 101 15000.00 76.2
Slope (% per ln[rel. vol.]) -0.01363
Recovery at 140 EC 98.2%
Correction coefficient 0.370579

Revision 0February 20078261 - 61
TABLE 10B
EXAMPLE DATA FOR THE ACCURACY OF THE CHECK SURROGATES
Accuracy of Check Surrogates
CompoundBoilingPoint
RelativeVolatility
MeasuredRecovery (%)
Predicted Measured/Predicted Predicted/Measured
Recovery SD Recovery SD Accuracy SD
Purgeable volatiles
Benzene-d6 79 3.92 100.2 98.8 0.1 101.4 0.1 98.6 0.1
Methylene chloride 40 11.10 101.7 100.2 0.2 101.5 0.2 98.5 0.2
1,2-Dichloropropane-d6 95 11.00 101.1 100.9 0.4 100.2 0.3 99.8 0.3
1,1,2-Trichloroethane-d3 112 26.60 103.4 102.9 0.7 100.4 0.6 99.6 0.6
4-Bromofluorobenzene 152 8.05 102.9 102.4 0.4 100.6 0.3 99.4 0.3
Mean ± 1 sigma 101.9 ± 1.2 101.0 1.5 100.8 0.5 99.2 0.5
Semivolatiles
Naphthalene-d8 217 18.00 104.6 102.7 1.1 101.8 1.1 98.2 1.0
Nitrobenzene-d5 210 87.50 107.1 104.7 2.7 102.3 2.6 97.7 2.5
Acetophenone-d5 202 161.00 103.1 107.3 0.2 96.1 0.2 104.0 0.2
Mean ± 1 sigma 104.9 ± 1.6 104.9 8.3 100.1 3.2 100.0 2.9
Non-purgeable volatiles
Ethyl acetate-13C2 77 150.00 106.0 104.0 0.1 101.9 0.1 98.1 0.1
Acetone-d6 57 600.00 106.5 103.2 0.1 103.2 0.1 96.9 0.1
Pyridine-d5 115 15000.00 77.6 82.7 5.3 93.9 6.0 106.5 6.8
Mean ± 1 sigma 96.7 ± 13.5 96.7 7.0 99.6 2.9 100.5 4.3

Revision 0February 2007
Revision 0February 20078261 - 62
FIGURE 1
DIAGRAM OF VACUUM DISTILLATION APPARATUS

Revision 0February 2007
Revision 0February 20078261 - 63
FIGURE 2
EXAMPLE SURROGATE RECOVERY CORRECTION GRAPHS
These graphs illustrate the effects of recovery corrections based on relative volatility and boilingpoint on the results for the target analytes from a 5-mL water sample. Such graphs, inconjunction with the check surrogate data themselves, may provide a means to identify matrixeffects, including those related to specific analytes. See Tables 11A and 11B for examples ofthe surrogate data.