Embed Size (px)
Citation preview

Faculty of Bioscience EngineeringHilde Vandecasteele – 23 June 2009
Methanisering voor Power to Gas: een case studie
Methanisation for Power to Gas: a case study

Content of presentation• Biogas upgrading• Biological upgrading• Assets for West-Flanders• Casestudies

Biogas upgrading - compositionComponent Hoeveelheid Effect(en)
CH4 45 – 85 Vol% Energy carrier
CO2 25 – 50 Vol% Lowering caloric value
Better methane number
Can produce corrosive
hydrogencarbonate in combination with
water.
H2S 0 – 2 Vol% Corrosive
Highly damaging to motor
SO2 < 0,1 Vol% Noxious emission
N2O 0 – 5 Vol% Lowering motor preformance
Waterdamp 1 – 5 Vol% Corrosion
Dangerous when freezing
O2 0 – 2 Vol% Explosive
N2 0 – 2 Vol% Inert
siloxanen 0 – 50 mg/m³ Abrasive depositions of SiO2
stofdeeltjes Clugs pipes, etc

Biogas upgradingThree Strategies
1. Removing the CO22. Addition of reduced substrates in the reactor 3. Additional post-methanation (chemical of biological)

Biological upgrading - Partial pressureLaw of Henry: p = kh*c
Henry-constants biogas components:
• CO2 0.35 mol/kg*MPa• NH3 610 mol/kg*MPa• H2 0.0078 mol/kg*MPa• CH4 0.014 mol/kg*Mpa

Biological upgrading – direct H2 injection (strategy 2)
• Strevett et al. 1995• Luo et al. 2011• Casier, 2012• Voets (2013) – onderzoek HOWEST
How to inject H2 is the problem due to low solubility

Biological upgrading – specific reactor (strategy 3)
• Cfr. Syngas (CO en H2) research preformed• CSRT looks the most logical (Rittmann et al. 2013)• 3 cases
• Electrochaea• Krajete• MicrobEnergy

Biological upgrading

Assets for (West)-Flanders

Assets of (West)-Flanders
Biogasinstallation Municipality Installed power(kWe)
Permit capacity (ton/a)
Agrikracht Moorslede Moorslede 1.486 48.000Agrikracht Rumbeke Rumbeke 835 35.000Ampower Egem 7.445 180.000Barts Potato Company Vleteren 1.666 60.000Bio-Electric bvba Beernem 2.461 60.000Biomass Center (Ieper) bvba Ieper 2.085 50.000Digrom Energy nv Ardooie 1.486 44.000IVVO Ieper 1.408 50.000Leiestroom nv Menen 4.500 95.000Senergho bvba Hooglede 1.064 45.000Shanks Vlaanderen Roeselare 4.024 40.000Veurne Snack Foods Veurne 732 7.500Waterleau New Energy Ieper 3.192 120.000

Nutrient issues for West-Flanders
CasestudyTechnical-economical model:
• 2 scenario’s• Buffering of hydrogen
Selection of feasible sites:

Casestudy- Calculations (model)

Casestudy- Calculations (model)Input ElektrolyseElektriciteit inname van net draaiuren/jaar (elektrolyser) draaiuren (waterstofbuffer) draaiuren/jaar (methanatie) draaiuren/jaar (vergister‐biogas) specifiek grondgebruik elektrolyse specifiek grondgebruik methanatie
grootte elektrolyser ogenblikkelijke waterstofproductie zuurstofproductie waterbehoefte elektrolyser watertransport met gas totaal energie inname/jaar totaal waterstof/jaar totaal zuurstof/jaar totaal waterbehoefte/jaar grondgebruik elektrolyse
Waterstofbuffer Methanatie gemiddeld daggebruik buffer technische buffer gemiddelde waterstofoutput gebufferde waterstof
grootte methanatie unit waterproductie methanatie methaanproductie uit waterstof koolstofdioxide voor methanatie waterstof niet omgezet koolstofdioxide niet omgezet biogas aanvoer voor methanatie niet omgezet gas in methanatie zuiverheid gas uit methanatie
Onderdeel CAPEX OPEXElektrolyse 1000 €/kW 4,5% van CAPEX Waterstofbuffer 44 €/Nm³ 0,04494 €/Nm³ Methanatie 500 €/Nm³ reactor 10% van CAPEX Voorbereidingskosten werken 5% investering n.v.t.Inkomsten Methaan 0,535 €/Nm³ Zuurstof 0,8 €/Nm³

Economical goals set:
Debt/equity = 75/25IRR = 12%Loan = 10 years
Outcome: electricity price
Casestudy- Calculations (model)

Casestudy - Hydrogen buffering Off peak production
‐250
‐200
‐150
‐100
‐50
0
50
100
0 6 12 18 24
Price (€/M
Wh)
Time (h)
June 16 ‐ 2013
October 19 ‐ 2013
December 31 ‐ 2013

Casestudy - Scenario 1: Decentralized650 Nm³/h biogas (60% CH4)
No buffer 2/3 buffer
electrolyser 6000 kW 18000 kWInstant hydrogenproduction
1083 Nm³/h 3251 Nm³/h
Oxygen production 541 Nm³/h 1625 Nm³/hMethane productionfrom H2
261Nm³/h
Reactor volume 1390 m³CAPEX 7.172.965 € 20.980.706 €OPEX 4.211.957 € in year1 4.787.464 € in year 1Income 5.023.354 € in year 1 5.023.354 € in year 1Electricity price cap 0,07323 €/kWh 0,02707 €/kWh

Casestudy - Scenario 2: Centralized2000 Nm³/h biogas (60% CH4)Scale advantage: 10%
No buffer 2/3 buffer
electrolyser 18250 kW 54750 kWInstant hydrogenproduction
3297 Nm³/h 9890 Nm³/h
Oxygen production 1648 Nm³/h 4945 Nm³/hMethane productionfrom H2
795 Nm³/h
Reactor volume 4228 m³CAPEX 19.834.336€ 58.014.831 €OPEX 13.035.732 € in year 1 8.716.799 € in year 1Income 15.279.368 € in year 1 15.279.368 € in year 1Electricity price cap 0,08279 €/kWh 0,03663 €/kWh

Selection of feasible sites
Location Installed wind power (MW) Installed solar power(installations >10kW)(MW)
Roeselare-Beveren 4 MWe
Izegem: 12,6 13,7Izegem: 2,6
Menen 4,5 MWe 4,6 7,5
Ieper 6,6 MWe 20,7 9,1
Pittem 7,45 MWe 0 2,5

Casestudy - Selection of feasible sites
Roeselare
Ieper

Casestudy - Roeselare• Shanks Vlaanderen• Next to Mandel river• 4 Mwe• 587 Nm²/h biogas• 32,5% CO2

Casestudy - RoeselareFairly the same as scenario 1
No buffer 2/3 buffer
electrolyser 4400 kW 13200 kWInstant hydrogenproduction
795 Nm³/h 2385 Nm³/h
Oxygen production 397 Nm³/h 1192 Nm³/hMethane productionfrom H2
192Nm³/h
Reactor volume 641 m³CAPEX 5.026.310 € 15.081.986 €OPEX 3.115.222 € in jaar 1 1.977.736€ in jaar 1Income 3.683.793 € in jaar 1 3.683.793 € in jaar 1Electricity price cap 0,07447 €/kWh 0,02860 €/kWh

Casestudy - IeperBiomass Center Ieper – 2,1 MweWaterleau – 3,1 MweIVVO – 1,4 Mwe
900 Nm³/h biogas 40% CO2 - estimated
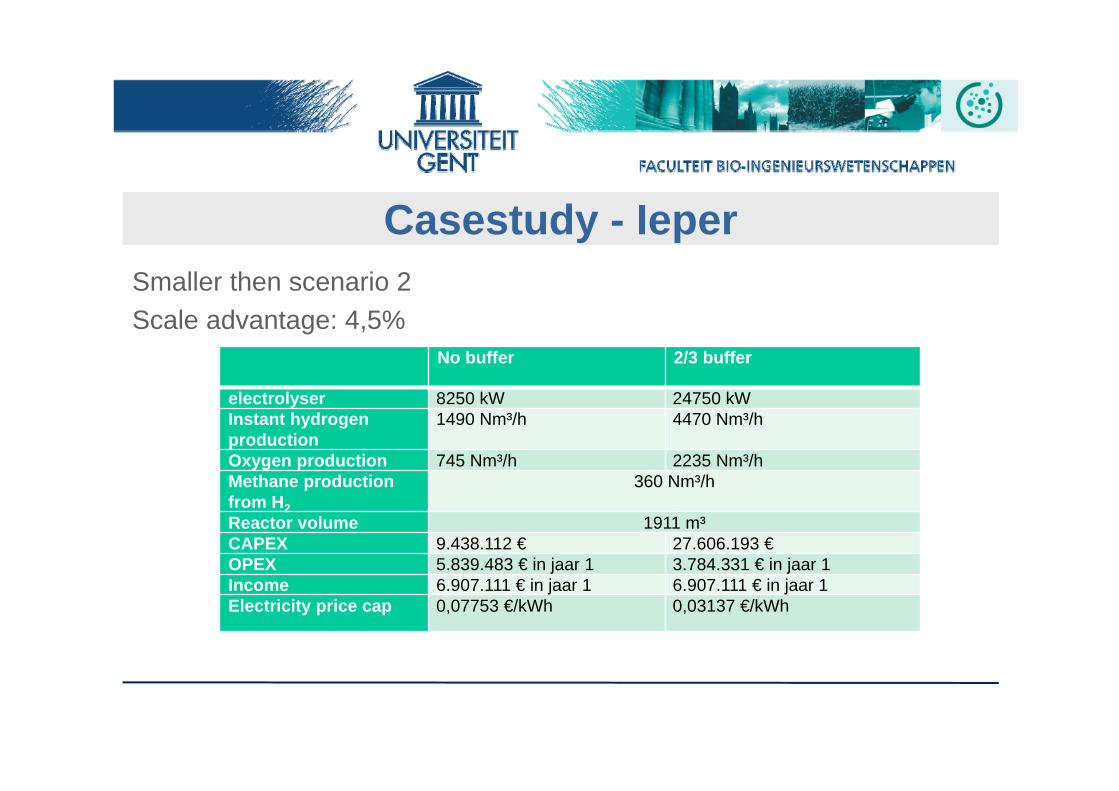
Casestudy - IeperSmaller then scenario 2 Scale advantage: 4,5%
No buffer 2/3 buffer
electrolyser 8250 kW 24750 kWInstant hydrogenproduction
1490 Nm³/h 4470 Nm³/h
Oxygen production 745 Nm³/h 2235 Nm³/hMethane productionfrom H2
360 Nm³/h
Reactor volume 1911 m³CAPEX 9.438.112 € 27.606.193 €OPEX 5.839.483 € in jaar 1 3.784.331 € in jaar 1Income 6.907.111 € in jaar 1 6.907.111 € in jaar 1Electricity price cap 0,07753 €/kWh 0,03137 €/kWh

General SWOT Strenghts
• Staffed and experienced personnel in biological processes
• Cluster: risk spreading, scale advantage, input/output flexibility
Weaknesses
• Bad investment climate in biogas sector
• Long term strategies missing in most biogas companies
• Costs of electrolysis• Market readiness• Land use
Opportunities
• Increasing power of solar and wind• Good natural gas grid• Available fleet for biomethane
valorization• Market changes – adding flexibility
Threats
• Competition for other hydrogen purposes
• Competition with fysicochemicalbiogas upgrading
Cluster: internal competition, crossing public domain

QUESTIONS?
University of Ghent - LiWet
Jonathan De [email protected]@biogas-e.be+32(0)476509253
www.biogas-e.be