Embed Size (px)
Citation preview
Metamorphic Petrology
GIBBS from Frank Spear. The Gibbs method is a procedure that computes changes in a set of dependent thermodynamic variables given the changes in a set of independent thermodynamic variables. The thermodynamic variables are the derivatives of T (temperature), P (pressure), X (composition) and, if desired, M (the number of moles of a phase in an assemblage). For Macintosh.
TWQ Web page. Rob Berman's thermobarometry program, data base, and activity calculations. For DOS.
Software for calculating the volume and fugacity of CO2 at specified P and T using the Mäder and Berman (1991) equation of state.
Cambridge Earth Sciences Software or THERMOCALC Web page. Tim Holland's and Roger Powell's THERMOCALC program and data base, activity calculations and more. Versions for Macintosh and DOS. Includes a variety of activity models. Dave Waters at Oxford is building a useful Tutorial on Mineral Thermobarometry based on this software.
BAYES homepage Bayes is an internally consistent thermodynamic dataset and an interactive program to generate petrological phase diagrams.
Internally consistent data set for rock-froming minerals from Matthias Gottschalk at GFZ Potsdam. Based on iterative evaluation of 1/T - lnKred plots.
THERIAC-DOMINO and related programs. Web page from Christian de Capitani. Calculation of equilibrium assemblages, thermodynamic properties, and various types of phase diagram. Uses the TWQ data base. Fortran source.
WEBINVEQ Terry Gordon's experimental Web system for performing thermobarometry calculations over the Web. Currently uses the TWQ 1.02 data base.
PERPLEX Web page. Jamie Connolly's Fortran programs for calculating and displaying petrologic phase equilibria. Source and binaries for many platforms.
EQMIN. A Microsoft® Excel© spread sheet to perform thermodynamic calculations. J.D. Martin. Computers and Geosciences, v. 22, 639-650, 1996. Available by ftp.
GPT An Excel Spreadsheet for thermobarometric calculations in metapelitic rocks. 905K in sea.hqx (Mac) format. J.Reche & F.J. Martinez. Described in Computers & Geosciences Vol.22, No. 7, pp. 775-784.
Garnet-Cordierite-Spinel-Sillimanite/Kyanite-Quartz thermobarometry from Geoff Nichols.
Software and Data for Thermodynamics and Phase Equilibrium Calculations in Geology
http://people.ucalgary.ca/~gordon/thermo_links.html
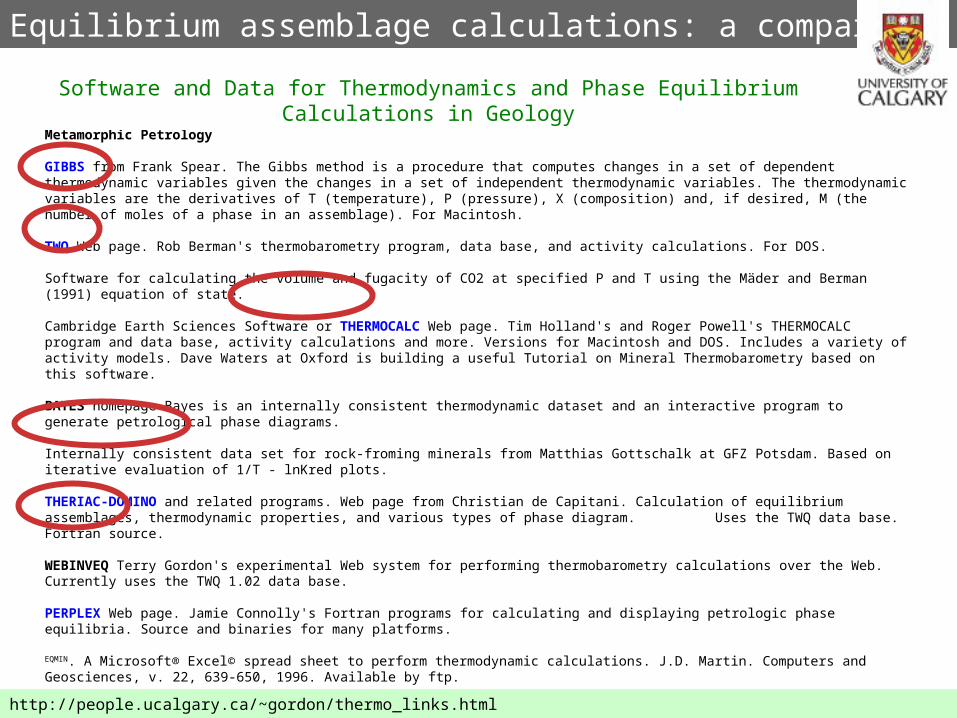
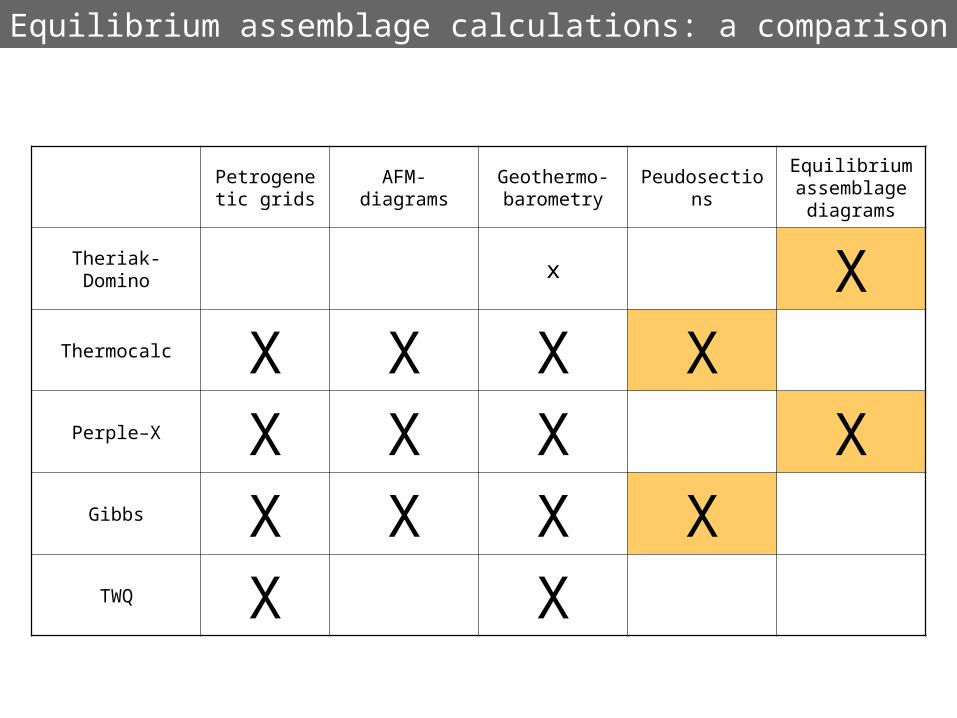
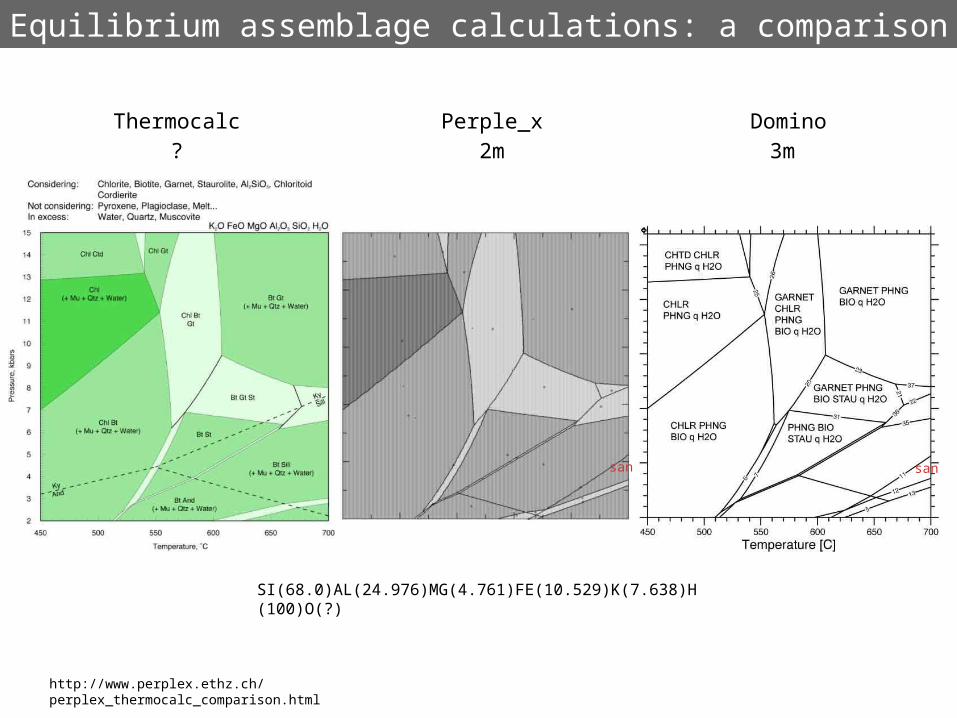
Equilibrium assemblage calculations: a comparison
Petrogenetic grids
AFM-diagramsGeothermo-barometry
PeudosectionsEquilibrium assemblage
diagrams
Theriak-Domino x XThermocalc X X X X
Perple–X X X X XGibbs X X X XTWQ X X
Equilibrium assemblage calculations: a comparison
Equilibrium assemblage calculations: a comparison
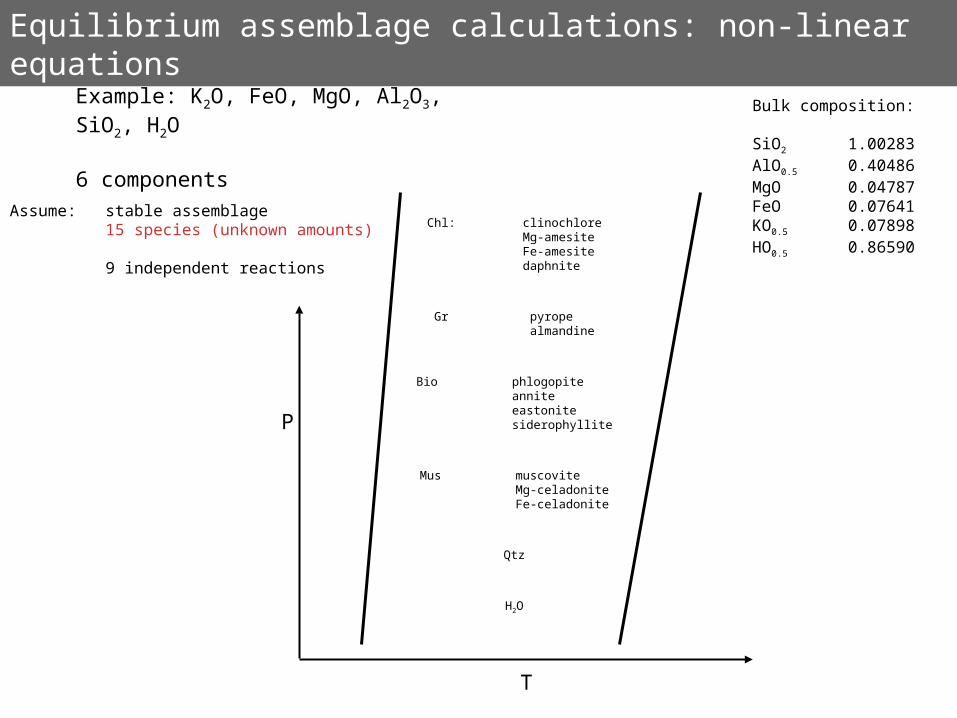
Equilibrium assemblage calculations: non-linear equations
Example: K2O, FeO, MgO, Al2O3, SiO2, H2O
6 components
Chl: clinochloreMg-amesiteFe-amesitedaphnite
Gr pyropealmandine
Bio phlogopiteanniteeastonitesiderophyllite
Qtz
H2O
Mus muscoviteMg-celadoniteFe-celadonite
Assume: stable assemblage15 species (unknown amounts)
9 independent reactions
Bulk composition:
SiO2 1.00283AlO0.5 0.40486MgO 0.04787FeO 0.07641KO0.5 0.07898HO0.5 0.86590
P
T
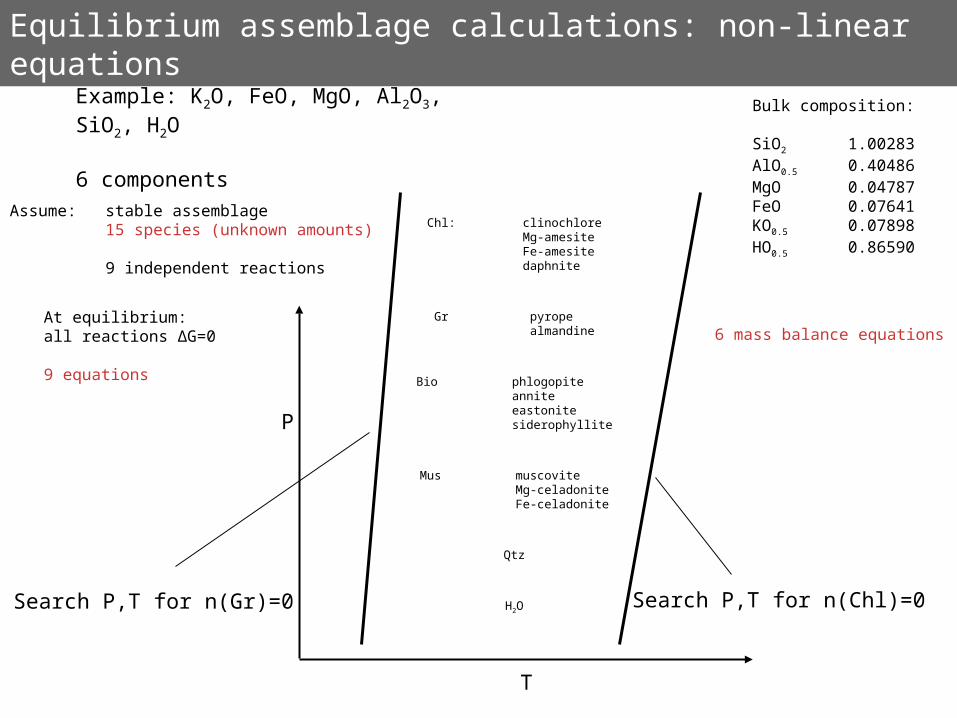
Equilibrium assemblage calculations: non-linear equations
Example: K2O, FeO, MgO, Al2O3, SiO2, H2O
6 components
Chl: clinochloreMg-amesiteFe-amesitedaphnite
Gr pyropealmandine
Bio phlogopiteanniteeastonitesiderophyllite
Qtz
H2O
Mus muscoviteMg-celadoniteFe-celadonite
Assume: stable assemblage15 species (unknown amounts)
9 independent reactions
At equilibrium:all reactions ∆G=0
9 equations
6 mass balance equations
Search P,T for n(Gr)=0 Search P,T for n(Chl)=0
P
T
Bulk composition:
SiO2 1.00283AlO0.5 0.40486MgO 0.04787FeO 0.07641KO0.5 0.07898HO0.5 0.86590
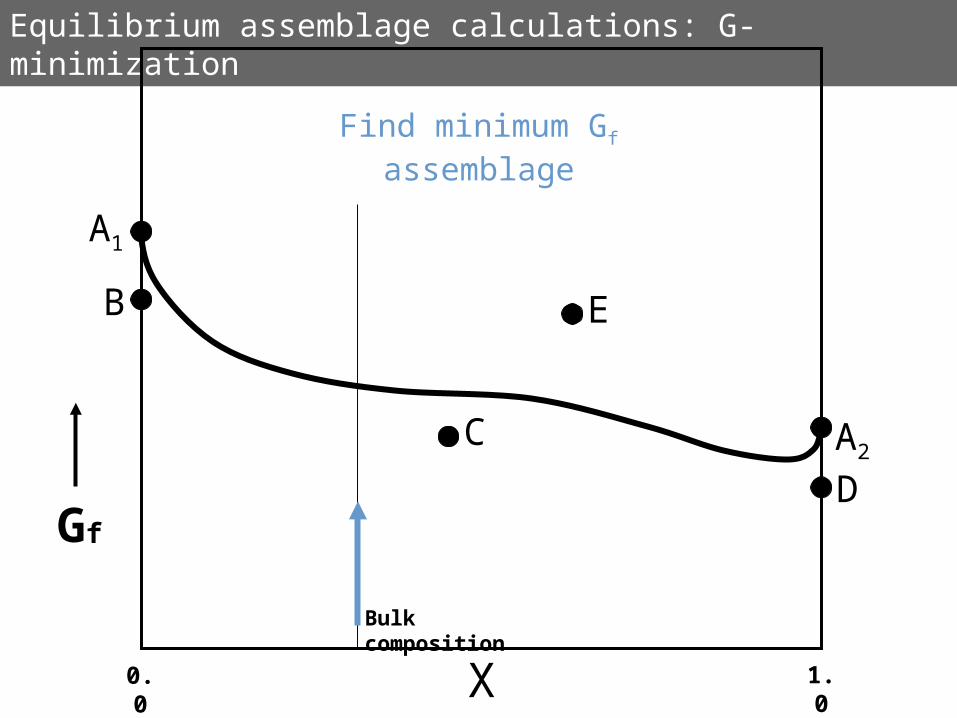
Equilibrium assemblage calculations: G-minimization
X0.0 1.0
Gf
B
A1
C A2
Find minimum Gf assemblage
Bulk composition
D
E
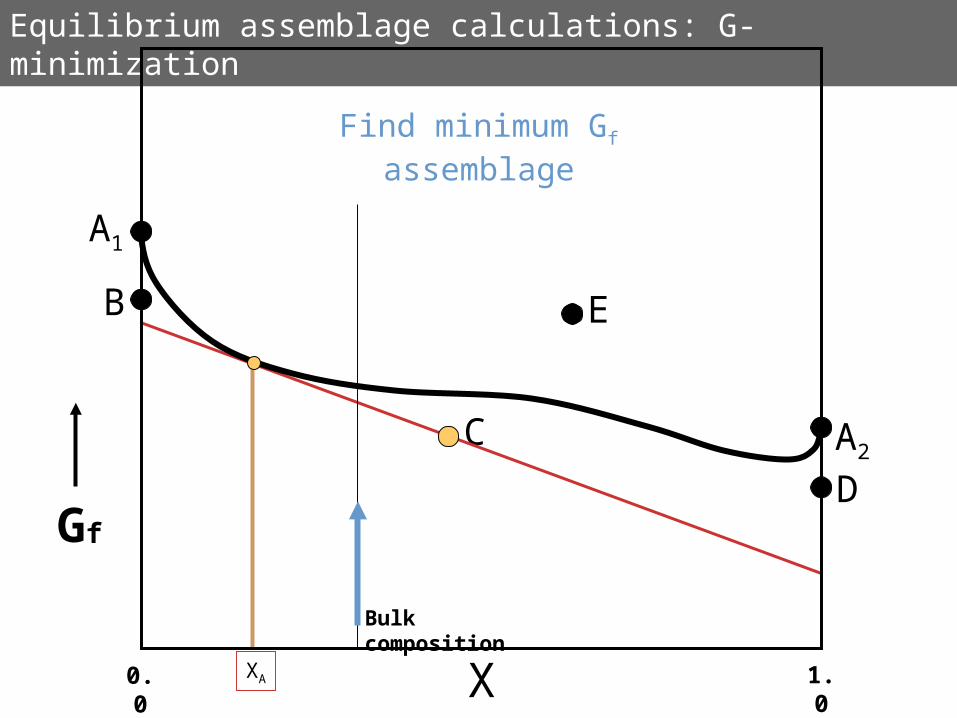
Equilibrium assemblage calculations: G-minimization
X0.0 1.0
Gf
B
A1
C A2
Find minimum Gf assemblage
Bulk composition
XA
D
E

Petrogenetic grids
AFM-diagramsGeothermo-barometry
PeudosectionsEquilibrium assemblage
diagrams
Theriak-Domino x XThermocalc X X X X
Perple–X X X X XGibbs X X X XTWQ X X
Equilibrium assemblage calculations: a comparison
Thermocalc
?
Perple_x
2m
Domino
3m
http://www.perplex.ethz.ch/perplex_thermocalc_comparison.html
SI(68.0)AL(24.976)MG(4.761)FE(10.529)K(7.638)H(100)O(?)
Equilibrium assemblage calculations: a comparison
san san
+cord
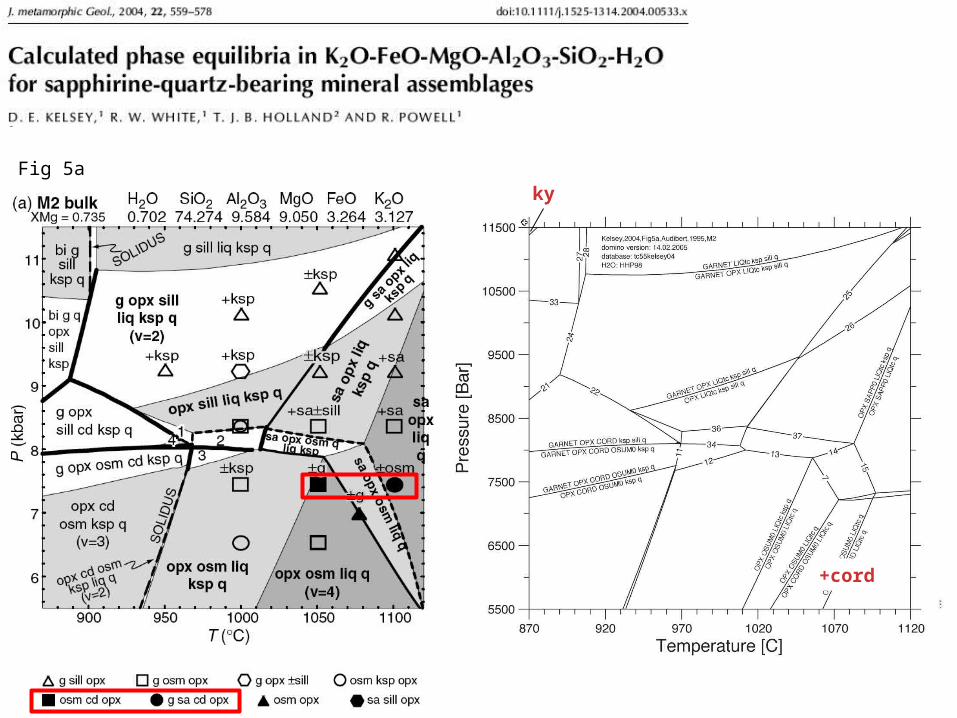
Fig 5aky
FSP GARNET PHNG BIO STAU q H2O
+ H2O, q, pl
+ pg
+ c
hl+ s
t
+ Kfsp
FS
P G
AR
NE
T P
HN
G B
IO S
TA
U q + c
hl
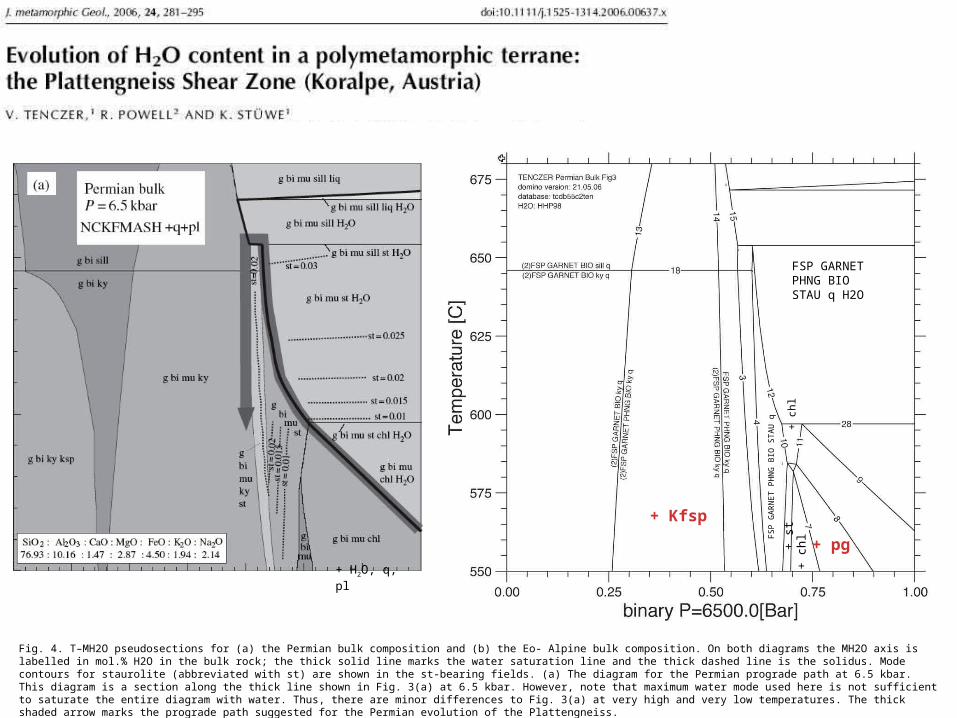
Fig. 4. T–MH2O pseudosections for (a) the Permian bulk composition and (b) the Eo- Alpine bulk composition. On both diagrams the MH2O axis is labelled in mol.% H2O in the bulk rock; the thick solid line marks the water saturation line and the thick dashed line is the solidus. Mode contours for staurolite (abbreviated with st) are shown in the st-bearing fields. (a) The diagram for the Permian prograde path at 6.5 kbar. This diagram is a section along the thick line shown in Fig. 3(a) at 6.5 kbar. However, note that maximum water mode used here is not sufficient to saturate the entire diagram with water. Thus, there are minor differences to Fig. 3(a) at very high and very low temperatures. The thick shaded arrow marks the prograde path suggested for the Permian evolution of the Plattengneiss.
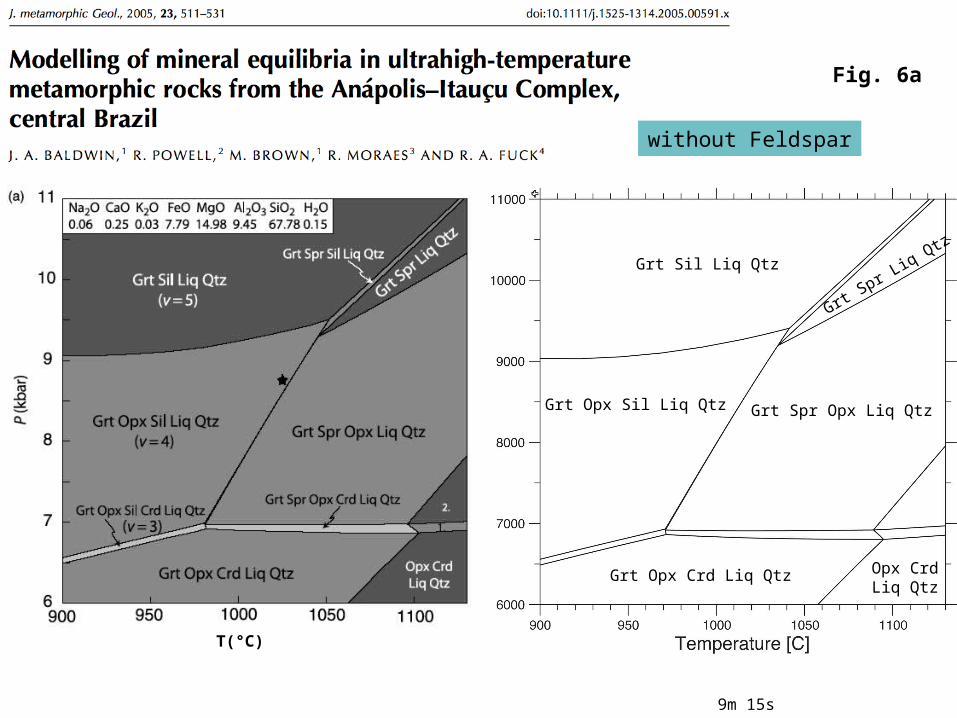
9m 15s
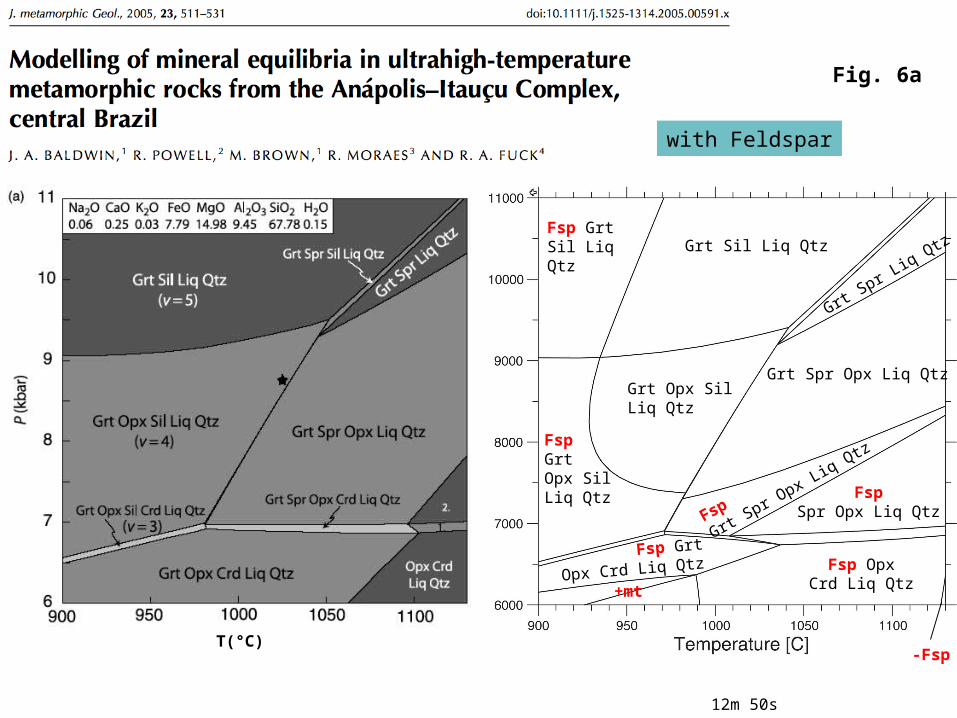
Fig. 6a
T(°C)
Grt Sil Liq Qtz
Grt Spr L
iq Qtz
Grt Spr Opx Liq Qtz
Grt Opx Crd Liq Qtz
Grt Opx Sil Liq Qtz
Opx CrdLiq Qtz
without Feldspar
12m 50s
T(°C)
Grt Sil Liq Qtz
Grt Spr L
iq Qtz
Grt Spr Opx Liq QtzGrt Opx SilLiq Qtz
Fsp GrtSil LiqQtz
FspGrtOpx SilLiq Qtz
Fsp
Grt Spr O
px Liq Qtz
FspSpr Opx Liq Qtz
Fsp OpxCrd Liq Qtz
Fsp Grt
Opx Crd Liq Qtz
+mt
-Fsp
Fig. 6a
with Feldspar

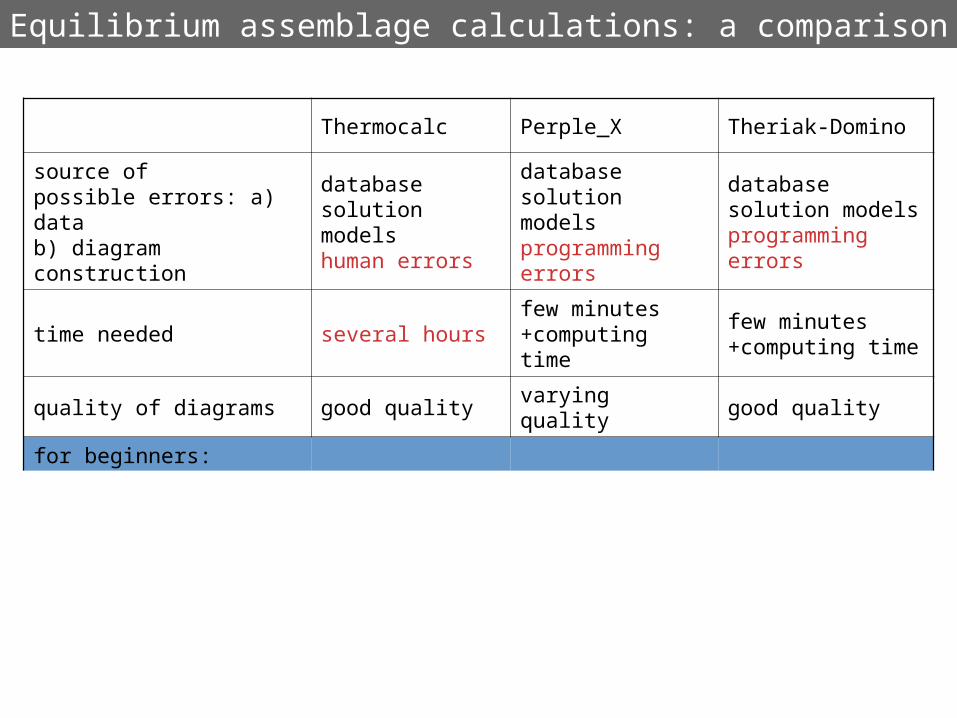
Thermocalc Perple_X Theriak-Domino
source ofpossible errors: a) datab) diagram construction
databasesolution modelshuman errors
databasesolution modelsprogramming errors
databasesolution modelsprogramming errors
time needed several hoursfew minutes+computing time
few minutes+computing time
quality of diagrams good quality varying quality good quality
for beginners:(using a standard database)
learning how to use hopeless reasonably easy reasonably easy
probability of success 0 10% 10%
advanced users
choice of database no several choices few choices
choice of solution models cut-and-paste predefined cut-and-paste
define new solution models difficult moderately easy easy
probability of success ? 30% 30%
Equilibrium assemblage calculations: a comparison
Thermocalc Perple_X Theriak-Domino
source ofpossible errors: a) datab) diagram construction
databasesolution modelshuman errors
databasesolution modelsprogramming errors
databasesolution modelsprogramming errors
time needed several hoursfew minutes+computing time
few minutes+computing time
quality of diagrams good quality varying quality good quality
for beginners:(using a standard database)
learning how to use hopeless reasonably easy easy
probability of success 0 10% 10%
advanced users
choice of database no several choices few choices
choice of solution models cut-and-paste predefined cut-and-paste
define new solution models difficult moderately easy easy
probability of success ? 30% 30%
Equilibrium assemblage calculations: a comparison

Thermocalc Perple_X Theriak-Domino
source ofpossible errors: a) datab) diagram construction
databasesolution modelshuman errors
databasesolution modelsprogramming errors
databasesolution modelsprogramming errors
time needed several hoursfew minutes+computing time
few minutes+computing time
quality of diagrams good quality varying quality good quality
for beginners:(using a standard database)
learning how to use hopeless reasonably easy easy
probability of success 0 10% 10%
advanced users
choice of database no several choices few choices
choice of solution models cut-and-paste predefined cut-and-paste
define new solution models difficult moderately easy easy
probability of success 30% 30% 30%
Equilibrium assemblage calculations: a comparison

Dave Hirsch, Western Washington University and Julie Baldwin, University of Montana
http://serc.carleton.edu/research_education/equilibria/advancedmodeling.html
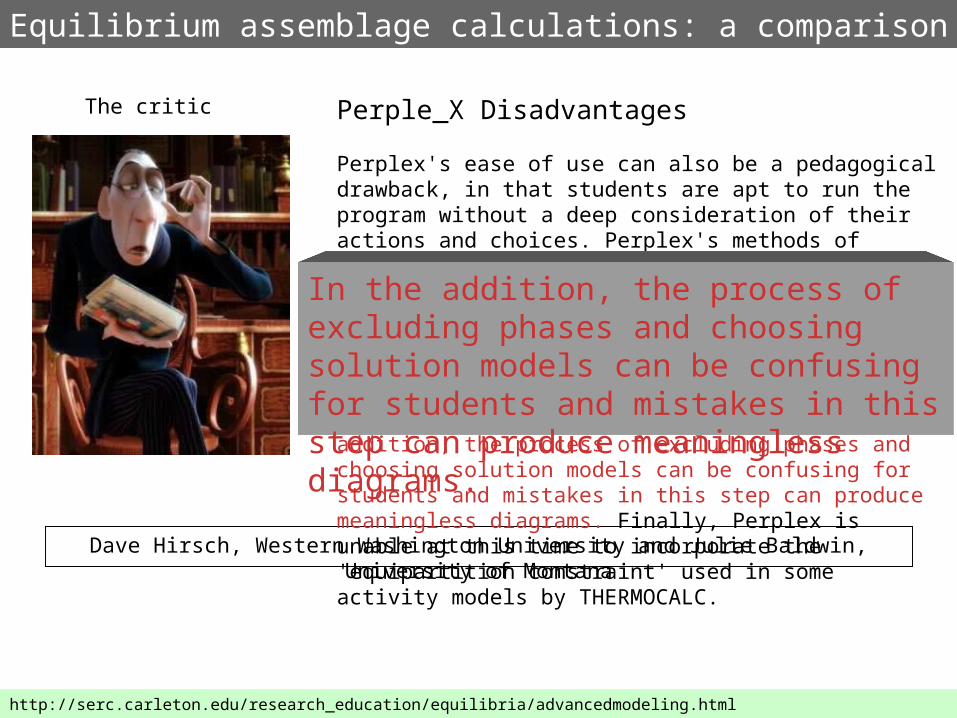
Perple_X Disadvantages
Perplex's ease of use can also be a pedagogical drawback, in that students are apt to run the program without a deep consideration of their actions and choices. Perplex's methods of computation (calculation on a grid, division of solutions into discrete pseudocompounds) typically introduces small artifacts (akin to pixelization in an image) and may fail to identify features that are in close proximity to each other, leading to portions of diagrams that sometimes violate the Phase Rule. In the addition, the process of excluding phases and choosing solution models can be confusing for students and mistakes in this step can produce meaningless diagrams. Finally, Perplex is unable at this time to incorporate the 'equipartition constraint' used in some activity models by THERMOCALC.
The critic
Equilibrium assemblage calculations: a comparison

Dave Hirsch, Western Washington University and Julie Baldwin, University of Montana
Perple_X Disadvantages
Perplex's ease of use can also be a pedagogical drawback, in that students are apt to run the program without a deep consideration of their actions and choices. Perplex's methods of computation (calculation on a grid, division of solutions into discrete pseudocompounds) typically introduces small artifacts (akin to pixelization in an image) and may fail to identify features that are in close proximity to each other, leading to portions of diagrams that sometimes violate the Phase Rule. In the addition, the process of excluding phases and choosing solution models can be confusing for students and mistakes in this step can produce meaningless diagrams. Finally, Perplex is unable at this time to incorporate the 'equipartition constraint' used in some activity models by THERMOCALC.
The critic
Equilibrium assemblage calculations: a comparison
Perplex's ease of use can also be a pedagogical drawback, in that students are apt to run the program without a deep consideration of their actions and choices.
http://serc.carleton.edu/research_education/equilibria/advancedmodeling.html
Dave Hirsch, Western Washington University and Julie Baldwin, University of Montana
Perple_X Disadvantages
Perplex's ease of use can also be a pedagogical drawback, in that students are apt to run the program without a deep consideration of their actions and choices. Perplex's methods of computation (calculation on a grid, division of solutions into discrete pseudocompounds) typically introduces small artifacts (akin to pixelization in an image) and may fail to identify features that are in close proximity to each other, leading to portions of diagrams that sometimes violate the Phase Rule. In the addition, the process of excluding phases and choosing solution models can be confusing for students and mistakes in this step can produce meaningless diagrams. Finally, Perplex is unable at this time to incorporate the 'equipartition constraint' used in some activity models by THERMOCALC.
The critic
Equilibrium assemblage calculations: a comparison
In the addition, the process of excluding phases and choosing solution models can be confusing for students and mistakes in this step can produce meaningless diagrams.
http://serc.carleton.edu/research_education/equilibria/advancedmodeling.html

http://serc.carleton.edu/research_education/equilibria/advancedmodeling.html
Perplex's ease of use can also be a pedagogical drawback, in that students are apt to run the program without a deep consideration of their actions and choices.
In the addition, the process of excluding phases and choosing solution models can be confusing for students and mistakes in this step can produce meaningless diagrams.
Is ease of use a drawback?
Is selection of phases and solution models a capital sin?