Embed Size (px)
Citation preview

1
Metals Conservation Summer Institute
Yancy W. Riddle, PhDUCT CoatingsStuart, Florida USA
Adapted from: Prof. Diran Apelian, WPI

2
REFERENCES
Science and Design of Engineering MaterialsJames P. Schaffer, Ashok Saxena, Thomas H. Sanders, Stephen D. Antolovich,Steven B. Warner
Materials Science and Engineering : An Introduction by William D. Jr. Callister

3
Phases in Metallic Alloys and Use of Phase Diagrams

4
Processing
MicrostructureProperties
Performance

5
OUTLINE• What is a phase?• Basis of phase diagrams• What do phase diagrams tell us?
- how do you use them?- equilibrium versus non-equilibrium
• Complete Solid Solubility Systems• Systems with no complete solid solubility• Invariant transformations
- eutectic; peritectic; eutectoid• Examples - uses of phase diagrams
- Pb-Sn system- Fe-C system
•Modern navigation tools

6
Pb-Sn system
7
When we combine two elements...
• In particular, if we specify...--a composition (e.g., wt%Cu - wt%Ni), and--a temperature (T)
then...How many phases do we get?What is the composition of each phase?How much of each phase do we get?
Phase BPhase A
Nickel atomCopper atom

8
OUTLINE• What is a phase?• Basis of phase diagrams• What do phase diagrams tell us?
- how do you use them?- equilibrium versus non-equilibrium
• Complete Solid Solubility Systems• Systems with no complete solid solubility• Invariant transformations
- eutectic; peritectic; eutectoid• Examples - uses of phase diagrams
- Pb-Sn system- Fe-C system
•Modern navigation tools

9
• Solubility Limit:Max concentration forwhich only a solutionoccurs.
• Ex: Phase Diagram:Water-Sugar System
Question: What is thesolubility limit at 20C?
Answer: 65wt% sugar.If Co < 65wt% sugar: sugarIf Co > 65wt% sugar: syrup + sugar.
• Solubility limit increases with T:e.g., if T = 100C, solubility limit = 80wt% sugar.
Pu
re
Su
ga
r
Te
mp
era
ture
(°C
)
0 20 40 60 80 100Co=Composition (wt% sugar)
L (liquid solution
i.e., syrup)
Solubility Limit L
(liquid)
+ S
(solid sugar)
65
20
40
60
80
100
Pu
re
Wa
ter
THE SOLUBILITY LIMIT

10
• Components:The elements or compounds which are mixed initially
(e.g., Al and Cu)• Phases:
The physically and chemically distinct material regionsthat result (e.g., α and β).
Aluminum-CopperAlloy
α (darker phase)
β (lighter phase)
Adapted from Fig. 9.0, Callister 3e.
COMPONENTS AND PHASES

11
• Changing T can change # of phases: path A to B. • Changing Co can change # of phases: path B to D.
• water-sugarsystem
70 80 1006040200
Te
mp
era
ture
(°C
)
Co=Composition (wt% sugar)
L (liquid solution
i.e., syrup)
A(70,20) 2 phases
B(100,70) 1 phase
20
100
D(100,90) 2 phases
40
60
80
0
L (liquid)
+ S
(solid sugar)
EFFECT OF T & COMPOSITION (Co)

12
• Tell us about phases as function of T, Co, P. • For practical considerations, P=1atm
--binary systems: just 2 components.--independent variables: T and Co (P = 1atm is always used).
• PhaseDiagramfor Cu-Nisystem
• 2 phases: L (liquid) α (FCC solid solution)
• 3 phase fields: L L + αα
wt% Ni20 40 60 80 10001000
1100
1200
1300
1400
1500
1600T(°C)
L (liquid)
α (FCC solid solution)
L + αliquidus
solidus
PHASE DIAGRAMS

13
• Rule 1: If we know T and Co, then we know:--the # and types of phases present.
• Examples:
wt% Ni20 40 60 80 10001000
1100
1200
1300
1400
1500
1600T(°C)
L (liquid)
α (FCC solid solution)
L + α
liquidus
solidus
A(1100,60)B
(12
50
,35
) Cu-Niphase
diagram
A(1100, 60): 1 phase: α
B(1250, 35): 2 phases: L + α
PHASE DIAGRAMS: # and types of phases
14
• Rule 2: If we know T and Co, then we know:--the composition of each phase.
• Examples:
wt% Ni20
1200
1300
T(°C)
L (liquid)
α(solid)L + α
liquidus
solidus
30 40 50
TAA
DTD
TBB
tie line
L + α
433532CoCL Cα
Cu-Ni system
At TA:
Only Liquid (L) CL = Co ( = 35wt% Ni)
At TB:
Both α and L CL = Cliquidus ( = 32wt% Ni here)
Cα = Csolidus ( = 43wt% Ni here)
At TD:
Only Solid (α) Cα = Co ( = 35wt% Ni)
Co = 35wt%Ni
PHASE DIAGRAMS: composition of phases

15
• Rule 3: If we know T and Co, then we know:--the amount of each phase (given in wt%).
Cu-Nisystem• Examples:
At TB: Both α and L
At TA: Only Liquid (L)
WL = 100wt%, Wα = 0At TD: Only Solid (α)
WL = 0, Wα = 100wt%
Co = 35wt%Ni
WL = SR + S
Wα = RR + S
=
43 − 3543 − 32
= 73wt %
= 27wt%wt% Ni
20
1200
1300
T(°C)
L (liquid)
α (solid)
L + α
liquidus
solidus
30 40 50
TAA
DTD
TBB
tie line
L + α
433532CoCL Cα
R S
PHASE DIAGRAMS: weight fractions of phases

16
OUTLINE• What is a phase?• Basis of phase diagrams• What do phase diagrams tell us?
- how do you use them?- equilibrium versus non-equilibrium
• Complete Solid Solubility Systems• Systems with no complete solid solubility• Invariant transformations
- eutectic; peritectic; eutectoid• Examples - uses of phase diagrams
- Pb-Sn system- Fe-C system
•Modern navigation tools

17
• Phase diagram:Cu-Ni system.
• System is:--binary
i.e., 2 components:Cu and Ni.
--isomorphousi.e., completesolubility of onecomponent inanother; α phasefield extends from0 to 100wt% Ni.
wt% Ni20
1200
1300
30 40 501100
L (liquid)
α (solid)
L + α
L + α
T(°C)
A
D
B
35Co
L: 35wt%Ni
α: 46wt%Ni
C
E
L: 35wt%Ni
464332
24
35
36α: 43wt%Ni
L: 32wt%Ni
L: 24wt%Ni
α: 36wt%Ni
• ConsiderCo = 35wt%Ni.
Cu-Nisystem
EX: COOLING IN A Cu-Ni BINARY

18
• Cα changes as we solidify.• Cu-Ni case:
• Fast rate of cooling:Cored structure
• Slow rate of cooling:Equilibrium structure
First α to solidify has Cα = 46wt%Ni.Last α to solidify has Cα = 35wt%Ni.
First α to solidfy: 46wt%Ni
Uniform Cα:
35wt%Ni
Last α to solidfy: < 35wt%Ni
CORED VS EQUILIBRIUM PHASES

19
Partitioning &Conservation of Mass

20
Mushy (Multi-Phase) Region

21
SOLID LIQUID
region of interest

22

23

24
• Effect of solid solution strengthening on:
--Tensile strength (TS) --Ductility (%EL,%AR)
--Peak as a function of Co --Min. as a function of Co
MECHANICAL PROPERTIES: Cu-Ni System
Elo
ng
ati
on
(%
EL
)Composition, wt%Ni
Cu Ni0 20 40 60 80 10020
30
40
50
60
%EL for pure Ni
%EL for pure Cu
Te
nsi
le S
tre
ng
th (
MP
a)
Composition, wt%NiCu Ni0 20 40 60 80 100
200
300
400
TS for pure Ni
TS for pure Cu

25
OUTLINE• What is a phase?• Basis of phase diagrams• What do phase diagrams tell us?
- how do you use them?- equilibrium versus non-equilibrium
• Complete Solid Solubility Systems• Systems without complete solid solubility• Invariant transformations
- eutectic; peritectic; eutectoid• Examples - uses of phase diagrams
- Pb-Sn system- Fe-C system
•Modern navigation tools

26
2 componentshas a special compositionwith a min. melting T.
• 3 single phase regions (L, α, β) • Limited solubility: α: mostly Cu β: mostly Ni • TE: No liquid below TE
• CE: Min. melting T
composition
Ex.: Cu-Ag system
L (liquid)
α L + α L+β β
α + β
Co, wt% Ag 20 40 60 80 100 0
200
1200 T(°C)
400
600
800
1000
CE
TE 8.0 71.9 91.2 779°C
Cu-Agsystem
BINARY-EUTECTIC SYSTEMS
Ag

27
• For a 40wt%Sn-60wt%Pb alloy at 150C, find...--the phases present:
α + β--the compositions of
the phases:
Pb-Snsystem
EX: Pb-Sn EUTECTIC SYSTEM (1)
L + α L+β
α + β
200
T(°C)
18.3
Co, wt% Sn 20 40 60 80 100 0
Co
300
100
β
L (liquid)
α 183°C 61.9 97.8
150

28
• For a 40wt%Sn-60wt%Pb alloy at 150C, find...--the phases present: α + β--the compositions of
the phases:Cα = 11wt%SnCβ = 99wt%Sn
--the relative amountsof each phase:
W α = 59 88
= 67 wt %
W β = 29 88
= 33 wt %
Pb-Snsystem
EX: Pb-Sn EUTECTIC SYSTEM (2)
L + α L+β
α + β
200
T(°C)
18.3
Co, wt% Sn 20 40 60 80 100 0
Co
300
100
L (liquid)
α 183°C 61.9 97.8
150
11 99
R S
β

29
L + α200
T(°C)
Co, wt% Sn10
2
200Co
300
100
L
α
30
L: Cowt%Sn
αL
α: Cowt%Sn
α + β
400
(room T solubility limit)
TE(Pb-Sn System)
• Co < 2wt%Sn• Result:
--polycrystal of α grains.
MICROSTRUCTURESIN EUTECTIC SYSTEMS-I

30
• 2wt%Sn < Co < 18.3wt%Sn• Result:
--α polycrystal with fineβ crystals.
α: Cowt%SnL + α
200
T(°C)
Co, wt% Sn10
18.3
200Co
300
100
L
α
30
L: Cowt%Sn
α + β
400
(sol. limit at TE)
TE
2(sol. limit at Troom)
Lα
αβ
Pb-Snsystem
MICROSTRUCTURESIN EUTECTIC SYSTEMS-II

31
L + α200
T(°C)
Co, wt% Sn
20 400
300
100
L
α
60
L: Cowt%Sn
α + β
TE
α: 18.3wt%Sn
β
080 100
L + β
CE18.3 97.861.9
183°C
β: 97.8wt%Sn160µm
Micrograph of Pb-Sn eutectic microstructure
• Co = CE• Result: Eutectic microstructure
--alternating layers of α and β crystals.
Pb-Snsystem
MICROSTRUCTURESIN EUTECTIC SYSTEMS-III

32
L + α200
T(°C)
Co, wt% Sn
20 400
300
100
L
α
60
L: Cowt%Sn
α + β
TEβ
080 100
L + β
Co18.3 61.9
Lα
Lα
primary α
97.8
S
S
RR
eutectic αeutectic β
Pb-Snsystem
• 18.3wt%Sn < Co < 61.9wt%Sn• Result: α crystals and a eutectic microstructure
• Just above TE:
WL = (1-Wα) =50wt%
Cα = 18.3wt%Sn
CL = 61.9wt%SnS
R + SWα = =50wt%
• Just below TE:Cα = 18.3wt%Sn
Cβ = 97.8wt%SnS
R + SWα = =73wt%
Wβ = 27wt%
MICROSTRUCTURESIN EUTECTIC SYSTEMS-IV

3320
T(°C)
(Pb-Sn System)
L + α200
Co, wt% Sn20 400
300
100
L
α
60
α + β
TE β
080 100
L + β
18.361.9
97.8
Cohypoeutectic
Cohypereutectic
eutectic
hypereutectic: (illustration only)
160µm
eutectic: Co=61.9wt%Sn
175µm
β
ββ
ββ
β
α
α
α
αα
α
hypoeutectic: Co=50wt%Sn
eutectic micro-constituent
Adapted from Fig. 9.7, Callister 6e. (Fig. 9.7 adapted from Binary Phase Diagrams, 2nd ed., Vol. 3, T.B. Massalski (Editor-in-Chief), ASM International, Materials Park, OH, 1990.)
HYPOEUTECTIC & HYPEREUTECTIC

34
OUTLINE• What is a phase?• Basis of phase diagrams• What do phase diagrams tell us?
- how do you use them?- equilibrium versus non-equilibrium
• Complete Solid Solubility Systems• Systems with no complete solid solubility• Invariant transformations
- eutectic; peritectic; eutectoid• Examples - uses of phase diagrams
- Pb-Sn system- Fe-C system
•Modern navigation tools

35
Result: Pearlite = alternating layers of α and Fe3C phases.
120µm
• 2 important points
-Eutectic (A):
-Eutectoid (B): L ⇒ γ + Fe3C
γ ⇒ α +Fe3C
Fe
3C
(c
em
en
tite
)
1600
1400
1200
1000
800
600
4000 1 2 3 4 5 6 6.7
L
γ (austenite)
γ+L
γ+Fe3C
α+Fe3C
α+γ
L+Fe3C
δ
(Fe) Co, wt% C0.77 4.30
727°C = Teutectoid
1148°C
T(°C)
A
B
SR
R S
γ γγγ
Fe3C (cementite-hard)α (ferrite-soft)
αC
eu
tec
toid
IRON-CARBON (Fe-C) PHASE DIAGRAM

36

37
HYPOEUTECTOID STEEL
(Fe-C System)
Co
Fe
3C
(c
em
en
tite
)
1600
1400
1200
1000
800
600
4000 1 2 3 4 5 6 6.7
L
γ (austenite)
γ+L
γ+Fe3C
α+Fe3C
L+Fe3C
δ
Co, wt% C0.7
7
727°C
1148°C
T(°C)
R S
γ γγγ
α
γγγ γ
γγ γ
γ r s
wα =s/(r+s)wγ =(1-wα)
wα =S/(R+S)wFe3C =(1-wα)
wpearlite = wγ
α
αα
αα
α pearlite
100µm Hypoeutectoid steel

38
(Fe-C System)
Co
Fe
3C
(c
em
en
tite
)
1600
1400
1200
1000
800
600
4000 1 2 3 4 5 6 6.7
L
γ (austenite)
γ+L
γ+Fe3C
α+Fe3C
L+Fe3C
δ
Co, wt% C0.7
71148°C
T(°C)
R S
γ γγγ
αs
wFe3C =r/(r+s)wγ =(1-wFe3C)
wα =S/(R+S)wFe3C =(1-wα)
wpearlite = wγpearlite
60µm Hypereutectoid steel
rγγ
γ γ
γγγ γ
Fe3C
HYPEREUTECTOID STEEL

39

40
TE
ute
cto
id (
°C)
wt. % of alloying elements
Ti
Ni600
800
1000
1200
0 4 8 12
Mo SiW
Cr
Mn
wt. % of alloying elementsC
eu
tec
toid
(w
t%C
)
Ni
Ti
0 4 8 120
0.2
0.4
0.6
0.8
Cr
SiMnW
Mo
• Teutectoid changes: • Ceutectoid changes:
ALLOYING STEEL WITH MORE ELEMENTS

41

42

43

44
• Phase diagrams are useful tools to determine:--the number and types of phases,--the wt% of each phase,--and the composition of each phase for a given T and composition of the system.
• Alloying to produce a solid solution usually--increases the tensile strength (TS)--decreases the ductility.
• Binary eutectics and binary eutectoids allow fora range of microstructures.
SUMMARY

45
OUTLINE• What is a phase?• Basis of phase diagrams• What do phase diagrams tell us?
- how do you use them?- equilibrium versus non-equilibrium
• Complete Solid Solubility Systems• Systems with no complete solid solubility• Invariant transformations
- eutectic; peritectic; eutectoid• Examples - uses of phase diagrams
- Pb-Sn system- Fe-C system
•Modern navigation tools

46
Features1) Point (0-D) Calculation Calculate the stable phase equilibrium at a given point. 2) Line (1-D) Calculation Calculate the stable phase equilibrium at several points
along a line. For example, as the temperature changes or as the composition changes.
3) Section (2-D) Phase Diagram Calculation Calculate stable two-dimensional phase diagrams in multi-component alloy systems. Mouse-click on phase regions to automatically label phase regions.
4) Solidification Simulation Simulate the solidification of a multi-component alloy using either the lever rule or Scheil model.
5) Liquidus Projection Project the liquidus surface of a multi-component alloy. Label the primary phase regions for a ternary liquidus projection.
6) Output of Results Calculated results are displayed in graphical form and exported to a text file.
7) Database A thermodynamic database of parameters is required to perform calculations.
8) Pandat Batch File Pandat can run a series of calculations predefined in a batch file.

47
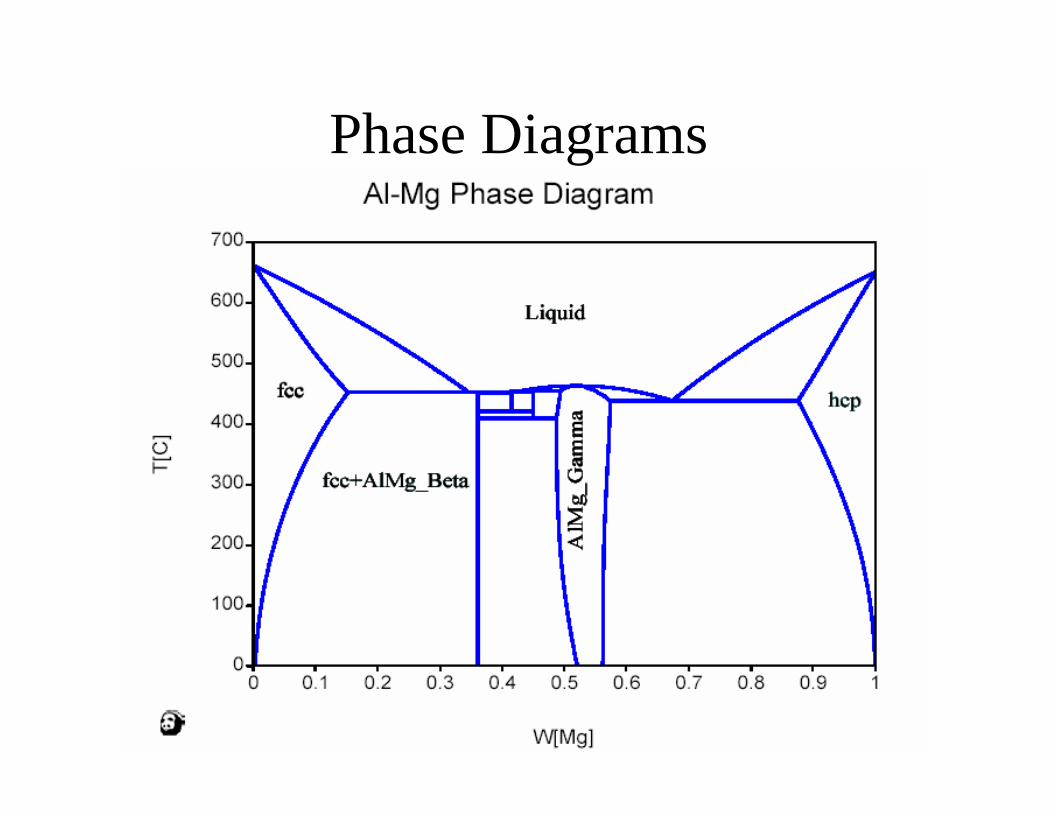
Phase Diagrams

48
Phase Diagrams
49
Phase Diagrams

50
Point Calculations

51
Point Calculations

52
Solidification Simulation

53
Solidification Simulation

54
Ternary Diagrams

55
Complex SystemsPD: Al-4.5Mg-0.22Fe and Al-4.5Mg-0.22Fe-20Si
T[C
]
W[SI]
540.0
542.5
545.0
547.5
550.0
552.5
555.0
557.5
560.0
562.5
565.0
567.5
570.0
572.5
575.0
0.12 0.13 0.14 0.15 0.16 0.17 0.18
L + Si
L + Si + pi
L + Si + pi + Al
L + pi
LIQUID
Si + Al + pi + Mg2Si
L + Al + pi
L + Al
0.12 0.13 0.14 0.15 0.16 0.17 0.18540
542.5545
547.5550
552.5555
557.5560
562.5565
567.5570
572.5575
W[SI]
T[C
]
L + Si
L + Si + pi
L + Si + pi + Al
L + pi
LIQUID
Si + Al + pi + Mg2Si
L + Al + pi
L + Al
L + Si
L + Si + pi
L + Si + pi + Al
L + pi
LIQUID
Si + Al + pi + Mg2Si
L + Al + pi
L + Al

56
Calculations Options