Embed Size (px)
Citation preview
MESOSCALE FORECASTING OF AN EVENT OF NOVEMBER 2008 IN
SANTA CATHARINA
Lia Martins Costa do Amaral1, C. T. Homann
2, V. Pinho
3, Y. Yamasaki
4
1,2,4
Federal University of Pelotas, Pelotas, RS, Brazil 3 Federal University of Alagoas, Maceió, AL, Brazil
(Manuscrito recibido el 17 de marzo de 2010, en su versión final el 4 de junio de 2011,
aceptado el 7 de junio de 2011)
ABSTRACT
The large availability of water vapor at low levels of the atmosphere, advected
into the coastal region of Santa Catharina State by the Atlantic Ocean semi-
stationary anticyclone, provided the frequent and copious rainfall during the
November, 2008. One of the most extreme event occurred in Santa Catharina
coastal zone, when a quite strong blocking formed at high levels of the atmosphere
is explored processing both, the MM5 and WRF mesoscale models. These
models were processed with very high spatial resolution domains, covering the
entire region affected by the severe event. The sea surface temperature field revealed
that there was a large core on Atlantic waters with quite high temperatures along
the coast of Santa Catharina, which enhanced the vertical integrated latent heat
supply into the continental region by the winds. The models forecasting results
showed consistent results with the observations, as well as an indication that
coherences are directly related to the horizontal resolution of the models
configurations.
Keywords: Mesoscale: MM5, WRF
RESUMEN La gran disponibilidad del vapor del agua en los niveles inferiores de la atmosfera,
advectada para la costa de la provincia del Santa Catarina por el anticiclón semi-
estacionário sobre el Oceano Atlantico proporcionó períodos frecuentes de la
lluvia durante el mes de noviembre de 2008. La exploración del evento extremo
ocurrido en Santa Catarina, cuando se caracterizó un intenso bloqueo en los altos
niveles se hace con prognósticos de los modelos del mesoescala MM5 y WRF. Estos
modelos fueron procesados con muy alta resolución espacial de dominios, que
abarca toda la región afectada por el evento severo. La temperatura del agua del
mar antes del evento, muestra que tenia un gran centro de temperaturas elevadas en
el água del mar al lado de la costa del Santa Catarina, que favoreció el
suprimiento del calor latente integrado, em la línea vertical, para la región. Los
prognósticos de los modelos presentaron resultados consistentes con las
observaciones y los resultados indicaran que las coherencias estan directamente
relacionadas com la resolución horizontal de los modelos.
Palabras clave: MM5, WRF
Lia Martins Costa do Amaral, C. T. Homann, V. Pinho, Y.
1. INTRODUCTION
The topography plays a large influence on the
rainfall distribution not only by forcing upward
movements, but also by thermal and frictional
effects (Browning, KA, 1980). The thermal effects
manifest triggering the convective precipitation by
the intense heat sources as well as by the organized
mesoscale circulations. On the other hand, the
frictional effects cause an increase in the
precipitation by the local convergence, which
occurs in the boundary layer, resulting from
differences in the friction, such as those that occurs
along the mountainous shorelines of the Santa
Catharina State of Brazil. Although these types of
precipitation may cause great damage, especially
to economic and productive societies, many
countries have a large dependence of these types of
precipitation (India, China, and Japan). The
difficulty of exploring this problem is mainly
related to the topography of the complexes shaped
mountainous region, besides the difficulties of
taking the accurate measurements of rainfall over
areas of these natures. Bergeron (1965) indicates a
very close relationship between the maximum
rainfall and the height of the mountains - implying
that most of the topographic precipitation
originates from very low levels of the atmosphere
(about 500 m), otherwise, would be removed, far
away, from higher altitudes regions. Even using
mesoscale numerical models, to characterize, as
accurately as possible, these topographic effects - it
is necessary to process them with very high space
resolution, in order to incorporate a part of the
large topography variations of a mountainous
region.
The heavy rains which occurred in Santa Catharina,
during November 2008, were due to the
combination of various meteorological factors.
They were caused by the simultaneous occurrence
of two main phenomena: an anticyclone, which
remained semi-stationary over the South Atlantic
Ocean near the coastal region of Santa Catharina -
producing moderate winds toward the coast - and
the presence of a cyclonic vortex that, in addition
to topographic effects, caused a further ascent of
air mass. On November, 22nd
, after a hot and sultry
afternoon, with temperatures up to 29 ºC, the
clouds presented a strong vertical development
during the day, and rapidly expanded, extending
toward the West and Midwest of continental area
and causing severe storms. According to the
surface observations registered in Itajaí city, the
accumulated rainfall, during November, was 670
mm, well above the average normal. About 85% of
this city was flooded and 41 thousand people were
left homeless. The November month was also, the
one with the highest amount of rain ever recorded
in Florianopolis city since 1961 (Brazilian National
Institute of Meteorology - INMET).
According with Civil Defense of the Santa Catharina
State report, the rainfall has affected, during
November, about 60 cities and more than 1.5
million people. Eight counties become isolated, 10
enacted/ into state of public calamity and several
were completely flooded. According to reported
surveys, the event caused 133 deaths, 22 missing
and more than 78,000 people were forced to
abandon their homes. The rain banned sections of
major highways, closed the port of Itajaí city and
disrupted gas supplies in Santa Catharina and Rio
Grande do Sul States. Industries estimated losses of
R$ 358 million and the state government predicted
the loss of 15% in annual incomes.
Data from the Information Center for
Environmental Resources and Hydrometeorology
(CIRAM) reported that the meteorological station
of Blumenau registered a record high of 283 mm
of precipitation in 24 hours, between days 22nd
and
23rd
. However, the accumulated precipitation in the
month, until November, 24th, in Joinville city was
even higher; with 911 mm, while in Blumenau city
recorded 878 mm.
Severe rainfall events which have been occurring
in Brazil, particularly as the 2008 in Santa
Catharina, reveals the importance of the researches
and the constant re-structuring and improvement,
not only of the forms, as well as the techniques of
numerical weather prediction. The diagnostic and
prognostic assessment of severe event occurred in
Santa Catharina, in 2008, is studied and explored
using observational data and the MM5 and WRF
mesoscale models.

MESOSCALE FORECASTING OF AN
2. MM5 MODEL: CONFIGURATION AND
SIMULATION
The MM5 mesoscale model system (Dudhia et al.
2002) has been set up for three integration domains
(D01, D02 and D03) covering the states of
Santa Catharina and Rio Grande do Sul and
neighboring areas, as shown in Fig.1. They were
set, respectively, with 80, 160, 223 grid points in the
East-West direction and 60, 127 and 151 grid
points in the North-South direction. The distance
between the grid points was set at 18 km, 6 km
and 2 km, resolutions respectively; with 24 sigma
levels in the vertical and the top of the atmosphere
has been set to 100hPa. The time step of
integration has been set to 81 seconds for the
domain D01.
Fig. 1 – D01, D02 e D03 integration domains of
MM5.
The numerical simulations were processed using the
Kain-Fritsch 2 (Kain, 2004) scheme cumulus
parameterization for domain 1 (D01). As the model
has the ability to address explicitly the convective
processes for scales smaller than about 10 km, no
cumulus parameterization was used for domains
D02 and D03.
3. WRF MODEL: CONFIGURATION AND
SIMULATION
The WRF (Weather Research and Forecast) is a
numerical modeling system, developed for
research of atmospheric phenomena as well as for
mesoscale weather forecasting. Its continued
development is a collaborative effort evolving
several research centers and U.S. government
agencies. Architected to be a top tool in simulating
atmospheric, flexible, portable, and efficient in a
variety of computing platforms, the WRF system,
is of public domain and made available for free at
http://wrfmodel.org.
Fig. 2 – Domains of WRF model integration.
The Fig.2 presents the configuration of the three
domains of integration of WRF model, covering
the state of Santa Catharina and surrounding areas.
The first domain has been configured with 117 by
64 grid points; the second with 196 by 115 grid
points and the third one with 349 by 205 grid
points; respectively with 18 km, 6 km and 2 km
horizontal grid space resolution. The model has
been configured in Lambert projection, integrated
with two way nesting and time step of 54 seconds
for the largest domain. The processing has been
made for the 00 UTC of November 21st, 2008 to 00
UTC of November 23rd, 2008.
4. CHARACTERISTICS OF MM5 AND WRF
MODELS
The MM5 and WRF models have been processed
with the global GFS/NCEP model forecasting,
gathered in GRIB2 format, with 0.5 degrees space
resolution, via the IDD / LDM system. These
forecasts provided the analysis and global forecasts
for every three hours, and provided both, the
analysis and boundaries conditions to mesoscale

Lia Martins Costa do Amaral, C. T. Homann, V. Pinho, Y.
models. The models have been processed and the
forecasts stored for each hour, during the 48 hours
of integration period.
The analysis of both models have been made
generating plots, of meteorological fields, with
GrADS (Grid Analysis and Display System)
system including, among others, the rainfall,
temperature and the sea surface (SST). The
infrared channels GOES satellite images, for the
southern hemisphere, have been also used in the
analysis.
5. EVENT DESCRIPTION
The event under consideration, occurred in Santa
Catharina State, has been caused by the
simultaneous occurrence and combination of
several meteorological factors. The one of them
was the high evaporation rate, of high temperature
water, from the Atlantic Ocean, near the coastal
region of the state. Between November 17th
and
21st, 2008 the coast region of Santa Catharina had a
core with high temperature of the water (Fig. 3),
lower than that between November, 21st
and 25th
(Fig. 4), [http://www.fnmoc. navy.mil], i.e., a
gradual increase in temperature of sea water, which
allowed the fact that it becomes even higher than
the air temperature.
Fig. 3 –Sea surface temperature - November, 21st
2008 – 08:00UTC .
Fig. 4 – Sea surface temperature - November, 25th
2008 – 11:00UTC.
This fact revealed that there was an anomaly of
about 1.5 °C on SST, near the coast of southern
Brazil (Fig.5) as in http://www.bom.gov.au, which
reflected the increased vertically integrated latent
heat flow over the Atlantic Ocean, presented in
Fig. 6.
Fig. 5 – Sea surface temperature anomaly -
November week from 17th
to 23rd
, 2008.

MESOSCALE FORECASTING OF AN
Fig. 6 – Latent heat rate (W/
2m ) and wind (m/s)
- November, 21st
2008 – 21:00UTC.
A high pressure (anticyclone) center on 37 ° S and
40 ° W, which had already been presenting a
steady characteristic, since few days ago (Fig. 7),
was the main physical mechanism responsible for
the transport of moisture, toward the coastal region
of Santa Catharina, in the low levels of the
atmosphere.
Fig. 7 – Atmospheric pressure (hPa), direction and
magnitude of wind (m/s) - November, 21st
2008 –
21:00UTC.
As a result of the high pressure center
(anticyclones) there was a peculiar wind
circulation behavior (in the vertical profile) in such
system. The surface wind, under a high pressure
center diverge in this level; rising and converging
at high levels, where the atmospheric pressure is
lower. In the Fig.8, presenting the vertical cross
section of the atmosphere, along 27°S of latitude,
covering the region between the 60°W and 20°W,
illustrates this behavior; in which the horizontal
surface wind component moves westward varying
the magnitude between 5 and 15 m/s. At high
levels, on the other hand, moves from eastward,
reaching magnitudes of up to 50 m/s between 300
hPa and 200 hPa layer.
Fig.8 – Cross section of atmosphere at 27°S with
forecasting of horizontal wind component (u) at
m/s and isothermal lines (°C) – November, 21st
2008 – 21:00UTC.
6. PROGNOSTIC ANALYSIS OF
MESOSCALE NUMERICAL MODELS
According with Epagri-Ciram, between 09:00 UTC
of November 21st and 09:00 UTC of November
23rd , the largest volumes of rain occurred in the
São Francisco do Sul city (located at 26.1ºS and
48.3ºW) - with 466.6 mm and Itapoá city (26.1º S
and 48.4ºW) with 408.2 mm. The region close to
these cities is analyzed in the light of the
simulations made by two mesoscale models.
Lia Martins Costa do Amaral, C. T. Homann, V. Pinho, Y.
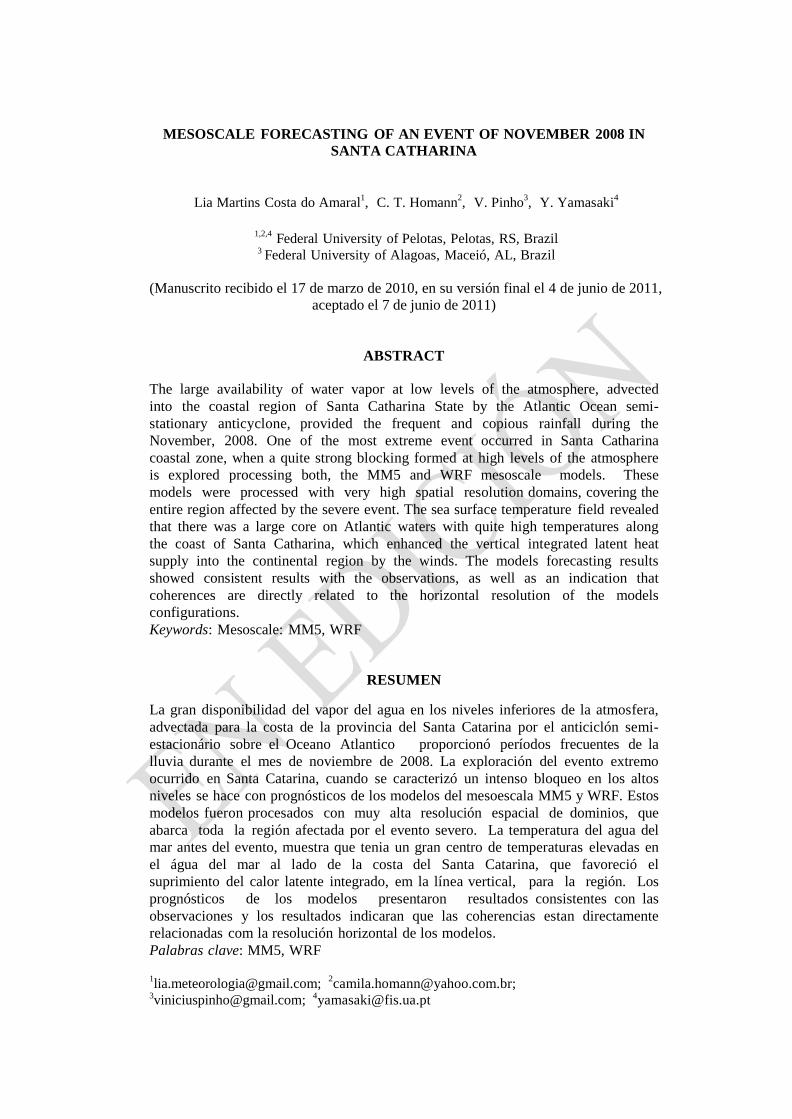
At the beginning of day 21st, until 03:00 UTC, the
accumulated rainfall, in 3 hours, as provided by the
MM5 and WRF already indicated a rainfall of
about 25 mm on the coastal region of Santa
Catharina, as indicated in Fig. 9a and Fig. 9b. The
accumulated precipitation, provided by MM5 (Fig.
9a), has a little bit greater area coverage with
higher total rainfall.
Fig. 9a – Accumulated precipitation from MM5
model – November 21st
2008 - 03:00UTC.
Fig. 9b – Accumulated precipitation from WRF
model – November 21st 2008 - 03:00UTC.
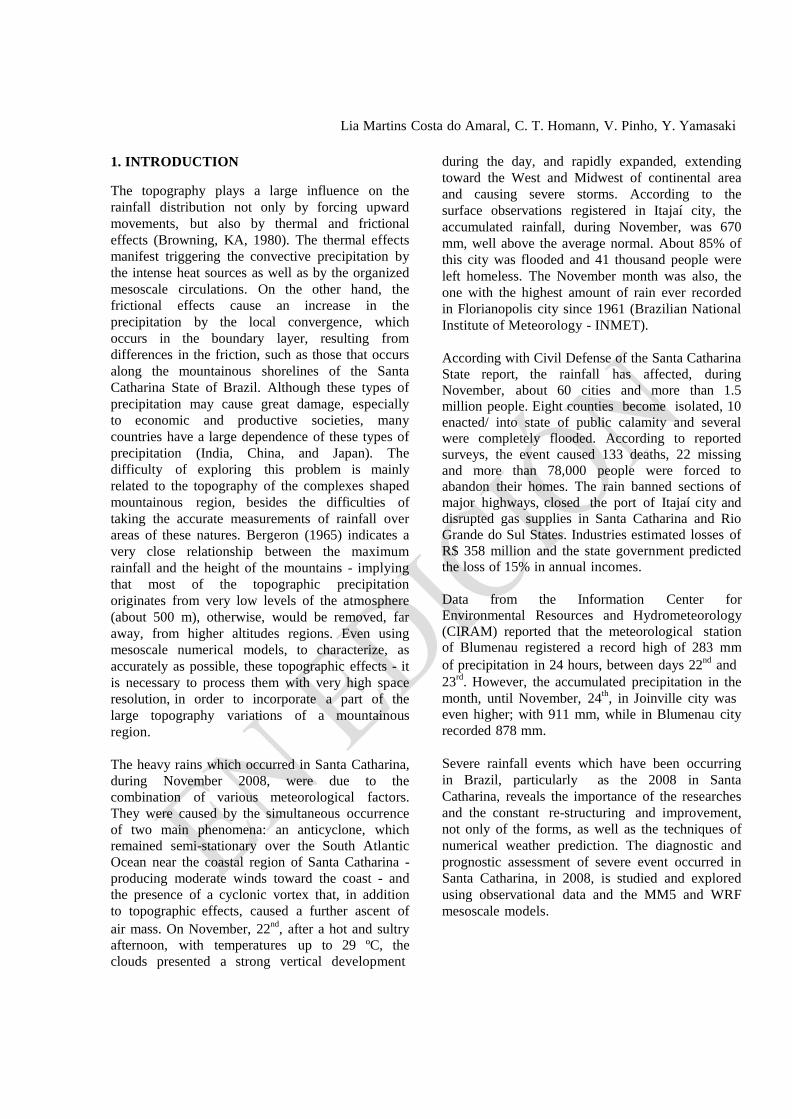
Until 12:00 UTC, both models show areas with
relatively higher precipitation than at 03:00 UTC,
as shown in Fig.10a and Fig.10b. The MM5
predicted, in the southern coastal region, a rainfall
greater than 75mm, while the WRF predicted
rainfall lower than 75mm and also over other
regions located in the south mainland region.
Fig.10a – Accumulated precipitation from MM5
model – November 21st
2008 - 12:00UTC.
Fig. 10b – Accumulated precipitation from WRF
model – November 21st 2008 - 12:00UTC.
The total accumulated precipitation, up to 03:00
UTC of day 22nd
, provided by the WRF is
presented in regions with rates of up to 225 mm
along both the north and the south coastal region of

MESOSCALE FORECASTING OF AN
Santa Catharina. However, MM5 presents levels
which do not exceed 200 mm, although over
smaller and sparser regions. These forecasting are
shown in figures Fig.11a and Fig.11b.
Fig.11a - Accumulated precipitation from MM5
model – November 22nd
2008 - 03:00UTC.
lower rates) than that presented by MM5, as shown
in Fig.12a and Fig.12b.
Fig.12a – Accumulated precipitation from MM5
model – November 22nd
2008 - 23:00UTC.
Fig.11b - Accumulated precipitation from WRF
model – November 22nd 2008 - 03:00UTC.
The accumulated precipitation for 23:00UTC of
day 22nd
(i.e. 48 hours integration), the rainfall of
both models exceed 325 mm in the north coast of
Santa Catharina. The WRF presented a relatively
higher area (even though consisting largely with
Fig.12b - Accumulated precipitation from WRF
model – November 22nd 2008 - 03:00UTC.
The Fig. 13 and Fig. 14 show the accumulated
rainfall between 00:00 UTC of 21st
and 00:00
UTC on 23rd
, on 26.1° S and 48.9° W, for the
models MM5 and WRF, respectively. It is
observed that, even with a small reduction of

Lia Martins Costa do Amaral, C. T. Homann, V. Pinho, Y.
precipitation, during the afternoon of 21st
and the
morning of 22nd
, there was a significant rainfall
during 48 hours – with a total of more than 350
mm.
Fig.13 – Accumulated precipitation between
November 21st- 00:00UTC and November 23rd -
00:00UTC according to MM5 model.
Fig.14 – Accumulated precipitation between
November 21st- 00:00UTC and November 23rd -
00:00UTC according to WRF model.
There was an increase of precipitation, between
12:00 UTC and 18:00UTC of 21st
and between
12:00 UTC and 00:00 UTC of 23rd
, as it can be
seen in Fig. 15 and Fig.16. These period coincide
with those presented in the infrared channel image
of the satellite GOES-10, which have a higher
cloudiness on the coast of Santa Catharina (Fig. 15
and 16).
Fig.15 – Satellite image of GOES10 (infrared
channel) – November 21st
2008 - 12:00UTC
Fig.16 - Satellite image of GOES10 (infrared
channel) – November 22nd
2008 - 18:00UTC
MESOSCALE FORECASTING OF AN
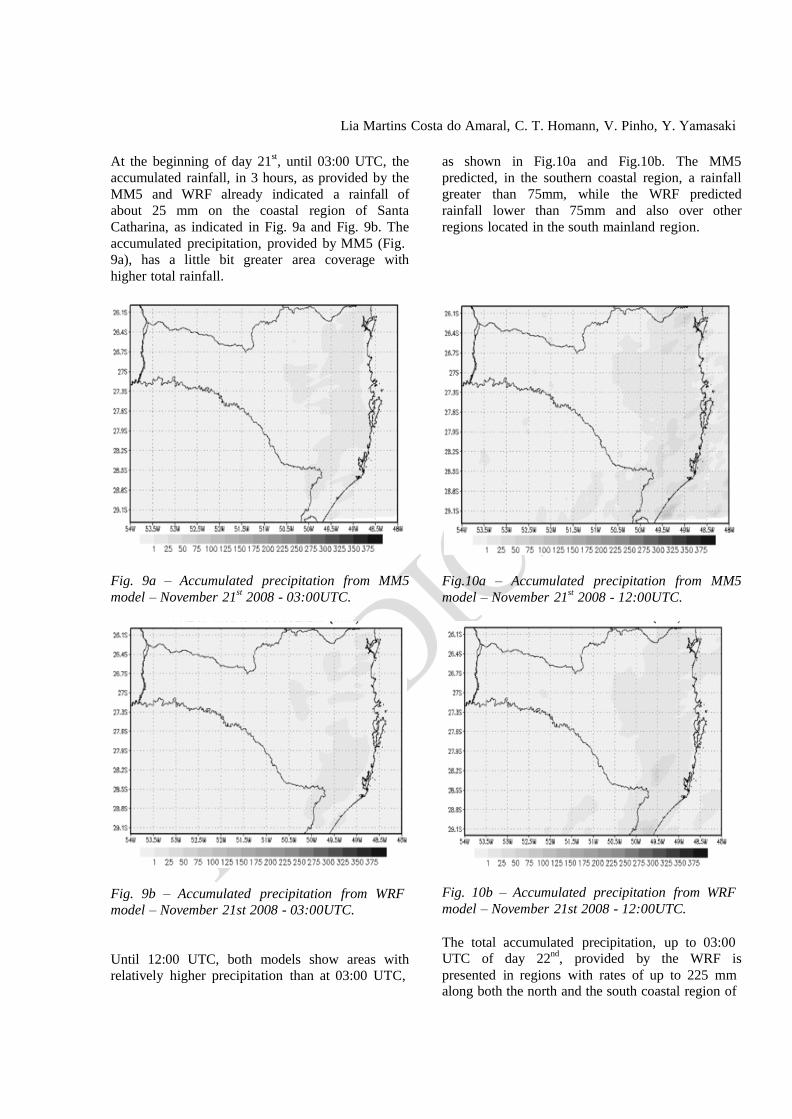
The vertical cross sections of potential
temperature, potential vorticity and the vector wind
circulation, provided by MM5 for the domain D01,
to be presented, refer to the one made along the
horizontal line with a latitude of 20° S, which has
an the order of 1500 km across the entire state of
Santa Catharina, as illustrated in Fig. 17.
Fig.17 – Cross section along the latitude of
27, 3°S
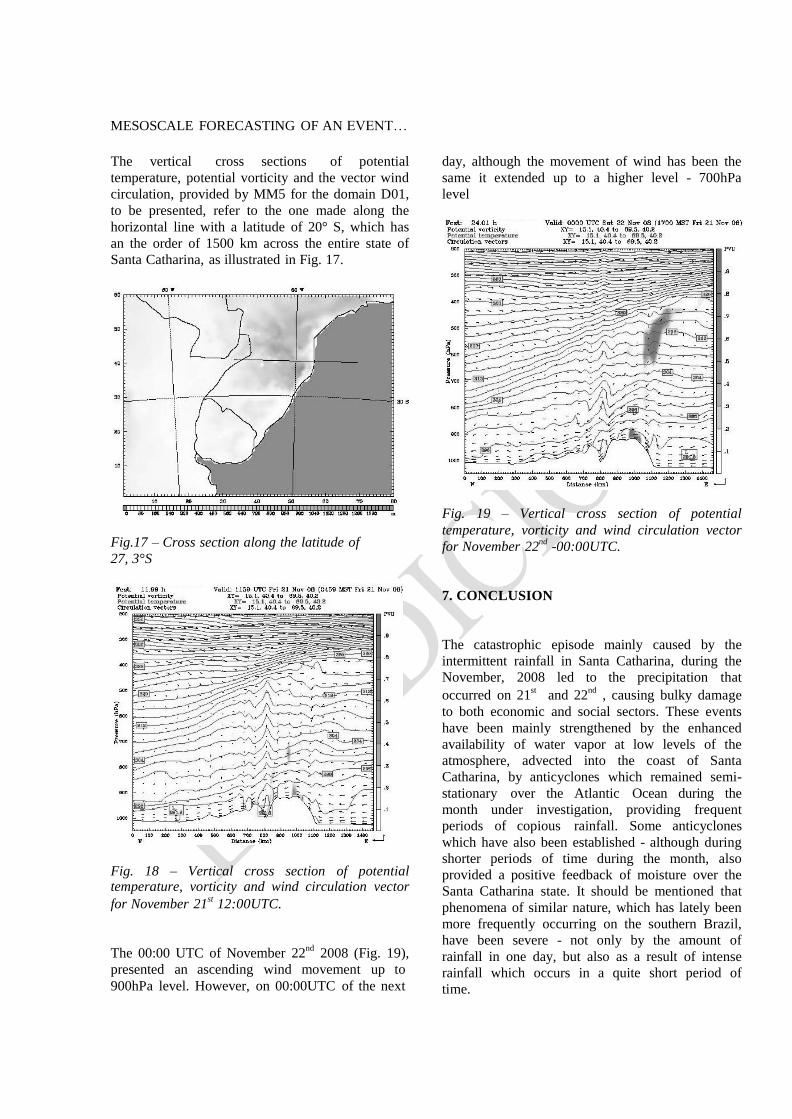
Fig. 18 – Vertical cross section of potential temperature, vorticity and wind circulation vector
for November 21st
12:00UTC.
The 00:00 UTC of November 22
nd 2008 (Fig. 19),
presented an ascending wind movement up to
900hPa level. However, on 00:00UTC of the next
day, although the movement of wind has been the
same it extended up to a higher level - 700hPa
level
Fig. 19 – Vertical cross section of potential
temperature, vorticity and wind circulation vector
for November 22nd
-00:00UTC.
7. CONCLUSION
The catastrophic episode mainly caused by the
intermittent rainfall in Santa Catharina, during the
November, 2008 led to the precipitation that
occurred on 21st
and 22nd
, causing bulky damage
to both economic and social sectors. These events
have been mainly strengthened by the enhanced
availability of water vapor at low levels of the
atmosphere, advected into the coast of Santa
Catharina, by anticyclones which remained semi-
stationary over the Atlantic Ocean during the
month under investigation, providing frequent
periods of copious rainfall. Some anticyclones
which have also been established - although during
shorter periods of time during the month, also
provided a positive feedback of moisture over the
Santa Catharina state. It should be mentioned that
phenomena of similar nature, which has lately been
more frequently occurring on the southern Brazil,
have been severe - not only by the amount of
rainfall in one day, but also as a result of intense
rainfall which occurs in a quite short period of
time.

Lia Martins Costa do Amaral, C. T. Homann, V. Pinho, Y.
The extreme event, occurred during the day 21
st
and 22nd
, when an intense blocking at higher levels
has been acting, causing a huge disaster, is
explored based on MM5 and WRF mesoscale
forecasting models. These models have been
processed with high spatial resolution integration
domains, covering the entire region affected by the
severe event.
The mesoscale models processing have been made
with the support of the global forecasting system
(GFS) model of NCEP, to provide the necessary
requirements on both initial and lateral boundaries
conditions. Due to the dependencies of numerical
models on the parameterizations, different
parameterizations of clouds were used and the
results of numerical integrations are presented and
discussed for one of them.
The sea surface temperature before the occurrence
of the event under investigation revealed that there
was a core with higher temperatures on Atlantic
Ocean along the coast of Santa Catharina - which
was even above the temperature of atmospheric air
and substantially facilitated the supply of water
vapor into the continent of Santa Catharina.
Both models presented a reasonably consistent numerical results compared with the observed data of extreme rainfall - which reached a record of 466
mm, from November 21st
- 09:00 UTC to
November 23rd
- 09:00 UTC – against the numerical models, presenting 370 mm (from
November 21st
00: 00UTC to November 22nd
00:00
UTC of day 22) in the proximity of the site of the
recorded precipitation. Finally, it should also be
noted that the results of models which have been
processed with higher horizontal resolution (2 km)
presented better results than the mothers of their
domains.
ACKNOWLEDGMENT
To all institutions that provided the essential data
and supports to carrying out the study: NCEP,
UCAR, and using UFPEL
REFERENCES
Bergeron, 1965. On the lower level redistribution
of atmospheric water caused by orography.Supl.
Proc. Intl. Conf. cloud Phys., págs. 96-100.
Browning, K.A. 1980. Structure, mecanism and
prediction of orographicdally enhanced rain in
Britain. GARP Publ.Series 23, WMO, págs. 85 114.
Dudhia, J., Dave, G., Young-Run, G., Kevin, M. Al
B., Wei, W. and Cindy, B., 2002. PSU/NCAR
Mesoscale Modeling System Tutorial Class Notes
and User’s Guide: MM5 Modeling System Version
3.
Kain, J. S. 2004. The Kain–Fritsch convective
parameterization scheme: An update. J. Appl.
Meteor, 43, pp. 170 – 181.
A description of the Advanced Research WRF
NCAR/TN – 475 + STR NCAR technical note
2008.