Embed Size (px)
Citation preview

1
MERCURY DYNAMICS IN SUB-ARCTIC LAKE SEDIMENTS ACROSS
A METHANE EBULLITION GRADIENT
Author: Lance Erickson
A thesis submitted in partial fulfillment of the requirements for the degree of Bachelor of
Arts (Geology)
At
Gustavus Adolphus College
2014
2
Mercury Dynamics In Sub-Arctic Lake Sediments Across A Methane Ebullition Gradient
Author: Lance Erickson; Under the Supervision of Dr. Laura Triplett
Abstract
Recent studies have suggested that Arctic warming may play a key role in enhancing
carbon (C) and mercury (Hg) export from permafrost peatlands, yet the mechanisms by
which Hg is mobilized during thaw remain enigmatic. To elucidate the links between these
chemical systems, we investigated Hg concentrations in cores taken in organic C rich
sediments in Lake Villasjön (avg. depth 1.5m) at the Stordalen Mire, Abisko, Sweden. We
chose coring sites based on zones with significantly different ebullitive methane (CH4)
fluxes established in earlier studies and we hypothesized that the microbial community
producing CH4 is also potentially mobilizing Hg. Four recovered sediment cores (39-44cm
long) were characterized by having roughly 30cm of organic-rich silt material on top of a
transition to more clastic material in the bottom ~10cm. Cores were sub-sampled every
2cm, and the sediment samples were then freeze-dried. Sub-samples were analyzed for
extractable Hg by cold vapor inductively coupled plasma mass spectrometry (2 cores) and
for total Hg by thermal decomposition and cold vapor atomic fluorescence (2 cores).
Mercury was most abundant in the upper portions of all sediment cores, after which
concentrations decreased with depth. The highest ebullition site had Hg concentrations
exceeding 80 ngHg/gsediment at the core top that decreased to a low Hg concentration < 15
ngHg/gsediment at the core base. The lowest ebullition site had overall lower concentrations
compared to the higher ebullition sites with more intermediate values (< 50 ngHg/gsediment)
starting at 2cm depth, dropping to < 15 ngHg/gsediment at ~ 26 cm. We found differences

3
(≥ 50%) in overall Hg contents of surficial sediments. Mercury content positively correlated
with total organic C (TOC, R²=0.74) and sulfur (S, R2=0.92) in the highest ebullition site.
Mercury content also negatively correlated with dissolved inorganic carbon (DIC) in the
highest ebullition site (R²=0.71). These relationships are only seen in the higher ebullition
sites, whereas in the lower ebullition sites, Hg correlations to other geochemical data (e.g.,
TOC, C, nitrogen, S, DIC) were more variable. Our findings imply that (1) processes that
enhance CH4 mobilization affect Hg dynamics in sediment cores, (2) higher ebullitive
regions will exhibit elevated Hg concentrations and (3) assessing overall Hg behavior in
lakes requires cores in multiple locations.
4
Acknowledgements
The amount of collaboration on this project was incredible and if not for scientific
collaboration, this project would not be what it is. First off, I thank Northern Ecosystem
Research for Undergraduate’s program director Dr. Ruth Varner for providing me the
opportunity to do research at the University of New Hampshire (UNH) and the Abisko
Scientific Research Station (ASRS). Secondly, I would like to thank Florencia Meana-Prado
and Julia Bryce for their supervision of my understanding of mercury cycles. I also thank
Martin Wik and Patrick Crill for teaching me about the Abisko region and Stordalen Mire,
assisting in determining sampling locations, and conveying regional geochemical cycles to
me in northern Sweden. I thank Joel P. Destasio, Madison J. Halloran and Joel E. Johnson for
the help with field sampling and auxiliary data. A thank you goes to Jacob B. Setera for his
help in analyzing sediments while I was in Sweden conducting field work. Lastly, I would
like to thank Dr. Laura Triplett for supervising my research at Gustavus Adolphus College
and ultimately initiating and pushing me to pursue my interest in geology and scientific
research. My research at UNH and ASRS was funded by the National Science Foundation.
5
Table of Contents Pg.
I. Introduction 6
II. Geologic Setting 9
III. Methods 12
IV. Results 14
V. Discussion 23
VI. References Cited 26
Figure 1 – Abisko Location 9
Figure 2 – Regional and local aerial photo of Tornetrask valley
Stordalen Mire, respectively 11
Figure 3 – Sediment Core Visuals 15
Figure 4 – Grain Size Distribution 17
Figure 5 – Extractable Hg Content 18
Figure 6 – Total Hg Content 19
Figure 7 – Methane (CH4) Content 20
Figure 8 – Total Organic Carbon Content 21
Figure 9 – Total Sulfur Content 22
Figure 10 – Total Nitrogen Content 23
6
Introduction
Today, sub-Arctic environments are some of the most susceptible to changing
climate. Anthropogenic influence is the primary driving factor behind this change. In
addition to influencing average global temperatures, humans have also altered the
chemical components of atmosphere, ocean and terrestrial environments with potential
environmental contaminants. Though remote, the Arctic is not immune to anthropogenic
influenced changes. Of all of the atmospherically deposited contaminants, mercury (Hg) is
commonly thought to be the largest threat to Arctic environments (Klaminder et al, 2008
and Van Oostdam et al, 1999). The Arctic is particularly important for sequestering Hg,
which in some forms is highly toxic to life.
Mercury’s potential to contaminate Arctic ecosystems begins at the lowest levels of
the food chain with bacteria, Achaea, phytoplankton and algae. Mercury can accumulate in
these low level organisms through absorption and consumption of inorganic Hg, however
specific processes remain to be determined. Mercury exists as methyl mercury (MeHg) and
inorganic Hg in Arctic environments. Both inorganic Hg and MeHg may be assimilated by
biota, however, MeHg is more readily biomagnified within the food chain (Douglas et al,
2012; Fitzgerald et al, 2007 and Mason et al, 1996). Mercury accumulation in Arctic
sediments increases the ‘bioavailability’ of inorganic Hg to be methylated by microbial
communities and thus increases the likelihood of MeHg accumulation in prey organisms
and predators within the food chain (Douglas et al, 2012).
The atmosphere at higher latitudes is a long term Hg scavenger, primarily because
of the presence of radioactive halogens. Radioactive halogens favor oxidation of gaseous
Hg0 into Hg species that more easily deposits onto terrestrial landscapes (Steffen et al,

7
2008 and Klaminder et al, 2008). As more Hg is deposited in the higher latitudes, the Arctic
will act as a sink for atmospheric Hg (Ariya et al, 2004). There, most Hg will be converted to
MeHg, the form most readily available to organisms (Douglas et al, 2012) and mobilized by
sulfate-reducing bacteria (Gilmour et al, 1992). Sulfate-reducing bacterial communities are
also thought to produce methane (CH4). Thus, this study tries to elucidate the links
between CH4 chemical systems and Hg sequestration and possible Hg mobilization.
Sub-Arctic permafrost peatlands serve as good locations in which to study these
chemical system links because peatlands sequester large volumes of carbon (C) and Hg
(Biester et al, 2003; Bindler et al, 2004 and Martinez-Cortizas et al, 1999). In northern
Sweden, permafrost in peatlands is currently thawing (Christensen et al, 2004 and Kokfelt
et al. 2010). In these northern environments, Hg is strongly bound to organic matter (Xia et
al, 1999). The melting of permafrost peatlands due to climate warming may allow for more
organic matter to be susceptible to bacterial breakdown with subsequent release of Hg.
Bacterial breakdown of C to produce CH4 is a positive feedback contributing to
climate warming processes (Walter et al, 2006); warming causes CH4, which leads to more
warming. Methane has a radiative forcing of about 25 times that of carbon dioxide (CO2) on
a 100 year scale (Anthony et al, 2010). Naturally emitted CH4 has three pathways in which
it is released from lake sediments: 1) transport through emergent plants, 2) molecular
diffusion and 3) ebullition (bubbling) (Anthony et al, 2010). This study solely investigates
the ebullitive pathway as microbial communities in the sediment column are thought to
methylate Hg along with production of ebullitive CH4.
Ultimately, the importance of studying Hg is its potential to be mobilized and
likelihood to bioaccumulate in organisms. Climate warming will cause more organic matter

8
to be broken down via bacterial communities. The increased bacterial activity will lead to
more CH4 release and potential Hg mobilization in lake waters as MeHg. Understanding the
link between CH4 ebullition and Hg sequestration, and potential Hg mobilization, is key to
determining Hg dynamics in lake ecosystems.
9
Geologic Setting
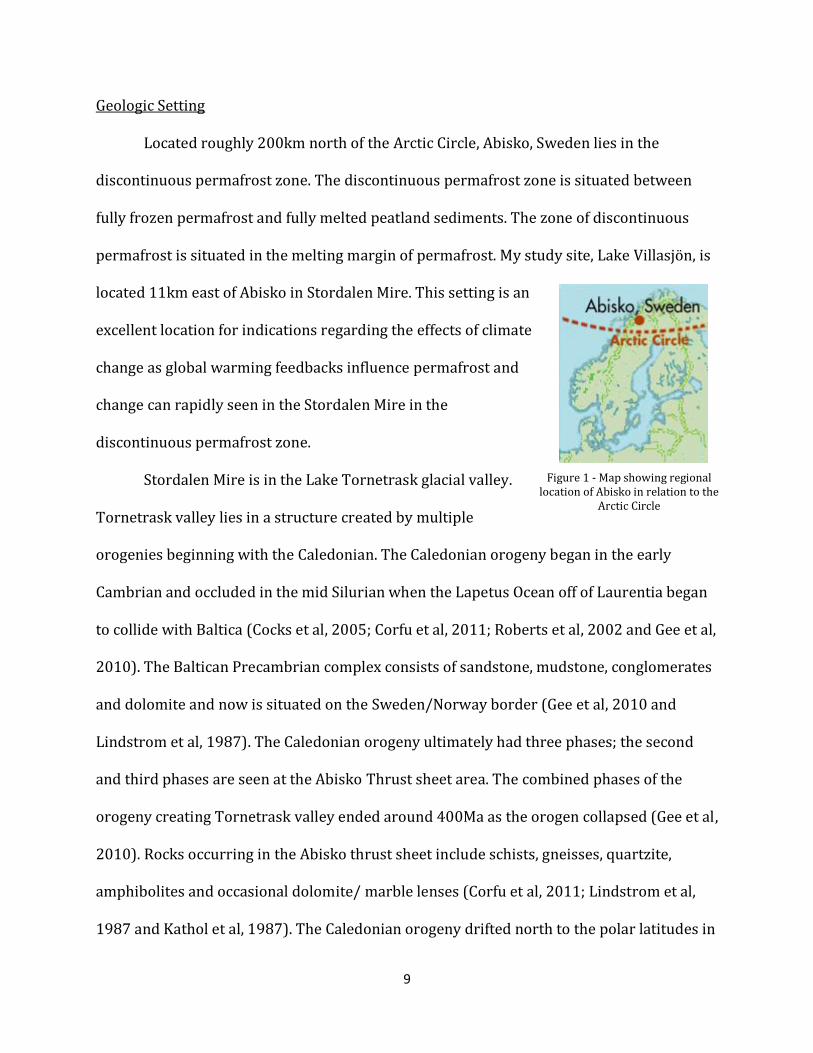
Located roughly 200km north of the Arctic Circle, Abisko, Sweden lies in the
discontinuous permafrost zone. The discontinuous permafrost zone is situated between
fully frozen permafrost and fully melted peatland sediments. The zone of discontinuous
permafrost is situated in the melting margin of permafrost. My study site, Lake Villasjön, is
located 11km east of Abisko in Stordalen Mire. This setting is an
excellent location for indications regarding the effects of climate
change as global warming feedbacks influence permafrost and
change can rapidly seen in the Stordalen Mire in the
discontinuous permafrost zone.
Stordalen Mire is in the Lake Tornetrask glacial valley.
Tornetrask valley lies in a structure created by multiple
orogenies beginning with the Caledonian. The Caledonian orogeny began in the early
Cambrian and occluded in the mid Silurian when the Lapetus Ocean off of Laurentia began
to collide with Baltica (Cocks et al, 2005; Corfu et al, 2011; Roberts et al, 2002 and Gee et al,
2010). The Baltican Precambrian complex consists of sandstone, mudstone, conglomerates
and dolomite and now is situated on the Sweden/Norway border (Gee et al, 2010 and
Lindstrom et al, 1987). The Caledonian orogeny ultimately had three phases; the second
and third phases are seen at the Abisko Thrust sheet area. The combined phases of the
orogeny creating Tornetrask valley ended around 400Ma as the orogen collapsed (Gee et al,
2010). Rocks occurring in the Abisko thrust sheet include schists, gneisses, quartzite,
amphibolites and occasional dolomite/ marble lenses (Corfu et al, 2011; Lindstrom et al,
1987 and Kathol et al, 1987). The Caledonian orogeny drifted north to the polar latitudes in
Figure 1 - Map showing regional location of Abisko in relation to the
Arctic Circle

10
the early Cenozoic. Being in the polar region, uplift and the cooling climate created an
environment of persistent glaciation. With fluctuating uplifts and glacio-fluvial cycles, the
stepped landscape of Abisko was turned into one composed of large erosional valleys.
Ultimately, Tornetrask valley was created from the erosion of exposed lower resistant
rocks and gravitational forces (Lidmar-Bergstrom et al, 2007).
Being in the northern latitudes, glacial activity is prominent in the landscape.
Glaciers in this region were cold-based, meaning that they were frozen at the base and
exhibit low-energy erosional rates. Deglaciation started around 10,000 yBP with mountain
peak ice melting first, producing remnant glaciers in valleys (Stroeven et al, 2002; Kleman
et al, 1999; Andre, 2002; Dobinski, 2010 and Snowball, 1996).
As deglaciation isolated remnant glaciers on the slopes, the valley glaciers blocked
the valley outlet holding back water (Shemesh et al, 2001 and Grudd et al, 2002). Till was
initially deposited but as melting progressed, glacio-lacustran silts were deposited across
the valley approximately 9500 – 9000 yBP (Linden et al, 2006 and Barnekow et al, 2000).
Since the deglaciation, isostatic rebound has been prominent in the region lifting at
estimates of 100 to 400m with the majority of rebound in the first 1000 years preceding
deglaciation. Currently, rebound rates are at 4-6mm/yr while erosional rates are 0.2-
5mm/kyr indicating continuous evolution of the landscape (Bakkelid et al, 1986 and Andre,
2002).
Around 9000 yBP, strong cooling occurred in the Abisko region and subjected Lake
Tornetrask to drop by 400m. Eventually, around 5000 yBP, the Abisko region became a
shallow wetland allowing for the first deposition of peat (Kokfelt et al, 2010). Stordalen’s
environment was then separated from the Tornetrask around 3400 yBP when Holocene

11
cooling caused reformation of mountain glaciers and further reduction in lake levels (Bigler
et al, 2002; Kokfelt et al, 2010; Taylor et al, 2009 and Woo et al, 2006). Vegetation shifted
towards graminoids (grasses, rushes, sedges) in the next 1000 years while forests
retreated. Permafrost subsequently formed as dry moss and the raised topography allowed
ice to form at depths. Frost-heave transitions allowed for palsa formations with underlain
discontinuous permafrost (Kokfelt et al, 2010 and Woo et al, 2006).
Figure 2 - (Above) Aerial photo of Abisko and Lake Tornetrask region. (Below) Aerial photo of Stordalen Mire, highlighting the locality of Lake Villasjӧn within the mire and its local scale within the Lake Tornetrask region. Photos
courtesy of Google Maps, 2013.
Lake Villasjӧn lies in the eastern
portion of Stordalen Mire and is
approximately 1.5 meters in depth
throughout. As Lake Villasjön is underlain
with clastic sediment, it is assumed that it
is a glacial remnant lake of the most
Abisko
Stordalen Mire
145m
Lake Villasjӧn
40km
N

12
recent glaciation ~4000yBP. At approximately 365m above sea, it currently sits 11m above
the nearby Lake Tornetrask (Wik et al, 2011).
13
Methods
Sediment cores were taken from Lake Villasjön along a known methane ebullition
gradient. The methane ebullition gradient was confirmed by Wik’s research in Lake
Villasjön (Wik et al, 2011). The methane ebullition gradient was found via floating bubble
traps. I analyzed four locations along the methane ebullition gradient with samples from
two more locations archived for future analytical work. Four cores were taken at each
location to determine CH4 concentrations, perform CH4 incubations, analyze carbon,
hydrogen, nitrogen and sulfur (CHNS), measure grain size and Hg concentration. Cores
were taken using a modified AMS certified hammer corer. Most cores were approximately
30-50cm in depth with some reaching 80cm. Methane concentrations were acquired by
taking sediment/gas plugs every 5cm downcore. Samples were placed in nitric acid to stop
bacterial activity and head-gas was later sampled for CH4 analysis by gas chromatography.
Methane incubation samples were placed into two vials and put into 20°C and 5°C
chambers to record the productivity of bacterial activity. Head-gas volumes were sampled
for five consecutive days following core collection and analyzed by gas chromatography.
Carbon, hydrogen, nitrogen and sulfur weight percentages were acquired via a Perkin-
Elmer CHNS 2400 analyzer. Carbon, hydrogen, nitrogen and sulfur was sampled every 5cm
downcore. Grain size samples were taken every 5cm and also at each distinct sediment
change. Grain size data were acquired by a Mastersizer Laser particle analyzer. Samples for
Hg analysis were taken every 2cm to ensure a high resolution dataset downcore.
To acquire Hg sediment samples, the core was split to minimize the possibility of
contamination from the sampling tube. At each sample depth, the surface was also scraped
clean with a clean polypropylene tool to reduce contamination. Each Hg sample was stored

14
in a double plastic baggy until further analysis took place. Samples were freeze-dried to
prevent sediment decay. Once freeze-dried, samples from VM1 and VM6 were digested
three times to extract Hg from particulates. Cold vapor ICP-MS was used to determine
extractable Hg content (ngHg/gSediment). Samples from VM2 and VM5 were analyzed via
thermal decomposition and cold vapor atomic florescence. Data was then plotted against
multiple factors (i.e. grain size, CHNS, CH4) to determine chemical and physical
correlations.
15
Results
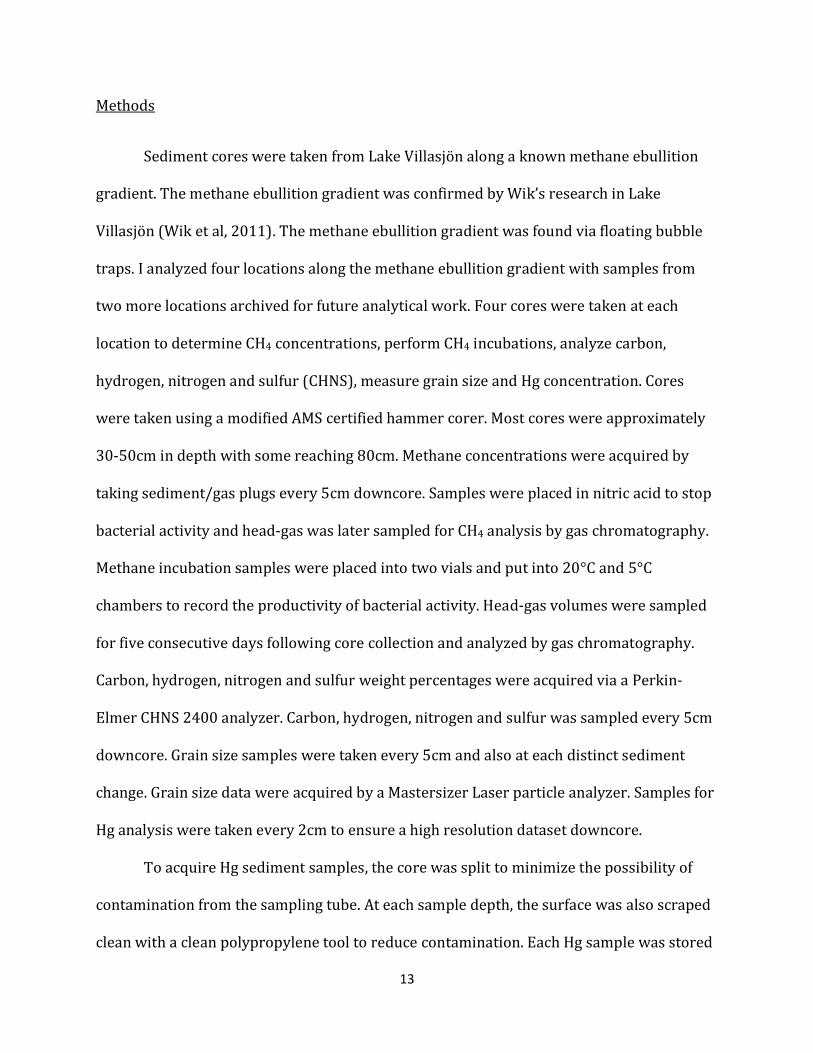
All cores taken in Lake Villasjӧn had approximately 30cm of organic-rich material
on top of a clastic layer ~10cm thick. Sediment in the depths of 0-14cm was a very dark
black/brown color. Within the 15-30cm depth, the color lightened slightly to brown. From
30cm depth and below, the sediment was gray. The four cores I analyzed ranged in length
from 39cm to 44cm: 44cm at VM1, 39cm at VM2, 41cm at VM5 and 40cm at VM6 (Figure 3).
Figure 3 – Sediment cores from transect across an ebullition gradient in Lake Villasjӧn, Stordalen Mire, Abisko, Sweden. Organic-rich sediment is brown in color and clastic material is gray in color. Note that light settings are different in each
photo. Photos courtesy of Florencia Meana-Prado.
Grain size distributions were different throughout each sediment core even while
physical appearance differences were subtle. At site VM1, clay content stayed relatively
constant through the core, varying from 3.1% to 9.8% in the total grain size distribution
percentage. Sand and silt content were about equal in the upper portions of the sediment
columns, however volume percentages diverge at 30cm depth as silt content increases to
16
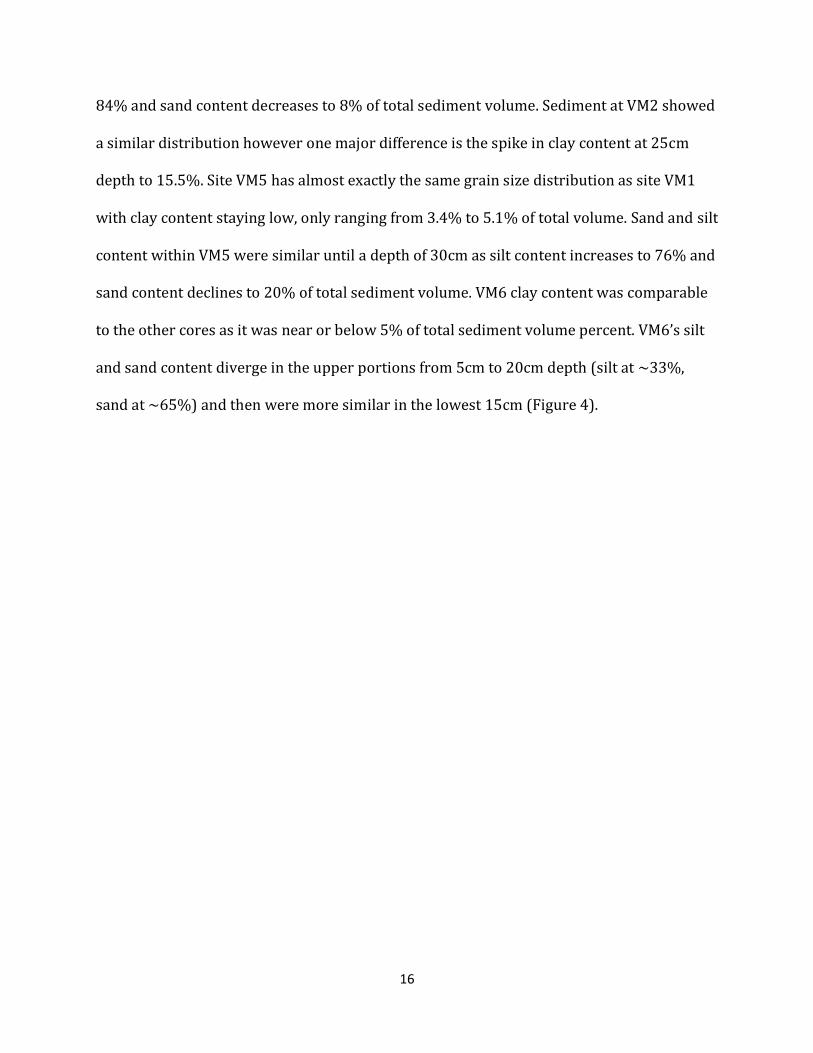
84% and sand content decreases to 8% of total sediment volume. Sediment at VM2 showed
a similar distribution however one major difference is the spike in clay content at 25cm
depth to 15.5%. Site VM5 has almost exactly the same grain size distribution as site VM1
with clay content staying low, only ranging from 3.4% to 5.1% of total volume. Sand and silt
content within VM5 were similar until a depth of 30cm as silt content increases to 76% and
sand content declines to 20% of total sediment volume. VM6 clay content was comparable
to the other cores as it was near or below 5% of total sediment volume percent. VM6’s silt
and sand content diverge in the upper portions from 5cm to 20cm depth (silt at ~33%,
sand at ~65%) and then were more similar in the lowest 15cm (Figure 4).

17
Figure 4 – Grain Size distributions by percent volume at four sites along a known CH4 ebullition gradient in Lake Villasjӧn, Stordalen Mire, Abisko, Sweden. VM1 has highest ebullition rates while VM6 exhibits the lowest ebullition rates.
0
5
10
15
20
25
30
35
40
45
0 20 40 60 80 100
De
pth
(cm
)
% Grain Size (volume)
VM-1:Highest Ebullition Grain Size Distribution
0
5
10
15
20
25
30
35
40
45
0 20 40 60 80 100
De
pth
(cm
)
% Grain Size (volume)
VM-2: High Ebullition Grain Size Distribution
0
5
10
15
20
25
30
35
40
45
0 20 40 60 80 100
De
pth
(cm
)
% Grain Size (volume)
VM-5: Low Ebullition Grain Size Distribution
0
5
10
15
20
25
30
35
40
45
0 20 40 60 80 100
De
pth
(cm
)
% Grain Size (volume)
VM-6: Lowest Ebullition Grain Size Distribution
18
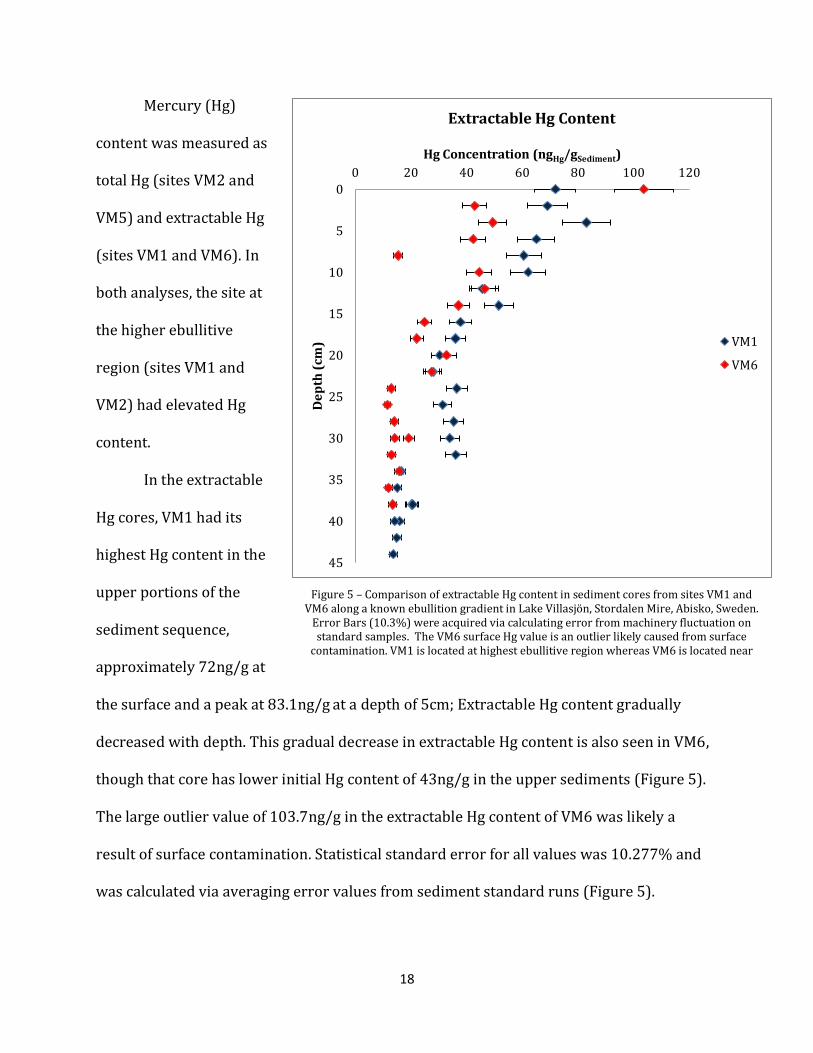
Figure 5 – Comparison of extractable Hg content in sediment cores from sites VM1 and VM6 along a known ebullition gradient in Lake Villasjӧn, Stordalen Mire, Abisko, Sweden.
Error Bars (10.3%) were acquired via calculating error from machinery fluctuation on standard samples. The VM6 surface Hg value is an outlier likely caused from surface
contamination. VM1 is located at highest ebullitive region whereas VM6 is located near the lowest ebullitive region.
Mercury (Hg)
content was measured as
total Hg (sites VM2 and
VM5) and extractable Hg
(sites VM1 and VM6). In
both analyses, the site at
the higher ebullitive
region (sites VM1 and
VM2) had elevated Hg
content.
In the extractable
Hg cores, VM1 had its
highest Hg content in the
upper portions of the
sediment sequence,
approximately 72ng/g at
the surface and a peak at 83.1ng/g at a depth of 5cm; Extractable Hg content gradually
decreased with depth. This gradual decrease in extractable Hg content is also seen in VM6,
though that core has lower initial Hg content of 43ng/g in the upper sediments (Figure 5).
The large outlier value of 103.7ng/g in the extractable Hg content of VM6 was likely a
result of surface contamination. Statistical standard error for all values was 10.277% and
was calculated via averaging error values from sediment standard runs (Figure 5).
0
5
10
15
20
25
30
35
40
45
0 20 40 60 80 100 120
De
pth
(cm
)
Hg Concentration (ngHg/gSediment)
Extractable Hg Content
VM1
VM6

19
0
5
10
15
20
25
30
35
40
45
0 20 40 60 80 100 120
De
pth
(cm
)
Hg Concentration (ngHg/gSediment)
Total Hg Content
VM2
VM5
Figure 6 – Total Hg content acquired from sites VM2 and VM5 in Lake Villasjӧn, Stordalen Mire, Abisko, Sweden. Individual error bars were calculated from triple runs of each sample; Displayed on each data point. Site VM2 is at a known higher ebullitive region
whereas site VM5 is at a known lower ebullitive region.
Total Hg content
exhibited a similar trend
to the extractable Hg
content. The higher
ebullitive site (VM2) had
elevated Hg content
compared to the lower
ebullitive site (VM5). One
outlier from the trend of
gradual decrease in Hg is
at site VM2 at 32cm depth
(Figure 6). This elevated
value in Hg content is not
seen in the other cores.
Total Hg content was more elevated compared to the extractable Hg content because total
Hg data takes into account the particulate material whereas the extractable Hg content only
accounts for readily available, digestible Hg content. Standard error bars are shown on
Figure 6 and are specific to the individual sample.

20
0
5
10
15
20
25
30
35
40
45
0 1000 2000 3000 4000 5000
De
pth
(cm
)
ug CH4 g-1ds
CH4 Content
VM1
VM2
VM5
VM6
Figure 7 – Graph showing CH4 content of sediment cores in Lake Villasjӧn, Stordalen Mire, Abisko, Sweden. CH4 content was acquired via collecting headspace CH4 gas at each
sediment plug depth. Sediment cores were taken from a known CH4 ebullitive gradient where VM1 has highest ebullition and VM6 has the lowest ebullition.
Methane content
down core varied because
each site had different
rates of ebullition. Site
VM1 had the lowest
content of CH4 with a max
value of 1269.5 ug CH4 g-
1ds at a depth of 26cm. The
trend in all cores for CH4
content revealed that in
the upper portions of
core, CH4 is depleted. It
increased in CH4 content
going down core to a
middle portion and then is depleted again at the base of the core. For example, CH4 content
at site VM1 began with 8 ug CH4 g-1ds at a depth of 1cm and increased to 1269.5 ug CH4 g-1ds
at depth 26cm and then decreased again to 433.6 ug CH4 g-1ds at depth 46cm. Sites VM2 and
VM5 exhibit a large peak in CH4 content to approximately ~4000 ug CH4 g-1ds at 36cm
depth. Site VM6 showed the same trend as VM1 but had slightly elevated CH4 content
throughout the whole core (Figure 7).

21
Further analysis revealed the total organic carbon (TOC), nitrogen (N), and sulfur
(S) content within the sediment cores. In almost all cases, levels of TOC, N, and S were
elevated in the upper portions of the cores and then decreased with depth. Total organic
carbon, N and S were analyzed by calculating weight percent in each sample. TOC in the
upper portions of cores varied from ~25 weight % to ~35 weight %. Total organic carbon
slightly increased with 5-10cm depth and then diminished at a relatively steady rate to the
bottom portions of the cores. Total organic carbon of all cores at 40cm depth was ~3.5
weight %. VM2 showed a max peak, unlike any other cores, at 35cm depth with a TOC
weight % of 45.8 (Figure 8).
0
5
10
15
20
25
30
35
40
45
0 10 20 30 40 50
De
pth
(cm
)
TOC (weight %)
Total Organic Carbon Content
VM1
VM2
VM5
VM6
Figure 8 – Total organic carbon (TOC) content of sediment cores in Lake Villasjön, Stordalen Mire, Abisko, Sweden. TOC content is analyzed by weight %. Cores were taken
over a CH4 ebullitive gradient where VM1 has highest rates of ebullition and VM6 has lowest rates of ebullition.
22
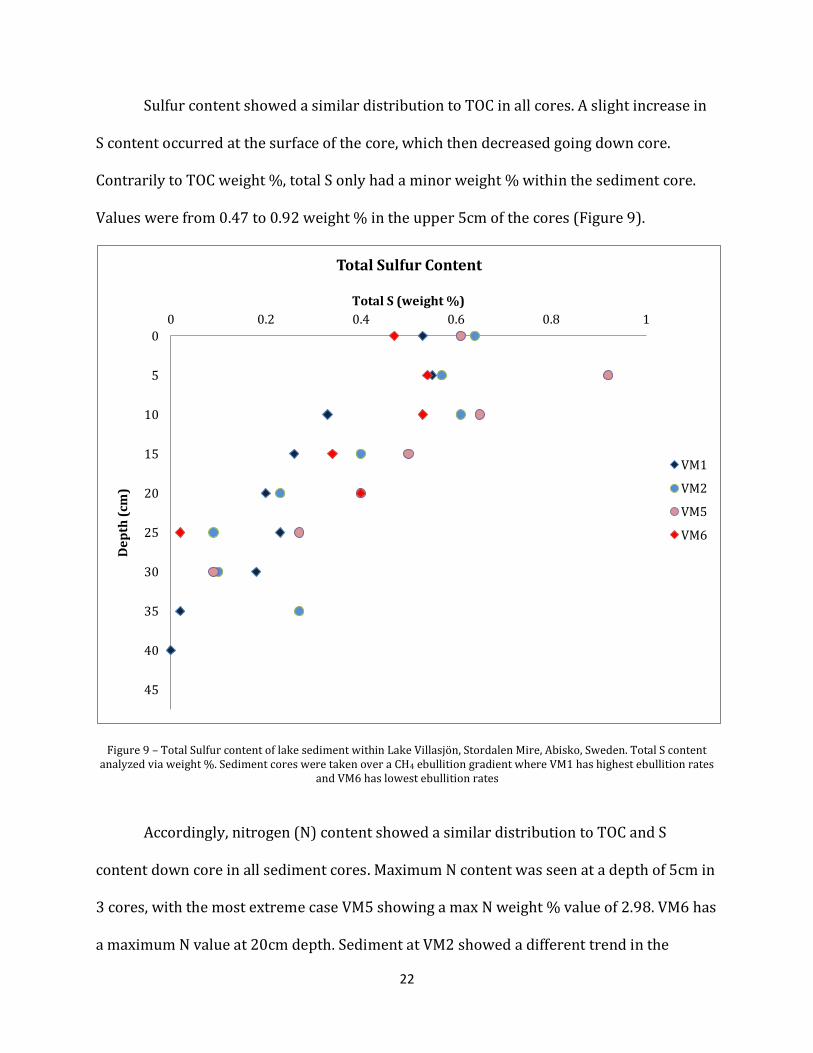
Sulfur content showed a similar distribution to TOC in all cores. A slight increase in
S content occurred at the surface of the core, which then decreased going down core.
Contrarily to TOC weight %, total S only had a minor weight % within the sediment core.
Values were from 0.47 to 0.92 weight % in the upper 5cm of the cores (Figure 9).
Figure 9 – Total Sulfur content of lake sediment within Lake Villasjӧn, Stordalen Mire, Abisko, Sweden. Total S content analyzed via weight %. Sediment cores were taken over a CH4 ebullition gradient where VM1 has highest ebullition rates
and VM6 has lowest ebullition rates
Accordingly, nitrogen (N) content showed a similar distribution to TOC and S
content down core in all sediment cores. Maximum N content was seen at a depth of 5cm in
3 cores, with the most extreme case VM5 showing a max N weight % value of 2.98. VM6 has
a maximum N value at 20cm depth. Sediment at VM2 showed a different trend in the
0
5
10
15
20
25
30
35
40
45
0 0.2 0.4 0.6 0.8 1
De
pth
(cm
)
Total S (weight %)
Total Sulfur Content
VM1
VM2
VM5
VM6

23
bottom portion as it decreases to ~1.1 weight % N at depth 25cm and then increases again
to ~1.8 weight % N at 35cm depth (Figure 10).
Figure 10 – Graphic showing total nitrogen (N) content within sediments from Lake Villasjӧn, Stordalen Mire, Abisko, Sweden. Nitrogen content is shown as weight %. Sediment cores were taken over a CH4 ebullition gradient where VM1
has highest ebullition rates and VM6 has lowest ebullition rates.
0
5
10
15
20
25
30
35
40
45
0.0 0.5 1.0 1.5 2.0 2.5 3.0 3.5
De
pth
(cm
)
Weight %
Total Nitrogen Content
VM1
VM2
VM5
VM6
24
Discussion
Elevated Hg concentrations are seen in both of the higher ebullition sites in the VM
transect. One possible factor that can be related to these concentration differences is the
grain size distribution throughout Lake Villasjӧn. Three cores show similar sand to silt
ratios in the top sediments and changes in deeper sediments. With Hg most prominent in
the upper portions of the cores, the upper most portion of grain size percentages are most
important.
Lake Villasjӧn is a closed lake, meaning there are no inputs or outlets of water.
There is speculation, although, that there may be groundwater movement from the
southeastern portion of Lake Villasjӧn to the northwestern bay, flowing directly parallel to
my chosen transect. Thus when analyzing extractable and total Hg content and its
attachment to clastics, if groundwater movement were to sort suspended grain particles,
larger grains would be present near VM5 and VM6 and smaller grains would be near VM1
and VM2. Grain size can be directly related to extractable Hg and total Hg because with
more surface area to be digested in chemical analysis, Hg content is going to be elevated.
Overall with this theory, where there are smaller grains in the sediment column, one would
expect higher Hg concentrations and vice-versa.
Keep in mind the difference between extractable and total Hg content relates to the
methods in which each were analyzed. Extractable Hg values for VM1 and VM6 were
acquired via cold vapor ICP-MS after three digestion processes. Total Hg content values
were acquired via thermal decomposition and cold vapor atomic fluorescence. Total Hg
content takes into account the Hg content within the clastic (inorganic material) and also
the organic material in the sediment, whereas the extractable Hg content only measures
25
the Hg bound/attached to the clastics and organics. The different methods arose from time
constraints within my research program. Also note that I specifically measured bulk Hg, an
unknown amount of which may potentially be methylated. Actual methylated Hg values are
yet to be determined.
Methane is produced from the breakdown of organics by bacterial activity which
feed on nutrients in the organics. The relationship of CH4 and the primary nutrients (TOC, S
and N) can be seen as a direct correlation exists at site VM2 at 35cm depth. TOC, S, and N
content increased at 35cm depth, also seen with a rapid spike in CH4 content at 35cm
depth. The increase in nutrients likely supplied the bacterial community with the resources
needed to produce more CH4 than in other depths of the core. This relationship was only
seen in the lower portion of cores at VM2 and VM5: in the upper portions of all cores the
CH4 content decreased near the surface. The decrease in CH4 content near the surface is
likely related to the release of CH4 during ebullition. The upper portion of the sediment
column throughout all of Lake Villasjӧn was unconsolidated and organic rich. Thus the
potential for the sediment column to hold the CH4 in bubble form decreased near the
surface. The lower portion of the sediment column was much more compact and
consolidated, making a better environment for CH4 storage. Overtime, CH4 will travel
upward in the sediment column and will ultimately be released through ebullition.
Ultimately, elevated Hg content was seen where there was an abundance of primary
nutrients. The elevated Hg content was likely from the strong binding of Hg to organic
material. This correlation was seen best in the highest ebullition site VM1. Hg positively
correlates with TOC and Total Sulfur in VM1 with R2 values of 0.74 and 0.92, respectively.
Methegenesis of CH4 and Hg methylation likely correspond with one another as
26
correlations with TOC and Total Sulfur were highest in the VM1 site. Where more ebullition
was occurring, one can expect more bacterial activity. With more bacterial activity, more
methylation of Hg was likely to occur and ultimately elevate bulk Hg concentrations in the
sediment column.
Overall, the findings imply that (1) processes that enhance CH4 mobilization may
also affect Hg dynamics in sediment cores and (2) assessing overall Hg behavior in lakes
requires cores in multiple locations.
27
References Cited André, M-F. 2002. Rates of Postglacial Rock Weathering on Glacially Scoured Outcrops
(Abisko-Riksgränsen Area, 68°N). Geografiska Annaler 84, 139-150 Anthony, K.M.W., Vas, D.A., Brosius, L., Chapin III, S.C., Zimov, S.A., and Zhuang, Q. 2010.
Estimating methane emissions from northern lakes using ice-bubble surveys. American Society of Limnology and Oceanography, Inc
Ariya, P. A., et al. 2004. The Arctic: A sink for mercury. Tellus, Series B 56, 397–403 Bakkelid, S. 1986. The determination of rates of land uplift in Norway. Tectonophysics 130,
307-326 Barnekow, L. 2000. Holocene regional and local vegetation history and lake-level changes
in the Torneträsk area , northern Sweden. Journal of Paleolimnology 23, 399-420 Biester, H., Martinez Cortizas, A., Birkenstock, S., and Kilian, R. 2003. Effect of peat
decomposition and mass loss on historic mercury records in peat bogs from Patagonia. Environmental Science and Technology 37, 32–9
Bigler, C., Larocque, I., Peglar, S.M., Birks, H.J., and Hall, R.I. 2002. Quantitative multiproxy
assessment of long-term patterns of Holocene environmental change from a small lake near Abisko, northern Sweden. The Holocene 12, 481-496
Bindler, R., Klarqvist, M., Klaminder, J., and Forster, J. 2004. Does within-bog spatial
variability of mercury and lead constrain reconstructions of absolute deposition rates from single peat records? The example of Store Mosse, Sweden. Global Biogeochemical Cycles 18
Christensen, T.R., Johanson, T., A ° kerman, J., and Mastepanov, M. 2004. Thawing sub-Arctic
permafrost: effects on vegetation and methane emissions. Geophysical Research Letters 31
Cocks, R.L., and Torsvik, T.H. 2005. Baltica from the late Precambrian to mid-Palaeozoic
times: the gain and loss of a terrane’s identity. Earth-Science Reviews 72, 39-66 Corfu, F., Gerber, M., Andersen, T.B., Torsvik, T.H., and Ashwal, L.D. 2011. Age and
significance of Grenvillian and Silurian orogenic events in the Finnmarkian Caledonides, northern Norway. Canadian Journal of Earth Sciences 48, 419-440
Dobiński, W. 2010. Geophysical characteristics of permafrost in the Abisko area, northern
Sweden. Polish Polar Research 31, 141-158

28
Douglas, T.A., Loseto, L.L., Macdonald, R.W., Outridge, P., Dommergue, A., Poulain, A., Amyot, M., Barkay, T., Berg, T., Chételat, J., Constant, P., Evans, M., Ferrari, C., Gantner, N., Johnson, M.S., Kirk, J., Kroer, N., Larose, C., Lean, D., Gissel Nielsen, T., Poissant, L., Rognerud, S., Skov, H., SØrensen, S., Wang, F., Wilson, S. and Zdanowicz, C.M. 2012. The fate of mercury in Arctic terrestrial and aquatic ecosystems, a review. Environmental Chemistry 9, 321
Fitzgerald, W. F., Lamborg, C.H. and Hammerschmidt, C.R. 2007. Marine biogeochemical
cycling of mercury. Chemical Reviews 107, 641 Gee, D.G., Juhlin, C., Pascal, C., and Robinson, P. 2010. Collisional Orogeny in the
Scandinavian Caledonides. GFF 132, 29-44 Gilmour, C. C., et al. 1992. Sulfate stimulation of mercury methylation in fresh-water
sediments. Environmental Science Technology 26, 2281– 2287 Grudd, H., et al. 2002. A 7400-year tree-ring chronology in northern Swedish Lapland:
natural climatic variability expressed on annual to millennial timescales. The Holocene 12, 657-665
Kathol, B. 1987. The Váivvančohkka Nappe , Torneträsk area , northern Swedish Caledonides. Geologiska Foereningan i Stockholm 109, 350-353
Klaminder, J., Yoo, K., Rydberg, J., and Giesler, R. 2008. An explorative study of mercury
export from a thawing palsa mire. Journal of Geophysical Research 113 Kleman, J., and Hättestrand, C. 1999. Frozen-bed Fennoscandian and Laurentide ice sheets
during the Last Glacial Maximum. Nature 402, 63-66 Kokfelt, U., et al. 2010. Wetland development, permafrost history and nutrient cycling
inferred from late Holocene peat and lake sediment records in subarctic Sweden. Journal of Paleolimnology 44, 327-342
Kokfelt, U., Reuss, N., Struyf, E., Sonesson, M., Rundgren, M., Skog, G., Rosén, P., and
Hammarlund, D. 2010. Wetland Development, Permafrost History and Nutrient Cycling Inferred from Late Holocene Peat and Lake Sediment Records in Subarctic Sweden. Journal of Paleolimnology 44.1, 327-42
Kokfelt, U., Rose´n, P., Schoning, K., Christensen, T.R., Förster, J., Karlsson, J., Reuss, N.,
Rundgren, M., Callaghan, T.V., Jonasson, C., and Hammarlund, D. 2009. Ecosystem responses to increased precipitation and permafrost decay in sub-Arctic Sweden inferred from peat and lake sediments. Global Change Biology 15, 1652–1663
Lidmar-Bergström, K., Näslund, J.O., Ebert, K., Neubeck, T. and Bonow, J.M. 2007. Cenozoic
landscape development on the passive margin of northern Scandinavia. Norwegian Journal of Geology 87, 181-196
29
Lindén, M., Möller, P., Björck, S., and Sandgren, P. 2006. Holocene shore displacement and deglaciation chronology in Norrbotten, Sweden. Boreas 35, 1-22
Lindström, M. 1987. Northernmost Scandinavia in the Geological Perspective. Ecological
Bulletins 38, 17-37 Martinez-Cortizas, A., Pontevedra-Pombal, X., Garcia-Rodeja, E., Novoa-Munoz, J.C., and
Shotyk, W. 1999. Mercury in a Spanish peat bog: archive of climate change and atmospheric metal deposition. Science 284, 939–42
Mason, R.P., Reinfelder J.R. and M. Morel F.M. 1996. Uptake, toxicity, and trophic transfer of
mercury in a coastal diatom. Environmental Science and Technology 30, 1835 Roberts, D. 2002. The Scandonavian Caledonides: ebent chronology, palaeogeographic
settings and likely modern analogues. Tectonophysics 365, 283-299 Shemesh, A., et al. 2001. Holocene climatic change in Swedish Lapland inferred from an
oxygen-isotope record of lacustrine biogenic silica. The Holocene 11, 447-454 Snowball, I.F. 1996. Holocene environmental change in the Abisko region of northern
Sweden recorded by the mineral magnetic stratigraphy of lake sediments. GFF 118, 9-17
Steffen, A., et al. 2008. A synthesis of atmospheric mercury depletion event chemistry in the
atmosphere and snow. Atmospheric Chemistry and Physics 8, 1445– 1482 Stroeven, A.P., Fabel, D., Harbor, J., Hattestrand, C., and Kleman, J. 2002. Quantifying the
erosional impact of the Fennoscandian ice sheet in the Tornetrask-Narvik corridor, northern Sweden, based on cosmogenic radionuclide data. Geografiska Annaler 84, 275-287
Taylor, P. 2009. Holocene environmental change in the Abisko region of northern Sweden
recorded by the mineral magnetic stratigraphy of lake sediments. Holocene 37-41 Van Oostdam, J., et al. 1999. Human health implications of environmental contaminants in
Arctic Canada: A review. Science of the Total Environment 230, 1– 82 Walter, K. M., Zimov, S.A., Chanton, J.P., Verbyla, D., and Chapin III, F.S. 2006. Methane
bubbling from Siberian thaw lakes as a positive feedback to climate warming. Nature 443, 71–75
Wik, M., Crill, P.M., Bastviken, D., Danielsson, Å., and Norbäck, E. 2011. Bubbles trapped in
Arctic lake ice: Potential implications for methane emissions. Journal of Geophyical Research 116
Woo, M. and Young, K. 2006. High Arctic wetlands: Their occurrence, hydrological
characteristics and sustainability. Journal of Hydrology 320, 432-450

30
Xia, K., et al. 1999. X-ray absorption spectroscopic evidence for the complexation of Hg(II) by reduced sulfur in soil humic substances. Environmental Science and Technology 33, 257– 261