Embed Size (px)
Citation preview
\\tos20-fs1\company shared folders\Misc Town\Steven\Memo\20201215Council - Budget Interim Operating Memo 2021.docx
1
MEMORANDUM
To: Stettler Town Council
From: Administration
Date: December 15, 2020
Re: 2021 – 2023 Interim Operating Budget
Recommendation:
That the Town of Stettler Council adopt, per Section 242(2) of the Municipal Government Act, the
Interim 2021 – 2023 Operating Budget, with the following 2021 budget estimates; Expenditures
totaling $18,162,839, Revenues totaling $18,811,688 and Amount Available for Capital of $648,849
for the year 2021 as an Interim Operating Budget for that part of 2021 prior to the Operating
Budget being adopted by Council.
Background
Section 242 of the Municipal Government Act (MGA) requires Council to adopt an operating
budget for each calendar year. Section 242 further states that a Council may adopt an interim
operating budget for part of a calendar year. Since the Town’s 2021 Operating Budget will not
be adopted until May 2021, an interim operating budget is required to provide legal expenditure
authority per Section 248 of the MGA.
The interim operating budget is not used to set definitive property tax rates; rather it is used as the
authority to provide services, programs
and overall corporate continuity. It is
further used by Council to justify the
setting all municipal utility rates for the
subsequent year. An interim operating
budget ceases to have any effect when
the operating budget and tax/mill rate
bylaw is adopted.
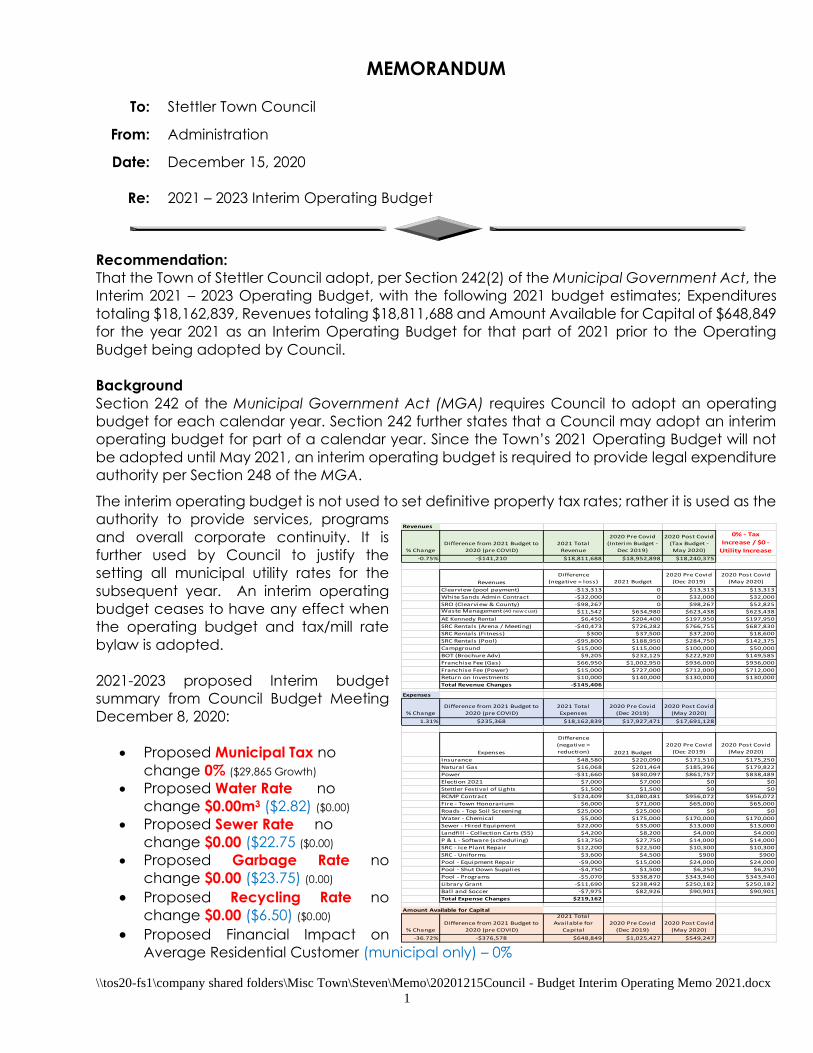
2021-2023 proposed Interim budget
summary from Council Budget Meeting
December 8, 2020:
• Proposed Municipal Tax no
change 0% ($29,865 Growth)
• Proposed Water Rate no
change $0.00m3 ($2.82) ($0.00)
• Proposed Sewer Rate no
change $0.00 ($22.75 ($0.00)
• Proposed Garbage Rate no
change $0.00 ($23.75) (0.00)
• Proposed Recycling Rate no
change $0.00 ($6.50) ($0.00)
• Proposed Financial Impact on
Average Residential Customer (municipal only) – 0%
Revenues
% Change
Difference from 2021 Budget to
2020 (pre COVID)
2021 Total
Revenue
2020 Pre Covid
(Interim Budget -
Dec 2019)
2020 Post Covid
(Tax Budget -
May 2020)
0% - Tax
Increase / $0 -
Utility Increase
-0.75% -$141,210 $18,811,688 $18,952,898 $18,240,375
Revenues
Difference
(negative = loss) 2021 Budget
2020 Pre Covid
(Dec 2019)
2020 Post Covid
(May 2020)
Clearview (pool payment) -$13,313 0 $13,313 $13,313
White Sands Admin Contract -$32,000 0 $32,000 $32,000
SRO (Clearview & County) -$98,267 0 $98,267 $52,825Waste Management (40 new cust) $11,542 $634,980 $623,438 $623,438
AE Kennedy Rental $6,450 $204,400 $197,950 $197,950
SRC Rentals (Arena / Meeting) -$40,473 $726,282 $766,755 $687,830
SRC Rentals (Fitness) $300 $37,500 $37,200 $18,600
SRC Rentals (Pool) -$95,800 $188,950 $284,750 $142,375
Campground $15,000 $115,000 $100,000 $50,000
BOT (Brochure Adv) $9,205 $232,125 $222,920 $149,585
Franchise Fee (Gas) $66,950 $1,002,950 $936,000 $936,000
Franchise Fee (Power) $15,000 $727,000 $712,000 $712,000
Return on Investments $10,000 $140,000 $130,000 $130,000
Total Revenue Changes -$145,406
Expenses
% Change
Difference from 2021 Budget to
2020 (pre COVID)
2021 Total
Expenses
2020 Pre Covid
(Dec 2019)
2020 Post Covid
(May 2020)
1.31% $235,368 $18,162,839 $17,927,471 $17,691,128
Expenses
Difference
(negative =
reduction) 2021 Budget
2020 Pre Covid
(Dec 2019)
2020 Post Covid
(May 2020)
Insurance $48,580 $220,090 $171,510 $175,250
Natural Gas $16,068 $201,464 $185,396 $179,822
Power -$31,660 $830,097 $861,757 $838,489
Election 2021 $7,000 $7,000 $0 $0
Stettler Festival of Lights $1,500 $1,500 $0 $0
RCMP Contract $124,409 $1,080,481 $956,072 $956,072
Fire - Town Honorarium $6,000 $71,000 $65,000 $65,000
Roads - Top Soil Screening $25,000 $25,000 $0 $0
Water - Chemical $5,000 $175,000 $170,000 $170,000
Sewer - Hired Equipment $22,000 $35,000 $13,000 $13,000
Landfil l - Collection Carts (55) $4,200 $8,200 $4,000 $4,000
P & L - Software (scheduling) $13,750 $27,750 $14,000 $14,000
SRC - Ice Plant Repair $12,200 $22,500 $10,300 $10,300
SRC - Uniforms $3,600 $4,500 $900 $900
Pool - Equipment Repair -$9,000 $15,000 $24,000 $24,000
Pool - Shut Down Supplies -$4,750 $1,500 $6,250 $6,250
Pool - Programs -$5,070 $338,870 $343,940 $343,940
Library Grant -$11,690 $238,492 $250,182 $250,182
Ball and Soccer -$7,975 $82,926 $90,901 $90,901
Total Expense Changes $219,162
Amount Available for Capital
% Change
Difference from 2021 Budget to
2020 (pre COVID)
2021 Total
Available for
Capital
2020 Pre Covid
(Dec 2019)
2020 Post Covid
(May 2020)
-36.72% -$376,578 $648,849 $1,025,427 $549,247
\\tos20-fs1\company shared folders\Misc Town\Steven\Memo\20201215Council - Budget Interim Operating Memo 2021.docx
2
Administration considers the 0% property tax increase and $0.00 utility rate increases included in
the 2021 Interim Operating Budget necessary given the current economic conditions and future
obligations required in our community. The three-year forecast reflects Administration and
Council’s intent to be fiscally responsible and accountable to its residents.
The 2021 – 2023 Operating Budget enables Council to sustain the current high level of public
services, facilities and utilities for all Stettler residents, as well as continue to renew existing
infrastructure, in light of the current and future economic conditions due to COVID.
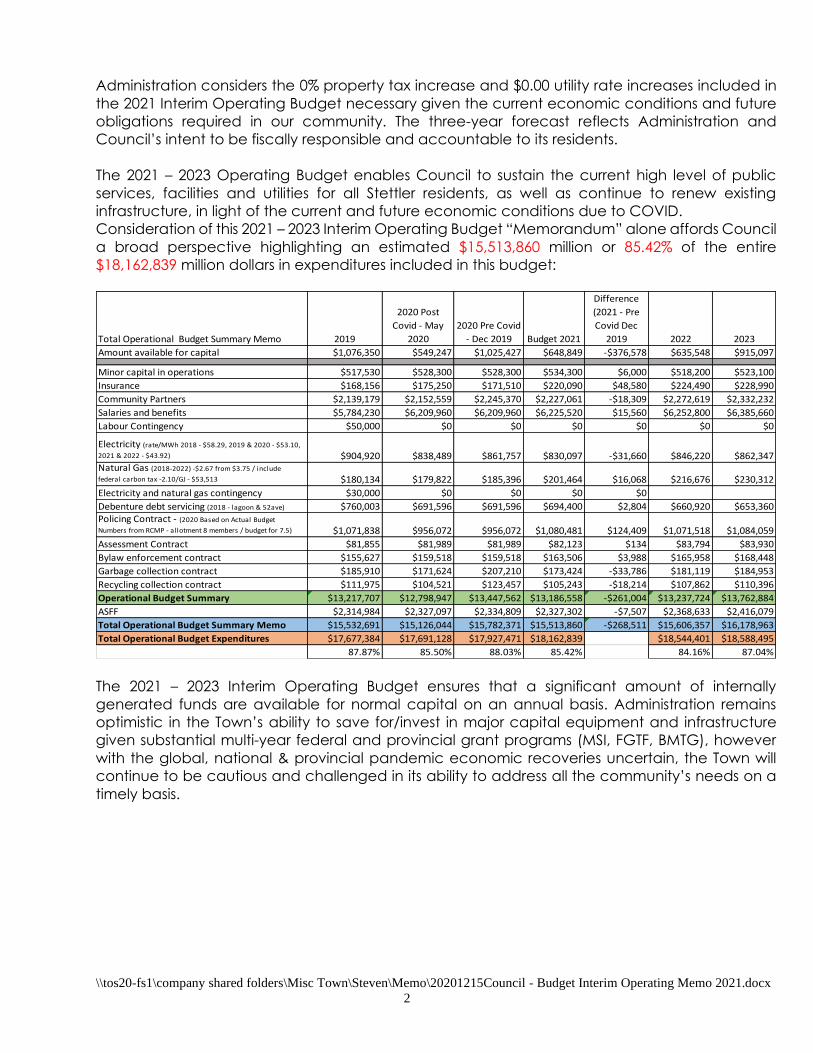
Consideration of this 2021 – 2023 Interim Operating Budget “Memorandum” alone affords Council
a broad perspective highlighting an estimated $15,513,860 million or 85.42% of the entire
$18,162,839 million dollars in expenditures included in this budget:
The 2021 – 2023 Interim Operating Budget ensures that a significant amount of internally
generated funds are available for normal capital on an annual basis. Administration remains
optimistic in the Town’s ability to save for/invest in major capital equipment and infrastructure
given substantial multi-year federal and provincial grant programs (MSI, FGTF, BMTG), however
with the global, national & provincial pandemic economic recoveries uncertain, the Town will
continue to be cautious and challenged in its ability to address all the community’s needs on a
timely basis.
Total Operational Budget Summary Memo 2019
2020 Post
Covid - May
2020
2020 Pre Covid
- Dec 2019 Budget 2021
Difference
(2021 - Pre
Covid Dec
2019 2022 2023
Amount available for capital $1,076,350 $549,247 $1,025,427 $648,849 -$376,578 $635,548 $915,097
Minor capital in operations $517,530 $528,300 $528,300 $534,300 $6,000 $518,200 $523,100
Insurance $168,156 $175,250 $171,510 $220,090 $48,580 $224,490 $228,990
Community Partners $2,139,179 $2,152,559 $2,245,370 $2,227,061 -$18,309 $2,272,619 $2,332,232
Salaries and benefits $5,784,230 $6,209,960 $6,209,960 $6,225,520 $15,560 $6,252,800 $6,385,660
Labour Contingency $50,000 $0 $0 $0 $0 $0 $0
Electricity (rate/MWh 2018 - $58.29, 2019 & 2020 - $53.10,
2021 & 2022 - $43.92) $904,920 $838,489 $861,757 $830,097 -$31,660 $846,220 $862,347Natural Gas (2018-2022) -$2.67 from $3.75 / include
federal carbon tax -2.10/GJ - $53,513 $180,134 $179,822 $185,396 $201,464 $16,068 $216,676 $230,312
Electricity and natural gas contingency $30,000 $0 $0 $0 $0
Debenture debt servicing (2018 - lagoon & 52ave) $760,003 $691,596 $691,596 $694,400 $2,804 $660,920 $653,360Policing Contract - (2020 Based on Actual Budget
Numbers from RCMP - allotment 8 members / budget for 7.5) $1,071,838 $956,072 $956,072 $1,080,481 $124,409 $1,071,518 $1,084,059
Assessment Contract $81,855 $81,989 $81,989 $82,123 $134 $83,794 $83,930
Bylaw enforcement contract $155,627 $159,518 $159,518 $163,506 $3,988 $165,958 $168,448
Garbage collection contract $185,910 $171,624 $207,210 $173,424 -$33,786 $181,119 $184,953
Recycling collection contract $111,975 $104,521 $123,457 $105,243 -$18,214 $107,862 $110,396
Operational Budget Summary $13,217,707 $12,798,947 $13,447,562 $13,186,558 -$261,004 $13,237,724 $13,762,884
ASFF $2,314,984 $2,327,097 $2,334,809 $2,327,302 -$7,507 $2,368,633 $2,416,079
Total Operational Budget Summary Memo $15,532,691 $15,126,044 $15,782,371 $15,513,860 -$268,511 $15,606,357 $16,178,963
Total Operational Budget Expenditures $17,677,384 $17,691,128 $17,927,471 $18,162,839 $18,544,401 $18,588,495
87.87% 85.50% 88.03% 85.42% 84.16% 87.04%
\\tos20-fs1\company shared folders\Misc Town\Steven\Memo\20201215Council - Budget Interim Operating Memo 2021.docx
3
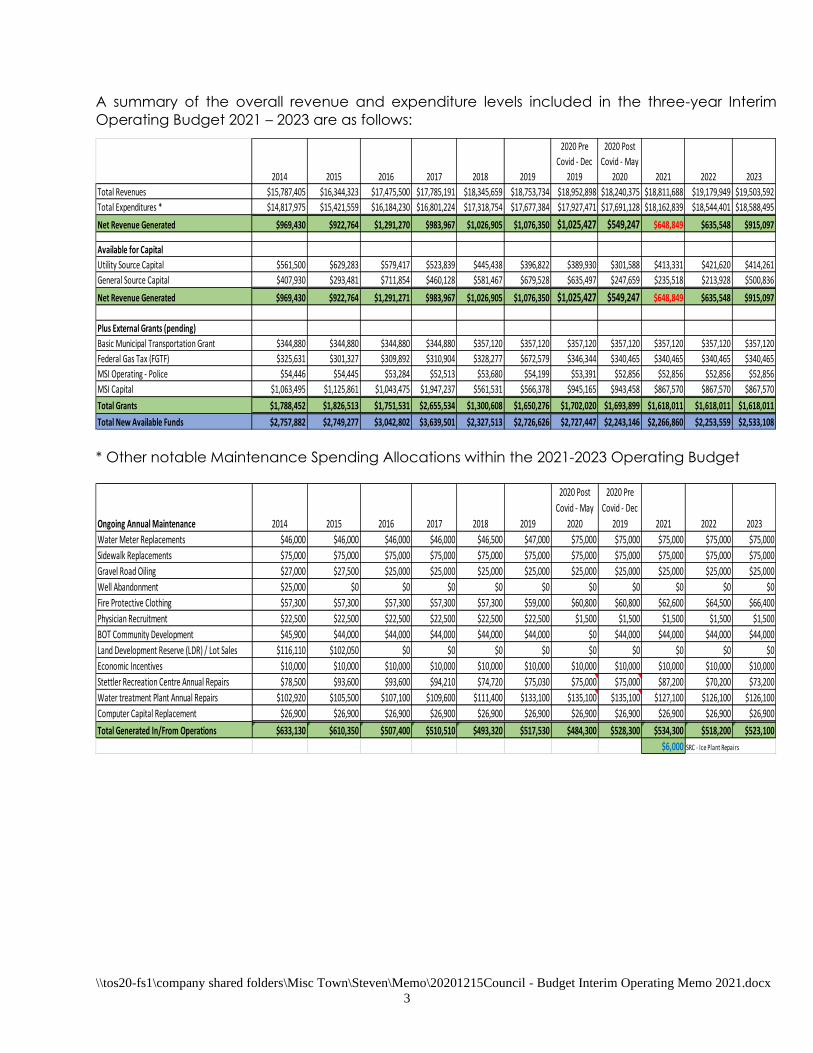
A summary of the overall revenue and expenditure levels included in the three-year Interim
Operating Budget 2021 – 2023 are as follows:
* Other notable Maintenance Spending Allocations within the 2021-2023 Operating Budget
2014 2015 2016 2017 2018 2019
2020 Pre
Covid - Dec
2019
2020 Post
Covid - May
2020 2021 2022 2023
Total Revenues $15,787,405 $16,344,323 $17,475,500 $17,785,191 $18,345,659 $18,753,734 $18,952,898 $18,240,375 $18,811,688 $19,179,949 $19,503,592
Total Expenditures * $14,817,975 $15,421,559 $16,184,230 $16,801,224 $17,318,754 $17,677,384 $17,927,471 $17,691,128 $18,162,839 $18,544,401 $18,588,495
Net Revenue Generated $969,430 $922,764 $1,291,270 $983,967 $1,026,905 $1,076,350 $1,025,427 $549,247 $648,849 $635,548 $915,097
Available for Capital
Utility Source Capital $561,500 $629,283 $579,417 $523,839 $445,438 $396,822 $389,930 $301,588 $413,331 $421,620 $414,261
General Source Capital $407,930 $293,481 $711,854 $460,128 $581,467 $679,528 $635,497 $247,659 $235,518 $213,928 $500,836
Net Revenue Generated $969,430 $922,764 $1,291,271 $983,967 $1,026,905 $1,076,350 $1,025,427 $549,247 $648,849 $635,548 $915,097
Plus External Grants (pending)
Basic Municipal Transportation Grant $344,880 $344,880 $344,880 $344,880 $357,120 $357,120 $357,120 $357,120 $357,120 $357,120 $357,120
Federal Gas Tax (FGTF) $325,631 $301,327 $309,892 $310,904 $328,277 $672,579 $346,344 $340,465 $340,465 $340,465 $340,465
MSI Operating - Police $54,446 $54,445 $53,284 $52,513 $53,680 $54,199 $53,391 $52,856 $52,856 $52,856 $52,856
MSI Capital $1,063,495 $1,125,861 $1,043,475 $1,947,237 $561,531 $566,378 $945,165 $943,458 $867,570 $867,570 $867,570
Total Grants $1,788,452 $1,826,513 $1,751,531 $2,655,534 $1,300,608 $1,650,276 $1,702,020 $1,693,899 $1,618,011 $1,618,011 $1,618,011
Total New Available Funds $2,757,882 $2,749,277 $3,042,802 $3,639,501 $2,327,513 $2,726,626 $2,727,447 $2,243,146 $2,266,860 $2,253,559 $2,533,108
Ongoing Annual Maintenance 2014 2015 2016 2017 2018 2019
2020 Post
Covid - May
2020
2020 Pre
Covid - Dec
2019 2021 2022 2023
Water Meter Replacements $46,000 $46,000 $46,000 $46,000 $46,500 $47,000 $75,000 $75,000 $75,000 $75,000 $75,000
Sidewalk Replacements $75,000 $75,000 $75,000 $75,000 $75,000 $75,000 $75,000 $75,000 $75,000 $75,000 $75,000
Gravel Road Oiling $27,000 $27,500 $25,000 $25,000 $25,000 $25,000 $25,000 $25,000 $25,000 $25,000 $25,000
Well Abandonment $25,000 $0 $0 $0 $0 $0 $0 $0 $0 $0 $0
Fire Protective Clothing $57,300 $57,300 $57,300 $57,300 $57,300 $59,000 $60,800 $60,800 $62,600 $64,500 $66,400
Physician Recruitment $22,500 $22,500 $22,500 $22,500 $22,500 $22,500 $1,500 $1,500 $1,500 $1,500 $1,500
BOT Community Development $45,900 $44,000 $44,000 $44,000 $44,000 $44,000 $0 $44,000 $44,000 $44,000 $44,000
Land Development Reserve (LDR) / Lot Sales $116,110 $102,050 $0 $0 $0 $0 $0 $0 $0 $0 $0
Economic Incentives $10,000 $10,000 $10,000 $10,000 $10,000 $10,000 $10,000 $10,000 $10,000 $10,000 $10,000
Stettler Recreation Centre Annual Repairs $78,500 $93,600 $93,600 $94,210 $74,720 $75,030 $75,000 $75,000 $87,200 $70,200 $73,200
Water treatment Plant Annual Repairs $102,920 $105,500 $107,100 $109,600 $111,400 $133,100 $135,100 $135,100 $127,100 $126,100 $126,100
Computer Capital Replacement $26,900 $26,900 $26,900 $26,900 $26,900 $26,900 $26,900 $26,900 $26,900 $26,900 $26,900
Total Generated In/From Operations $633,130 $610,350 $507,400 $510,510 $493,320 $517,530 $484,300 $528,300 $534,300 $518,200 $523,100
$6,000 SRC - Ice Plant Repairs

\\tos20-fs1\company shared folders\Misc Town\Steven\Memo\20201215Council - Budget Interim Operating Memo 2021.docx
4
Land Development The Town of Stettler’s Land Development portfolio has an approximate fair market value at
December 31st, 2020 as estimated below:
Realized:
Land Development Reserve @ Dec. 31/20 $1,071,555
Projected additions to Dec. 31/21 $0.00
Projected deletions to Dec. 31/21 $0.00
Total Land Development Reserve @ Dec 31/21 $1,071,555
Unrealized:
Meadowlands – (68 acres undeveloped) $700,000
Meadowlands (5 lots unsold) $308,250 ($61,650 per lot)
Emmerson (1 duplex lot unsold) $74,900 ($74,900 per lot)
Emmerson (partially serviced 53 lots) $530,000 (@ $10,000 per lot)
NE Industrial (128 acres undeveloped) $1,280,000 (@ $10,000 per acre)
Net Fair Value $3,964,705
Administration, being conservative, has not forecast any sales of our remaining serviced
residential lots/undeveloped lands in 2021. Although Town lots are priced competitively, local lot
sales/home construction is being predominantly driven privately in Meadowlands by the Park.
Normally the Town’s unrealized Land Development properties, through relatively consistent
annual lot sales, would have provided this Interim Operating Budget with approximately $55,270
towards Subdivision Administration departmental costs and a further $40,000 (ROI like)
contribution. However, with no forecasted municipal lot sales in 2021, the Operating Budget is
now absorbing this combined $95,270 revenue loss. Subdivision Administration will now be paid
by other enhanced revenue sources included in this Budget.
In 2016 Council accepted that all future lot/land sale proceeds upon realization be transferred
fully into the Land Development Reserve to mitigate the further erosion of this saving fund for
future considerations.
\\tos20-fs1\company shared folders\Misc Town\Steven\Memo\20201215Council - Budget Interim Operating Memo 2021.docx
5
This decision will help preserve the significant value of our (dormant for now) Land Development
holdings. Down the road Administration believes that the Town will be in a better position to
ultimately expend these funds on valued major infrastructure expansion, community
projects/facilities, or to re-enter the land development environment, if necessary.
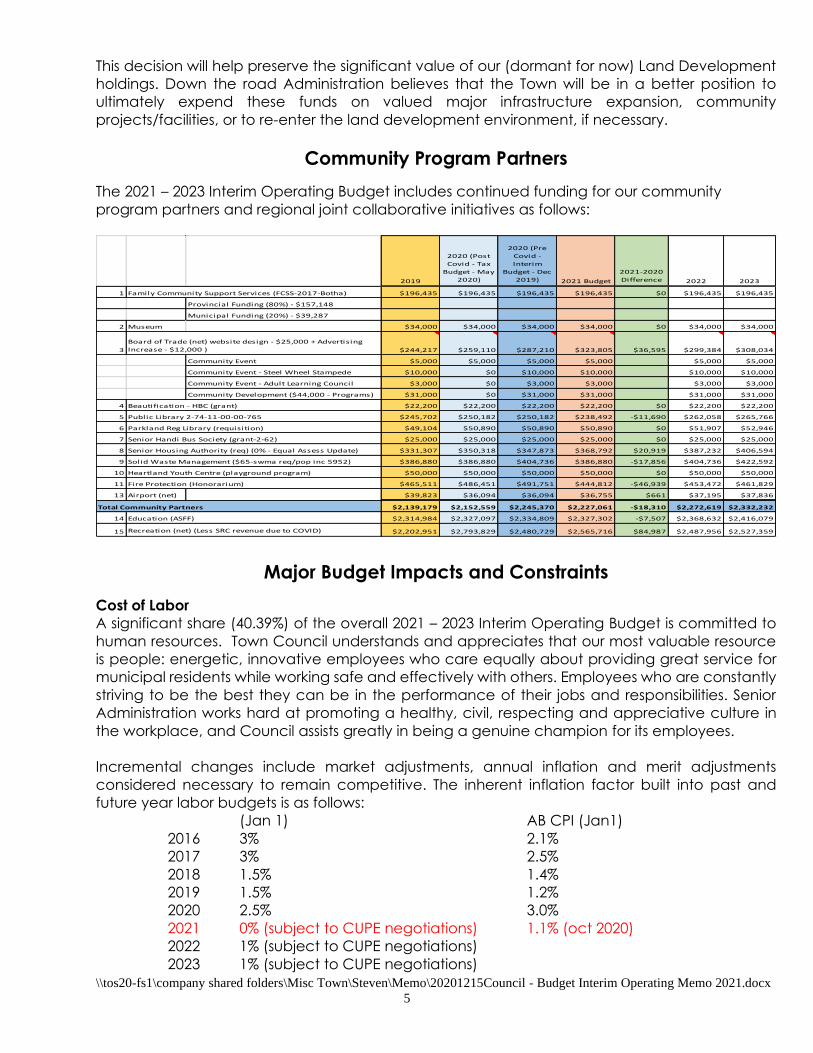
Community Program Partners
The 2021 – 2023 Interim Operating Budget includes continued funding for our community
program partners and regional joint collaborative initiatives as follows:
Major Budget Impacts and Constraints
Cost of Labor
A significant share (40.39%) of the overall 2021 – 2023 Interim Operating Budget is committed to
human resources. Town Council understands and appreciates that our most valuable resource
is people: energetic, innovative employees who care equally about providing great service for
municipal residents while working safe and effectively with others. Employees who are constantly
striving to be the best they can be in the performance of their jobs and responsibilities. Senior
Administration works hard at promoting a healthy, civil, respecting and appreciative culture in
the workplace, and Council assists greatly in being a genuine champion for its employees.
Incremental changes include market adjustments, annual inflation and merit adjustments
considered necessary to remain competitive. The inherent inflation factor built into past and
future year labor budgets is as follows:
(Jan 1) AB CPI (Jan1)
2016 3% 2.1%
2017 3% 2.5%
2018 1.5% 1.4%
2019 1.5% 1.2%
2020 2.5% 3.0%
2021 0% (subject to CUPE negotiations) 1.1% (oct 2020)
2022 1% (subject to CUPE negotiations)
2023 1% (subject to CUPE negotiations)
2019
2020 (Post
Covid - Tax
Budget - May
2020)
2020 (Pre
Covid -
Interim
Budget - Dec
2019) 2021 Budget
2021-2020
Difference 2022 2023
1 Family Community Support Services (FCSS-2017-Botha) $196,435 $196,435 $196,435 $196,435 $0 $196,435 $196,435
Provincial Funding (80%) - $157,148
Municipal Funding (20%) - $39,287
2 Museum $34,000 $34,000 $34,000 $34,000 $0 $34,000 $34,000
3 $244,217 $259,110 $287,210 $323,805 $36,595 $299,384 $308,034
Community Event $5,000 $5,000 $5,000 $5,000 $5,000 $5,000
Community Event - Steel Wheel Stampede $10,000 $0 $10,000 $10,000 $10,000 $10,000
Community Event - Adult Learning Council $3,000 $0 $3,000 $3,000 $3,000 $3,000
Community Development ($44,000 - Programs) $31,000 $0 $31,000 $31,000 $31,000 $31,000
4 Beautification - HBC (grant) $22,200 $22,200 $22,200 $22,200 $0 $22,200 $22,200
5 Public Library 2-74-11-00-00-765 $245,702 $250,182 $250,182 $238,492 -$11,690 $262,058 $265,766
6 Parkland Reg Library (requisition) $49,104 $50,890 $50,890 $50,890 $0 $51,907 $52,946
7 Senior Handi Bus Society (grant-2-62) $25,000 $25,000 $25,000 $25,000 $0 $25,000 $25,000
8 Senior Housing Authority (req) (0% - Equal Assess Update) $331,307 $350,318 $347,873 $368,792 $20,919 $387,232 $406,594
9 Solid Waste Management ($65-swma req/pop inc 5952) $386,880 $386,880 $404,736 $386,880 -$17,856 $404,736 $422,592
10 Heartland Youth Centre (playground program) $50,000 $50,000 $50,000 $50,000 $0 $50,000 $50,000
11 Fire Protection (Honorarium) $465,511 $486,451 $491,751 $444,812 -$46,939 $453,472 $461,829
13 Airport (net) $39,823 $36,094 $36,094 $36,755 $661 $37,195 $37,836
Total Community Partners $2,139,179 $2,152,559 $2,245,370 $2,227,061 -$18,310 $2,272,619 $2,332,232
14 Education (ASFF) $2,314,984 $2,327,097 $2,334,809 $2,327,302 -$7,507 $2,368,632 $2,416,079
15 Recreation (net) (Less SRC revenue due to COVID) $2,202,951 $2,793,829 $2,480,729 $2,565,716 $84,987 $2,487,956 $2,527,359
Board of Trade (net) website design - $25,000 + Advertising
Increase - $12,000 )
\\tos20-fs1\company shared folders\Misc Town\Steven\Memo\20201215Council - Budget Interim Operating Memo 2021.docx
6
The Town is a service provider and the provision of municipal services is enhanced by employing
and maintaining a well-trained, experienced and dedicated team. Employees are considered
our most valuable asset and the retention of knowledgeable staff is considered a very high
priority within our organization.
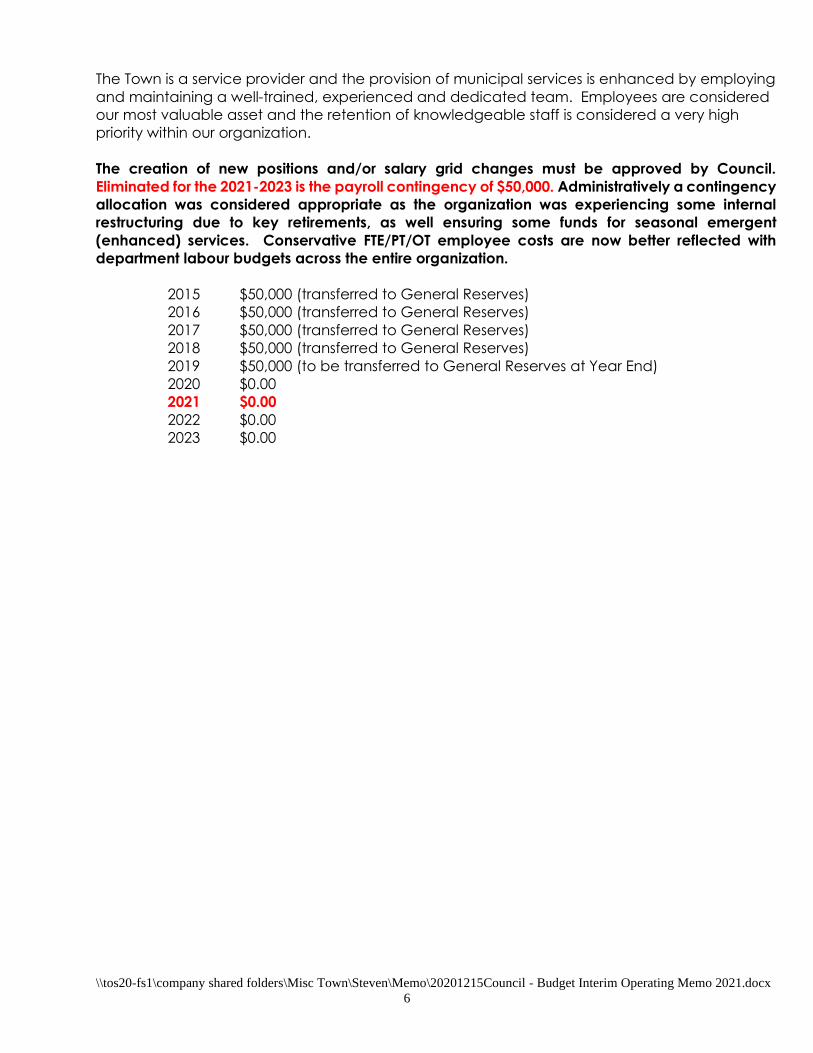
The creation of new positions and/or salary grid changes must be approved by Council.
Eliminated for the 2021-2023 is the payroll contingency of $50,000. Administratively a contingency
allocation was considered appropriate as the organization was experiencing some internal
restructuring due to key retirements, as well ensuring some funds for seasonal emergent
(enhanced) services. Conservative FTE/PT/OT employee costs are now better reflected with
department labour budgets across the entire organization.
2015 $50,000 (transferred to General Reserves)
2016 $50,000 (transferred to General Reserves)
2017 $50,000 (transferred to General Reserves)
2018 $50,000 (transferred to General Reserves)
2019 $50,000 (to be transferred to General Reserves at Year End)
2020 $0.00
2021 $0.00
2022 $0.00
2023 $0.00
\\tos20-fs1\company shared folders\Misc Town\Steven\Memo\20201215Council - Budget Interim Operating Memo 2021.docx
7
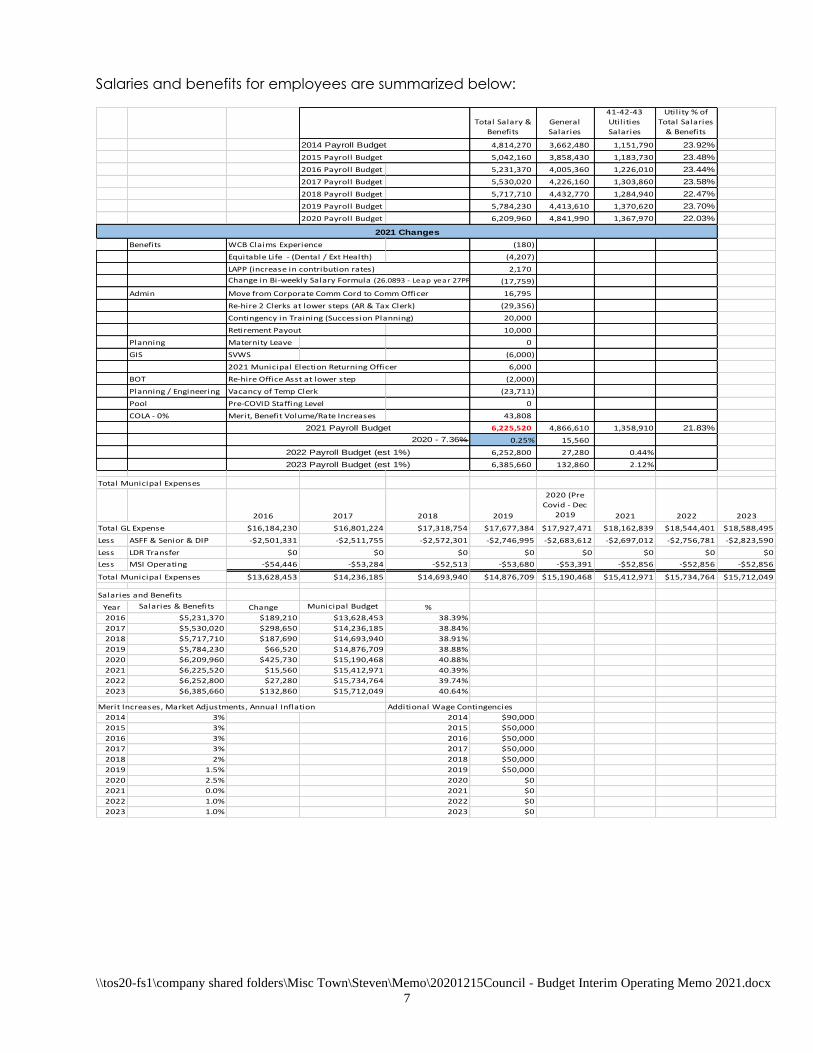
Salaries and benefits for employees are summarized below:
Total Salary &
Benefits
General
Salaries
41-42-43
Util ities
Salaries
Util ity % of
Total Salaries
& Benefits
4,814,270 3,662,480 1,151,790 23.92%
5,042,160 3,858,430 1,183,730 23.48%
2016 Payroll Budget 5,231,370 4,005,360 1,226,010 23.44%
2017 Payroll Budget 5,530,020 4,226,160 1,303,860 23.58%
2018 Payroll Budget 5,717,710 4,432,770 1,284,940 22.47%
2019 Payroll Budget 5,784,230 4,413,610 1,370,620 23.70%
2020 Payroll Budget 6,209,960 4,841,990 1,367,970 22.03%
Benefits WCB Claims Experience (180)
Equitable Life - (Dental / Ext Health) (4,207)
2,170
Change in Bi-weekly Salary Formula (26.0893 - Leap year 27PP) (17,759)
Admin Move from Corporate Comm Cord to Comm Officer 16,795
Re-hire 2 Clerks at lower steps (AR & Tax Clerk) (29,356)
Contingency in Training (Succession Planning) 20,000
Retirement Payout 10,000
Planning Maternity Leave 0
GIS SVWS (6,000)
2021 Municipal Election Returning Officer 6,000
BOT Re-hire Office Asst at lower step (2,000)
Planning / Engineering Vacancy of Temp Clerk (23,711)
Pool Pre-COVID Staffing Level 0
COLA - 0% Merit, Benefit Volume/Rate Increases 43,808
6,225,520 4,866,610 1,358,910 21.83%
0.25% 15,560
6,252,800 27,280 0.44%
6,385,660 132,860 2.12%
Total Municipal Expenses
2016 2017 2018 2019
2020 (Pre
Covid - Dec
2019 2021 2022 2023
Total GL Expense $16,184,230 $16,801,224 $17,318,754 $17,677,384 $17,927,471 $18,162,839 $18,544,401 $18,588,495
Less ASFF & Senior & DIP -$2,501,331 -$2,511,755 -$2,572,301 -$2,746,995 -$2,683,612 -$2,697,012 -$2,756,781 -$2,823,590
Less LDR Transfer $0 $0 $0 $0 $0 $0 $0 $0
Less MSI Operating -$54,446 -$53,284 -$52,513 -$53,680 -$53,391 -$52,856 -$52,856 -$52,856
Total Municipal Expenses $13,628,453 $14,236,185 $14,693,940 $14,876,709 $15,190,468 $15,412,971 $15,734,764 $15,712,049
Salaries and Benefits
Year Salaries & Benefits Change Municipal Budget %
2016 $5,231,370 $189,210 $13,628,453 38.39%
2017 $5,530,020 $298,650 $14,236,185 38.84%
2018 $5,717,710 $187,690 $14,693,940 38.91%
2019 $5,784,230 $66,520 $14,876,709 38.88%
2020 $6,209,960 $425,730 $15,190,468 40.88%
2021 $6,225,520 $15,560 $15,412,971 40.39%
2022 $6,252,800 $27,280 $15,734,764 39.74%
2023 $6,385,660 $132,860 $15,712,049 40.64%
Merit Increases, Market Adjustments, Annual Inflation Additional Wage Contingencies
2014 3% 2014 $90,000
2015 3% 2015 $50,000
2016 3% 2016 $50,000
2017 3% 2017 $50,000
2018 2% 2018 $50,000
2019 1.5% 2019 $50,000
2020 2.5% 2020 $0
2021 0.0% 2021 $0
2022 1.0% 2022 $0
2023 1.0% 2023 $0
2021 Changes
2021 Payroll Budget
2022 Payroll Budget (est 1%)
2023 Payroll Budget (est 1%)
2020 - 7.36%
2014 Payroll Budget
2015 Payroll Budget
LAPP (increase in contribution rates)
\\tos20-fs1\company shared folders\Misc Town\Steven\Memo\20201215Council - Budget Interim Operating Memo 2021.docx
8
Cost of Electricity and Natural Gas
The Town will consume approximately 5028 mWh (5,028,000 kWh) of electricity in 2021 (2020-4684
mWh) at the contracted rate with CAPITAL POWER of $43.92 per mWh (2 years: 2021-2022). The
difference in mWh is the overall usage at the SRC, lagoons, campground and traffic lights. A
summary of the Electrical Rate paid by the Town of Stettler is as follows:
• 2013 - 2018 - $58.29 mWh – ENMAX / 2019 - 2020 - $53.10 mWh - ENMAX
• 2021 – 2022 - $43.92 mWh – CAPITAL POWER
The Town’s energy contractor Energy Associates International (EAI) was integral in procuring our
future retail electricity requirements in 2013 - 2022. They’re fees are $3 per mWh (approximately
$14,400 annually which is included in the commodity cost).
Combining both commodity retail fees (CAPITAL POWER & EAI $241,477 - 29%) with wire service
provider charges (ATCO $588,620 – 71%), the 2021 Interim Operating Budget includes $830,097
(2020 Pre Covid (Dec 2019) - $861,757 (decrease of $31,660 / -3.67%) for electricity. In 2021 there
is decrease in Commodity Charges of -$22,367 due to the lower rate of $43.92 mWh, plus a
decrease of -9,293 in Delivery Costs, Rate Riders and Local Access Fees. Approximately 71% (or
$587,965) of the Town’s entire cost of electricity is attributed to the following three types of
consumption: WTP 21.93% ($182,004), the SRC 18.51% ($153,614), and Street Lights 30.40%
($252,347).
In addition, the Town will consume approximately 23,824 GJ of natural gas in 2021 (22,661 in 2020)
at the contracted rate with ACCESS Gas of $2.67+ UFG (Unaccounted for Gas lost through the distribution
system)+ applicable administration fees per GJ (5-year 2018 – 2022 - Hybrid Purchase (75% equivalent of
weather normalized volumes) plus the EAI fee of $0.30 per GJ. The 2021 Interim Operating Budget
includes $201,464 (2020 - $185,396 increase of $16,069 / (8.67%) for natural gas. The Provincial
Carbon Tax has been repealed effective June 1, 2019; however, the 2021 Interim Budget foresees
an increase of the Federal Carbon Tax in Alberta from $1.58/GJ to $2.10/GJ effective April 1, 2021.
As such there is an increase in the Carbon Tax cost in 2021 of $10,324 with the remaining $5,745
from the increased usage in Town owned facilities. The Federal Carbon Tax currently makes up
approximately 22% ($44,700), Commodity charges 37% ($73,339) and Transportation / Local
Access Fee 41% ($83,425) of the Total $201,464
Given provincial uncertainty, as well as confidence in the budget estimates, Administration has
eliminated the $30,000 utility contingency in the 2021 – 2023 Interim Operating Budget.
Of note, the Town has included “Affiliated Sites” in both of our long-term utility supply contracts
with CAPITAL POWER & ACCESS GAS. These external community organizations benefit by realizing
the same rates as the Town, while being responsible for their own bills. These sites include:
• Stettler Regional Board of Trade and Community Development
• Stettler Curling Club
• Stettler Community Support Centre (FCSS)
• Royal Canadian Legion
• Stettler Regional Child Care Centre
• Superfluity
• Gear-up
• Summer Village of White Sands
• Stettler Museum (added 2016)
• Stettler Golf Course (added 2019-2020)
\\tos20-fs1\company shared folders\Misc Town\Steven\Memo\20201215Council - Budget Interim Operating Memo 2021.docx
9
Franchise Agreements
The AltaGas Franchise Agreement was also renegotiated in 2015. This reflects a change in the
franchise fee from 18% to 30%, 2021 – $1,002,950 (2020 - $936,000 - $66,950 increase). The
difference is based on an increase in Delivery Revenues, not retail revenues.
The ATCO Electric Franchise Agreement was also renegotiated in 2017. This reflects a change in
the franchise fee from 6.1% to 11.1%. 2021 - $727,000 (2020 - $712,000 - $15,000 increase).
Franchise Fees are calculated upon the estimated distribution component of customer bills and
not upon the retail (consumption) component.
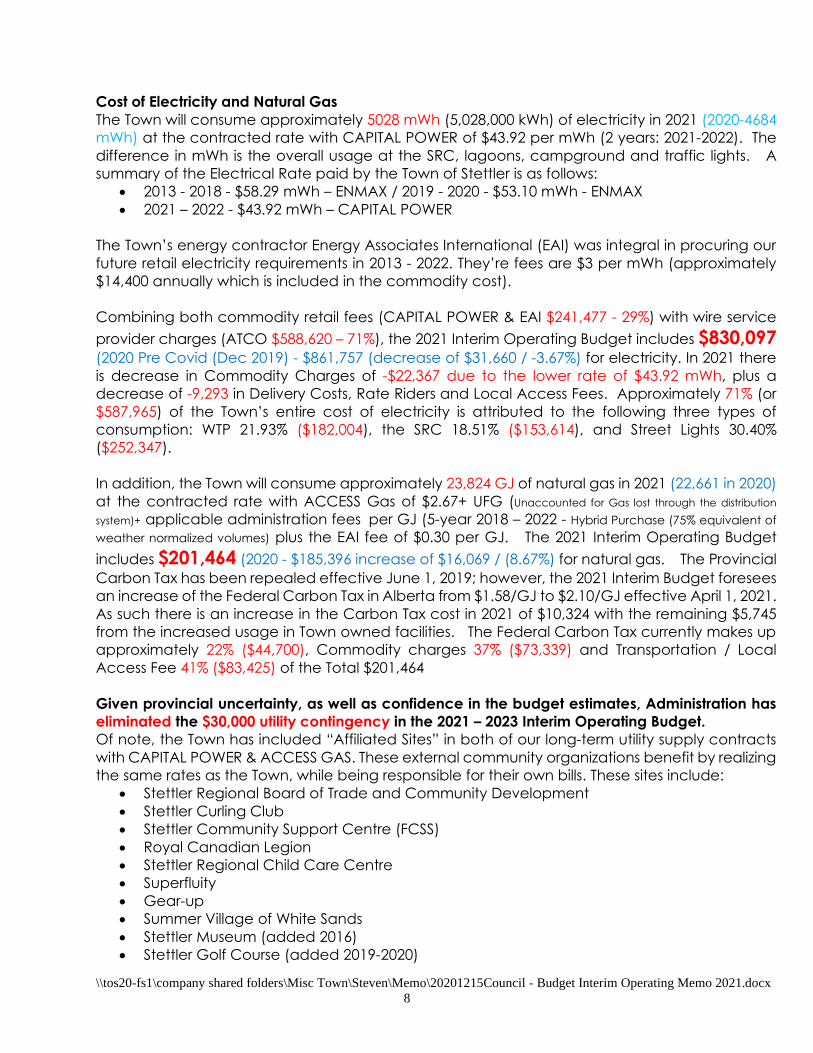
Debenture Debt
Debenture Debt outstanding at the end of 2020 will be
approximately $5.0 million. Included in this debt are borrowings
for local improvement purposes of which $1.364 million is being
repaid through frontage levies on abutting properties. Therefore,
these local improvement borrowings will be paid 100% by
benefiting property owners and have no operating budget
impacts.
In accordance with the Town’s 2019 Audited Financial
Statements the Town’s maximum debt limit per provincial
legislation is approximately $24.3 million. The 2021 Interim
Operating Budget includes annual debt servicing costs as follows:
County of Stettler Revenue Contributions included in the Interim Operating Budget
Utilities General Total
Principle $276,321.52 $223,192.36 $499,513.88
Interest $119,934.73 $74,946.38 $194,881.11
Total $396,256.25 $298,138.74 $694,394.99
$694,394.99
2021 Budget $694,400.00
County of Stettler Contributions 2019
2020 (Post
Covid - Tax
Budget - May
2020)
2020 (Pre
Covid -
Interim
Budget - Dec
2019) 2021 2022 2023
Fire Department (Joint 50% / County Honorarium - 100%) $176,998 $185,924 $191,774 $232,779 $241,669 $244,743
Regional Fire Chief & Deputy (50%) $148,580 $151,865 $151,865 $151,680 $152,665 $154,815
RCMP - Community Resource Officer (25%) $28,690 $0 $0 $0 $0 $0
Airport Operations $4,500 $4,500 $4,500 $4,500 $4,500 $4,500
Recreation Cost Sharing (originally $513,300) $470,980 $431,500 $431,500 $431,500 $435,845 $476,300
Stettler Board of Trade (funding on project by project basis) $0 $0 $0 $0 $0 $0
Total County of Stettler Contributions $829,748 $773,789 $779,639 $820,459 $834,679 $880,358
Year
Total
Debentures
2016 $6,969,966.00
2017 *LI* $6,979,181.00
2018 $6,502,626.00
2019 $6,004,089.82
2020 $5,482,521.43
2021 $5,004,358.85
2022
2023
\\tos20-fs1\company shared folders\Misc Town\Steven\Memo\20201215Council - Budget Interim Operating Memo 2021.docx
10
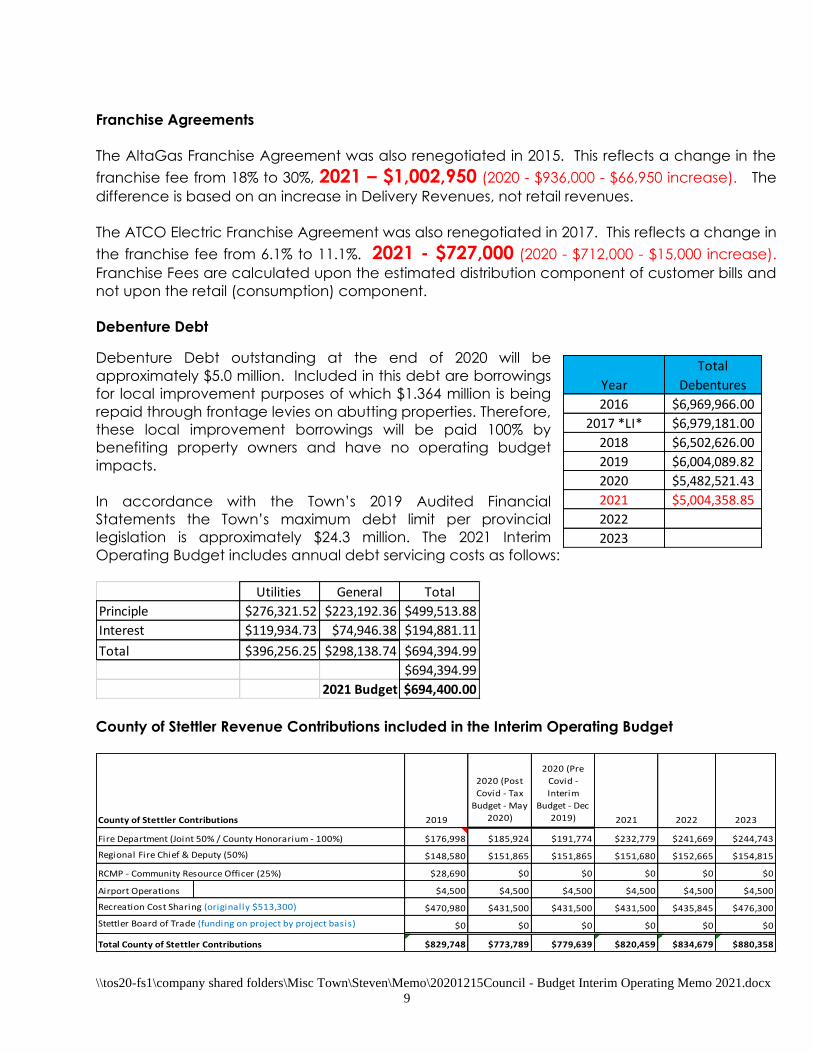
County of Stettler Equitable Recreation Cost Sharing Contribution:
The 2021 Interim Operating Budget includes $431,500 in recreation support from the County of
Stettler. The Administrative assumptions incorporated are as follows:
PLS Revenue: $431,500
PLS Expenditures:
Transfer to SRC Capital Reserve -Town $173,600 (represents 65% of $4M deemed debt)
Transfer to SRC Capital Reserve -County $93,300 (represents 35% of $4M deemed debt)
$266,900
Remains as net operational support $46,200 (to support property tax mitigation)
Remains as new net operational support $118,400 (enhances available for Capital Budget)
$164,600
Council will consider the 2021 allotment of $118,400 for any purpose within the Capital Budget.
Either way the availability of these new funds is welcome and certainly helps to soften the
budgetary impacts of the proposed 0% property tax increase.
Family and Community Support Services (FCSS)
The Town will continue to fund the maximum 20% share ($39,287) to access the maximum 80%
available funding from the Provincial Government ($157,148). Total FCSS contribution including
provincial funding is $196,435 in 2021.
Miscellaneous 2021 Budget impacts
• Fire Agreements with Villages (50% Town share) will generate $29,788
• AE Kennedy rental income to increase by $6,450 to $204,400 (2020 - $197,950) o Current agreement expires 2023
• Ambulance Station rental income will generate $20,100.
• Library rental income $42,000.
• Physician recruitment included at $1,500 per year. (decrease of $21,000 from 2019)
• Minor Sport Associations within Town facilities continues to be subsidized at 50%.
• Seniors Centre (HUB) - $20,875 income / $13,330 expense
Assessment Agreement % % ($) Amount
Town of Stettler
Budget
Actual Paid by
County of
Stettler
Assessment
Diff Budget Diff % Diff
Capital
(35%
$93,300) +
(65%
$173,600)
Available for
Capital Operating
1,619,422,100 0.03170% $513,356.81 $513,300.00 $513,451.54 0 0 0.00% $266,900 $118,400 $128,000
1,564,948,030 0.03170% $496,088.53 $496,000.00 $495,612.29 -54,474,070 -17,300 -3.37% $266,900 $118,400 $110,700
1,486,850,730 0.03170% $471,331.68 $471,500.00 $471,008.25 -78,097,300 -24,500 -4.94% $266,900 $118,400 $86,200
1,497,109,550 0.03170% $474,583.73 $474,000.00 $473,521.29 10,258,820 2,500 0.53% $266,900 $118,400 $88,700
1,487,837,630 0.03170% $471,644.53 $471,600.00 $470,979.71 -9,271,920 -2,400 -0.51% $266,900 $118,400 $86,300
1,361,294,500 0.03170% $431,530.36 $431,500.00 -126,543,130 -40,100 -8.50% $266,900 $118,400 $46,200
1,361,294,500 0.03170% $431,530.36 $431,500.00 0 0 0.00% $266,900 $118,400 $46,200
1,374,907,445 0.03170% $435,845.66 $435,845.00 13,612,945 4,345 1.01% $266,900 $118,400 $50,545
1,388,656,519 0.03170% $440,204.12 $440,204.00 13,749,074 4,359 1.00% $266,900 $118,400 $54,9042023
2020
2021
2022
2015
2016
2017
2018
2019
\\tos20-fs1\company shared folders\Misc Town\Steven\Memo\20201215Council - Budget Interim Operating Memo 2021.docx
11
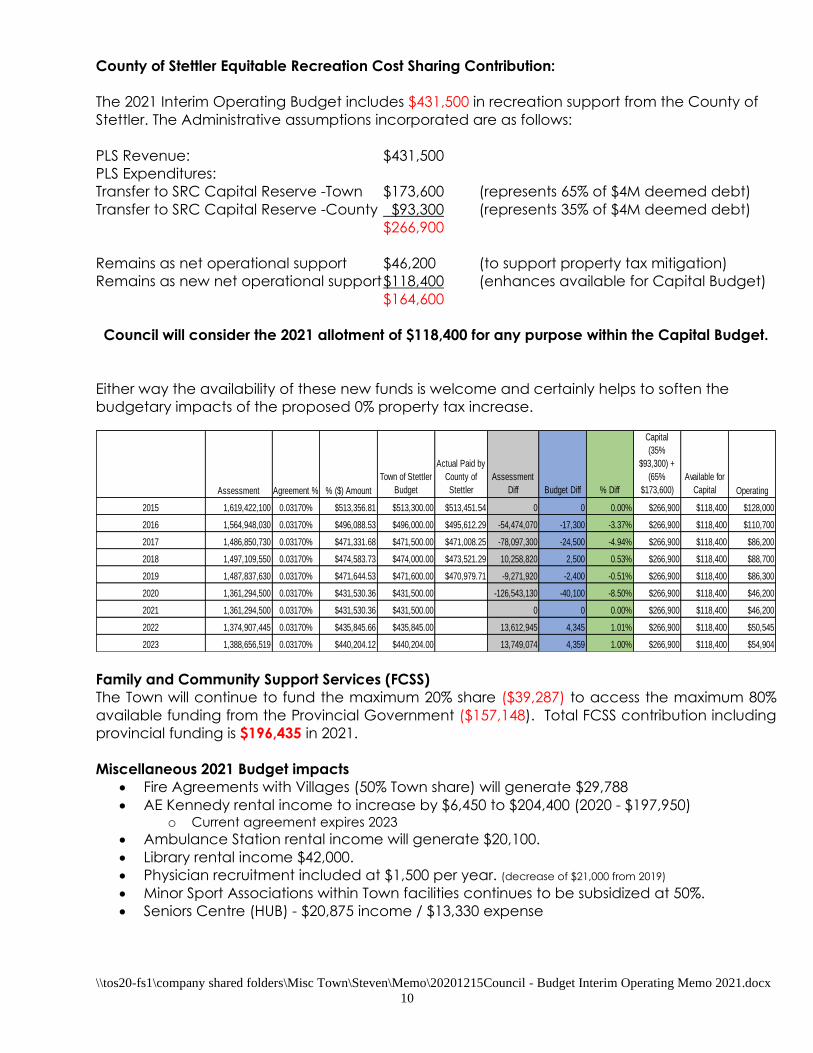
Property Assessment and Taxation
Property Assessment Growth Estimates due to New Construction
Growth in our assessment base, due to new construction, is expected to generate additional
municipal revenues as follows:
• 2016 $8.8 million $67,315
• 2017 $3 million $23,223
• 2018 $2.7 million $18,763
• 2019 $3.2 million $25,980
• 2020 $3.4 million $28,290
• 2021 $3.9 million $29,865
• 2022 $2 million $16,100
• 2023 $2 million $16,100
This new revenue from property taxation growth is welcome and vital to fund the budget
challenges associated with sustainability and the ongoing uncertain Alberta economy.
Municipal Property Taxation
Municipal governments have few tools available to finance budgetary pressures. Property taxes
are the primary and most substantial revenue source available. The three-year Operating Budget
proposes the following municipal property tax increases to offset rising costs, yet remaining
mindful of today’s economic challenges.
New Tax $ Each
Res/N-Res Generated 1% equals 2023 2% & 2% $138,622 $61,161 2022 2% & 2% $135,707 $59,803
2021 0% & 0% $0 $59,505 2020 0% & -1% -$22,496 $59,347
2019 2% & 2% $112,730 $56,365
2018 2% & 2% $110,003 $55,003
2017 2% & 2% $107,484 $53,742
2016 2% & 2% $105,380 $51,978
2015 3% & 3% $149,247 $49,750
2014 3% & 4% $143,440 $47,110
2013 3% & 3% $129,403 $45,740
2012 3% & 3% $122,980 $40,993
2011 3% & 3% $118,170 $39,390
2010 1% & 2% $50,500 $38,360
2009 .45% & 2.9% $45,660 $37,167
2008 5.41% & 8.45% $213,585
2007 5% & 10% $194,062
2006 8% $215,750
\\tos20-fs1\company shared folders\Misc Town\Steven\Memo\20201215Council - Budget Interim Operating Memo 2021.docx
12
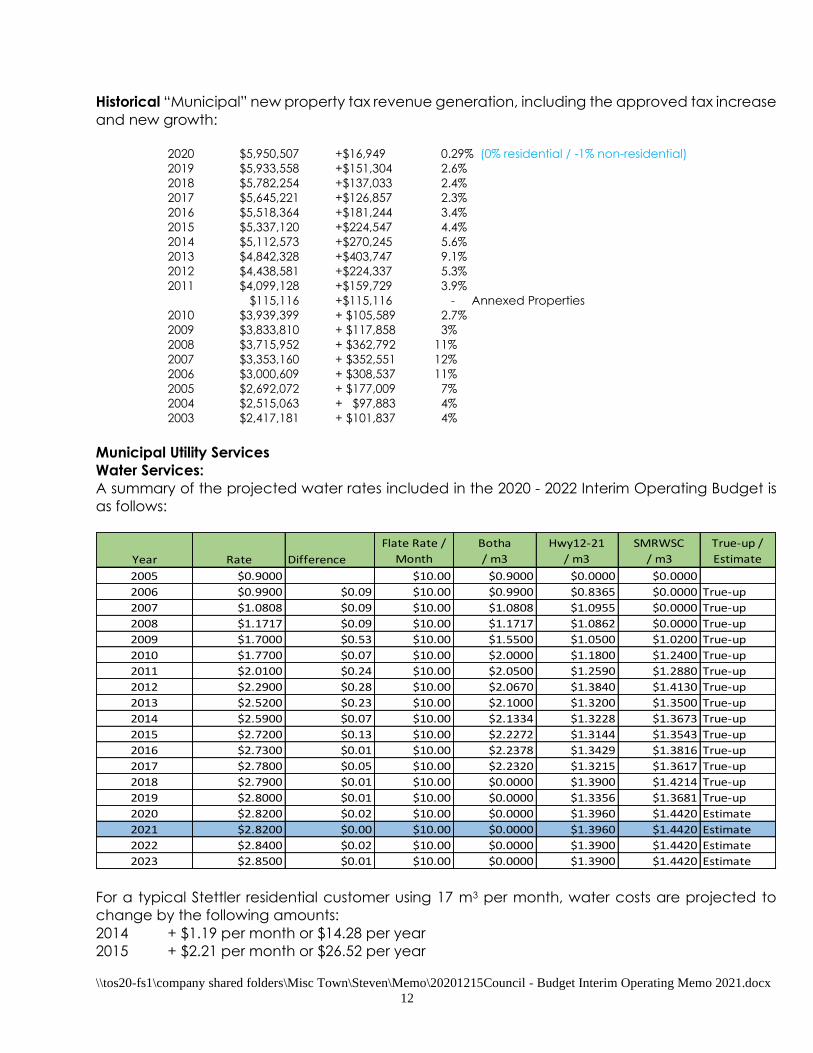
Historical “Municipal” new property tax revenue generation, including the approved tax increase
and new growth:
2020 $5,950,507 +$16,949 0.29% (0% residential / -1% non-residential) 2019 $5,933,558 +$151,304 2.6% 2018 $5,782,254 +$137,033 2.4% 2017 $5,645,221 +$126,857 2.3% 2016 $5,518,364 +$181,244 3.4%
2015 $5,337,120 +$224,547 4.4%
2014 $5,112,573 +$270,245 5.6%
2013 $4,842,328 +$403,747 9.1%
2012 $4,438,581 +$224,337 5.3%
2011 $4,099,128 +$159,729 3.9%
$115,116 +$115,116 - Annexed Properties
2010 $3,939,399 + $105,589 2.7%
2009 $3,833,810 + $117,858 3%
2008 $3,715,952 + $362,792 11%
2007 $3,353,160 + $352,551 12%
2006 $3,000,609 + $308,537 11%
2005 $2,692,072 + $177,009 7%
2004 $2,515,063 + $97,883 4%
2003 $2,417,181 + $101,837 4%
Municipal Utility Services
Water Services:
A summary of the projected water rates included in the 2020 - 2022 Interim Operating Budget is
as follows:
For a typical Stettler residential customer using 17 m3 per month, water costs are projected to
change by the following amounts:
2014 + $1.19 per month or $14.28 per year
2015 + $2.21 per month or $26.52 per year
Year Rate Difference
Flate Rate /
Month
Botha
/ m3
Hwy12-21
/ m3
SMRWSC
/ m3
True-up /
Estimate
2005 $0.9000 $10.00 $0.9000 $0.0000 $0.0000
2006 $0.9900 $0.09 $10.00 $0.9900 $0.8365 $0.0000 True-up
2007 $1.0808 $0.09 $10.00 $1.0808 $1.0955 $0.0000 True-up
2008 $1.1717 $0.09 $10.00 $1.1717 $1.0862 $0.0000 True-up
2009 $1.7000 $0.53 $10.00 $1.5500 $1.0500 $1.0200 True-up
2010 $1.7700 $0.07 $10.00 $2.0000 $1.1800 $1.2400 True-up
2011 $2.0100 $0.24 $10.00 $2.0500 $1.2590 $1.2880 True-up
2012 $2.2900 $0.28 $10.00 $2.0670 $1.3840 $1.4130 True-up
2013 $2.5200 $0.23 $10.00 $2.1000 $1.3200 $1.3500 True-up
2014 $2.5900 $0.07 $10.00 $2.1334 $1.3228 $1.3673 True-up
2015 $2.7200 $0.13 $10.00 $2.2272 $1.3144 $1.3543 True-up
2016 $2.7300 $0.01 $10.00 $2.2378 $1.3429 $1.3816 True-up
2017 $2.7800 $0.05 $10.00 $2.2320 $1.3215 $1.3617 True-up
2018 $2.7900 $0.01 $10.00 $0.0000 $1.3900 $1.4214 True-up
2019 $2.8000 $0.01 $10.00 $0.0000 $1.3356 $1.3681 True-up
2020 $2.8200 $0.02 $10.00 $0.0000 $1.3960 $1.4420 Estimate
2021 $2.8200 $0.00 $10.00 $0.0000 $1.3960 $1.4420 Estimate
2022 $2.8400 $0.02 $10.00 $0.0000 $1.3900 $1.4420 Estimate
2023 $2.8500 $0.01 $10.00 $0.0000 $1.3900 $1.4420 Estimate
\\tos20-fs1\company shared folders\Misc Town\Steven\Memo\20201215Council - Budget Interim Operating Memo 2021.docx
13
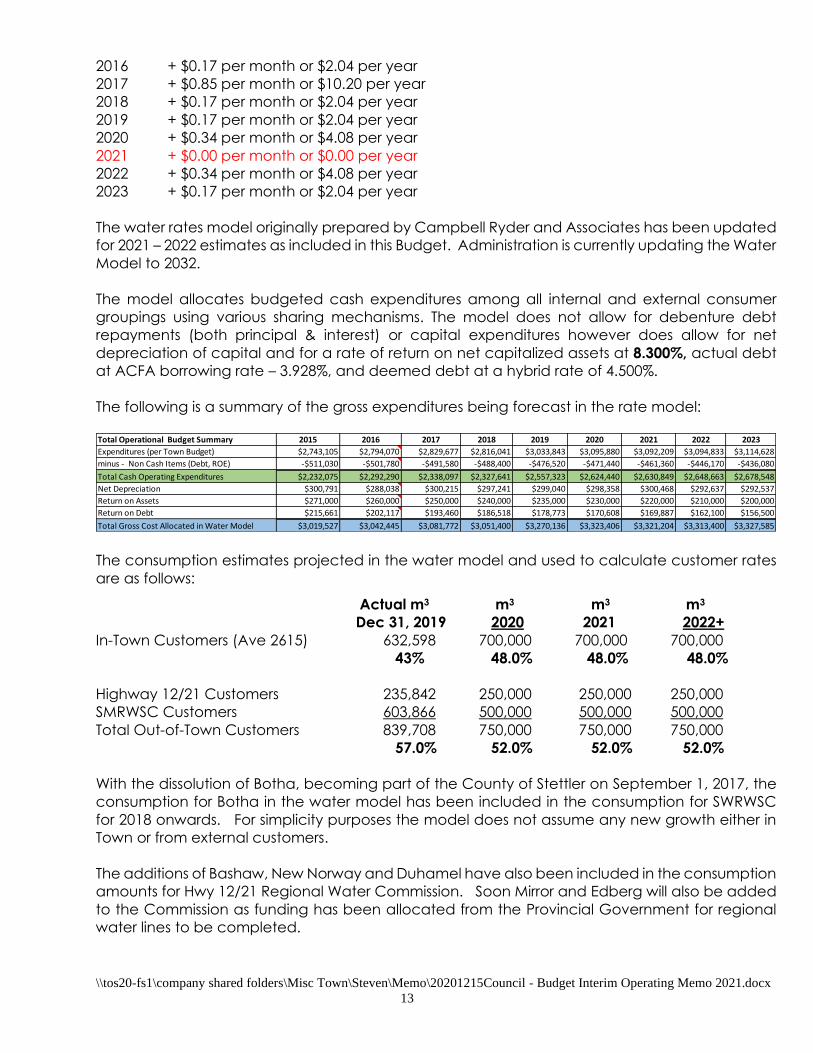
2016 + $0.17 per month or $2.04 per year
2017 + $0.85 per month or $10.20 per year
2018 + $0.17 per month or $2.04 per year
2019 + $0.17 per month or $2.04 per year
2020 + $0.34 per month or $4.08 per year
2021 + $0.00 per month or $0.00 per year
2022 + $0.34 per month or $4.08 per year
2023 + $0.17 per month or $2.04 per year
The water rates model originally prepared by Campbell Ryder and Associates has been updated
for 2021 – 2022 estimates as included in this Budget. Administration is currently updating the Water
Model to 2032.
The model allocates budgeted cash expenditures among all internal and external consumer
groupings using various sharing mechanisms. The model does not allow for debenture debt
repayments (both principal & interest) or capital expenditures however does allow for net
depreciation of capital and for a rate of return on net capitalized assets at 8.300%, actual debt
at ACFA borrowing rate – 3.928%, and deemed debt at a hybrid rate of 4.500%.
The following is a summary of the gross expenditures being forecast in the rate model:
The consumption estimates projected in the water model and used to calculate customer rates
are as follows:
Actual m3 m3 m3 m3
Dec 31, 2019 2020 2021 2022+
In-Town Customers (Ave 2615) 632,598 700,000 700,000 700,000
43% 48.0% 48.0% 48.0%
Highway 12/21 Customers 235,842 250,000 250,000 250,000
SMRWSC Customers 603,866 500,000 500,000 500,000
Total Out-of-Town Customers 839,708 750,000 750,000 750,000
57.0% 52.0% 52.0% 52.0%
With the dissolution of Botha, becoming part of the County of Stettler on September 1, 2017, the
consumption for Botha in the water model has been included in the consumption for SWRWSC
for 2018 onwards. For simplicity purposes the model does not assume any new growth either in
Town or from external customers.
The additions of Bashaw, New Norway and Duhamel have also been included in the consumption
amounts for Hwy 12/21 Regional Water Commission. Soon Mirror and Edberg will also be added
to the Commission as funding has been allocated from the Provincial Government for regional
water lines to be completed.
Total Operational Budget Summary 2015 2016 2017 2018 2019 2020 2021 2022 2023
Expenditures (per Town Budget) $2,743,105 $2,794,070 $2,829,677 $2,816,041 $3,033,843 $3,095,880 $3,092,209 $3,094,833 $3,114,628
minus - Non Cash Items (Debt, ROE) -$511,030 -$501,780 -$491,580 -$488,400 -$476,520 -$471,440 -$461,360 -$446,170 -$436,080
Total Cash Operating Expenditures $2,232,075 $2,292,290 $2,338,097 $2,327,641 $2,557,323 $2,624,440 $2,630,849 $2,648,663 $2,678,548
Net Depreciation $300,791 $288,038 $300,215 $297,241 $299,040 $298,358 $300,468 $292,637 $292,537
Return on Assets $271,000 $260,000 $250,000 $240,000 $235,000 $230,000 $220,000 $210,000 $200,000
Return on Debt $215,661 $202,117 $193,460 $186,518 $178,773 $170,608 $169,887 $162,100 $156,500
Total Gross Cost Allocated in Water Model $3,019,527 $3,042,445 $3,081,772 $3,051,400 $3,270,136 $3,323,406 $3,321,204 $3,313,400 $3,327,585
\\tos20-fs1\company shared folders\Misc Town\Steven\Memo\20201215Council - Budget Interim Operating Memo 2021.docx
14
Our water treatment plant is currently producing at around 1/2 capacity which is considered an
uneconomic production level. The good news is that production costs are not directly
proportional to higher volumes, therefore higher consumption (in the longer term) should
eventually result in more attractive rates. Staffing is a significant cost component that would only
marginally increase with substantially higher consumption levels.
Members of Council should be reminded that the rates determined for out of town agencies
represent their wholesale cost of purchasing water from the Town. Each must individually add
their own distribution, maintenance and administration component costs before determining
their price to their ultimate customer.
Utilizing a proven “Water Model” is an approved mechanism for calculating water rates to
customers outside your boundaries, and is defendable to the Alberta Energy & Utilities Board.
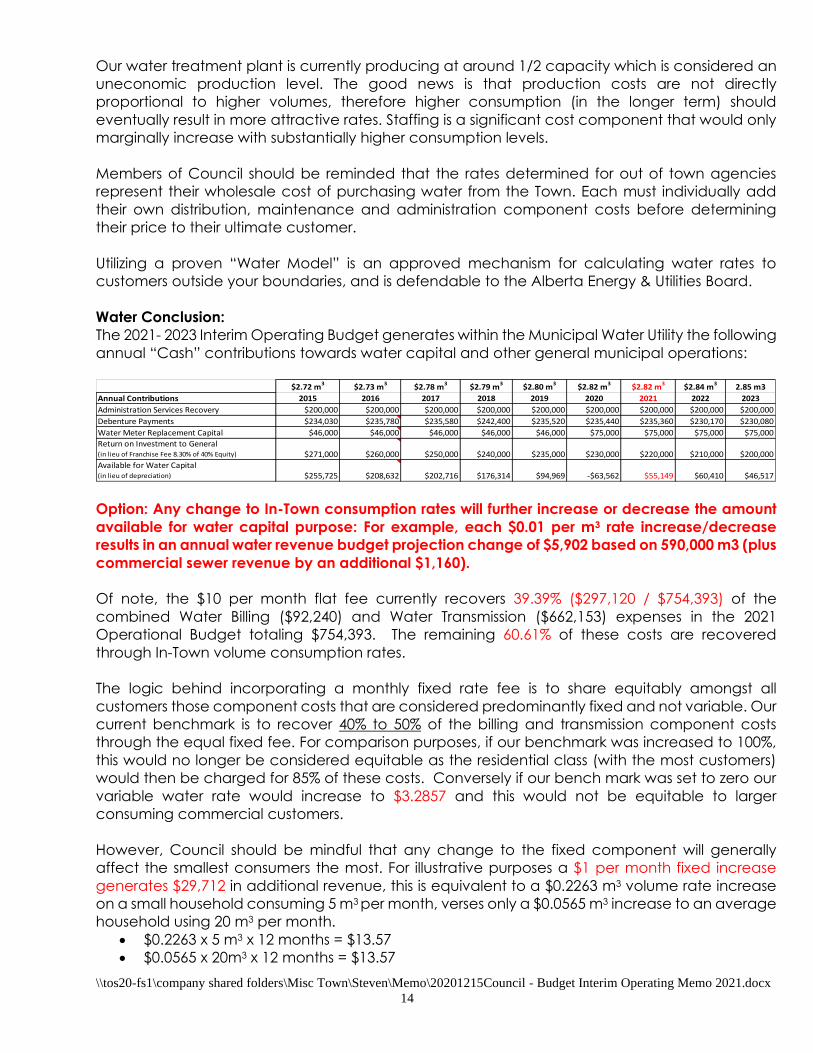
Water Conclusion:
The 2021- 2023 Interim Operating Budget generates within the Municipal Water Utility the following
annual “Cash” contributions towards water capital and other general municipal operations:
Option: Any change to In-Town consumption rates will further increase or decrease the amount
available for water capital purpose: For example, each $0.01 per m3 rate increase/decrease
results in an annual water revenue budget projection change of $5,902 based on 590,000 m3 (plus
commercial sewer revenue by an additional $1,160).
Of note, the $10 per month flat fee currently recovers 39.39% ($297,120 / $754,393) of the
combined Water Billing ($92,240) and Water Transmission ($662,153) expenses in the 2021
Operational Budget totaling $754,393. The remaining 60.61% of these costs are recovered
through In-Town volume consumption rates.
The logic behind incorporating a monthly fixed rate fee is to share equitably amongst all
customers those component costs that are considered predominantly fixed and not variable. Our
current benchmark is to recover 40% to 50% of the billing and transmission component costs
through the equal fixed fee. For comparison purposes, if our benchmark was increased to 100%,
this would no longer be considered equitable as the residential class (with the most customers)
would then be charged for 85% of these costs. Conversely if our bench mark was set to zero our
variable water rate would increase to $3.2857 and this would not be equitable to larger
consuming commercial customers.
However, Council should be mindful that any change to the fixed component will generally
affect the smallest consumers the most. For illustrative purposes a $1 per month fixed increase
generates $29,712 in additional revenue, this is equivalent to a $0.2263 m3 volume rate increase
on a small household consuming 5 m3 per month, verses only a $0.0565 m3 increase to an average
household using 20 m3 per month.
• $0.2263 x 5 m3 x 12 months = $13.57
• $0.0565 x 20m3 x 12 months = $13.57
$2.72 m3
$2.73 m3
$2.78 m3
$2.79 m3
$2.80 m3
$2.82 m3
$2.82 m3
$2.84 m3
2.85 m3
Annual Contributions 2015 2016 2017 2018 2019 2020 2021 2022 2023
Administration Services Recovery $200,000 $200,000 $200,000 $200,000 $200,000 $200,000 $200,000 $200,000 $200,000
Debenture Payments $234,030 $235,780 $235,580 $242,400 $235,520 $235,440 $235,360 $230,170 $230,080
Water Meter Replacement Capital $46,000 $46,000 $46,000 $46,000 $46,000 $75,000 $75,000 $75,000 $75,000
Return on Investment to General (in lieu of Franchise Fee 8.30% of 40% Equity) $271,000 $260,000 $250,000 $240,000 $235,000 $230,000 $220,000 $210,000 $200,000
Available for Water Capital (in lieu of depreciation) $255,725 $208,632 $202,716 $176,314 $94,969 -$63,562 $55,149 $60,410 $46,517
\\tos20-fs1\company shared folders\Misc Town\Steven\Memo\20201215Council - Budget Interim Operating Memo 2021.docx
15
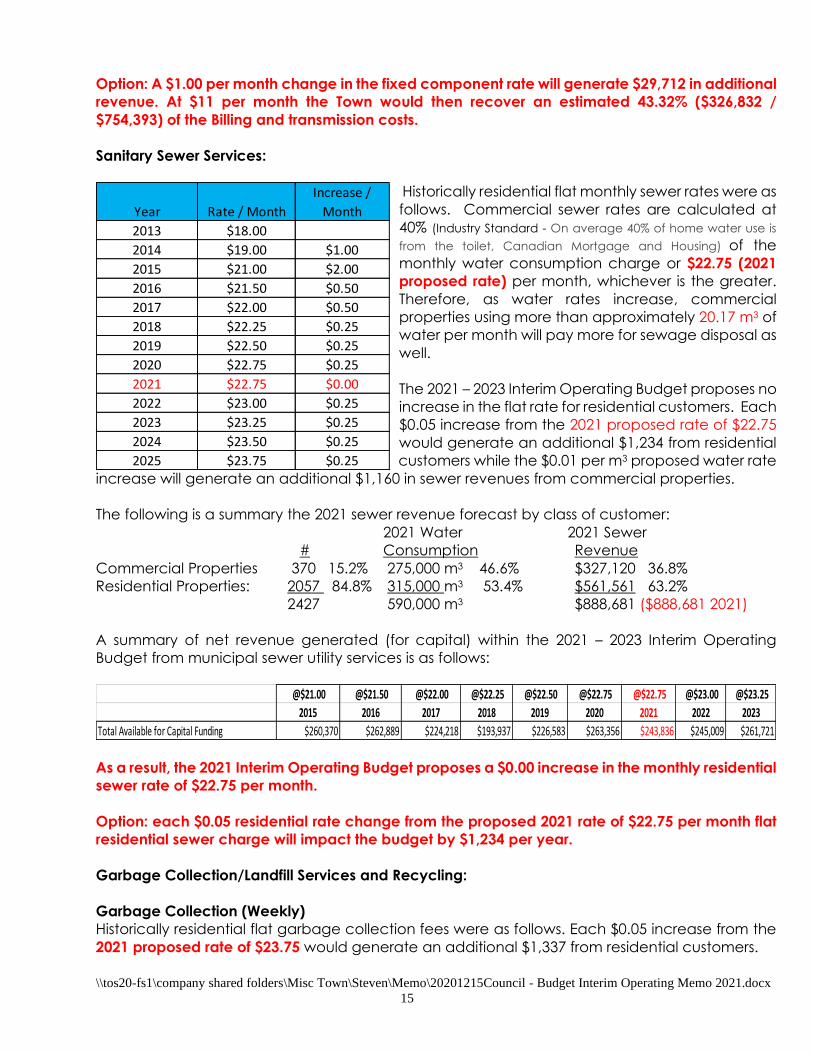
Option: A $1.00 per month change in the fixed component rate will generate $29,712 in additional
revenue. At $11 per month the Town would then recover an estimated 43.32% ($326,832 /
$754,393) of the Billing and transmission costs.
Sanitary Sewer Services:
Historically residential flat monthly sewer rates were as
follows. Commercial sewer rates are calculated at
40% (Industry Standard - On average 40% of home water use is
from the toilet, Canadian Mortgage and Housing) of the
monthly water consumption charge or $22.75 (2021
proposed rate) per month, whichever is the greater.
Therefore, as water rates increase, commercial
properties using more than approximately 20.17 m3 of
water per month will pay more for sewage disposal as
well.
The 2021 – 2023 Interim Operating Budget proposes no
increase in the flat rate for residential customers. Each
$0.05 increase from the 2021 proposed rate of $22.75
would generate an additional $1,234 from residential
customers while the $0.01 per m3 proposed water rate
increase will generate an additional $1,160 in sewer revenues from commercial properties.
The following is a summary the 2021 sewer revenue forecast by class of customer:
2021 Water 2021 Sewer
# Consumption Revenue
Commercial Properties 370 15.2% 275,000 m3 46.6% $327,120 36.8%
Residential Properties: 2057 84.8% 315,000 m3 53.4% $561,561 63.2%
2427 590,000 m3 $888,681 ($888,681 2021)
A summary of net revenue generated (for capital) within the 2021 – 2023 Interim Operating
Budget from municipal sewer utility services is as follows:
As a result, the 2021 Interim Operating Budget proposes a $0.00 increase in the monthly residential
sewer rate of $22.75 per month.
Option: each $0.05 residential rate change from the proposed 2021 rate of $22.75 per month flat
residential sewer charge will impact the budget by $1,234 per year.
Garbage Collection/Landfill Services and Recycling:
Garbage Collection (Weekly)
Historically residential flat garbage collection fees were as follows. Each $0.05 increase from the
2021 proposed rate of $23.75 would generate an additional $1,337 from residential customers.
@$21.00 @$21.50 @$22.00 @$22.25 @$22.50 @$22.75 @$22.75 @$23.00 @$23.25
2015 2016 2017 2018 2019 2020 2021 2022 2023
Total Available for Capital Funding $260,370 $262,889 $224,218 $193,937 $226,583 $263,356 $243,836 $245,009 $261,721
Year Rate / Month
Increase /
Month
2013 $18.00
2014 $19.00 $1.00
2015 $21.00 $2.00
2016 $21.50 $0.50
2017 $22.00 $0.50
2018 $22.25 $0.25
2019 $22.50 $0.25
2020 $22.75 $0.25
2021 $22.75 $0.00
2022 $23.00 $0.25
2023 $23.25 $0.25
2024 $23.50 $0.25
2025 $23.75 $0.25
\\tos20-fs1\company shared folders\Misc Town\Steven\Memo\20201215Council - Budget Interim Operating Memo 2021.docx
16
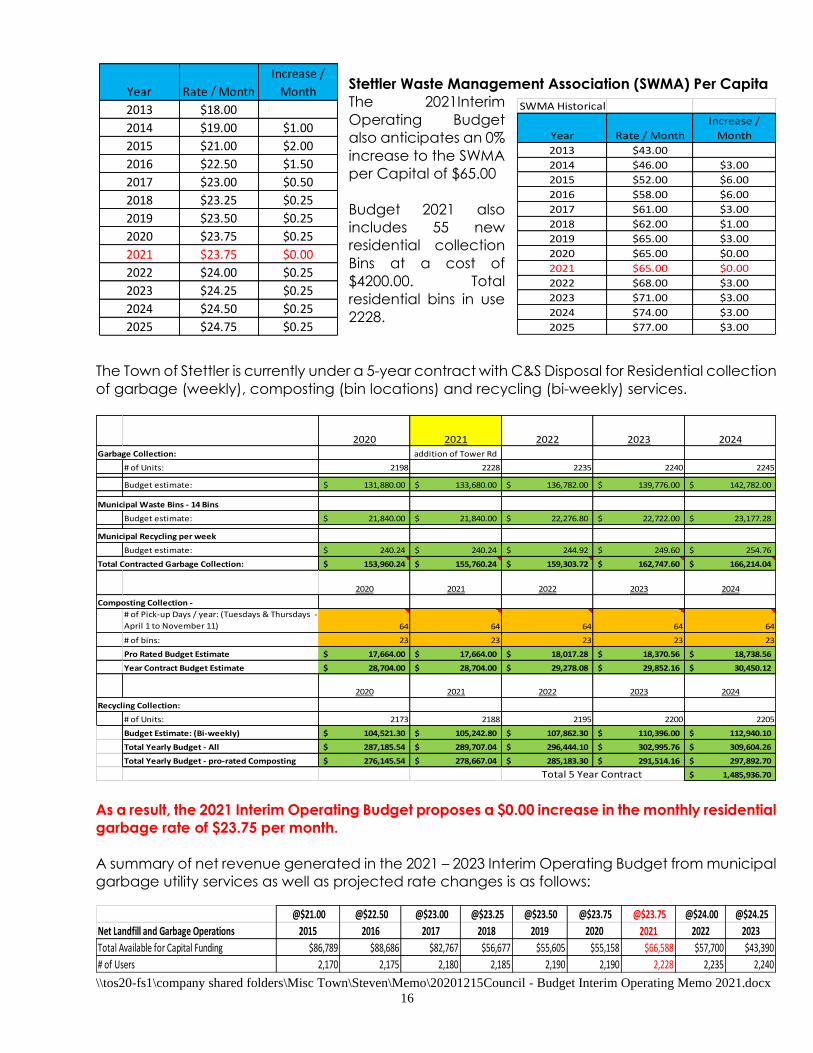
Stettler Waste Management Association (SWMA) Per Capita
The 2021Interim
Operating Budget
also anticipates an 0%
increase to the SWMA
per Capital of $65.00
Budget 2021 also
includes 55 new
residential collection
Bins at a cost of
$4200.00. Total
residential bins in use
2228.
The Town of Stettler is currently under a 5-year contract with C&S Disposal for Residential collection
of garbage (weekly), composting (bin locations) and recycling (bi-weekly) services.
As a result, the 2021 Interim Operating Budget proposes a $0.00 increase in the monthly residential
garbage rate of $23.75 per month.
A summary of net revenue generated in the 2021 – 2023 Interim Operating Budget from municipal
garbage utility services as well as projected rate changes is as follows:
2020 2021 2022 2023 2024
Garbage Collection: addition of Tower Rd
# of Units: 2198 2228 2235 2240 2245
Budget estimate: 131,880.00$ 133,680.00$ 136,782.00$ 139,776.00$ 142,782.00$
Municipal Waste Bins - 14 Bins
Budget estimate: 21,840.00$ 21,840.00$ 22,276.80$ 22,722.00$ 23,177.28$
Municipal Recycling per week
Budget estimate: 240.24$ 240.24$ 244.92$ 249.60$ 254.76$
Total Contracted Garbage Collection: 153,960.24$ 155,760.24$ 159,303.72$ 162,747.60$ 166,214.04$
2020 2021 2022 2023 2024
Composting Collection -
# of Pick-up Days / year: (Tuesdays & Thursdays -
April 1 to November 11) 64 64 64 64 64
# of bins: 23 23 23 23 23
Pro Rated Budget Estimate 17,664.00$ 17,664.00$ 18,017.28$ 18,370.56$ 18,738.56$
Year Contract Budget Estimate 28,704.00$ 28,704.00$ 29,278.08$ 29,852.16$ 30,450.12$
2020 2021 2022 2023 2024
Recycling Collection:
# of Units: 2173 2188 2195 2200 2205
Budget Estimate: (Bi-weekly) 104,521.30$ 105,242.80$ 107,862.30$ 110,396.00$ 112,940.10$
Total Yearly Budget - All 287,185.54$ 289,707.04$ 296,444.10$ 302,995.76$ 309,604.26$
Total Yearly Budget - pro-rated Composting 276,145.54$ 278,667.04$ 285,183.30$ 291,514.16$ 297,892.70$
1,485,936.70$ Total 5 Year Contract
@$21.00 @$22.50 @$23.00 @$23.25 @$23.50 @$23.75 @$23.75 @$24.00 @$24.25
Net Landfill and Garbage Operations 2015 2016 2017 2018 2019 2020 2021 2022 2023
Total Available for Capital Funding $86,789 $88,686 $82,767 $56,677 $55,605 $55,158 $66,588 $57,700 $43,390
# of Users 2,170 2,175 2,180 2,185 2,190 2,190 2,228 2,235 2,240
Year Rate / Month
Increase /
Month
2013 $18.00
2014 $19.00 $1.00
2015 $21.00 $2.00
2016 $22.50 $1.50
2017 $23.00 $0.50
2018 $23.25 $0.25
2019 $23.50 $0.25
2020 $23.75 $0.25
2021 $23.75 $0.00
2022 $24.00 $0.25
2023 $24.25 $0.25
2024 $24.50 $0.25
2025 $24.75 $0.25
SWMA Historical
Year Rate / Month
Increase /
Month
2013 $43.00
2014 $46.00 $3.00
2015 $52.00 $6.00
2016 $58.00 $6.00
2017 $61.00 $3.00
2018 $62.00 $1.00
2019 $65.00 $3.00
2020 $65.00 $0.00
2021 $65.00 $0.00
2022 $68.00 $3.00
2023 $71.00 $3.00
2024 $74.00 $3.00
2025 $77.00 $3.00

\\tos20-fs1\company shared folders\Misc Town\Steven\Memo\20201215Council - Budget Interim Operating Memo 2021.docx
17
Recycling (Bi-weekly)
Historically residential flat recycling collection fees were as
follows. Each $0.05 increase from the 2021 proposed rate
of $6.50 would generate an additional $1,313 from
residential customers.
As a result, the 2021 Interim Operating Budget proposes no
increase in the monthly residential recycling rate from
$6.50 per month.
A summary of net revenue generated in the 2020 – 2022
Interim Operating Budget from municipal recycling /
composting utility services as well as projected rate
changes is as follows:
These net contributions to the overall amount available for capital are based upon maintaining
the same levels of service for both programs:
• Curbside residential garbage collection on a weekly basis.
• Curbside residential recycling collection on a bi-weekly basis.
Option: Each $0.05 change in monthly residential garbage collection rates will impact the budget
by +/- $1,337 annually.
Option: Each $0.05 change in monthly residential recycling collection rates will impact the budget
by +/- $1,313 annually.
@$6.00 @$6.00 @$6.25 @$6.25 @$6.50 @$6.50 @$6.50 @$7.00 @$7.00
Recycling /Composting Operations 2015 2016 2017 2018 2019 2020 2021 2022 2023
Total Available for Capital Funding $26,399 $19,210 $20,280 $18,510 $19,665 $46,636 $47,758 $58,501 $62,633
# of Users 2,135 2,145 2,150 2,160 2,160 2,160 2,188 2,195 2,200
Year Rate / Month
Increase /
Month
2013 $6.00
2014 $6.00 $0.00
2015 $6.00 $0.00
2016 $6.00 $0.00
2017 $6.25 $0.25
2018 $6.25 $0.00
2019 $6.50 $0.25
2020 $6.50 $0.00
2021 $6.50 $0.00
2022 $7.00 $0.25
2023 $7.25 $0.25
2024 $7.50 $0.25
2025 $7.75 $0.25
\\tos20-fs1\company shared folders\Misc Town\Steven\Memo\20201215Council - Budget Interim Operating Memo 2021.docx
18
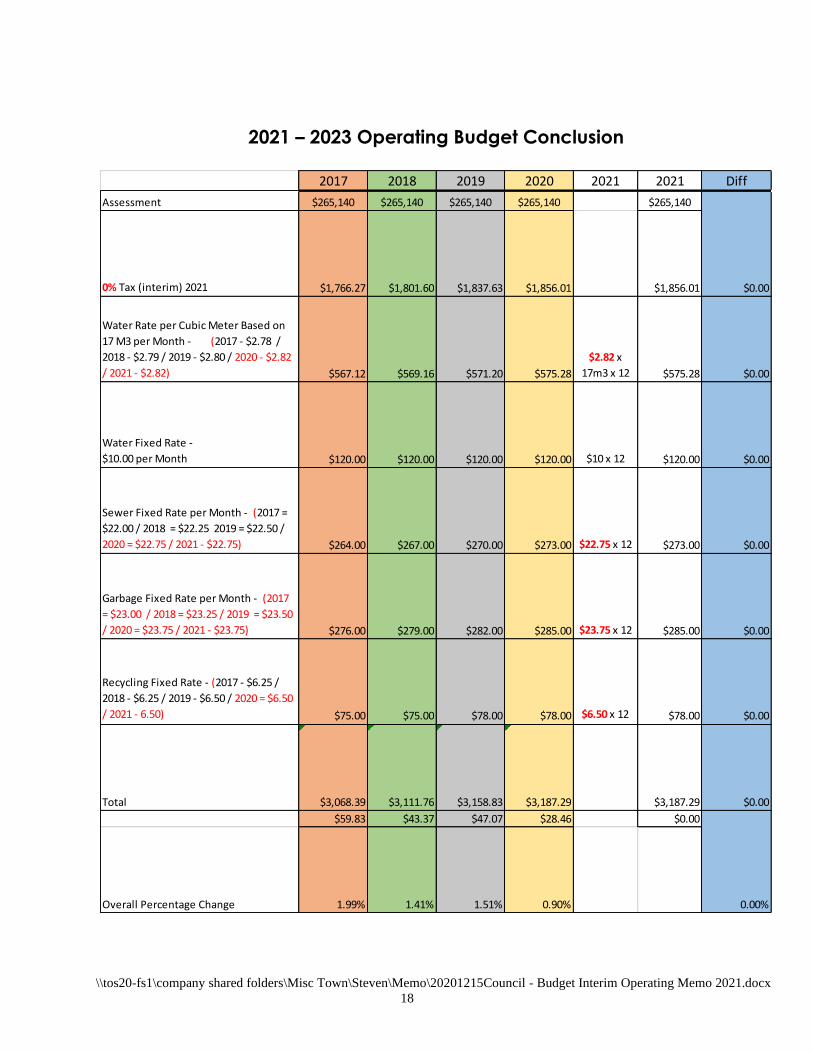
2021 – 2023 Operating Budget Conclusion
2017 2018 2019 2020 2021 2021 Diff
Assessment $265,140 $265,140 $265,140 $265,140 $265,140
0% Tax (interim) 2021 $1,766.27 $1,801.60 $1,837.63 $1,856.01 $1,856.01 $0.00
Water Rate per Cubic Meter Based on
17 M3 per Month - (2017 - $2.78 /
2018 - $2.79 / 2019 - $2.80 / 2020 - $2.82
/ 2021 - $2.82) $567.12 $569.16 $571.20 $575.28
$2.82 x
17m3 x 12 $575.28 $0.00
Water Fixed Rate -
$10.00 per Month $120.00 $120.00 $120.00 $120.00 $10 x 12 $120.00 $0.00
Sewer Fixed Rate per Month - (2017 =
$22.00 / 2018 = $22.25 2019 = $22.50 /
2020 = $22.75 / 2021 - $22.75) $264.00 $267.00 $270.00 $273.00 $22.75 x 12 $273.00 $0.00
Garbage Fixed Rate per Month - (2017
= $23.00 / 2018 = $23.25 / 2019 = $23.50
/ 2020 = $23.75 / 2021 - $23.75) $276.00 $279.00 $282.00 $285.00 $23.75 x 12 $285.00 $0.00
Recycling Fixed Rate - (2017 - $6.25 /
2018 - $6.25 / 2019 - $6.50 / 2020 = $6.50
/ 2021 - 6.50) $75.00 $75.00 $78.00 $78.00 $6.50 x 12 $78.00 $0.00
Total $3,068.39 $3,111.76 $3,158.83 $3,187.29 $3,187.29 $0.00
$59.83 $43.37 $47.07 $28.46 $0.00
Overall Percentage Change 1.99% 1.41% 1.51% 0.90% 0.00%
\\tos20-fs1\company shared folders\Misc Town\Steven\Memo\20201215Council - Budget Interim Operating Memo 2021.docx
19
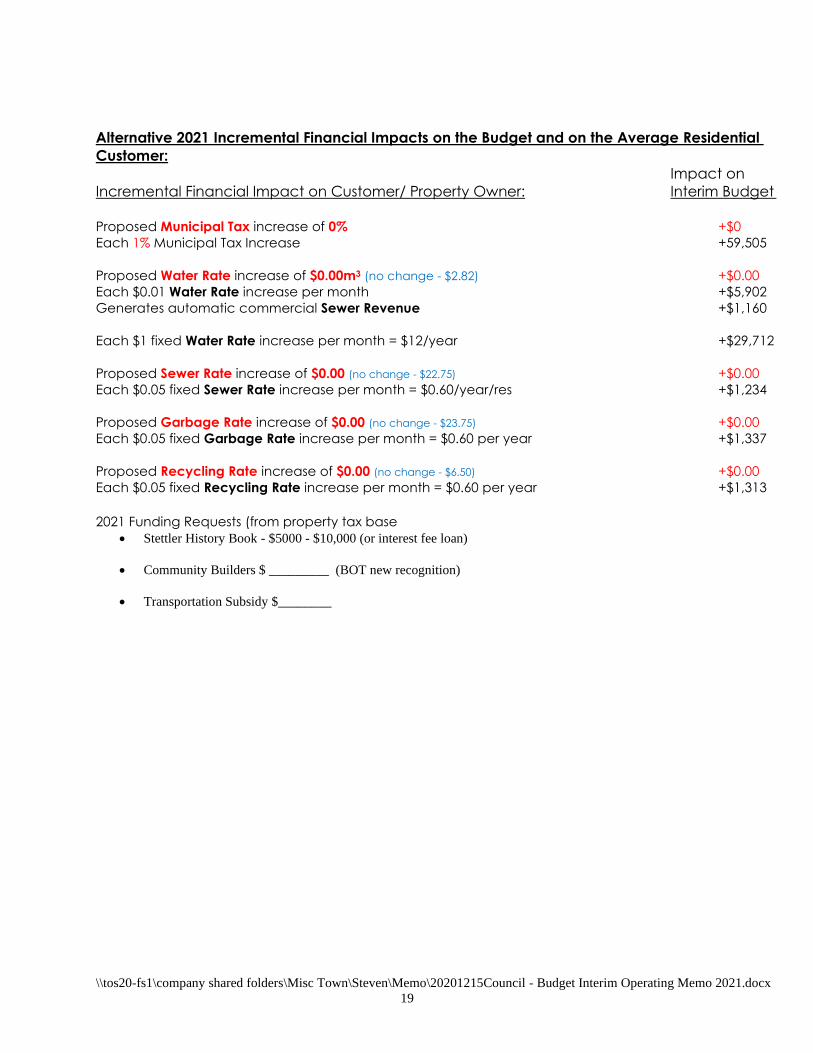
Alternative 2021 Incremental Financial Impacts on the Budget and on the Average Residential
Customer:
Impact on
Incremental Financial Impact on Customer/ Property Owner: Interim Budget
Proposed Municipal Tax increase of 0% +$0
Each 1% Municipal Tax Increase +59,505
Proposed Water Rate increase of $0.00m3 (no change - $2.82) +$0.00
Each $0.01 Water Rate increase per month +$5,902
Generates automatic commercial Sewer Revenue +$1,160
Each $1 fixed Water Rate increase per month = $12/year +$29,712
Proposed Sewer Rate increase of $0.00 (no change - $22.75) +$0.00
Each $0.05 fixed Sewer Rate increase per month = $0.60/year/res +$1,234
Proposed Garbage Rate increase of $0.00 (no change - $23.75) +$0.00
Each $0.05 fixed Garbage Rate increase per month = $0.60 per year +$1,337
Proposed Recycling Rate increase of $0.00 (no change - $6.50) +$0.00
Each $0.05 fixed Recycling Rate increase per month = $0.60 per year +$1,313 2021 Funding Requests (from property tax base
• Stettler History Book - $5000 - $10,000 (or interest fee loan)
• Community Builders $ _________ (BOT new recognition)
• Transportation Subsidy $________
\\tos20-fs1\company shared folders\Misc Town\Steven\Memo\20201215Council - Budget Interim Operating Memo 2021.docx
20
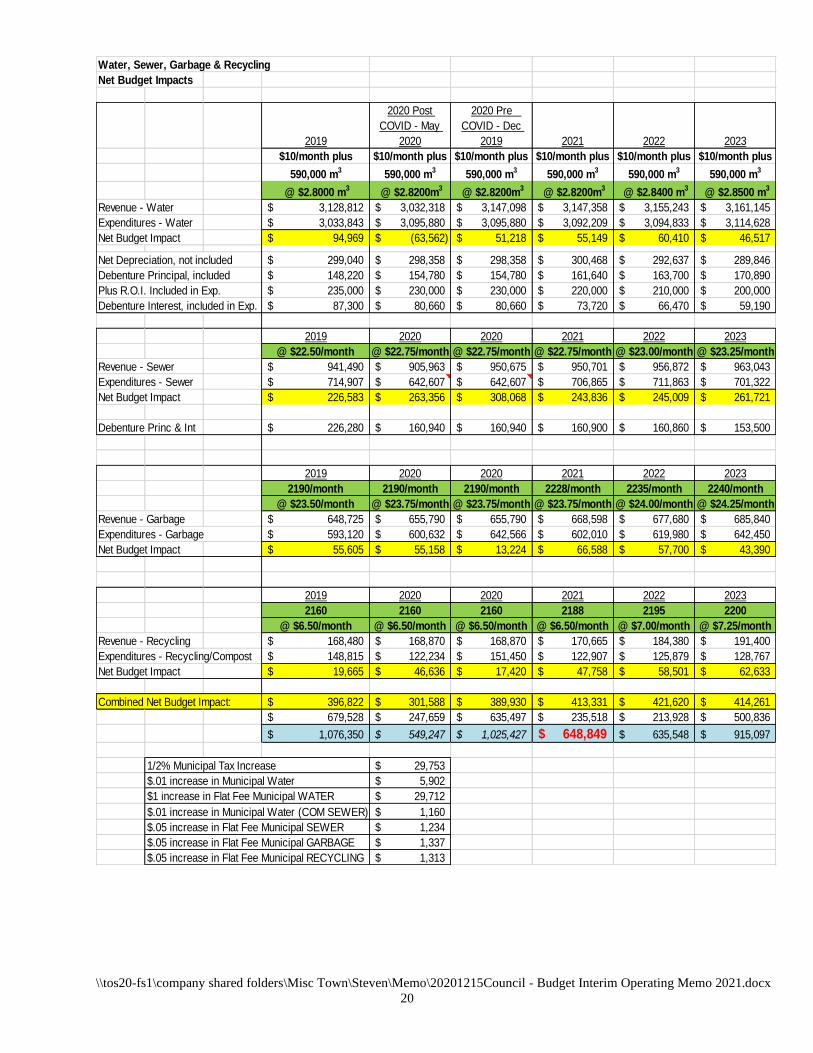
Water, Sewer, Garbage & Recycling
Net Budget Impacts
2019
2020 Post
COVID - May
2020
2020 Pre
COVID - Dec
2019 2021 2022 2023
$10/month plus $10/month plus $10/month plus $10/month plus $10/month plus $10/month plus
590,000 m3
590,000 m3
590,000 m3
590,000 m3
590,000 m3
590,000 m3
@ $2.8000 m3
@ $2.8200m3
@ $2.8200m3
@ $2.8200m3
@ $2.8400 m3
@ $2.8500 m3
Revenue - Water 3,128,812$ 3,032,318$ 3,147,098$ 3,147,358$ 3,155,243$ 3,161,145$
Expenditures - Water 3,033,843$ 3,095,880$ 3,095,880$ 3,092,209$ 3,094,833$ 3,114,628$
Net Budget Impact 94,969$ (63,562)$ 51,218$ 55,149$ 60,410$ 46,517$
Net Depreciation, not included 299,040$ 298,358$ 298,358$ 300,468$ 292,637$ 289,846$
Debenture Principal, included 148,220$ 154,780$ 154,780$ 161,640$ 163,700$ 170,890$
Plus R.O.I. Included in Exp. 235,000$ 230,000$ 230,000$ 220,000$ 210,000$ 200,000$
Debenture Interest, included in Exp. 87,300$ 80,660$ 80,660$ 73,720$ 66,470$ 59,190$
2019 2020 2020 2021 2022 2023
@ $22.50/month @ $22.75/month @ $22.75/month @ $22.75/month @ $23.00/month @ $23.25/month
Revenue - Sewer 941,490$ 905,963$ 950,675$ 950,701$ 956,872$ 963,043$
Expenditures - Sewer 714,907$ 642,607$ 642,607$ 706,865$ 711,863$ 701,322$
Net Budget Impact 226,583$ 263,356$ 308,068$ 243,836$ 245,009$ 261,721$
Debenture Princ & Int 226,280$ 160,940$ 160,940$ 160,900$ 160,860$ 153,500$
2019 2020 2020 2021 2022 2023
2190/month 2190/month 2190/month 2228/month 2235/month 2240/month
@ $23.50/month @ $23.75/month @ $23.75/month @ $23.75/month @ $24.00/month @ $24.25/month
Revenue - Garbage 648,725$ 655,790$ 655,790$ 668,598$ 677,680$ 685,840$
Expenditures - Garbage 593,120$ 600,632$ 642,566$ 602,010$ 619,980$ 642,450$
Net Budget Impact 55,605$ 55,158$ 13,224$ 66,588$ 57,700$ 43,390$
2019 2020 2020 2021 2022 2023
2160 2160 2160 2188 2195 2200
@ $6.50/month @ $6.50/month @ $6.50/month @ $6.50/month @ $7.00/month @ $7.25/month
Revenue - Recycling 168,480$ 168,870$ 168,870$ 170,665$ 184,380$ 191,400$
Expenditures - Recycling/Compost 148,815$ 122,234$ 151,450$ 122,907$ 125,879$ 128,767$
Net Budget Impact 19,665$ 46,636$ 17,420$ 47,758$ 58,501$ 62,633$
Combined Net Budget Impact: 396,822$ 301,588$ 389,930$ 413,331$ 421,620$ 414,261$
679,528$ 247,659$ 635,497$ 235,518$ 213,928$ 500,836$
1,076,350$ 549,247$ 1,025,427$ 648,849$ 635,548$ 915,097$
1/2% Municipal Tax Increase 29,753$
$.01 increase in Municipal Water 5,902$
$1 increase in Flat Fee Municipal WATER 29,712$
$.01 increase in Municipal Water (COM SEWER) 1,160$
$.05 increase in Flat Fee Municipal SEWER 1,234$
$.05 increase in Flat Fee Municipal GARBAGE 1,337$
$.05 increase in Flat Fee Municipal RECYCLING 1,313$

\\tos20-fs1\company shared folders\Misc Town\Steven\Memo\20201215Council - Budget Interim Operating Memo 2021.docx
21
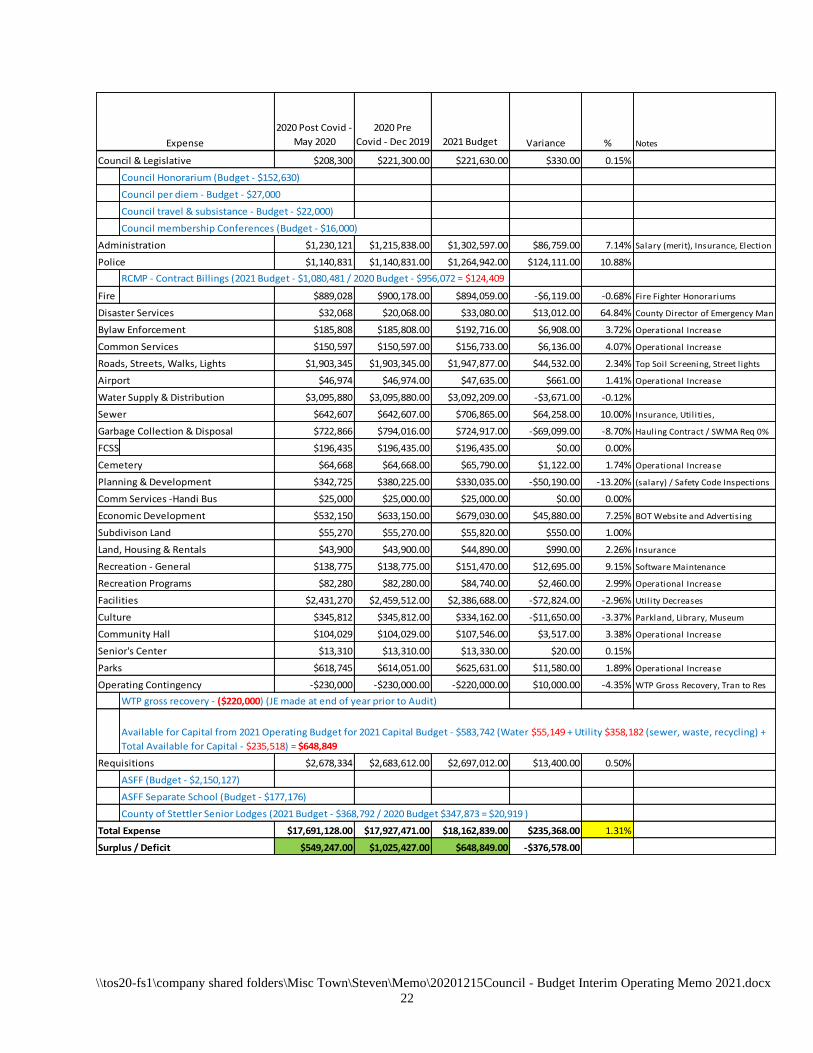
2021 Budget Summary
2020 Post Covid -
May 2020
2020 Pre
Covid - Dec 2019 2021 Budget Variance % Notes
Administration $317,333 $317,333.00 $272,020.00 -$45,313.00 -14.28%
Clearview swimming pool - Agreement complete - (-$13,315)
White Sands Contract - Contract complete - (-$32,000)
Inter Dept Utilty Transfer - $250,000)
Police $520,024 $565,466.00 $466,391.00 -$99,075.00 -17.52% MSI Operating - $52,856
Traffic Fines - Budget - $60,000 - 2019 Total Fines - $51,442
Provincial Grant - $347,208
Community Resource Program - Clearview 50% - County 25% - $0.00 - no dedicated sro officer
Fire $402,577 $408,427.00 $449,247.00 $40,820.00 9.99%
change in budget process for
County Honorarium - 100% county
Disaster Services $0 $0.00 $0.00 $0.00
Bylaw Enforcement $109,950 $109,950.00 $109,950.00 $0.00 0.00%
Business Licenses Budget - $86,250 /Animal License Budget $21,700
Roads, Streets, Walks, Lights $64,535 $64,535.00 $63,800.00 -$735.00 -1.14%
Roads Frontage - Pavement (Budget - $63,800)
Airport $10,880 $10,880.00 $10,880.00 $0.00 0.00%
Drainage $0 $0.00 $0.00 $0.00 #DIV/0!
Water Supply & Distribution $3,032,318 $3,147,098.00 $3,147,358.00 $260.00 0.01%
Metered sale of water (Budget - $1,961,648)
Metered out of Town (Budget - $1,070,000)
Bulk water (Budget - $40,000)
Sewer $905,963 $950,675.00 $950,701.00 $26.00 0.00%
Sewer Service Charges (Budget - $888,681)
Garbage Collection & Disposal $824,660 $824,660.00 $839,263.00 $14,603.00 1.77% SWMA haul rebate - $26,619
Residential Garbage Revenue (2021 Budget - $634,980 / 2020 Budget - $623,438 - $11,542 - increase in residential customers)
Recycling Revenue (Budget 2021 - $170,664 / 2020 Budget - 168,870 = $1,794 - Recycling rebate - $26,619-25,352 = $1,265)
FCSS $157,148 $157,148.00 $157,148.00 $0.00 0.00%
Cemetery $23,600 $23,600.00 $23,600.00 $0.00 0.00%
Planning & Development $34,100 $44,500.00 $44,500.00 $0.00 0.00%
Building Permits (Budget - $30,000)
Economic Development - BOT $149,585 $222,920.00 $232,125.00 $9,205.00 4.13% Brochure Adv / Event Rev
Subdivison Land $200 $2,000.00 $2,000.00 $0.00 0.00% Subdivision Fees
Land, Housing & Rentals $273,780 $273,780.00 $282,015.00 $8,235.00 3.01%
AE Kennedy Health Unit - $204,400 ($6450 inc)
Ambulance Station - $20,100
SRC - Library - Budget - $42,000
Recreation - General $3,000 $3,000.00 $3,000.00 $0.00 0.00%
Recreation Programs $3,500 $24,460.00 $22,700.00 -$1,760.00 -7.20% Ball / Soccer
Facilities $848,805 $1,088,705.00 $952,732.00 -$135,973.00 -12.49% County / Pool / SRC Rev (Covid)
Community Hall $20,000 $40,000.00 $30,000.00 -$10,000.00 -25.00%
Senior's Center $14,437 $22,875.00 $20,875.00 -$2,000.00 -8.74%
Parks $50,650 $100,650.00 $115,650.00 $15,000.00 14.90%
Lions Campground - Budget - $115,000 ($15,000 Inc)
Operating Contingency $100,146 $0.00 $0.00 $0.00 0.00%
Taxes / Penalties $8,527,784 $8,704,836.00 $8,677,383.00 -$27,453.00 -0.32%
Other Revenue $1,845,400 $1,845,400.00 $1,938,350.00 $92,950.00 5.04%
Franchise Fee - GAS (Budget - $1,002,950 / $66,950 Increase)
Franchise Fee - ELECTRIC (Budget - $727,000 / $15,000 Increase)
Return on Investments (Budget - $140,000 / $10,000 Increase)
Total Revenue $18,240,375 $18,952,898.00 $18,811,688.00 -$141,210.00 -0.75%
Revenue
\\tos20-fs1\company shared folders\Misc Town\Steven\Memo\20201215Council - Budget Interim Operating Memo 2021.docx
22
2020 Post Covid -
May 2020
2020 Pre
Covid - Dec 2019 2021 Budget Variance % Notes
Council & Legislative $208,300 $221,300.00 $221,630.00 $330.00 0.15%
Council Honorarium (Budget - $152,630)
Council per diem - Budget - $27,000
Council travel & subsistance - Budget - $22,000)
Council membership Conferences (Budget - $16,000)
Administration $1,230,121 $1,215,838.00 $1,302,597.00 $86,759.00 7.14% Salary (merit), Insurance, Election
Police $1,140,831 $1,140,831.00 $1,264,942.00 $124,111.00 10.88%
RCMP - Contract Billings (2021 Budget - $1,080,481 / 2020 Budget - $956,072 = $124,409
Fire $889,028 $900,178.00 $894,059.00 -$6,119.00 -0.68% Fire Fighter Honorariums
Disaster Services $32,068 $20,068.00 $33,080.00 $13,012.00 64.84% County Director of Emergency Man
Bylaw Enforcement $185,808 $185,808.00 $192,716.00 $6,908.00 3.72% Operational Increase
Common Services $150,597 $150,597.00 $156,733.00 $6,136.00 4.07% Operational Increase
Roads, Streets, Walks, Lights $1,903,345 $1,903,345.00 $1,947,877.00 $44,532.00 2.34% Top Soil Screening, Street l ights
Airport $46,974 $46,974.00 $47,635.00 $661.00 1.41% Operational Increase
Water Supply & Distribution $3,095,880 $3,095,880.00 $3,092,209.00 -$3,671.00 -0.12%
Sewer $642,607 $642,607.00 $706,865.00 $64,258.00 10.00% Insurance, Util ities,
Garbage Collection & Disposal $722,866 $794,016.00 $724,917.00 -$69,099.00 -8.70% Hauling Contract / SWMA Req 0%
FCSS $196,435 $196,435.00 $196,435.00 $0.00 0.00%
Cemetery $64,668 $64,668.00 $65,790.00 $1,122.00 1.74% Operational Increase
Planning & Development $342,725 $380,225.00 $330,035.00 -$50,190.00 -13.20% (salary) / Safety Code Inspections
Comm Services -Handi Bus $25,000 $25,000.00 $25,000.00 $0.00 0.00%
Economic Development $532,150 $633,150.00 $679,030.00 $45,880.00 7.25% BOT Website and Advertising
Subdivison Land $55,270 $55,270.00 $55,820.00 $550.00 1.00%
Land, Housing & Rentals $43,900 $43,900.00 $44,890.00 $990.00 2.26% Insurance
Recreation - General $138,775 $138,775.00 $151,470.00 $12,695.00 9.15% Software Maintenance
Recreation Programs $82,280 $82,280.00 $84,740.00 $2,460.00 2.99% Operational Increase
Facilities $2,431,270 $2,459,512.00 $2,386,688.00 -$72,824.00 -2.96% Utility Decreases
Culture $345,812 $345,812.00 $334,162.00 -$11,650.00 -3.37% Parkland, Library, Museum
Community Hall $104,029 $104,029.00 $107,546.00 $3,517.00 3.38% Operational Increase
Senior's Center $13,310 $13,310.00 $13,330.00 $20.00 0.15%
Parks $618,745 $614,051.00 $625,631.00 $11,580.00 1.89% Operational Increase
Operating Contingency -$230,000 -$230,000.00 -$220,000.00 $10,000.00 -4.35% WTP Gross Recovery, Tran to Res
WTP gross recovery - ($220,000) (JE made at end of year prior to Audit)
Requisitions $2,678,334 $2,683,612.00 $2,697,012.00 $13,400.00 0.50%
ASFF (Budget - $2,150,127)
ASFF Separate School (Budget - $177,176)
County of Stettler Senior Lodges (2021 Budget - $368,792 / 2020 Budget $347,873 = $20,919 )
Total Expense $17,691,128.00 $17,927,471.00 $18,162,839.00 $235,368.00 1.31%
Surplus / Deficit $549,247.00 $1,025,427.00 $648,849.00 -$376,578.00
Expense
Available for Capital from 2021 Operating Budget for 2021 Capital Budget - $583,742 (Water $55,149 + Utility $358,182 (sewer, waste, recycling) +
Total Available for Capital - $235,518) = $648,849
\\tos20-fs1\company shared folders\Misc Town\Steven\Memo\20201215Council - Budget Interim Operating Memo 2021.docx
23
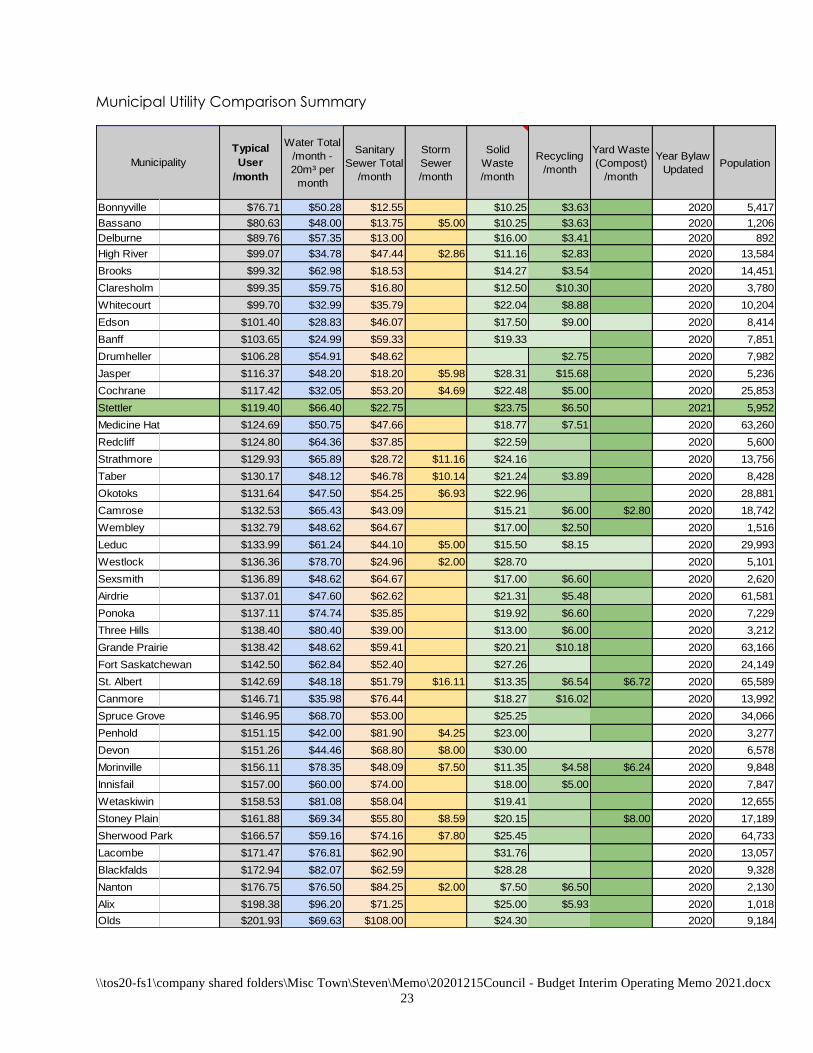
Municipal Utility Comparison Summary
Typical
User
/month
Water Total
/month -
20m³ per
month
Sanitary
Sewer Total
/month
Storm
Sewer
/month
Solid
Waste
/month
Recycling
/month
Yard Waste
(Compost)
/month
Year Bylaw
UpdatedPopulation
Bonnyville $76.71 $50.28 $12.55 $10.25 $3.63 2020 5,417
Bassano $80.63 $48.00 $13.75 $5.00 $10.25 $3.63 2020 1,206
Delburne $89.76 $57.35 $13.00 $16.00 $3.41 2020 892
High River $99.07 $34.78 $47.44 $2.86 $11.16 $2.83 2020 13,584
Brooks $99.32 $62.98 $18.53 $14.27 $3.54 2020 14,451
Claresholm $99.35 $59.75 $16.80 $12.50 $10.30 2020 3,780
Whitecourt $99.70 $32.99 $35.79 $22.04 $8.88 2020 10,204
Edson $101.40 $28.83 $46.07 $17.50 $9.00 2020 8,414
Banff $103.65 $24.99 $59.33 $19.33 2020 7,851
Drumheller $106.28 $54.91 $48.62 $2.75 2020 7,982
Jasper $116.37 $48.20 $18.20 $5.98 $28.31 $15.68 2020 5,236
Cochrane $117.42 $32.05 $53.20 $4.69 $22.48 $5.00 2020 25,853
Stettler $119.40 $66.40 $22.75 $23.75 $6.50 2021 5,952
Medicine Hat $124.69 $50.75 $47.66 $18.77 $7.51 2020 63,260
Redcliff $124.80 $64.36 $37.85 $22.59 2020 5,600
Strathmore $129.93 $65.89 $28.72 $11.16 $24.16 2020 13,756
Taber $130.17 $48.12 $46.78 $10.14 $21.24 $3.89 2020 8,428
Okotoks $131.64 $47.50 $54.25 $6.93 $22.96 2020 28,881
Camrose $132.53 $65.43 $43.09 $15.21 $6.00 $2.80 2020 18,742
Wembley $132.79 $48.62 $64.67 $17.00 $2.50 2020 1,516
Leduc $133.99 $61.24 $44.10 $5.00 $15.50 $8.15 2020 29,993
Westlock $136.36 $78.70 $24.96 $2.00 $28.70 2020 5,101
Sexsmith $136.89 $48.62 $64.67 $17.00 $6.60 2020 2,620
Airdrie $137.01 $47.60 $62.62 $21.31 $5.48 2020 61,581
Ponoka $137.11 $74.74 $35.85 $19.92 $6.60 2020 7,229
Three Hills $138.40 $80.40 $39.00 $13.00 $6.00 2020 3,212
Grande Prairie $138.42 $48.62 $59.41 $20.21 $10.18 2020 63,166
Fort Saskatchewan $142.50 $62.84 $52.40 $27.26 2020 24,149
St. Albert $142.69 $48.18 $51.79 $16.11 $13.35 $6.54 $6.72 2020 65,589
Canmore $146.71 $35.98 $76.44 $18.27 $16.02 2020 13,992
Spruce Grove $146.95 $68.70 $53.00 $25.25 2020 34,066
Penhold $151.15 $42.00 $81.90 $4.25 $23.00 2020 3,277
Devon $151.26 $44.46 $68.80 $8.00 $30.00 2020 6,578
Morinville $156.11 $78.35 $48.09 $7.50 $11.35 $4.58 $6.24 2020 9,848
Innisfail $157.00 $60.00 $74.00 $18.00 $5.00 2020 7,847
Wetaskiwin $158.53 $81.08 $58.04 $19.41 2020 12,655
Stoney Plain $161.88 $69.34 $55.80 $8.59 $20.15 $8.00 2020 17,189
Sherwood Park $166.57 $59.16 $74.16 $7.80 $25.45 2020 64,733
Lacombe $171.47 $76.81 $62.90 $31.76 2020 13,057
Blackfalds $172.94 $82.07 $62.59 $28.28 2020 9,328
Nanton $176.75 $76.50 $84.25 $2.00 $7.50 $6.50 2020 2,130
Alix $198.38 $96.20 $71.25 $25.00 $5.93 2020 1,018
Olds $201.93 $69.63 $108.00 $24.30 2020 9,184
Municipality