Embed Size (px)
Citation preview

MEMBRANE FLOW DURING PINOCYTOSIS
A Stereologic Analysis
RALPH M. STEINMAN, SCOTT E. BRODIE, and ZANVIL A. COHN
From The Rockefeller University, New York 10021
ABSTRACT
HRP has been used as a cytochemical marker for a stereologic analysis of pinocytic vesicles and secondary lysosomes in cultivated macrophages and L cells. Evidence is presented that the diaminobenzidine technique (a) detects all vacuoles containing enzyme and (b) distinguishes between incoming pinocytic vesicles and those which have fused with pre-existing lysosomes to form secondary lysosomes.
The HRP reactive pinocytic vesicle space fills completely within 5 min after exposure to enzyme, while the secondary lysosome compartment is saturated in 45-60 min. The size distribution of sectioned (profile) vacuole diameters was measured at equilibrium and converted to actual (spherical) dimensions using a technique modified from Dr. S. D. Wicksell.
The most important findings in this study have to do with the rate at which pinocytosed fluid and surface membrane move into the cell and on their subsequent fate. Each minute macrophages form at least 125 pinocytic vesicles having a fractional vol of 0.43% of the cell's volume and a fractional area of 3.1% of the cell's surface area. The fractional volume and surface area influx rates for L cells were 0.05% and 0.8% per minute respectively. Macrophages and L cells thus interiorize the equivalent of their cell surface area every 33 and 125 min.
During a 3-h period, the size of the secondary lysosome compartment remains constant and represents 2.5% of the cell volume and 18% of the surface area. Each hour, therefore, the volume and surface area of incoming vesicles is 10 times greater than the dimensions of the secondary lysosomes in both macrophages and L cells. This implies a rapid reduction in vesicle size during the formation of the secondary lysosome and the egress of pinocytosed fluid from the vacuole and the cell. In addition, we postulate that membrane components of the vacuole are subsequently recycled back to the cell surface.
Pinocytosis involves the formation of a membrane- bound vesicle from the cell surface, trapping within it fluid and solutes from the extracellular environ- ment. In most cells, these incoming pinocytic vesicles fuse with acid-hydrolase-containing gran- ules or lysosomes. These events have been studied largely in relation to macromolecular and small
particulate markers occupying the content of the incoming vesicle (e.g., 9, 15, 40, 41). In these instances, interiorized materials undergo digestion and/or sequestration within the lysosomal appara- tus. Very little else is known about pinocytic vesicles. We lack quantitative information on their surface areas and volumes, especially in relation to
THE JOURNAL OF CELL BIOLOGY �9 VOLUME 68, 1976 �9 pages 665-687 665
Dow
nloaded from http://rupress.org/jcb/article-pdf/68/3/665/1402202/665.pdf by guest on 04 February 2022

the area and volume of the whole cell. We do not know the composition of the vesicle membrane, the factors which lead to fusion with lysosomes, and the fate of the vesicle surface after such fusion. Finally, we do not fully understand the function of this widespread cellular activity in higher orga- nisms.
We have been interested in obtaining quantita- tive information on the pinocytic activity of cul- tured mammalian cells. Our initial studies (40, 41) were concerned with the rate of uptake of solutes, since it has been generally assumed that pinocyto- sis serves some nutritional role. We found that the glycoprotein enzyme, horeseradish peroxidase (HRP), was a useful marker. In both macrophages and L cells, cell-bound HRP can be localized cytochemically to the vacuolar system. Quantita- tive studies with a sensitive enzymatic assay dem- onstrated that it is taken up in the fluid phase without prior adsorption to the cell surface. Up- take is directly proportional to the concentration of HRP in the culture medium over a large range (0.05-2.0 mg/ml), proceeds continuously with time, and is highly temperature dependent. Finally administration of HRP did not appear to alter the ongoing pinocytic activity of cultured cells (41). Using the HRP model, we conclude that 106 macrophages and growing L cells pinocytose about 10- ' ml of culture medium each hour, i.e., the rate of uptake of fluid phase solutes is 0.01% of the administered solute load/milliliter. Moreover, the uptake and degradation rates of HRP remain constant for days in cultures of both cell types. In this study, we use stereologic techniques to focus on the quantities of vesicle membrane and fluid interiorized during pinocytosis and on their subse- quent fate within the cell.
M A T E R I A L S A N D M E T H O D S
Cells
Primary monolayer cultures of resident mouse perito- neal macrophages were obtained as described (6) and maintained for 24 h before use in 35-mm plastic Petri dishes in 20% fetal calf serum (FCS, Grand Island Biological Co., Grand Island, N.Y.) medium 199 (Grand Island) supplemented with penicillin. L cells, a continu- ous line of mouse fibroblasts, were maintained as mono- layers in 60-ram plastic Petri dishes in 5% FCS-minimal essential medium (Schwartz/Mann Div., Becton, Dickin- son & Co., Orangeburg, N.Y.) supplemented with peni- cillin and streptomycin, and were studied during the rapid log phase of growth.
Horseradish Peroxidase (HRP)
The Type II preparation of Sigma Chemical Co. (St. Louis, Mo.) was used and generally administered to cells as a 1 mg/ml solution in culture medium. Levels of HRP uptake were quantitated with an enzymatic assay as previously outlined (40, 41). The Graham and Karnovsky diaminobenzidine (DAB) (24) technique was used to localize cell-bound enzyme, also as previously described (40, 41).
Cytochemical analysis was often performed on cells pulsed for very grief periods with HRP (0-180 s). Culture dishes were taken from the COs incubator and placed in a thin layer of water in a 37~ water bath. At time 0, medium containing HRP at 37~C was added. To termi- nate the HRP exposure and pinocytic activity quickly (within 15 s), the medium was aspirated, and the entire dish was passed through three 250-ml beakers of ice-cold phosphate-buffered saline (PBS), followed by 2.5% glu- taraldehyde in 0.1 M cacodylate buffer as fixative. Zero-time cultures were treated in an identical fashion, i.e., HRP was added to the cells and then aspirated immediately.
Other Pinocytic Markers
The rate of HRP uptake was compared with that of all-sucrose, another fluid-phase pinocytic marker for tissue culture work (46). SH-sucrose, 2 Ci/mol, was obtained from Amersham/Searle Corp., Arlington Heights, Ill. and administered at a concentration of 10 -6 M (2 x 10 ~ cpm/ml) in tissue culture medium. As in assays for HRP uptake, the monolayers were washed five times in medium 199 and then left at 37~ for 1/2 h before lysis in 0.5 ml of 0.05% (vol/vol) Triton X-100 (Sigma Chemical) in water. 100,1 of cell lysate was then counted in 10-ml Aquasol scintillation fluid (New England Nu- clear, Boston, Mass.) using a Nuclear-Chicago Mark 11 scintillation counter (Nuclear-Chicago Corp., Des Plaines, 111.) operating at 43% efficiency. This sucrose uptake assay is relatively insensitive and prolonged exposures (up to 6 h) are required for reliable data.
A colloidal thorium dioxide (Thorotrast, Fellows-Tes- tagar Div., Fellows Mfer. Co., Inc., Detroit, Mich,) preparation was also used as a pinocytic marker for electron microscope studies. The cells were exposed to a 1-30 dilution (vol/vol) of colloid in tissue culture me- dium for 2h.
Sampling Procedure for Stereologic Studies Random samples were obtained as follows. Each mon-
olayer culture was fixed and processed as a cell pellet in agar according to the technique of Hirsch and Fedorko (28). If the cells are scraped from the monolayer after the initial glutaraldehydr fixation, a cell pellet is obtained in which the cells are evenly distributed and randomly oriented. Three to six pieces from each pellet were
666 TSE JOURNAL OF CELL BIOLOGY �9 VOLUME 68, 1976
Dow
nloaded from http://rupress.org/jcb/article-pdf/68/3/665/1402202/665.pdf by guest on 04 February 2022

sectioned and collected o n large holed grids. Micro- graphs of most cells on a single section were then take8 and examined at a final magnification of 10,000 with appropriate graticules. Generally 40-100 micrographs were analyzed per culture, corresponding to sections through 100-300 cell profiles (profiles in which the cell nucleus was present), Individual or pairs of cultures were examined, since it was previously established that the absolute level of pinocytic activity varies little in replicate cultures (40, 41). Reproducibility was assessed by doing experiments on two or more occasions with different batches of cells.
Cell Dimensions
The volume of cells was measured from the cell diameter using the relation V = IrD8/6. Cells were allowed to assume spherical shapes after removal from monolayer culture. L cells become spherical after tryp- sinization from culture dishes by a standard procedure (41). Macrophages were more difficult to remove. A useful procedure for this work was to chill monolayers in ice-cold PBS. When some of the cells began to round up (15-30 min), the cells were scraped from the dishes with a policeman. More than 90% are trypan blue negative, and most are spherical. On four different occasions, we measured the diameters of 200 cells at a magnification of 1,000 using a calibrated micrometer eyepiece.
Cell protein determinations were made with a modi- fied Lowry procedure (35) using hen egg-white lysozyme as standard (Worthington Biochemical Corp., Freehold, N.J.). The same preparations that were used to measure cell diameter were counted in a hemocytometer and analyzed for protein content. The amount of cell protein in these samples was identical to that obtained if the monolayers were simply lysed outright in 0.05% Triton X-100 in water.
Cell surface areas were determined by stereologic techniques, since their outlines were so irregular (micro- villi, ruffles, blebs, etc.) The surface area per cell is found by dividing the surface to volume ratio, Sv, by the number of cells per unit volume, Nv, where volume refers to the total volume of cells and embedding plastic. For any micrograph, Sv, the ratio of cell surface area to specimen volume, is given by 2PL, where PL is the number of intersections a grid of equally spaced parallel lines makes with the cell surface, per unit length of line (19, 34, 48). Our test grid had 19 lines, 25-cm long and l-cm apart, and our final magnification was 10,000. Nv, the number of cells per unit volume of specimen, is given by the fraction of test points falling on cells times the volume represented by each point, divided by the volume of individual cells. Our grid had 475 test points, l-cm apart so that each point at • 10,000 represents I #ms. A sample calculation is as follows. The 475 cm of test line made an average of 105 intersections with the macro- phage cell surface pet micrograph, so that Sv was 2 •
105/475 #m 2 cell surface/#m s specimen. Of 475 test points per micrograph, an average of 110 fell on cells. Since the volume of a macrophage is 395 um s, the number of cells per unit volume of specimen is 110/475 x 1/395. The surface area per cell is then 2 • 105 • 395/110 or 754 #m s for this set of micrographs.
In some instances, we labeled the surface of macro- phages with a presumptive nonpenetrating marker, ac- cording to Bernhard and Avrameas (2). A 100 /tg/ml solution of concanavalin A (con A) (Miles Yeda, Yeda Research and Development Co., Ltd., Reh6voth, Israel) was attached to the surface of glutaraldehyde-fixed cells over a 15-min period, the bound Con A was then made visible by its ability to bind a 50 #g/ml solution of HRP, and this was followed by staining with the DAB proce- dure.
Vacuole Dimensions
Vacuoles involved in pinocytosis of HRP were identi- fied by their content of cytocbemical reaction product in otherwise unstained sections. The criteria for distinguish- ing incoming pinocytic vesicles and secondary lysosomes (collectively referred to as vacuoles) will be described in the Results section. Since most are circular in shape, their diameters can be measured and a frequency distri- bution plotted. The latter is a distribution of profile or sectioned diameters, as opposed to vacuole, or spherical, diameters. Wicksell (52) has devised a procedure for obtaining (a) the distribution of vacuole sizes that gives rise to the observed profile data, and (b) the average vacuole diameter, surface area, and volume. The exact procedure we used was that of S. Brodir and B. W. Knight (manuscript in preparation) of The Rockefeller University, who have slightly modified the Wicksell analysis and programmed it for computer use. The section thickness, 0.08 am, was included in the computa- tion.
Two approaches were taken to determine the area and volume of the entire pinocytic vesicle and lysosome compartment. The first and easiest approach is to use a grid of test points and lines 09, 34, 49). This provides a vacuole volume fraction, given by the frequency with which test points fall on vacuole vs. cell, and a surface area fraction, given by the frequency with which test lines intersect vacuole vs. cell surface. These fractions were multiplied by the cell surface area and volume (see Materials and Methods) to get the absolute size of the vacuole compartment. A second method is to multiply the average vacuole area and volume (see preceding paragraph) by the number of vacuoles per unit volume of cell, Nv. Nv is obtained from the number of vacuole profiles per unit area of section. This is converted to a number per unit volume by dividing by "'D + t", where
is the average vacuole diameter and "t" the section thickness, 0.08 #m (18, 19, 34, 48).
STE1NMAN, BRODIE, AND COHN Membrane Flow during Pinocytosis 667
Dow
nloaded from http://rupress.org/jcb/article-pdf/68/3/665/1402202/665.pdf by guest on 04 February 2022

RESULTS
Cellular Dimensions (Table I)
Macrophages and L cells assume spherical shapes when removed from a monolayer into suspension culture. The diameters of each cell type fell in a narrow distribution, the mean being 9.1 • 0.8 , m for macrophages and 15.0 + 1.1 #m for L cells. With the formula rDS/6, we obtained aver- age volumes of 385 + 40 ~tm 3 and 1,765 • 130 ~m 3 respectively.
The protein content of cells in suspension was measured next, since quantitative data on HRP uptake have generally been measured on a per unit of protein basis (40, 41). 10 e macrophages have 80 + 12/ag of protein, using lysozyme as standard in the Lowry procedure, while 106 L cells had 455 • 20 #g at the stage of growth studied. The macro- phage value is higher than that previously reported (40), as the latter data was based on erroneous cell counts.
The surface areas of the two cell types were determined by stereologic techniques. The aver- ages were 825 + 80 for macrophages and 2,100 + 245 for L cells, These results are 3.3 and 3.0 times that which would have been obtained had these cells been assumed to be smooth spheres with areas of ~rD 2.
The identification of the macrophage surface is complicated by the presence of peripheral lacunae, i.e., vesicles in the peripheral cytoplasm which appear to be intracellular but in fact are connected to the extracellular space. In routine sections, many of these can be distinguished from actual intracellular pinocytic vesicles by their irregular shapes. To assess the extent of error introduced by these lacunae, we labeled the cell surface with con A and peroxidase, according to Bernhard and Avrameas (2). In four specimens, less than 4% of the cell surface intersections passed through la- beled spherical lacunae, i.e., structures that in
routine section would have been considered as intracellular pinocytic vesicles. For practical pur- poses, then, the macrophage plasma membrane can be identified in routine sections.
Most of our work on the dimensions of en- docytic vacuoles, and the kinetics with which they are formed, has been performed on macrophages. The macrophage data will be presented in detail followed by some comparative observations on mouse L cells.
HRP as a Marker for Distinguishing
Pinocytic Vesicles and
Secondary L ysosomes
As previously noted (40, 41), cytochemical local- ization of pinocytosed HRP yields vacuoles with reaction product in two types of distribution. In one, only a peripheral rim of cytochemical reactiv- ity is seen, adjacent to the inner aspect of the vacuole membrane, while in the other, the entire granule is filled with product. Two lines of mor- phologic evidence were obtained to show that the former represent recently formed pinocytic vesi- cles, while the latter are secondary lysosomes, i.e., vesicles which have fused with existing acid-hydro- lase-filled structures.
Kinetic studies first revealed that macrophages exposed for a brief period to HRP (3 min or less), contain vacuoles with only the peripheral rim of reactivity (Fig. 1). These presumptive pinocytic vesicles were entirely intracellular since binding of HRP to the cell surface is not demonstrable (40, 41, and Figs. 1-5 and 7). Longer periods of exposure (beginning at 5 min) are required to produce the dense reactive granule (Fig. 2). If macrophages are exposed to HRP (60 min) and then cultured in HRP-free medium (30 min) (to chase enzyme from the incoming vesicle compart- ment), then the peripheral rim type of reactive
TABLE I
Dimensions of Macrophages and L Cells
Parameter M acrophage L cell
Diameter~m) 9.1 • 0.8 15.0 • 1.1
Volume~m 8) 395 a: 34 1,765 • 130
Surface area (/zm 2) 825 • 80 2,100 • 245
Protein ~g/106 cells) 80 • 12 455 • 20
668 THE JOURNAL OF CELL BIOLOGY �9 VOLUME 68, 1976
Dow
nloaded from http://rupress.org/jcb/article-pdf/68/3/665/1402202/665.pdf by guest on 04 February 2022

FIGURE 1 A section through a cell pellet of macrophages exposed for 3 min to I mg/ml of HRP. The cr population is uniform with respect to cell type and content of reaction product. Mast cells (M) are infrequent. Incoming pinocytic vesicles have a peripheral rim of cytochcmical reactivity. They are spherical in shape and exhibit a continuous distribution of profile diameters. The largest in this section are 0.8 pm (short arrows, top left) and the smallest (e.g., long arrows) are 0. i-0.2 pm. After this brief exposure to enzyme, reactive vacuoles are distributed throughout the cytoplasm. This micrograph is magnified 5,000 • which is one-half the magnification used in this work.
669
Dow
nloaded from http://rupress.org/jcb/article-pdf/68/3/665/1402202/665.pdf by guest on 04 February 2022

FIGURE 2 A section in the plane of the cell monolayer of a macrophage exposed 10 min to 1 mg/ml HRP. Most reactive vacuoles have a pcripberal run of reactivity and are accumulating in the perinuclear region. Some secondary lysosomes replete with reaction product (arrows) have formed. Their numbers increase greatly with further HRP exposure. The inclusion, labeled X, may be a large vacuole with HRP. However these infrequent structures are seen in cells not exposed to enzyme and may be degenerating phagocytosed cells. • 6,500.
FIGUP, E 3 A section similar to that in Fig. 2 except that the culture was exposed to HRP for 1 h and then chased in HRP-free medium for 1/2 h. Presumptive pinocytic vesicles (long arrows) now lack reaction product. Many reactive secondary lysosomes are present in the perinuclear region. Some are aligned in long rows (enclosed by short arrows) which extend out into the cell pseudopods. • 7,500.
Dow
nloaded from http://rupress.org/jcb/article-pdf/68/3/665/1402202/665.pdf by guest on 04 February 2022

vacuoles are rare while the dense structures are abundant (Fig. 3).
A second line of evidence involved double label- ing of cells, first treating them with colloidal thorium dioxide and then exposing them for 1 h to the cytochemical tracer, HRP. The rationale here is that the colloid would be chased from pinocytic vesicles into secondary lysosomes during the l-h HRP exposure, so that pinocytic vesicles would contain only HRP, and secondary lysosomes both markers. In fact, little or no thorium dioxide was visualized in several hundred putative incoming HRP-reactive vesicles (i.e., those with a peripheral rim of reactivity), whereas most vacuoles filled with HRP-reaction product exhibited colloid as well (Figs. 4 and 5). We rarely found profiles with colloidal thorium and no HRP. if Thorotrast and HRP were given to cells simultaneously, colloid and enzyme reaction product were found in both types of HRP-reactive vacuole. We have not yet succeeded in using cytochemical techniques to localize an acid hydrolase (e.g., acid phosphatase) to the granules labeled with HRP. However, previous studies have shown that secondary lyso- somes marked with acid-phosphatase reaction product are similar in structure and distribution to those containing dense HRP reactivity (9). For the remainder of this study, we refer to vacuoles with a peripheral rim of cytochemical reactivity as pino- cytic vesicles, whereas those with a dense content are called secondary lysosomes. Although pre- sumptive pinocytic vesicles are often larger than lysosomes (see below), the distinction between the two types of vacuole is made solely on the basis of the distribution of cytochemical reaction product vs. size.
The Sensitivity of the Cytochemical Technique
The other important advantage of HRP as a marker solute is that the DAB technique appears to detect all incoming pinocytic vesicles. Previous studies (40, 41) established that HRP was pinocy- tosed in the fluid phase of incoming vesicles, so that increasing the concentration of enzyme in the culture medium should simply increase its concen- tration in the pinocytic vesicle. If the cytochemical assay is fully sensitive, there should exist some concentration of HRP at which the number and dimensions of HRP reactive vesicles reaches a plateau; raising the concentration of enzyme in the culture medium (hence vesicles) should not change
their detectability even though the absolute amount of interiorized HRP would increase. This was indeed observed in macrophages exposed for 2.5 rain to 0.1, 0.5, 1,0, and 2.0 mg/ml HRP (Table II). There was no significant difference in the number, fractional surface areas, and frac- tional volumes of pinocytic vesicles in cells given the three higher concentrations of enzyme, while all three parameters decreased significantly at 0.1 mg/ml (lines i-3, Table II). Control data showed that the overall cellular dimensions were not altered by the different concentrations of HRP, viz, the surface area of the cells and the size of the cell profiles (lines 4 and 5, Table II). The DAB procedure must therefore detect all incoming pino- eyrie vesicles which form from culture medium containing 0.5 mg/ml HRP or more. Further supporting evidence will be presented below.
The Size Distribution of Pinocytic Vesicles and Secondary L ysosomes
The diameters of newly formed pinocytic vesi- cles were measured in cells exposed for 30, 60, 150, 180, and 300 s to 1 mg/ml HRP (Table III). Some 10-20% of the vesicle profiles were not circular, so that an estimate of their equivalent circular diame- ter was made. With time, the relative frequency of larger profiles increased. We suspect this is due to fusion among incoming pinocytic vesicles. The composite distribution for 5,703 vesicle profiles, representing the cumulative data in Table III, has been plotted (Fig. 7 A).
The distribution of profile diameters can be converted to actual vesicle diameters using a procedure of S. Brodie and B. W. Knight (manu- script in preparation, modified from Wickseil [52]). Data for the mean actual vesicle diameter, area, and volume are presented in Table IV. It is noteworthy that if vesicles must be greater than 0.3 ~m to be resolved by phase contrast microscopy, then at least 84% of the incoming vesicles (30 s data) would not be detectable.
Macrophages, like other cells, contain a popula- tion of small, 0.1 #m, coated vesicles, i.e., vesicles in which tiny spikes or bristles project from the surface into the cytoplasm. These coated vesicles predominated along the dish surface of cultured cells. At either cell surface, however, they lacked HRP reaction product (Fig. 6).
Longer exposures of macrophages to HRP results in the appearance of a large population of HRP-containing secondary lysosomes (Figs. 2 and
STEINMAN, BRODIE, AND COHN Membrane Flow during Pinocytosia 671
Dow
nloaded from http://rupress.org/jcb/article-pdf/68/3/665/1402202/665.pdf by guest on 04 February 2022

672 THE JOURNAL OF CELL BIOLOGY �9 VOLUME 68, 1976
Dow
nloaded from http://rupress.org/jcb/article-pdf/68/3/665/1402202/665.pdf by guest on 04 February 2022

3). The frequency size dis t r ibut ion of 4,850 sec- t ioned (profile) lysosome diameters , after 60 min of HRP , has been obtained (Fig. 7 B). When converted to actual vacuole diameters , this distri- but ion gives an average lysosome diameter , area, and volume of 0.136 ~m, 0.108 #m 2, and 0.0074 , m a. 92% of the lysosomes have a d iameter of 0.30 /~m or less, in cells cult ivated under those condi- tions.
The Kinetics o f Pinocytic Vesicle Formation
Since the DAB technique faithfully identifies incoming pinocytic vesicles, we exposed cells for 0 - 5 rain to 1 m g / m l H R P to quant i ta te the initial rate of vesicle fluid entry. This was determined first by measuring the fraction of test points falling on vacuole vs. cell after varying t imes in HRP. A sample field tha t was analyzed is shown in Fig. 1.
TABLE I1
Sensitivity of the Diaminobenzidine Technique
Measurement Dose of HRP in culture medium mg/ml
0.1 0.5 1.0 2.0
1. No. vesicles/points on cell
2. Vesicle/cell intersections
0.109 0.199 0.215 0.229 +0.026 • +0.048 +0.022
0.051 0.093 0.106 0.103 +0.024 • • :e0.013
3. Vesicle/cellpoints 0.0062 0.0113 0.0126 0.0123 +0.0022 • +0.0021 +0.0038
4. Cell intersections/cell points
5. Cell points/no, cell profiles
0.902 0.950 0.922 0.921 +0.099 • • +0.073
46.5 40.0 40.9 47.0 ~5.8 • +2.5 :e7.1
Measurements (• standard deviation) were made of cytochemically reactive pinocytic vesicles after a 2.5-min exposure to varying concentrations of HRP. Line 1 gives the numerical density of vesicles per unit area of cell in section; lines 2 and 3 the surface area and volume fractions of vesicles relative to the whole cell: line 4 relates the surface area of the cells to their volume; and line 5 reflects the absolute size of the cells.
FIGURE 4 A doubly labeled macrophage, loaded for 2 h with colloidal thorium dioxide (the electron-dense particles), washed, and then exposed for 1 h to HRP. The rationale is that most of the ThO2 would move into secondary lysosomes during the last hour in HRP, while HRP should be found in both pinocytic vesicles and lysosomes. In fact, the presumptive, HRP-reactive, pinocytic vesicles (arrows) lack colloid, while vacuoles with a dense content of HRP reaction product contain ThO~. • 20,000.
FIGURE 5 Another doubly labeled macrophage. Again the presumptive pinocytic vesicles with HRP (PV) contain few electron-dense thorium dioxide particles, while dense HRP-reactive granules have abundant colloid. Even though this is a thin section labeled briefly with both markers, it is evident that ThOs and HRP accumulate in the same lysosome compartment, x 23,500.
FIGURE 6 A macrophage pulsed 5 min with HRP and sectioned close to the dish surface, where coated vesicles (*) are frequent. Unlike the other micrographs, this has been stained with lead and uranyl salts to better visualize the bristles or spikes on the cytoplasmic aspect of coated vesicles. The latter do not exhibit HRP. Several other types of smooth surfaced vacuoles are present in this field. Some have reaction product (arrows), some lack any content whatsoever, (--), while others have an electron-dense content but no HRP (L). The latter presumably are lysosomes that have not yet fused with incoming reactive vesicles. • 56,000.
STEINMAN, BROOIE, AND COHN Membrane Flow during Pinocytosis 673
Dow
nloaded from http://rupress.org/jcb/article-pdf/68/3/665/1402202/665.pdf by guest on 04 February 2022
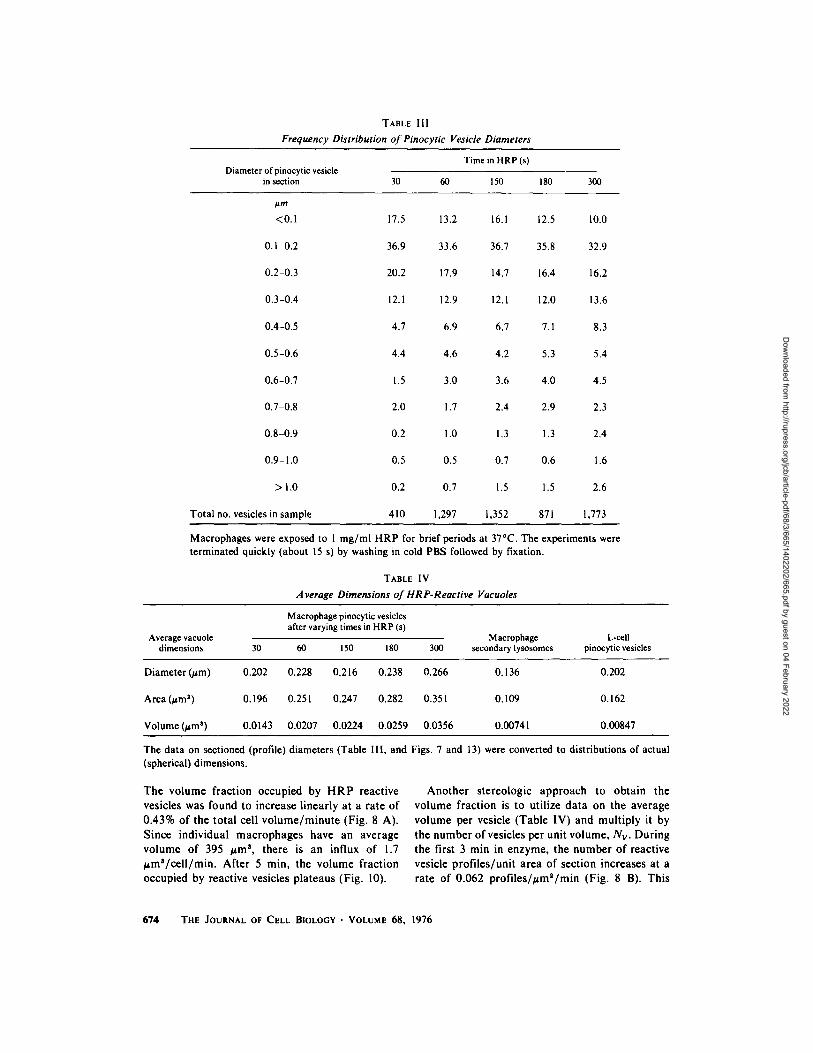
TABLE I11
Frequency Distribution of Pinocytic Vesicle Diameters
Time in HRP (s) Diameter of pinocytic vesicle
in section 30 60 150 180 300
pm
<0.1 17.5 13.2 16.1 12.5 10.0
0.1-0.2 36.9 33.6 36.7 35.8 32.9
0.2-0.3 20.2 17.9 14.7 16.4 16.2
0.3-0.4 12.1 12.9 12.1 12.0 13.6
0.4-0.5 4.7 6.9 6.7 7.1 8.3
0.5-0.6 4.4 4.6 4.2 5.3 5.4
0.6-0.7 1.5 3.0 3.6 4.0 4.5
0.7-0.8 2.0 1.7 2.4 2.9 2.3
0.8-0.9 0.2 1.0 1.3 1.3 2.4
0.9-1.0 0.5 0.5 0.7 0.6 1.6
> 1.0 0.2 0.7 1.5 1.5 2.6
Total no. vesicles in sample 410 1,297 1,352 871 1,773
Macrophages were exposed to 1 mg/ml HRP for brief periods at 37~ The experiments were terminated quickly (about 15 s) by washing in cold PBS followed by fixation.
TABLE IV
,4 verage Dimensions of HRP-Reactive Vacuoles
Macrophage pinocytic vesicles after varying times in HRP (s)
Average vacuole Macrophage L-cell dimensions 30 60 150 180 300 secondary lysosomes pinocytic vesicles
Diameter (~m) 0.202 0.228 0.216 0.238 0.266 0.136 0.202
Area 0~m 2 ) 0.196 0.251 0.247 0.282 0.351 0.109 0.162
Volume (~m s) 0.0143 0.0207 0.0224 0.0259 0.0356 0.00741 0.00847
The data on sectioned (profile) diameters (Table Ill, and Figs. 7 and 13) were converted to distributions of actual (spherical) dimensions.
The volume fraction occupied by H R P reactive vesicles was found to increase linearly at a rate of 0.43% of the total cell vo lume /minu te (Fig. 8 A). Since individual macrophages have an average volume of 395 ~m a, there is an influx of 1.7 , m S / c e l l / m i n . After 5 min, the volume fraction occupied by reactive vesicles plateaus (Fig. 10).
Another stereologic approach to obtain the volume fract ion is to utilize data on the average volume per vesicle (Table IV) and multiply it by the number of vesicles per unit volume, Nv. During the first 3 min in enzyme, the number of reactive vesicle prof i les /uni t area of section increases at a rate of 0.062 prof i l es /#mS/min (Fig. 8 B). This
674 THE JOURNAL OF CELL BIOLOGY �9 VOLUME 68, 1976
Dow
nloaded from http://rupress.org/jcb/article-pdf/68/3/665/1402202/665.pdf by guest on 04 February 2022

v
g,
L I -
40-
30-
20-
A
lO'm ~ 0 0.1 Q2 0.3 04 0.5 0.6 0.7 0.8 0.9 1.0 1.0 Sectioned diameter of pinocytic vesicle (pm)
40-
30-
= 20" G )
r
U_
m
B
1 o
0 0.1 0.2 03 0.4 0.5 06 0.7 08 O9 I.O )I'.0 Sectioned diameter of secondary lysosome (,urn)
FIGURE 7 (A) Frequency distribution of the sectioned diameters of pinocytic vesicles, i.e. HRP-reactive vacu- oles with a peripheral rim of reactivity. The histogram is from the cumulative data on 5,703 profiles in Table II, i.e. for cells exposed 1/2-5 min to HRP. (B) The sectioned diameters of 4,850 secondary lysosomes, i.e. vacuolar profiles having a dense content of cytochemicai reaction product after a 60 min exposure to HRP.
value may be an underestimate due to vesicle fusion, e.g., for the first time-point (30 s), the rate is 0.086 profiles//=m 2 cell section/min. The rates of profile formation can be converted to Nv, the number of vesicles per unit volume, by dividing by
+ t where D is the mean vesicle diameter and t, the section thickness. Nv is then 0.206 vacuoles/ /=m s cell/rain for the composite 3 min data (D is 0.220) and 0.304 for the 30 s data (D is 0.202). The volume fractions of pinocytic vesicles/minute is Nv times the average vesicle volume, and is 0.43% of the cell volume/minute for both the composite 3 rain data and the 30 s data (average volumes of 0.0207 and 0.0143, respectively).
These rates of fluid influx mean that some 25% of the total (cytoplasm and nucleus) macrophage volume would be taken in each hour. A similar value can be obtained by an entirely independent nonstereologic procedure. Since HRP is pinocy-
tosext in the fluid phase, the rate of fluid interiori- zation can be determined by dividing the absolute amount of HRP uptake, with an enzymatic assay, by the concentration of HRP in the culture medium. At a concentration of I mg/ml, enzyme is pinocytosed continuously by macrophages (Fig. 9). The rate is i.2 ng, or 1.2 • l0 -e ml per /=g/protein/h. This corresponds to a rate of 1.4 • l0 -6 ml since cells inactivate HRP continuously at a rate of 10% h (40, 41). Since l06 macrophages have 80 , g protein (Table I), one obtains a value of 1.2/=m s solution taken in per cell per min.
Another concern about the high rate of fluid uptake may be that it bears little relation to the ongoing pinocytic activity of cells not exposed to HRP. This too seems unlikely. Uptake of HRP is continuous; even data taken with brief HRP exposures (15 rain) fits the straight line relating HRP uptake with time (Fig. 9). Also the uptake of another pinocytic marker, all-sucrose (47), occurs at the same rate as HRP, whether HRP is present simultaneously or not (Fig. 9).
We next measured the surface area of incoming vesicles in relation to the total cell surface area, as given by the relative frequency with which a grid of test lines intersects vacuole vs. cell surface. During the first minutes of exposure, the surface area of HRP reactive vacuoles increases at a rate of 3.1% of the cell surface area/minute (Fig. 8 C). Since the surface area of the macrophage is 825/=m 2, the rate of formation of vesicle membrane is 26 /~m~/cell/min. Alternatively, the area of mem- brane pinocytosed per minute, using the 30 s data on vesicle profile sizes, is given by the number of vesicles per unit volume, times the area per vesicle, times the volume of the cell, i.e., 0.304 vesicles/ /=m s x 0.196 #m2/vesicle • 395/=m s per cell or 24/=mS/cell.
The Fate of lnteriorized Pinocytic Vesicles
It has long been apparent that incoming pino- cytic vesicles fuse with preformed lysosomes. In fact, our previous kinetic and morphologic data implied that all pinocytosed HRP undergoes inac- tivation and degradation within lysosomes (40, 41). This process of fusion with lysosomes can also be followed cytochemically in cells exposed for pro- longed periods (5-180 min) to I mg/ml of enzyme.
HR~P-containing secondary lysosomes, i.e., membrane-bound granules filled with cytochemi- cal reaction product, first appear 5 min after exposure to enzyme. The earliest reactive granules
STEINMAN, BRODIE, AND COHN Membrane Flow during Pinocytosis 675
Dow
nloaded from http://rupress.org/jcb/article-pdf/68/3/665/1402202/665.pdf by guest on 04 February 2022

28-
G) E =3 2 . 4 - o
.~ 2.0-
.~ E 1.6-
.a~ 1.2-
~ 0.8-
~: 0.4- I
0.0 O
A
o 8 o
I I I I |
1 2 3 4 5 Minutes in HRP
B
0.25-
o c
.9 0.20-
.S ~ 0.15-
" E ._~ ~ ~ ~ o.10- ~ E x
0.05
o
0.00 ? I
o
X o
o o
X
X " X
X X
Minutes in HRP
15-
12- 0
._o~ 9 -
0 - ~ . e,- o)
"~. u
0
n_
i
C
:/~ X o /~ o X
x
/ o ~ $
X
I I o I 2 3 A ;
Minutes in HRP
are most readily apparent in the Golgi region (Fig. 2). The number of HRP-react ive lysosomes in- creases progressively for some 40 min, and then plateaus at a level of 0.60 profi les/#m 2 cell section over the remaining period of study (up to 3 h in all) (Fig. 10 A). With an average lysosome diameter of 0.136 , m (Table IV, calculated from Fig. 7 B), we find that the number of vesicles per unit volume is 2.77. An average cell, 395 /zm s in volume, there- fore contains 1,100 lysosomes. The surface area
FIGURE 8 Data on the kinetics of pinocytic vesicle formation. Cultures were exposed for 0, 1/2, 1, 21/2, 3, and 5 min to I mg/ml HRP in two different experiments (• and O). Each point is derived from a set of micrographs for one specimen. The best fit was plotted for the first 3 min, the correlation coefficients being 0.90-0.92. (A) The initial rate of expansion of the HRP reactive space is 0.43% of the cell volume/minute, as determined with a grid of test points. (B) The number of pinocytic vesicle profiles increases at a rate of 0.062 reactive profiles/,m 2 cell section/minute. (C) The surface area of reactive pinocytic vesicles expands at a rate equivalent to 3.1% of the cell's surface area per minute, as determined with a grid of test lines.
and volume of secondary lysosomes also increases during the 5-45 min period in H R P and then plateaus. Using a grid of test lines and points we find that the plateau values are such that lyso- somes have a fractional surface area equivalent to 18% of the cell surface area and a fractional volume of 2.5% (Fig. 10 B and C). Using a value of 1,100 lysosomes with average dimensions of 0.109 , m 2 area and 0,0074 , m a volume (Table IV derived from Fig. 7 B), the fractional surface
676 T H E J O U R N A L OF C E L L B I O L O G Y �9 V O L U M E 6 8 , 1 9 7 6
Dow
nloaded from http://rupress.org/jcb/article-pdf/68/3/665/1402202/665.pdf by guest on 04 February 2022

250-
i 250-
.~-
cL 150-
8
00 100-
~ 50-
I
r
X ~ O ~ ~ -100
~o ~ ~ ,2o Time exposed to pinocytic marker (rain)
FIGURE 9 The kinetics of solute uptake using HRP (O---O) and SH-sucrose (x-- -x) as fluid-phase mark- ers. Both are taken up continuously at a rate of 0.012% of the administered load/hour/100 ug protein. The HRP assay is sensitive enough so that brief exposures to enzyme give suitable data. The sucrose assay is less sensitive; the data presented are actually the initial part of a 6 h exposure to label.
area is 14.5% and volume is 2.1%, in agreement with data obtained with test grids of lines and points.
Throughout the time-period studied, i.e., after 5 min in HRP, the dimensions of the HRP-reactive pinocytic vesicle space remains constant (Fig. 10 A-C). The number of profiles/urn = plateaus at 0.21 (Fig. 10 A) yielding an Nv of 0.61 vesicles/ /~m 3 (using the average diameter from the 5-min vesicle dimensions in Tables III and IV). Cells 395 /~m s in volume therefore have 240 vesicles of which 70% are 0.30 9m in diameter or less. The fractional volume of the pinocytic vesicle space is 2.5% (using point counting - Fig. 10 B) or 2.2% (using Nv times the average volume per vacuole - 5 min data in Table IV). The fractional surface area is 12.5% (using intersection counting, Fig. 10 C) or 10.2% (using the average vacuole area, 5 min data in Table IV).
We conclude that during the first 5 min of exposure to HRP, enzyme fills the pinocytic vesicle compartment of macrophages, and then gradually (5-45 min) is distributed within a preex- isting lysosomal space whose dimensions probably remain constant throughout the period of this experiment. To test this, a pulse chase experiment was performed in which cells were exposed to HRP
for 15 min, and then chased in HRP-free medium "T for 45 min. At this time, most presumptive pino- x cytic vesicles lacked HRP reactivity, and cyto- �9 ~ chemical product was limited to dense secondary
lysosomes. However, the dimensions of the reac- "~ tive vacuoles were similar to that seen after a
60-rain continuous exposure (Table V), even though quantitatively they contain one-quarter as
~ much HRP. | The critical feature of these data, as evident in
Fig. 10, is that much more vesicle surface and fluid is entering the cell than can be accounted for subsequently in the lysosomal compartment. Even if all the lysosomes are newly formed each hour (which is unlikely), pinocytosis brings in 1,535 tzm z of surface and 102 ~m s of fluid into a lysosomal space having an area of 150 ~m 2 and a volume of 10 ~m s. Whereas solute (HRP) is accumulating continuously (Fig. 9), the data indicate that mem- brane and fluid must rapidly leave the lysosome compartment.
A
o G
B iv 3' G
-r O0 --~- ~ - - - - - i I i i i i
.
0 10 20 30 40 50 60 120
M i n u t e s in HRP
FIGURE l0 The kinetics of appearance of HRP reactive pinocytic vesicles (x-- -x) and secondary lysosomes (O---O) after varying periods in enzyme. The number (A), volume (B), and area (C) of reactive pinocytic vesicles plateaus after 5 rain in enzyme, while the lysosome compartment takes 45 min to fill. Though not shown here, the plateau values persist after 3 h in HRP as well.
STEINMAN, BRODIE, AND COHN Membrane Flow during Pinocytosis 677
Dow
nloaded from http://rupress.org/jcb/article-pdf/68/3/665/1402202/665.pdf by guest on 04 February 2022

TABLE V
Pulse Chase of HRP in Macrophages
15 rain in HRP, then < 60 min continuous H R P 45 rain without HRP
HRP reactive pinocytic vesicles Number/~m 2 cell section
Relative surface are (% cell)
Relative volume (% cell) HRP reactive secondary lysosomes
Number/,m 2 cell section
0.208 0.004
12.1 0.7
2.65 0.3
0.563 0.541
Relative surface area (% cell)
Relative volume (% cell)
15.7 13.6
2.53 2.38
Stereologic analysis of cells exposed continuously to 1 mg/ml HRP (60 min) or to a 15 min pulse followed by a 45 min chase. The chase greatly diminishes the number of HRP-reactive pinocytic vesicles, but has little effect on the reactive secondary lysosome compartment.
Stereologic Analysis of Pinocytosis in L Cells
The stereoiogic findings on HRP-reactive vacu- oles were qualitatively similar in both L cells and macrophages. Incoming L cell pinocytic vesicles were identified by their peripheral rim of cyto- chemical reactivity, and secondary lysosomes by their dense content (41 and Fig. 11). Pinocytic vesicles were spherical in shape, and again, coated vesicles were devoid of HRP (Fig. 12). The frequency distribution of sectioned vesicle diame- ters was similar to that seen in macrophages, except that large profiles (0.5 , m or more in diameter) were rare (Fig. 13), The average vesicle diameter, area, and volume are 0.20 ,m, 0.16 #m 2, and 0.0085 ~m s (Table IV).
The volume and surface area of HRP reactive pinocytic vesicles and secondary lysosomes were measured with a test grid in cells exposed for varying times to 1 mg/ml HRP (Table VI). The initial rate of expansion of the pinocytic vesicle space was 0.05% of the cell volume/min, which is 0.9 #mS/min for cells having a volume of 1,765 , m s (Table I). This rate is similar to that predicted from the level of HRP solute uptake (41), i,e., cells take up 0.11 ng HRP/#g cell protein/h from a 1 mg/ml solution. At this stage of growth, 1 /~g of protein corresponds to 2.2 • 108 cells, so that the fluid uptake per cell per min by this method is 0.8 um 8. The rate of interiorization of pinocytic vesicle surface corresponds to 0.8% of the cell surface/ min or 1,100 #m2/h. The average L cell forms 100
vesicles per minute. This value times the average vesicle area and volume (Table IV) gives fractional areas and volumes identical to that obtained with a test grid.
HRP-reactive secondary lysosomes first ap- peared in L cells after a 5-min exposure to HRP. Their number, area, and volume then increased progressively with time (Table VI), We did not attempt to establish that these values reach a maximum after I h, as they do in macrophagcs. However, the dimensions of the lysosomal com- partment are again much smaller than that ,vhich apparently enters the cell in pinocytic vesicles. After 1 h, pinocytosis brings in 54 ~m s of fluid and 1,100 t~m 2 of surface area, but the corresponding dimensions of the vacuolar system (pinocytic vesi- cles and secondary lysosomes) are just 20 , m s and 220 ,mL
DISCUSSION
HRP as a Marker for the Stereologic Analy-
sis of the Vacuolar System
In previous studies (40, 41), we have used HRP as a marker to follow the uptake and fate of solutes in the vacuolar system of cultivated mouse macro- phages and L cells. In this paper, we employ the same marker to obtain quantitative data on the uptake and fate of the fluid and surrounding membrane of pinocytic vesicles. The suitability of HRP for this sort of work derives from two
6'78 THE JOURNAL OF CELL BIOLOGY �9 VOLUME 68, 1976
Dow
nloaded from http://rupress.org/jcb/article-pdf/68/3/665/1402202/665.pdf by guest on 04 February 2022

features of the Graham and Karnovsky DAB technique used to localize intraceilular enzyme (24).
(a) Under appropriate conditions, the cyto- chemical procedure detects all pinocytic vesicles containing HRP. The best evidence was as follows. Since HRP is taken up as a solute in the fluid
phase (40, 41), we could use our previous quantita- tive data on enzyme uptake to predict the rate at which the pinocytic vesicle space would expand. Thus the volume of fluid interiorized is the amount of solute taken in, divided by the concentration of solute in the fluid phase. These values are 1.2 pmS/macrophage/min and 0.8 ,mS/L cell/min.
FIGURE 11 An L cell exposed 15 min to 1 mg/ml HRP contains pinocytic vesicles of varying diameter (long arrows) and secondary lysosomes (short arrows), x 14,000.
FIGURE 12 Coated vesicles (*) in L cells also do not contain HRP whereas smooth surfaced ones do (arrows). x 31,500.
STEINMAN, BRODIE, AND COHN Membrane Flow during Pinocytosis 679
Dow
nloaded from http://rupress.org/jcb/article-pdf/68/3/665/1402202/665.pdf by guest on 04 February 2022

Direct measurement, by point counting, of speci- mens pulsed for brief periods with HRP showed that the rate of expansion of the HRP-reactive pinocytic vesicle space was in fact 1.7 and 0.9 gmS/min for macrophages and L cells, respec- tively. In macrophages, the somewhat higher value obtained with the stereologic method may be in error, e.g., a small error in the cell diameter measurement would produce a large error in the result; or incoming HRP-containing vesicles may fuse with preexisting HRP-negative ones, produc-
4 0 -
3 0 -
c 20- ~0
~0
u_ lo-
!
O 0.2 0.4 0.6 OB I
Sectioned diameter of pinocyt ic vesicle (,urn)
FI6URE I3 Frequency distribution of profile diameters of L cell pinocytic vesicles formed after 1 and 5 min exposures to HRP. The histogram is similar to that seen in macrophages (Fig. 7) except that large profiles (0.5 vm or more) are rare.
ing a misleading larger, reactive vacuole; or cells may shrink during fixation.
Further evidence that the DAB procedure was fully sensitive was the observation that increasing the concentration of HRP in the fluid phase beyond 0.5 mg/ml (to 1.0 and 2.0 mg/ml) did not alter the detectability of reactive pinocytic vesicles, even though the amount of enzyme in these vesicles increases linearly with increasing concentration of HRP in the culture fluid (40, 41). The cytochemi- cal reaction therefore behaves as if it is saturated with enzyme at the concentration of 1 mg/ml employed in this work.
(b) The distribution of reaction product within HRP-containing vacuoles enabled us to distin- guish whether that vacuole had undergone fusion with preexisting lysosomes to form a secondary lysosome. In the macrophages and L cells we studied, newly arising pinocytic vesicles exhibit reaction product peripherally along the inner as- pect of the surrounding membrane, while HRP- containing, secondary lysosomes have a uniform dense content of reaction product. This distinction was made first on the basis of kinetic studies. Ves- icles with peripheral reactivity were the only positive vacuoles found after brief exposures (5 rain or less) to HRP, and quickly became nonreactive when the cells were placed in HRP- free medium. In addition, double-label experi- ments demonstrated that the presumptive second- ary lysosomes were the only HRP-reactive vacu-
TABLE VI
Stereologic Analysis of L-Cell Vacuoles
Time in 1 mg/ml HRP (min)
Parameter 1 5 10 15 60
No. vacuoles//~m ~ cell section Pinocytic vesicles 0.017 0.078 0 . 0 8 7 0.100 0.089 Secondary lysosomes 0.000 0.001 0 . 0 3 0 0.052 0.217
Fractional vacuole volume (% cell volume) Pinocytic vesicles Secondary lysosomes
Relative vacuole surface area (% cell surface area) Pinocytic vesicles Secondary lysosomes
0.05 0.25 0.33 0.34 0.32 0 .~ 0 .~ 0.11 0.33 0.89
0.8 4.5 4.4 4.1 4.0 0,0 0.2 2.2 3.0 6.5
Growing L-cell monolayers were exposed to 1 mg/ml HRP for varying times. Three specimens from each culture were examined by stereologic techniques. The cells in all cultures had identical volumes and surface area. Pinocytic vesicles were identified by their peripheral rim of cytocbemical reactivity while secondary lysosomes were replete with reaction product.
680 THE JOURNAL OF CELL BIOLOGY �9 VOLUME 68, 1976
Dow
nloaded from http://rupress.org/jcb/article-pdf/68/3/665/1402202/665.pdf by guest on 04 February 2022
oles containing colloidal thorium dioxide, another secondary lysosome marker. We are not certain why the cytochemical reaction produced such a different distribution of reaction product in the history of a pinocytic vesicle. We suspect that HRP within incoming vesicles becomes bound to the surrounding membrane during fixation and that reaction product does not diffuse far from this site. In contrast, HRP may become distributed throughout the content of fixed secondary lyso- somes, either because its concentration is so high due to vacuolar shrinkage (see below), or because the enzyme binds to the internal content of the vacuole during fixation.
Another important advantage of the system we have studied is that HRP does not alter the ongoing pinocytic activity of cultured cells. We detect no obvious morphologic changes after HRP administration, and the uptake of other soluble markers is not changed by exposure to the enzyme (41 and this study). The cells we have chosen to study are themselves quite stable in that they pinocytose HRP at similar rates for several days in vitro, and are capable of degrading it with similar kinetics at all times.
The Dimensions of Pinocytic Vesicles
The first application of HRP as a marker solute was to identify the incoming vesicle. One possible difficulty with previous morphologic studies was that the marker employed was either bound to the cell membrane, as in the case of colloids that absorb to the cell surface, or was not cleared from the extraeellular space. In both circumstances, the marker may appear to be in an intracellular vesicle but, in fact, may lie in a surface invagination. Because HRP is not absorbed to the cell surface, cytochemically reactive vesicles in washed cul- tivated oells must be pinocytic in origin.
Using HRP as a marker, we found that incom- ing vesicles were spherical in shape and exhibited a continuous range of diameters. In macrophages, the range was 0.05-1/~m, while in L cells, vesicles larger than 0.5 ~m were rare. Many if not all of the large vesicles in macrophages may be the result of fusion of vesicles of smaller sizes. The continuous spectrum of vesicle diameters argues against the presence of two distinct classes of incoming pino- cytic vesicles (4, 53), corresponding to so-called micro (about 1,000 A in diameter) and macro (visible by light microscopy) pinocytosis. We also could not show that coated vesicles, i.e., 0.1 ~m
vesicles exhibiting bristles or spokes on the cyto- plasmic aspect of their limiting membrane, were involved in the pinocytosis of HRP. These vesicles were first noted to be abundant in cells interioriz- ing large amounts of protein (37) and appeared to be involved in the uptake of exogenous tracers (22). Conceivably, coated vesicles have an en- docytic role in macrophages and L cells, but we could not detect it. For example, what appears to be a coated vesicle in section may be in the process of invagination, so that HRP was simply washed away before fixation. Another possibility is that these vesicles may lose their coating shortly after interiorization, during 15-30 s it took to initiate fixation. It is possible, however, that coated vesi- cles serve other functions than fluid-phase pinocy- tosis in cultivated cells, e.g., they could have a secretory function, or they may be involved in the recycling of pinocytosed membrane (see below).
The Influx of Pinocytic Vesicle Fluid and
Membrane
A striking feature of pinocytic vesicles is the large amounts of fluid and membrane which they bring into the cell. By direct stereologic measure- ments, we find that each hour, macrophages and L cells interiorize the equivalent of 26% and 3% of their cell volume, and 190% and 48% of their surface area, respectively. These fractional influxes can be converted to absolute levels of fluid and membrane interiorization if the cell volume is known. At this time, we cannot measure the volume of monolayer cells directly, and so our data derive from cells removed from the monolayer. We have confirmed that the stereologic findings for L cell monolayers apply as well to L cells given HRP in suspension cultures (our unpublished data).
Lewis (33) in his initial description of pinocyto- sis in cultivated mammalian cells, pointed out that macrophages may take in one-third their volume each hour (though the cell volume data on which the estimate was based seem implausible). The dimensions of the pinocytic vesicle compartment relative to those of the whole cell were not subsequently appreciated except for the work of Bowers and Oiszewski in Acanthamoeba Castellanii (3). These authors measured the rate of pinocytic fluid uptake. They then estimated that the equivalent of 5-50 times the organism's sur- face area was interiorized, depending on the actual size of the incoming vesicle and assuming the amoeba had a smooth surface.
STEINMAN, BRODIE, A~D COHN Membrane Flow during Pinocytosis 681
Dow
nloaded from http://rupress.org/jcb/article-pdf/68/3/665/1402202/665.pdf by guest on 04 February 2022

With respect to the high rate of fluid and solute influx during pinocytosis, Lewis stated, "The im- portance of this phenomenon in cellular metabo- lism and in the economy of intercellular fluids is almost self-evident (33). " But the relevance of a high fluid and solute influx to the cellular economy is far from obvious. The current view is that most cells are capable of transporting fluid, electrolytes, and small molecular weight nutrients by efficient transport systems operating at the cell surface. Pinocytosis of fluid and solutes would therefore seem redundant. When macromolecular solutes are interiorized, they too are digested to small molecular weight components in the lysosomal space (8, 15, 16, 17, 40). It is likely that the electrolyte composition of vesicle fluid, being a sample of the extracellular fluid, contains high concentrations of the very ions the cell is actively (i.e., spending metabolic energy) trying to exclude, such as sodium and calcium. It is therefore not clear yet in what way the content of the pinocytic vesicle is required for cellular function.
The function of the high rate of membrane interiorization during pinocytosis is also uncertain. It would allow for a rapid uptake of anything binding to the cell surface. This in turn may be important in removing certain ligands from the extracellular space, in terminating signals gener- ated by ligands at the cell surface, or simply in enhancing the uptake and delivery of certain materials, e.g., vitamins and hormones bound to macromolecular carriers. Adsorptive pinocytosis is a much more efficient method of solute uptake when compared to fluid-phase pinocytosis, espe- cially at low concentrations of ligand (e.g., 31, 46}. For example, 1,000,000 macrophages interiorize about 1/10,000th of an administered solute con- centration/hour by fluid-phase pinocytosis. If a receptor exists and it binds 1% of the administered solute concentration, then membrane interioriza- tion would bring in 2/100 of the administered load, since twice the cell surface enters in this time.
At issue here is the composition of the vesicle membrane in relation to the plasma membrane from which it derives. Is the entering membrane a representative or a selective sample of the plasma membrane? The latter possibility has been raised by studies in lymphocytes where the binding of appropriate ligands, like anti-immunoglobulin rea- gents, leads to pinocytosis of the surface-binding site for the ligand (immunoglobulin) without alter- ing the expression of other binding sites, e.g.,
histocompatibility antigens (43). The question of bulk vs. selective uptake of plasma membrane during endocytosis has only been studied in rela- tion to phagocytosis. Werb and Cohn (51) ob- tained evidence that the uptake of a certain area of plasma membrane around latex spheres was asso- ciated with an equivalent uptake of macrophage surface components like 5'-nucleotidase activity, cholesterol, and phospholipid. Hubbard and Cohn (30} radio-iodinated the surface of L cells and then compared the iodinated polypeptides of plasma membrane with that interiorized around latex phagolysosomes. Again the interiorized membrane was representative of the cell surface. In contrast, Tsan and Berlin (44) used purine and amino acid transport sites as plasma membrane markers and found that these sites were apparently excluded from the phagocytic vesicle. Nothing, however, is known about the makeup of pinocytic vesicle membrane. The HRP model does suggest at least two approaches to this problem. One is to try to separate pinocytic vesicles from plasma membrane by cell fractionation, using HRP as a specific biochemical and morphoiogic marker for the for- mer. Another is to compare the rate at which defined membrane components enter the cell, relative to the rates of plasma membrane interiori- zation predicted by the stereologic analysis of HRP-reactive pinocytic vesicles.
The Secondary L ysosome Compartment
Previous studies indicated that all the HRP pinocytosed by macrophages and L cells entered the secondary lysosome compartment (40, 41). By cytochemistry, all cell-bound enzyme was con- tained within membrane-bound granules having a dense content of reaction product. More impor- tant, all cell-bound HRP was inactivated and degraded with first order kinetics, suggesting that it was being handled by a single degradative compartment. In this study, we found that cyto- chemically reactive HRP fills the entire secondary lysosome space. It begins to enter the compart- ment within 5 min of administration and gradually fills it up over another hour. Additional HRP exposure, though it results in further accumulation of HRP solute, does not expand the cytochemi- cally reactive space. Also if HRP is given for 15 min and then the ceils are chased for 45 min in enzyme-free medium, the dimensions of reactive lysosomes are similar to those of cells given HRP continuously for 1 h. We conclude that HRP can
652 TRE JOURNAL OF CELL BIOLOGY �9 VOLUME 68, 1976
Dow
nloaded from http://rupress.org/jcb/article-pdf/68/3/665/1402202/665.pdf by guest on 04 February 2022

be used to identify the entire existing lysosome compartment of cultivated cells.
The macrophages we studied had some 1,100 secondary lysosomes, most small in size. 92% had a diameter of less than 0.3 um and thus could not be visualized in light microscope preparations. The lysosomes occupy some 2.5% of the cell volume and their surface area is 18% that of the cell. There may be another way of estimating the surface area of the lysosome space. Werb and Cohn (50) found that cultivated macrophages exchange radiola- beled cholesterol with serum lipoprotein carriers present in the culture medium. The cell-bound cholesterol is partitioned in two exchangeable pools: a rapidly exchanging compartment corre- sponding to the plasma membrane, and a more slowly exchanging one which includes secondary lysosomes and possibly pinocytic vesicles as well. For cells cultivated in newborn calf serum, the rapid pool has twice the cholesterol as the slow. If the surface density of cholesterol in the two exchangeable compartments is similar, then the data indicate that the area of plasma membrane is about two times that of intracellular vacuoles. For our cells maintained in FCS, the stereologic ap- proach showed that the cell surface area was three times the area of its vacuolar system. It is to be emphasized here that the vacuolar system is ex- tremely sensitive to environmental conditions. Macrophages can greatly expand the lysosomal compartment by cultivation in newborn calf serum (7), by administration of nondigestible materials (e.g., 50), or by phagocytosis of particulates (e.g., 50). Relatively speaking, the cells cultivated in fetal calf serum exhibit a small lysosomai space.
The Fate o f Pinocytosed Fluid
Our other unusual set of findings relates to the fate of pinocytic vesicles in the ceil. In essence, we noted that pinocytosis in macrophages brings in the equivalent of 26% of the cell volume and 190% of the cell surface area each hour, but that incoming vesicles then fuse with a secondary lysosome compartment which at all times repre- sents just 2.5% of the cell volume and 18% of the cell surface area. Similar qualitative data were obtained with L cells though we did not establish that we had saturated the lysosome space. Thus, pinocytosis brings in as much as 10 times more fluid and membrane than can be accounted for in the secondary lysosome space.
We postulate that interiorized vesicle fluid must
rapidly egress from the vacuolar system, and then from the cell itself. This egress must be very rapid. We observed that incoming HRP fills the pinocytic vesicle space within 5 min and that the latter does not expand further even though pinocytosis is preceeding continuously. Therefore, after a short- life span, fluid must leave the pinocytic vesicle compartment as fast as it is entering. The mecha- nism for this rapid efflux is unknown. We doubt that it is simply returned in a vesicular form to the extracellular environment. A priori this would make little sense, and we have quantitative and stereologic data that the initial rate of HRP uptake, during the first minutes before detectable lysosomal fusion, persists during the period in which incoming vesicles are fusing and apparently shrinking down in size. We also know that pinocy- tosed markers, like HRP (40, 41), inulin (Z. A. Cohn, unpublished observations), and colloidal gold (7) are not regurgitated into the culture medium once they are in the secondary lysosome pool; and there is no evidence that the acid hydrolases of lysosomes are exocytosed in large amounts under the culture conditions we utilized (e.g., 23).
More likely, interiorized fluid is lost by shifts across the newly forming secondary lysosomr membrane and then from the cell itself. It is difficult to predict a mechanism for such shifts, but several observations should be kept in mind. Edelson and Cohn (14) noted that treatment of macrophages with con A resulted in the production of pinocytic vesicles that could not fuse normally with secondary lysosomes. The cells accumulate large numbers of large pinocytic vesicles, implying that lysosome fusion is required before incoming vesicles begin to shrink. Another fact is that the secondary lysosomes of cultivated mouse macro- phages (8, 17) and human flbroblasts (38) are permeable to a variety of small hydrophilic solutes, e.g., amino acids and saccharides, but are im- permeable to larger solutes. The vacuolar space swells dramatically if cells interiorize large solutes, e.g., oligosaccharides and peptides, for which they lack degradative enzymes: This could mean that fluid moves into the vacuole because of a high intravacuolar osmotic pressure, or that a normal efflux of fluid towards a high cytoplasmic osmotic pressure is counterbalanced by the presence of indigestible solute. In any case, the vacuolar mem- brane behaves as a semipermeable one. Fluid shifts across a semipermeable membrane may be initi-
STEINMAN, BRODIE, AND COHN Membrane Flow during Pinocytosis 683
Dow
nloaded from http://rupress.org/jcb/article-pdf/68/3/665/1402202/665.pdf by guest on 04 February 2022
ated by many factors. Conceivably, the lysosome delivers macromolecular ions into the pinocytic vesicle which form complexes capable of reducing the osmotic pressure of the newly formed second- ary lysosome, a mechanism which has been pro- posed for the condensation of secretory vacuoles (42). Or the incoming vesicle membrane may be considerably altered after fusion with lysosomes. The studies of Henning and associates (25, 26, 32), have poi.nted to differences in the lipid, polypep- tide, and enzymatic composition between mem- branes of liver secondary lysosomes (loaded with Trition) and plasma membrane. In addition, the lysosome contents such as acid and enzymes may be capable of altering the composition or organiza- tion of the incoming vesicle membrane; e.g., Hubbard and Cohn demonstrated that iodinated plasma membrane polypeptides were rapidly de- graded when trapped in a latex phagolysosome (30). One plasma membrane activity that may be relevant here is the ability to actively exclude certain salts from the cytoplasm. If this is inacti- vated after secondary lysosome formation, a salt flux from vacuole into cytoplasm may ensue. By analogy with transepithelial salt and water systems (10, 12), such differences in the secondary lyso- some membrane relative to the plasma membrane may allow for the bulk movement of salt and water through the cytoplasm and out of the cell, even though the pinocytosed droplet of fluid and the culture medium are initially identical in solute composition.
The Fate of Interiorized Membrane
The fate of the large amounts of interiorized vesicle membrane after fusion with lysosomes is also unclear. We doubt, however, that it is signifi- cantly degraded within the lysosome, for this would lead to a high rate of plasma membrane turnover, i.e., twice the macrophage surface and one-half the L cell surface each hour. What little is known about membrane turnover in cultivated cells suggests that components are replaced at very slow rates. Warren and Glick noted that reutiliza- ble amino acid and sugar precursors incorporated into the plasma membrane of growing L ceils turned over at negliglible rates (48). Hubbard and Cohn (30) found that L cell plasma membrane proteins, tagged with a nonreutilizable radioiodine label, were degraded to amino acids at a rate of only 2% per hour., although these labeled compo- nents were degraded much more rapidly when
interiorized membrane was trapped around an indigestible latex particle. Devreotes and Fam- brough (11) likewise noted that the acetylcholine receptor of developing muscle cells in vitro turned over with a t one-half of some 22 h. Although none of these studies established that membrane turn- over occurs via pinocytosis, the existing data do state that turnover by any means is much slower than if all pinocytosed membrane were degraded within lysosomes, It is still possible that some components of the interiorized membrane, not tagged by the above labels, are degraded at rapid rates as a result of pinocytosis.
If interiorized membrane were degraded by lysosomes, it would also follow that cells must be capable of resynthesizing membrane components at rapid rates. Macrophages do not appear to be capable of such rapid synthesis. For example, trapping of large amounts of plasma membrane in latex phagolysosomes results in the interiorization of surface 5'-nucleotidase activity, cholesterol, and phospholipid (51). These components are replaced by processes involving new protein synthesis, but only after a 6 h lag period. Although we know little about the rates and mechanisms for cell membrane formation, the suggestion at this time is that cells could not immediately replenish the large amounts of membrane that would be lost if pinocytosed membranes were completely degraded in lyso- somes.
Recycling of Pinocytosed Membrane
The most likely explanation of our data on the uptake and fate of incoming pinocytic vesicle membrane is that it is recycled back to the cell surface after shrinkage of the newly formed sec- ondary lysosome. During such recycling, non- permeable solutes like HRP, and acid hydrolases themselves probably are not regurgitated into the extracellular space nor leaked into the cytoplasm in significant amounts. A plausible morphologic mechanism for membrane recycling is that it involves the production of tiny vesicles capable of returning large amounts of surface membrane, with very little content, to the cell surface. Such tiny vesicles are abundant in the Golgi region, where many of the events being discussed, i.e., secondary lysosome formation and shrinkage, are taking place. Sometimes large numbers of tiny vesicles are found in association with larger pre- sumptive pinocytic vesicles (29). Previously these images were assumed to represent vesicles about to
684 THE JOURNAL OF CELL BIOLOGY�9 VOLUME 68, 1976
Dow
nloaded from http://rupress.org/jcb/article-pdf/68/3/665/1402202/665.pdf by guest on 04 February 2022

fuse with the pinocytic vesicle rather than vesicles that were being pinched off from it. Perhaps coated vesicles are specialized for cell membrane assembly, as has previously been suggested (21, 39). These possibilities are quite speculative, and it is possible that membrane recycling proceeds by a nonvesicular mechanism.
The idea of membrane recycling via pinocytosis has occurred in many studies of secretion of membrane-bound materials. For example, in neu- rohypophysis (13), anterior pituitary (20), adrenal medulla (1), peripheral nerve terminals (5, 27), and islet cells (36), it has been suggested that mem- brane components delivered to the cell surface during the exocytosis of the secretory granule are retrieved by the cell through a burst of pinocytic activity. This hypothesis has not been tested quan- titatively, but a stereologic analysis with H R P migh be a useful means of doing so. L cells have long been employed as models for the study of connective tissue matrix secretion, and it has recently become apparent that macrophages are capable of secretory activity as well (23, 45). Identification of the presumptive secretory drop- lets in these cells is not yet possible in routine sections so that we cannot verify whether the surface area associated with the secretory process is similar to that involved in pinocytic vesicle formation.
Our current studies are directed to finding other quantitative approaches for verifying the main implications of this study, viz, that during pinocy- tosis, a substantial proportion of the cell surface flows into the cell, through the vacuolar system, and then back to the cell surface.
The authors thank Judy Adams for excellent assistance with the electron microscopy.
This work was supported by grants AI 07012 and AI 01831 from the U.S. Public Health Service. Dr. Stein- man is a Scholar of The Leukemia Society of America.
Received for publication 13 August 1975, and in revised form 17 November 1975.
R E F E R E N C E S
1. ABRAHAMS, S. J., and E. HOLTZMAN. 1973. Secre- tion and endocytosis in insulin-stimulated rat adre- nal medulla. J. Cell Biol. 56:540-558.
2. BERNHARD, W., and S. AVRAMEAS. 1971. Ultrastruc- tural visualization of cellular carbohydrate compo- nents by means of concanavalin A. Exp. Cell Res. 64:232 236.
3. BOWERS, B., and T. E. OLSZEWSKL 1972. Pinocyto- sis in Acanthamoeba Castellanii, Kinetics and Mor- phology. J. Cell Biol. 53:681-694.
4. CASLEY-SMITH, J. R. 1969. Endocytosis: the differ- ent energy requirements for the uptake of particles by small and large vesicles into peritoneal macro- phages. J. M icrosc. ( Ox f . ). 90:15-30.
5. CECCARELLI, B., W. P. HURLBUT, and A. MAURO. 1972. Depletion of vesicles from frog neuromuscular
junctions by prolonged tetanic stimulation. J. Cell Biol. 54:30-38.
6. COHN, Z. A., and B. BI~NSON. 1965. The differentia- tion of mononuclear phagocytes. Morphology, cyto- chemistry, and biochemistry, J. Exp. Med. 121:153-170.
7. COHN, Z. A., and B. BENSON. 1965. The in vitro differentiation of mononuclear phagocytes. I I I. The reversibility of granule and hydrolytic enzyme for- mation and the turnover of granule constituents. J. Exp. Med. 122:455-466.
8. COHN, Z. A., and B. A. EnRENREICH. 1969. The uptake, storage, and intracellular hydrolysis of car- bohydrates by macrophages. J. Exp. Med. 129:201-225.
9. Cons, Z. A., M. E. FEDORKO, and J. G. HIRSCH. 1966. The in vitro differentiation of mononuclear phagocytes. V. The formation of macrophage lyso- somes. J. Exp. Med. 123:757-766.
10. CURRAN, P. F., and J. R. MACINTOSH. 1962. A model system for biological transport. Nature (Lond.). 193:347-348.
11. DEVREOT~S, P. N., and D. M. FAMBROU~H. 1975. Acetylcholine receptor turnover in membranes of developing muscle fibers. J. Cell Biol. 65:335-358.
12. DIAMOND, J. M. 1964. The mechanism of isotonic water transport. J. Gen. Physiol. 48:15-42.
13. DOUGLAS, W. W., and J. NAGASAWA. 1971. Mem- brane vesiculation at sites of exocytosis in the neurohypophysis, adenohypophysis and adrenal me- dulla: a device for membrane conservation. J. Phys- iol. (Lond.). 218:94-95.
14. EDELSON, P. J., and Z. A. COHN. 1974. Effects of concanavalin A on mouse peritoneal macrophages. I. Stimulation of endocytic activity and inhibition of phago-lysosome formation. J. Exp. Med. 140:1364-1386.
15. EHRENREICH, B. A., and Z. A. COHN. 1967. The uptake and digestion of iodinated human serum albumin by macrophages in vitro. J. Exp. Med. 126:941-958.
16. EHRENREICH, B. A., and Z. A. CONN. 1968. Fate of hemoglobin pinocytosed by macrophages in vitro. J. Cell Biol. 38:244-248.
17. EHRENREICn, B. A., and Z. A. CONN. 1969. The fate of peptides pinocytosed by macrophages in vitro. J. Exp. Med. 129:227-245.
18. ELIAS, H. 1954. Contributions to the geometry of sectioning. III. Spheres in masses. Z. Wiss. Mik-
STE|NMAN, BRODm, AND COHN Membrane Flow during Pinocytosis 685
Dow
nloaded from http://rupress.org/jcb/article-pdf/68/3/665/1402202/665.pdf by guest on 04 February 2022

rosk. Mikrosk. Tech. 62:32-40. 19. ELIAS, H., A. HENNIG, and D. E. SCHWARTZ. 1971.
Stereology: applications to biomedical research. Physiol. Rev. 51:158-200.
20. FARQUHAR, M. G., E. H. SKUTELSKY, and C. R. HOPKINS. 1975. Structure and function of the ante- rior pituitary and dispersed pituitary cells. In vitro studies. In The Anterior Pituitary. A. Tixier-Vidal and M. G. Farquhar, editors. Academic Press, Inc., New York. 83-135.
21. FRANKE, W. W., and W. HERTH. 1974. Morphologi- cal evidence for de novo formation of plasma membrane from coated vesicles in exponentially growing cultured plant cells. Exp. Cell Res. 89:447 -451.
22. FRIEND, D. S., and M. G. FARQUHAR. 1967. Func- tions of coated vesicles during protein absorption in the rat vas deferens. J. Cell Biol. 35:357-376.
23. GORDON, S., J. TODD, and Z. A. CONN. 1974. In vitro synthesis and secretion of lysozyme by mono- nuclear phagocytes. J. Exp. Med. 139:1228-1248.
24. GRAHAM, R. C., JR., and M. J. KARNOVSKY. 1966. The early stages of absorption of injected horserad- ish peroxidase in the proximal tubules of mouse kidney: ultrastructural cytochemistry by a new tech- nique. J. Histochem. Cytochem. 14:291-302.
25. HENNING, R., H. D. KAULEN, and W. STOEFEL. 1970. Isolation and chemical composition of the lysosomal and the plasma membrane of the rat liver cell. Hoppe-Seyler's Z. Physiol. Chem. 351:1191- 1199.
26. HENNING, R., and W. STOEFEL. 1973. Glycosphin- golipids in lysosomal membranes. Hoppe-Seyler's Z. Physiol. Chem. 354:760-770.
27. HEUSER, J. E., and T. S. REESE. 1973. Evidence for recycling of synaptic vesicle membrane during trans- mitter release at the frog neuromuscular junction. J. Cell Biol. 57:315-344.
28. HIRSCH, J. G., and M. E. FEDORKO. 1968. Ultra- structure of human leukocytes after simultaneous fixation with glutaraldehydr and osmium tetroxide and "postfixation" in uranyl acetate. J. Cell Biol. 38:615-627.
29. HIRSCH, J. G., M. E. FEDORKO, and Z. A. COHN. 1968. Vesicle fusion and formation at the surface of pinocytic vacuoles in macrophages. J. Cell Biol. 38:629-632.
30. HUBBARD, A. U, and Z. A. COHN. 1975. Externally disposed plasma membrane proteins. If. Metabolic fate of iodinated polypcptides of mouse L cells. J. Cell Biol. 64:461-479.
31. JACQUES, P. J. 1969. Endocytosis. In Lysosomes in Biology and Pathology. J. T. Dingle and H. B. Fell, editors. Noord-Hollandsche Uitg. Mij., Amsterdam. 2:395-420.
32. KAULEN, H. D., R. HENNING, and W. STOFFEL. 1970. Comparison of some enzymes of the lysosomal
and the plasma membrane of the rat liver cell. Hoppe-Seyler's Z. Physiol. Chem. 351:1555-1563.
33. LEWlS, W. H. 1931. Pinocytosis. Bull. Johns Hop- kins Hosp. 49:17-36.
34. LOUD, A. V. 1968. A quantitative stereological description of the ultrastructure of normal rat liver parenchymat cells. J. Cell Biol. 37:27-46.
35. LOWRy, O. H., N. J. ROSEBROUGH, A. L. FARR, and P. J. RANDALL. 1951. Protein measurement with the Folin phenol reagent. J. Biol. Chem. 193:265-275.
36. Otcl , L., F. MALAISSE-LAGAE, M. RAVAZZOLA, M. AMHERDT, and A. E. RENOLD. 1973. Exocytosis- endocytosis coupling in the pancreatic beta ceil. Science (Wash, D. C.). 181:561-562.
37. ROT8, T. F., and K. R. PORTER. 1964. Yolk pro- rein uptake in the oocyte of the mosquito Aedes aegypti. L. J. Cell Biol. 20:313-332.
38. SCHULMAN, J. D., and K. H. BRADLEY. 1970. The metabolism of amino acids, pcptides, and disulfides in lysosomes of fibroblasts cultured from normal individuals and those with cytinosis. J. Exp. Med. 132:1090-1104.
39. SHEFFIELD, J. B. 1970. Studies on aggregation of embryonic cells: initial call adhesions and the forma- tion of intercellular junctions. J. Morphol. 132:245-263.
40. STEINMAN, R. M., and Z. A. COHN. 1972. The interaction of soluble horseradish peroxidase with mouse peritoneal macrophages in vitro. J. Cell Biol. 55:186-204.
41. STEINMAN, R. M., J. M. SILVER, and Z. A. COHN. 1974. Pinocytosis in fibroblasts. Quantitative studies in vitro. J. Cell Biol. 63:949-969.
42. TARTAKOFF, A. L., L. J. GREEN, and G. E. PALADE. 1974. Studies on the guinea pancreas. Its fraction- ation and partial characterization of exocrine pro- teins. J. Biol. Chem. 249:7420-7431.
43. TAYLOR, R. B., W. P. H. DUFFUS, M. C. RAFF, and S. DE PETRIS. 1971. Redistribution and pinocytosis of lymphocyte surface immunoglobulin molecules induced by anti-immunoglobulin antibody. Nat. New Biol. 233:225-229.
44. TSAN, M. F., and R. D. BERLIN. 1971. Effect of phagocytosis on membrane transport of nonelec- trolytes. J. Exp. Med. 134:1016-1035.
45. UNKELESS, J. C., S. GORDON, and E. REICH. 1974. Secretion of plasminogen activator by stimulated macrophages. J. Exp. Med. 139:834-850.
46. VON FIGURA, K., and H. KRESSE. 1974. Quantitative aspects of pinocytosis and the intracallular fate of N-acatyl-a-D-glucosaminidase in Sanfilipo B fibro- blasts. J. Clin. Invest. 53:85-90.
47. WAGNER, R., M. ROSENBERG, R. ESTENSEN. 1971. Endocytosis in Chang liver cells. Quantitation by sucrose-Nil uptake and inhibition by cytochalasin B. J. Cell Biol. 50:804-817.
48. WARREN, L., and M. C. GLICK. 1968. Membranes of
686 THE JOURNAL OF CELL BIOLOGY �9 VOLUME 68, 1976
Dow
nloaded from http://rupress.org/jcb/article-pdf/68/3/665/1402202/665.pdf by guest on 04 February 2022
animal ceils. 11. The metabolism and turnover of the surface membrane. J. Cell Biol. 37:729-746.
49. WE1BEL, E. R., and R. P. BOLEN~ER. 1973. Stereo- logical techniques for electron microscopy. In Prin- ciples and Techniques of Electron Microscopy. M. A. Hayat, editor. Van Nostrand-Reinhold, N.Y. 3:237.
50. WERB, Z., and Z. A. COHN. 1971. Cholesterol metabolism in the macrophage. II. Alteration of subeeUular exchangeable cholesterol compartments and exchange in other cell types. J. Exp. Med. 134:1570-1590.
51. WERB, Z., and Z. A. COHN. 1972. Plasma membrane synthesis in the macrophage following phagocytosis of polystyrene latex particles. J. Biol. Chem. 247:2439-2446.
52. WICKSELL, S. D. 1925. The corpuscle problem. A mathematical study of a biometric problem. Bioraetrika. 17:84-91.
53. WILLS, E. J., P. DAVXES, A. C. ALLISON, and A. D. HASWELL. 1972. Cytochalasin B fails to inhibit pinocytosis by macrophages. Nat. New Biol. 240:58-60.
STEINMAN, BRODIE, AND COHN Membrane Flow during Pinocytosis 687
Dow
nloaded from http://rupress.org/jcb/article-pdf/68/3/665/1402202/665.pdf by guest on 04 February 2022


![Lecture 17 Membrane separations - CHERIC · Lecture 17. Membrane Separations [Ch. 14] •Membrane Separation •Membrane Materials •Membrane Modules •Transport in Membranes-Bulk](https://img.dokumen.tips/doc/110x75/5e688f368fbb145949438f76/lecture-17-membrane-separations-cheric-lecture-17-membrane-separations-ch-14.jpg)