Embed Size (px)
Citation preview

membranes
Review
Membrane-Based Processes Used in MunicipalWastewater Treatment for Water Reuse:State-Of-The-Art and Performance Analysis
Jiaqi Yang 1, Mathias Monnot 1 , Lionel Ercolei 2 and Philippe Moulin 1,*1 Laboratoire de Mécanique, Modélisation et Procédés Propres, Equipe Procédés
Membranaire (EPM-M2P2-CNRS-UMR 7340), Aix-Marseille Univ., Europôle de l’Arbois, BP 80, Bat. Laennec,Hall C, CEDEX 04, 13545 Aix-en-Provence, France; [email protected] (J.Y.);[email protected] (M.M.)
2 Société des Eaux de Marseille Métropole, 25 Rue Edouard Delanglade, CEDEX 06,B.P. 29-13006 Marseille, France; [email protected]
* Correspondence: [email protected]; Tel.: +33-6-67-14-14-18
Received: 22 May 2020; Accepted: 21 June 2020; Published: 25 June 2020�����������������
Abstract: Wastewater reuse as a sustainable, reliable and energy recovery concept is a promisingapproach to alleviate worldwide water scarcity. However, the water reuse market needs to bedeveloped with long-term efforts because only less than 4% of the total wastewater worldwide hasbeen treated for water reuse at present. In addition, the reclaimed water should fulfill the criteriaof health safety, appearance, environmental acceptance and economic feasibility based on theirlocal water reuse guidelines. Moreover, municipal wastewater as an alternative water resourcefor non-potable or potable reuse, has been widely treated by various membrane-based treatmentprocesses for reuse applications. By collecting lab-scale and pilot-scale reuse cases as much as possible,this review aims to provide a comprehensive summary of the membrane-based treatment processes,mainly focused on the hydraulic filtration performance, contaminants removal capacity, reuse purpose,fouling resistance potential, resource recovery and energy consumption. The advances and limitationsof different membrane-based processes alone or coupled with other possible processes such asdisinfection processes and advanced oxidation processes, are also highlighted. Challenges still facingmembrane-based technologies for water reuse applications, including institutional barriers, financialallocation and public perception, are stated as areas in need of further research and development.
Keywords: membrane processes; municipal wastewater reuse; disinfection efficiency; fouling;water recovery
1. Introduction
Traced back in history, wastewater has long been reused for humans directly or indirectly becauseof the water shortage and lack of treatment facilities. Since people realized that wastewater could causeserious catastrophic epidemics of waterborne diseases such as Asiatic cholera and typhoid, they startedto research potable water protection and terminal wastewater treatment, such as the reservoirs oraqueduct systems and filtration [1]. The State of California in the Unites States (US) is a pioneer inpromoting water reclamation and reuse for irrigation, and promulgated the first reuse regulationsin the early 20th century [2]. At the end of the 20th century, the benefits of promoting wastewaterreuse as a means of supplementing water resources have been recognized by most state legislaturesin the US as well as by the European Union (EU) [1]. From then on, the evolution of processes forwater reuse updates continuously with strict quality guidelines, which not only contributes to humanhealth, but also protects the earth’s resources that humans depend. Nowadays, the term wastewater
Membranes 2020, 10, 131; doi:10.3390/membranes10060131 www.mdpi.com/journal/membranes

Membranes 2020, 10, 131 2 of 54
reuse is often used synonymously with the terms of wastewater recycling and wastewater reclamation.The US Environmental Protection Agency (EPA) defines wastewater reuse as: using wastewater orreclaimed water from one application for another application [3]. The deliberate use of reclaimedwater or wastewater must comply with applicable rules for a beneficial purpose.
Water scarcity is growing under the pressures of population growth, climate changes and increasedpollution. At present, one in nine people lacks access to improved sources of drinking water andone in three lacks improved sources of water sanitation [4]. From the Global Risks report of 2019provided by the world economic forum, more than 650 million people in 500 cities are projected to facedeclines in freshwater availability of at least 10% in the 2050s, especially in Middle East and NorthAfrica [4]. However, around 80% of overall wastewater is discharged into the world’s waterways.In this condition, water reuse is considered as a promising approach not only to purify the wastewater,but also to meet people’s needs. In fact, qualified reuse water not only reduces the occurrence andspread of diseases, but also contributes to the protection of the environment. Therefore, recoveringwater, energy, nutrients and other precious materials embedded in wastewater, is a key opportunity tobe seized [5]. Water reuse could also help to regulate climate by increasing natural flows in surfacewaters (with cascading positive effects on ecosystem health and biodiversity) and may contributeto rising groundwater tables through water reused for crop or landscaping irrigation [6]. Moreover,increasing water availability through reuse may help to reduce conflicts over water due to scarcity orresource limitations.
Water reuse has become an attractive option for conserving and extending available water supplyand its applications are shown in Table 1 [7]. Overall, water reuse plays a significant role in non-potableapplications, occupying 97.7% of the water reuse market, including non-potable urban reuse, irrigation,recreation impoundment, environmental enhancements, industries and groundwater recharge. Mainly,the share of reclaimed water is mostly for irrigation, 52% in total, including agricultural irrigationand landscape irrigation [7,8]. Additionally, approximately 20% of reclaimed water is reused for theindustrial self-water-circulation systems for resource and money savings. In order to treat wastewaterfor reuse as potable water, there are two main ways which are, respectively indirect drinking anddirect drinking water. Indirect drinking water can be reused via surface water flow, surface water andgroundwater recharge. Direct drinking water is the most contentious type of water reuse. Actually,the reused wastewater for drinking is always treated to a higher level based on more serious potablewater criterion. However, the concerns of public health, water security, economic and equipmentshortage are still barriers to people’s acceptance [7,8]. Thus, only 2.3% of reclaimed water is reusedinto potable ways.
Table 1. Major water reuse applications and constraints worldwide [7,8].
ApplicationMajor Constraints Percentage
ContributionTypes Examples
Potable reuse Indirect and direct drinking Public perception issues 2.3%
Non potable urban reuse
Public parks and schoolyardsHighway medians
Residential landscapesFire protectionToilet flushing
Dual distribution system costsThe requirement for dual
piping systemsThe greater burden on cross
connection control
8.3%
Agricultural IrrigationNonfood crops
Commercial nurseriesPasture lands
Seasonal demandUsually away from the point
of water reclamationPublic perception issues
High–total dissolved solids(TDS) reclaimed water can
adversely affect plant health
32%

Membranes 2020, 10, 131 3 of 54
Table 1. Cont.
ApplicationMajor Constraints Percentage
ContributionTypes Examples
Landscape Irrigation
Parks and schoolyardsRoadway mediansResidential lawns
Golf coursesCemeteriesGreenbelts
Seasonal demandUsually away from the point
of water reclamationHigh TDS reclaimed water canadversely affect plant health
20%
Recreation Ponds and lakesGolf courses Site specific 6.4%
Environmentalenhancements
Artificial wetlandsNatural wetlands
Stream flowsSite specific 8%
Industries
Process waterBoiler water makeupCooling tower waterGeothermal energy
Constant demand,but site-specific
Limited demandTreatment required depends
on end-use
19.3%
Groundwater recharge
Groundwater replenishmentBarrier against brackish or
seawater intrusionGround subsidence control
Appropriate hydrogeologicalconditions needed
High level oftreatment required
Potential for water qualitydegradation in the subsurface
2.0%
Others 1.7%
As reported by Bixio et al. in 2005, over 3000 water reuse projects distributed in over 60 countrieswere assessed in an advanced planning phase. Most water recycling schemes are located in Japan(>1800) and the US (>800), then followed by Australia (>450), Europe (>200), the Mediterranean andthe Middle East area (>100) and Latin America (>50). However, the projects number is likely to behigher considering the rapid development of water reuse in China, India and the Middle East [9].Table 2. lists the current status of water reuse rates in different countries.
Table 2. Water reuse capacity in typical regions from 2006 to 2017 [6,11].
Country/RegionWater Reuse
Volume Estimation(×106 m3
·d−1)Water Reuse Rate * Year Reference
U.S.A 13.0 9.7% 2000 [12]China 5.90 2.9% 2015 [13]
Arab region (Arabian Peninsula) 3.63 23% 2013 [10]India 3.54 30% 2017 [14]
Europe 2.65 2.4% 2006 [15]Korea 2.58 13.5% 2014 [16]Israel 1.1 87% 2016 [17]
Australia 0.8 16.8% 2010 [18]Mexico 0.67 9.0% 2010 [19]Japan 0.59 1.5% 2014 [20,21]
Singapore 0.58 40% 2013 [22]Tunisia 0.4 83% 2006 [23,24]
* water reuse rate is the ratio of reused water volume over the total wastewater collected.

Membranes 2020, 10, 131 4 of 54
The USA stands out as it represents over one-fifth of the reused water capacity worldwide whereasit only provides a national water reuse rate of 9.7%. In the area with severe water shortage, for examplethe Arab Region, 18 out of 22 Arab countries fall below the water poverty line of 1000 m3 per capita in2014. Driven by high pressure, 71% of the wastewater collected in the Arab States was safely treated,and 21% of them was being reused, mostly for irrigation and groundwater recharge in 2013 [10].Moreover, Singapore has a population of over five million people with a total water demand of1,700,000 m3
·d−1. However, Singapore imported water from Malaysia to alleviate water shortages for along period. The government extremely desires to be independent of water demand via water reuse.
Areas with high water consumption, such as China, are facing serious water shortages drivenby rapid economic growth and urbanization according to its increasing population. According tothe Chinese Ministry of Ecology and Environment, 73 billion m3
·y−1 of wastewater was produced in2015, but merely 2.9% of the total wastewater was treated to be reused. In Europe, the total reusedwater volume amounted to 964 million m3 annually, which accounted for approximately 2.4% ofthe treated urban wastewater effluents [13]. According to Hochstrat et al. [25], in terms of quantity,Spain accounted for the largest reused water quantity in Europe, about a third of the total watervolume reused, followed by Italia, Cyprus and Malta. Furthermore, although wastewater reuse is ingreat potential, the reused water capacity seems rare compared with the total volume of municipalwastewater generated in the world, which was estimated to between 680 and 960 million m3 perday [6]. As reported by Global Water Market 2017, the total volume of water reuse was approximately14.2 billion m3
·y−1 worldwide, less than 4% of the total volume of wastewater [26]. Thus, the worldhas a high potential of establishing water reuse projects, improving water reuse qualities and reducingwater crisis worldwide. Aimed at achieving water reuse, the essence is to purify sewage, removingpollutants and contaminants from wastewater. Therefore, it is necessary to correctly define thewastewater composition and target pollutants. Wastewater usually comes from households, schools,offices, hospitals, commercial and industrial facilities. Municipal wastewater or domestic sewage mayhave high levels of organic and inorganic material, pathogenic organisms, nutrients and many toxicelements, including heavy metals [27]. Generally, municipal wastewater contains approximately 99.9%water by weight [28]. The remaining 0.1% constituents in wastewater can be divided into several maincategories presented in Table 3. Typically, untreated wastewater contains a variety of biologic andchemical constituents, such as bacteria, viruses and organic matters. Therefore, wastewater treatmentis aimed at removing most of or all of, these constituents in sewage.
Finally, the reclaimed water should fulfill the criteria of health safety, appearance, environmentalacceptance and economic feasibility, for reuse [29]. However, the components and pollutants inwastewater are changeable from source-to-source. Therefore, the treatment processes should varywith the components to be removed. Importantly, different reuse applications require different waterquality specifications. Therefore, treatment technologies developed from simple processes into moreadvanced ones [30]. Since not all the wastewater treatment processes could remove contaminants fromwastewater completely, the reused water needs to meet the water reuse standards formulated by thegovernment or other qualified authority institutions that working for the applications or emissionof effluents. However, there are no uniformly enforceable international water reuse guidelines tocontrol the quality of the reclaimed wastewater. Even for the same water reuse application in theU.S., guidelines vary from states to state. Therefore, countries are looking forward to new regulationsreferring to international guidelines from the United Nations (UN), the EU Commission or the US EPAto estimate the different criteria needed for better water management [9,31,32].

Membranes 2020, 10, 131 5 of 54
Table 3. Constituents present in wastewater with their associated risks [28,33–35].
Wastewater Constituents Contents Risks
Microorganisms Pathogenic bacteria, viruses andworms’ eggs
Risk when exposed to humans andanimal by inhalation or drinking
MicropollutantsPesticides, pharmaceuticals,fuel additives, cyanotoxins,
personal care products, detergents
Environmental as well as furtherexpected impacts on humans,
such as genotoxic, immunotoxic,carcinogenic and
fertility-impairing effects
Suspended solids Particles, solids, colloids Carrying pollutantsand pathogens
Biodegradable organic matters Organic carbon, sugar,protein, ammonia
Oxygen depletion in rivers,lakes and fjords; fish death; odors
Other organic matters Fat, oil and grease, coloring,solvents, phenols
Toxic effect, estheticinconveniences, bioaccumulation
in the food chain
Other Nutrients Nitrogen (ammonium, nitrates),phosphorus
Eutrophication, oxygen depletion,toxic effect
Metals Hg, Pb, Cd, Cr, Cu, Ni Toxic effect, bioaccumulation
Others inorganic materials Acids, for example, hydrogensulfide, bases Corrosion, toxic effect
Thermal effects Hot water Changing living conditions forflora and fauna
Odor (and taste) Hydrogen sulfide Esthetic inconveniences,toxic effect
Radioactivity Toxic effect, accumulation
Based on scientific consensus and best available evidence, the World Health Organization (WHO)has set some guidelines for the safe use of wastewater, excreta and greywater, promoting the publichealth benefits of wastewater, excreta and greywater use in agriculture and aquaculture and is nowwidely accepted as a benchmark [36]. Additionally, the European Parliament adopted a legislativeresolution in 13 May 2020, on the Councils position at first reading, with a view to the adoption ofa regulation of the European Parliament and of the Council on minimum requirements for waterreuse (15301/2/2019—C9-0107/2020—2018/0169(COD)) [37]. This regulation project defines the waterquality limits and obligations of wastewater treatment plant (WWTP) operators, for water reuse inthe field of agricultural irrigation only. The above mentioned reuse guidelines, as the representativesconcerning the parameters of water quality, are presented in Table 4. Actually, most countriessupplement and develop their own guidelines, based on WHO guidelines—and considering theirpotential specifications—EU countries will adjust their reuse guidelines based on European water reuserequirements. Overall, the following parameters: pH, total suspended solids (TSS), biological oxygendemand after 5 days (BOD5), turbidity, total coliform and fecal coliforms are important parameters toevaluate the water quality all over the world, and they will be considered to evaluate the ability ofsome water reuse technologies in the following parts of this study.

Membranes 2020, 10, 131 6 of 54
Table 4. Water reuse categories and typical application (WHO guidelines and EU Parliament regulation project).
Organization Category Typical Application pH TSS (mg·L−1)Turbidity
(NTU) BOD5 (mg·L−1) Residual Cl−1
(mg·L−1)
Fecal Coliform(E. coli as an Indicator)
(100 mL−1)
EU ParliamentAgriculture
irrigation
A ≤10 ≤5 ≤5≤10/belowdetection
limitB
Directive91/271/EEC
– CouncilDirective
91/271/EEC
≤100C – ≤1000D – ≤10,000
WHOguidelines
Agricultureirrigation
Food crop irrigation(uncooked) 6–9 ND ≤2 ≤10 1 ND
Non-food crops and cropsconsumed after processing 6–9 ≤30 – ≤30 1 ≤ 200
Landscapeirrigation
Parks; schoolyards;Playgrounds 6–9 ND ≤2 ≤10 1 ND
Golf courses; Cemeteries;Greenbelts;Residential
6–9 ≤30 – ≤30 1 ≤200
Industrial recyclingand reuse
Cooling water; boiler feed;Process water;
Heavy construction– ≤30 – ≤30 – ≤200
GroundwaterGroundwater replenishment;saltwater intrusion control;
Subsidence controlSite-specific; specific guidelines do not exist.
RecreationalEnvironmental uses
Lakes and ponds;marsh enhancement;
streamflow augmentation;fisheries; snowmaking
6–9 ND ≤2 ≤10 1 ND
Non-potableurban uses
Fire protection;air conditioning; toilet flushing 6–9 ND ≤2 ≤10 1 ND
Potable uses
Blending in water supplyreservoirs; Blending in
groundwater; Directpipe-to-pipe water supply
Meet requirements for safe drinking water; specific guidelines do not exist.
ND, not detected; NTU, nephelometric turbidity units; ABCD represents the different water quality levels, A being the best, D being the worst.

Membranes 2020, 10, 131 7 of 54
To be reused, the reclaimed water should achieve reuse limits to ensure human health andenvironmental protection. The choices of wastewater treatment technologies may be affected bythe following factors [38]: reclaimed water objectives for application, wastewater characteristics,compatibility with existing conditions, process flexibility, operating and maintenance requirements,energy and chemical requirements, economical requirements, residual disposal options andenvironmental constraints. In general, in a WWTP, if the wastewater, after primary and/or secondarytreatment, cannot be reused for target purposes, it should be treated to tertiary level or with moreadvanced processes to achieve reuse standards.
Primary treatment can be considered as physical processes such as sedimentation and flotation [39].The process can remove approximately 50–70 of total suspended solids (TSS) and 25–50 BOD5 [40].The secondary treatment combines biologic and chemical processes to remove the soluble organicmatter and the residual TSS after the primary process, such as activated sludge, oxidation ponds androtating biologic contactor [41]. However, the secondary effluent is limited in reuse applications withrisks for human health and public environments [42]. A tertiary treatment could then be applied toremove associated hazards and health risks [42]. Tertiary and advanced treatments are consideredas the advanced level of treatment and mostly include membrane processes, advanced oxidationprocesses, disinfection or any combination of them to remove chemical and biologic constituents.The advanced processes remove most of the suspended solids, colloids, bacteria and viruses fromthe feed [43], nearly up to 99% removal of the contaminants, thus for safe water quality in specificreuse [44]. According to the classified treatments, the requirement for reuse should be stricter in thefield of human exposure due to potential health risks. Where human exposure is likely, reclaimedwater should be treated to a high level. In order to make reuse cost-effective, the level of treatmentmust be “fit for purpose”.
Treatment technologies are employed either alone or in combination to achieve wastewater reuselevels. However, as the potential for human contact increases, advanced treatment beyond secondarytreatment becomes more accepted and membrane filtration is one of the key unit technologies for waterreuse. Although several review articles have given overview summaries of the previously reportedtechniques for municipal wastewater reuse [45–49], they either mainly focused on greywater reuseor on only one reuse level or on only one type of technology. Therefore, membrane-based municipalwastewater treatment techniques for reuse have not been extensively reviewed.
This study aims to provide a comprehensive review on membrane-based processes used inmunicipal wastewater treatment for water reuse. Particularly, this review is expected to provide anoverall summary of reported research cases of feasible membrane-based technologies on municipalwastewater treatment for reuse, mainly focusing on membrane hydraulic performance, contaminantsremoval ability, reuse purposes and energy consumption. Key benefits and challenges of currentimplementations will be also described after the summary.
2. Performances of Membrane-Based Treatment Processes for Municipal Water Reuse
Membrane-based technologies are considered to be integral units for municipal wastewatertreatment processes [50]. Pressure-driven membrane processes are presented in Table 5 and can beclassified into four main categories, based on the different selective pore size: two low and two highpressure processes microfiltration (MF) and ultrafiltration (UF), nanofiltration (NF) and reverse osmosis(RO), respectively [47,51–54]. As the pores get smaller, the membrane needs more driving force to beoperated [55,56]. When it comes to membranes, membrane fouling always occurs during the filtrationprocess, followed with an increase in transmembrane pressure (TMP) to maintain a constant flux orfollowed with a decrease in flux to maintain constant TMP. According to Guo et al. [57], membranefouling is often defined based on the type of pollutants present in the feed stream and can be classifiedinto four categories, including: (1) particulate/colloidal fouling, when suspended solids and/or colloidsclog the pores of a membrane or adhere to its surface; (2) organic fouling, when reactive dissolvedorganic components or colloids attach to the membrane by adsorption; (3) inorganic fouling, also known

Membranes 2020, 10, 131 8 of 54
as scaling or precipitation fouling, caused by the presence of crystallized salts, oxides and hydroxidesin the feed solution that are prone to precipitate onto membrane surface due to pH change or oxidation;and (4) biofouling, caused when microorganisms, plants, algae or other biologic contaminants growingon or in the membrane surface and pores. Each of these types of fouling can be either reversibleor irreversible and permanently compromise its performance. All the fouling types can take placesimultaneously, and the interaction between them usually increases filtration resistance [58]. Therefore,in each membrane process, fouling issues need to be considered and optimized to obtain sustainableand excellent filtration performance. Additionally, an important notion to take into account is thethreshold flux, the flux at or below which a low and near constant fouling rate occurs, but above thatwhich the fouling rate increases markedly [59,60]. The number of studies on critical, sustainable andthreshold flux of different kinds of wastewater filtrated by certain membranes are expanding recentlybecause these concepts of flux are highly related to control low fouling rates on membranes [59,61,62].Especially for commercial and industrial production, the operation at sustainable flux could definitelycontrol fouling and at the same time, give an optimal balance between moderate operating costs andmoderate capital costs [59]. Concerning membrane materials for wastewater reuse, there are commonlypolymeric membranes or inorganic membranes [53]. The selection of material is affected by pore sizedistribution, wetting susceptibility, porosity, mechanical strength, cost, polymer flexibility, foulingresistance, stability, durability and chemical resistance [56].
Table 5. Membrane separation characters for water purification [52,63–66].
Characters MF UF NF RO(Low-Pressure)
Separationmechanism Sieve Sieve Sieve, solution/diffusion,
Exclusion, electric repulsionSolution/diffusion,
Exclusion
Membrane Porous isotropic Porous asymmetric Finely porousasymmetric/composite
Nonporousasymmetric/composite
Molecularweight cutoff
>1000 kDa 1–300 kDa 200–1000 Da –
Retainedcompounds
Colloids, TSSturbidity,
some protozoanoocysts, cysts,some bacteriaand viruses
Macromolecules,proteins, colloids,bacteria, viruses
LMWC, mono-, di- andoligo-, saccharides;polyvalent anions,
some hardness, viruses
LMWC, sodium,chloride, glucose,
amino acids,hardness, ions
Transmembranepressure (TMP) <5 bar <10 bar <20 bar <100 bar
Flow modes Crossflow,Dead-end
Crossflow,Dead-end Crossflow Crossflow
GeometryHollow fiber, spiralwound, plate and
frame, tubular
Hollow fiber, spiralwound, plate and
frame, tubular
Hollow fiber, spiral wound,tubular
Hollow fiber,spiral wound
HMWC: high molecular weight compounds; LMWC: low molecular weight compounds.
2.1. MF/UF Treatment Process after Secondary Treatment in WWTP
MF and UF can remove particles larger than their pore size mainly through a sieving mechanism [56,67].In general, the MF process alone can effectively remove high molecular weight organic matters,suspended solids, colloids, bacteria and thus reduce turbidity. Compared with MF, UF membraneshave a wider separation range with smaller pore size and enhanced removal ability for particles,colloids, and more importantly, bacteria with high removal rate and viruses. In order to clearlyunderstand the separation difference between MF and UF, Tchobanoglous et al. [55] quoted by thereview of Warsinger et al. [47], summarized the rejection characteristics when filtrating the samesecondary effluent by MF and UF, on bacteria, viruses and other essential water quality parameters

Membranes 2020, 10, 131 9 of 54
such as TSS, chemical oxygen demand (COD) and TDS. It should be noted at first that the data gavegeneral information with certain limitations: the actual performance may vary related to differentconditions, such as temperature, flow rate and TMP. Through comparison, both UF and MF were inpoor removal efficiency on TDS, NH3–N and NO3–N. UF is almost as efficient as MF in removing TSSand BOD5, with the removal rates from 95% to 99.9% and from 75% to 90%, respectively. Moreover,the removal efficiency by UF on COD and total organic carbon (TOC) concentrations was about 5% to20% higher than MF. More importantly, UF provides almost complete removal of bacteria, protozoaand viruses, which is one of the main advantages compared to MF. As stated by Warsinger et al. [47],UF can support up to 6 log removal of bacteria and up to 7 log removal of viruses, and if there areprotozoa, UF can remove protozoan cysts and oocysts to more than 6 log reduction. These removalsare effective if the upstream concentration allows it. Although MF pore size seems larger than the sizeof the viruses, it can eliminate some of the viruses and protozoa through adhering to impurities inwastewater like protein, colloids or coliforms [68]. In 1995, Madaeni et al. [69] have verified that thepresence of bacteria (E. coli) and turbidity highly contributed to the poliovirus rejection through 0.22 µmMF under TMP between 0.5 and 1 bar. Huang et al. [70] demonstrated that virus (MS2 bacteriophageas an indicator) is more likely to be removed through 0.1 µm-MF in waters with more organic mattersor higher concentration of large molecular weight organic foulants. Herath et al. [71] successfullyobserved a considerably high virus rejection rate at their isoelectric point when using a 0.2 µm MFmembrane to filtrate the specific virus (19 to 80 nm) solutions due to the virus–virus coagulation andvirus–protein coagulation. In addition, the physicochemical properties of the virus, the membranematerial, the feed, as well as the hydraulics of the filtration process could affect virus removal byMF [70,72,73]. For example, Huang et al. [70] recorded that when adding sodium or calcium to feedwater, the virus removal capacity decreased immediately. Besides, low pH value increases virusremoval while higher pH value makes removal rate decrease [71]. Anyway, the removal of virusesthrough MF is significant but not complete because the virus are still able to pass through membranepores [74]. It is reported by Warsinger et al. [47] that the log removal value of MF processes onviruses ranges from 0 to 2 (equals to 0% to 99.9%). Table 6 summarizes the real cases of MF/UFprocesses applied alone after secondary treatment for water reuse. It can be seen that a few referencesdemonstrate MF process alone to achieve water reuse. Although Ahn et al. [75] showed that MFpermeate can be used to clean building floors or flush toilets, they did not state the water reuse standardthat they referred to. When comparing their permeate quality with WHO guidelines, the detectedparameters are incomplete and substandard, e.g., the turbidity in both cases exceeds the limit of WHOguidelines (turbidity ≤ 2 NTU). Normally, UF modules contain a prefilter as pretreatment (5–200 µm)to intercept large particles and improve UF performance by decreasing the formation of a cake layer onthe membranes, resulting in a significantly reduced TMP and energy consumption [76]. While using UFmembrane modules, it is more likely to achieve safety wastewater reuse on non-potable applications,such as agriculture irrigation and process water. According to Falsanisi et al. [77] and Muthukumaranet al. [78], it can produce qualified permeate that satisfies WHO water reuse guidelines when using UFprocess after conventional secondary treatment. However, both MF and UF have minor effects on theremoval of residual nutrients such as phosphorus, nitrates and ammonium, but sometimes quite goodeffects on the removal of residual COD and TOC. Generally, effluents from WWTPs still carry high TSSand natural organic matters (NOM) which are prone to cause the formation of fouling on the MF/UFmembrane easier. In fact, dissolved organic matters (DOM) cannot be removed effectively by MF or UFsystems, but conversely it can be the main cause of fouling formation on the membrane, finally resultingin shortening membrane lifespan, reducing flow rate, increasing TMP and energy consumption [79,80].Considering the hydraulic filtration performances (in Table 6), almost all researchers were interested infouling control. Under constant permeate flux of 20 L·m−2
·h−1, reported by Falsanisi et al. [77], the TMPon UF would increase fast from 0.3 bar to almost 1.2 bar in only 20 min filtration, and permeabilitydecreased from 150 L·m−2
·h−1·bar−1 to about 10 L·m−2
·h−1·bar−1. While, according to Pollice et al. [81],
with a periodic filtration cycle of the permeate (90–360 s) and a backwash of (30–40 s) in continuous

Membranes 2020, 10, 131 10 of 54
operational process on secondary effluent treatment in autumn, the system could slow down theincrease of TMP on UF which increased from less than 0.1 bar to about 0.7 bar in more than 30 daysunder almost stable flux at 20 L·m−2
·h−1. Therefore, periodic backwashes could prolong the UFoperation time, reduce the frequency of chemical cleaning uses and save energy during long termoperation. Therefore, to support sustainably high performance of MF/UF on wastewater treatment inlong term operations, it is necessary to conduct suitable physical and chemical cleaning on membranes.
In summary, direct MF and UF processes for the treatment of terminal municipal wastewatertreatment provide recyclable water for non-potable reuse applications based on water reuse guidelines(Table 4). Because of the incomplete removal performance on bacteria, viruses or DOMs, the effluentafter MF/UF system may have potential safety risks when exposed to humans and animals. In addition,when feed water contains much TSS, DOMs or other particles, the high fouling potential may causesevere damage to membranes, decrease production efficiency and increase the economic cost. Therefore,it is necessary to couple the membrane advantages with chemical, physical or biologic processes toenhance system performance, which is the topic of the next section. Moreover, MF/UF membranes arealso widely applied in membrane bioreactors (MBR) or as the pretreatment for nanofiltration (NF) orreverse osmosis (RO) [82], as described in the following sections.
2.2. MF/UF Coupled with Chemical/Physical Processes after Secondary Treatment in WWTP
The hybrid chemical and physical processes with MF/UF methods such as sedimentation,adsorption, flocculation and coagulation [83–85]. Al2(SO4)3, Fe2(SO4)3, FeCl3 and polyaluminumchloride, have been developed widely and are used as remarkable coagulants [86]. Concerningadsorption, activated carbon (AC) is a widely accepted adsorbent [87]. It can be used as a powder (PAC)in dispersion or as granules (GAC) in fixed bed. Table 7 summaries the studies based on the combinationof physical and/or chemical processes before or after MF/UF for wastewater reuse. Some literatureused chemical or physical processes as post-treatment processes after MF/UF, most commonly used asa hybrid MF-adsorption system, such as MF–granular activated carbon system by Shanmuganathanet al. [88]. It was already verified that activated carbon, after membrane filtration, contributes to theadditional removal of DOCs and trace organics, that are not completely retained by membranes [89,90].The design of chemical and/or physical processes is mainly used as pretreatments before MF/UF todecrease membrane fouling potential and improve filtration performance [84,86,91]. Additionally,pretreatment processes support better filtration hydraulic performance for MF/UF. As stated byZheng et al. [92], when studying the time required to increase TMP from 0.22 bar to 0.7 bar onsecondary effluent treatment (constant flux of 50 L·m−2
·h−1), direct UF process took only 12 h whilethe sand-UF system could extend to 30 days. In addition to that, Fan et al. [93] designed parallel testsof MF with/without pretreatment to treat secondary effluent under constant TMP (0.70 bar), the resultsconfirmed that the coagulation-prefiltration (1.5 µm)-MF systems could improve flux recovery (J/J0)between 20% and 30% higher than MF alone due to the hydraulically irreversible fouling (internaladsorptive fouling) reduction by coagulation. Therefore, a pre-filtrated treatment process removesthe fouled components before MF/UF membranes, thus contributing to prolonging the whole systemoperational time, improving permeability recovery, and decreasing membrane cleaning consumption.First, it should be noted that in some pretreated processes, for example coagulation with settling,the re-growth of floc could conversely cause severe cake fouling on membranes [94]. It is necessaryto add another prefilter after coagulation, flocculation and settling to remove the flocs, colloids andother particles before the membranes. Second, it has been proven that pretreatment processes couldeffectively remove NOM and colloids [95,96]. As described previously, dissolved organic carbon(DOC) cannot be effectively retained by MF or UF due to membrane pore sizes being much largerthan component molecules [97]. Fan et al. [93] reported that MF could only remove 3.9% DOC,while UF could remove 24.7%. Therefore, when pre-coagulated with 5 mg·L−1 of Al3+, the MF systemcould increase 10% to 15% DOC removal; and when pretreated with 10 mg·L−1 anion exchange resinin wastewater which removes primarily lower molecular weight cut-off (MWCO) and negatively

Membranes 2020, 10, 131 11 of 54
charged organic fractions, the MF and UF systems could improve DOC removal to 58.8% and 68.3%,respectively [93]. Third, pretreatment processes contribute to the removal of dissolved nutrients, mainlynitrogen and phosphorus. Hybrid precipitation–MF system by Lu et al. [98] made use of calciumsalt to increase precipitates involved with phosphorus and fluorine and then separated solid–liquidphases by following with crossflow MF for separation. Guo et al. [84] compared the performanceof MF with and without pretreatment for wastewater reuse, the results showed that MF alone onlyremoved 20% TOC and 5% PO4
3−, while pretreated with flocculation and adsorption, the removalefficiency of TOC reached 99.7% and more than 97% of PO4
3−. In addition, the UF system coupled withPAC can be used to eliminate both DOM and micropollutants. Though MF/UF alone is inadequate formicropollutant removal, in PAC–membrane processes, contaminants (including natural disinfectionbyproduct precursors) can be reduced through adsorption onto the activated carbon particles, which arethen separated from water by either UF or MF [68]. Among MF-based treatments in Table 7, the hybridgranular active carbon with MF and coagulation with MF processes were performed with significantremoval efficiency on turbidity, TSS and color [88,99,100]. More notably, these processes were able toremove between 40% and 46% of DOC from the feed, mainly caused by coagulation and adsorption,resulting in lower fouling formation and lower energy consumption [88,100]. However, based onthe WHO water reuse guidelines, MF permeate is mostly applied in low levels of non-potable reuse,such as toilet flushing, machine cleaning, irrigation for non-food crops or more likely reused as processwater for industries, such as washing, cooling and circulating. Among UF-based treatments in Table 7,the hybrid flocculation, coagulation or adsorption process with UF processes, could remove turbidity,TSS, color almost completely from secondary treated municipal WWTP. In addition, the removal ofCOD, DOC, metal and salt ions was also higher than MF. More important, UF could remove bacteria,viruses and parasites [101,102]. Therefore, hybrid UF permeate can contain little to no concentration ofTSS, microorganisms, relatively low concentration of micropollutants, relatively high concentration ofnutrients, and exhibits favorable inorganic ratios [103].
In fact, the permeate of UF as the main technology for reclamation is commonly reused onnon-potable applications, such as agricultural irrigation, landscape irrigation, urban reuse, car washingand sometimes as process water for industries. However, the limitation for hybrid UF, with physical orchemical processes for potable reuse, may be the residual dissolved organic matters, micropollutants,and specific toxic ions produced from coagulants or flocculants (such as chloride ions). When pretreatedwith adsorption, the disadvantages include the expensive regeneration of the adsorbents (such as PACs)and loss of adsorbents [104]. Moreover, pretreatment with coagulation, flocculation and adsorptionneed higher energy cost with increased sludge volume production during treatment [105].
In summary, the use of MF or UF alone after conventional secondary treatment as well as hybridMF or UF provide a relatively good quality of permeate compatible with non-potable reuse applications.Therefore, the membrane bioreactors (MBR), operated as secondary treatment in some recent WWTPs,could also be an interesting process for water reuse applications, which will be the topic of thenext section.
Membranes 2020, 10, 131 12 of 54
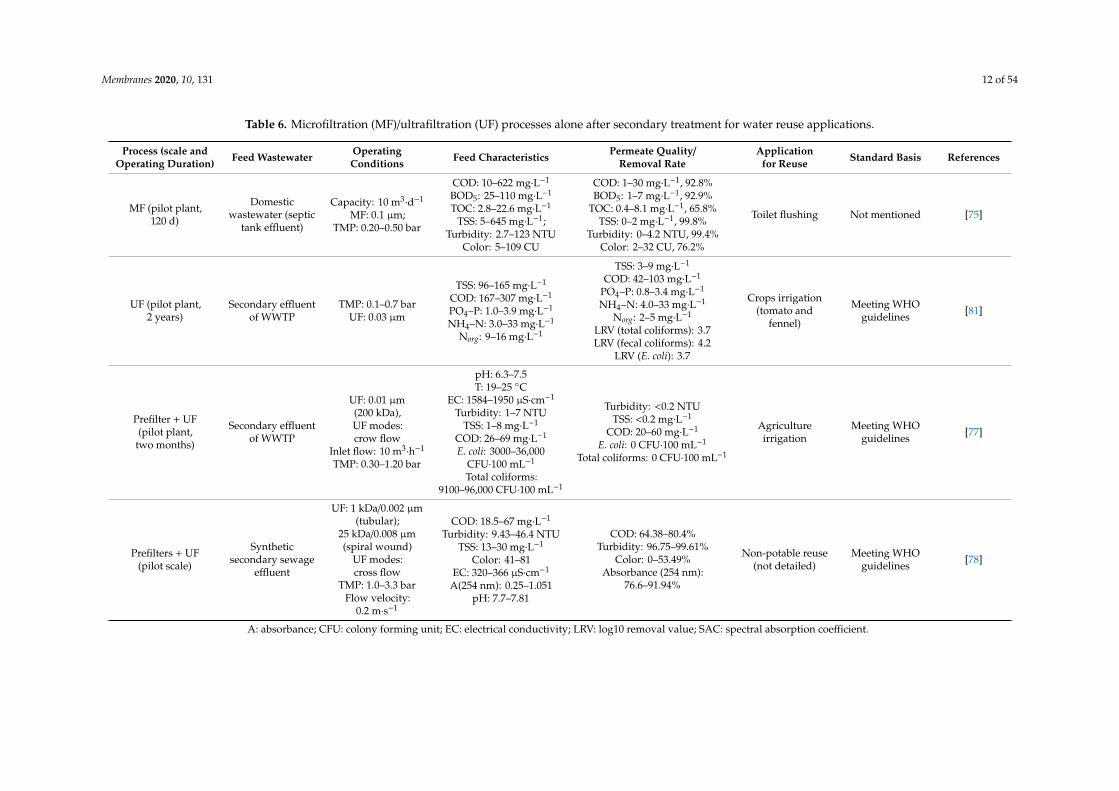
Table 6. Microfiltration (MF)/ultrafiltration (UF) processes alone after secondary treatment for water reuse applications.
Process (scale andOperating Duration) Feed Wastewater Operating
Conditions Feed Characteristics Permeate Quality/Removal Rate
Applicationfor Reuse Standard Basis References
MF (pilot plant,120 d)
Domesticwastewater (septic
tank effluent)
Capacity: 10 m3·d−1
MF: 0.1 µm;TMP: 0.20–0.50 bar
COD: 10–622 mg·L−1
BOD5: 25–110 mg·L−1
TOC: 2.8–22.6 mg·L−1
TSS: 5–645 mg·L−1;Turbidity: 2.7–123 NTU
Color: 5–109 CU
COD: 1–30 mg·L−1, 92.8%BOD5: 1–7 mg·L−1, 92.9%
TOC: 0.4–8.1 mg·L−1, 65.8%TSS: 0–2 mg·L−1, 99.8%
Turbidity: 0–4.2 NTU, 99.4%Color: 2–32 CU, 76.2%
Toilet flushing Not mentioned [75]
UF (pilot plant,2 years)
Secondary effluentof WWTP
TMP: 0.1–0.7 barUF: 0.03 µm
TSS: 96–165 mg·L−1
COD: 167–307 mg·L−1
PO4–P: 1.0–3.9 mg·L−1
NH4–N: 3.0–33 mg·L−1
Norg: 9–16 mg·L−1
TSS: 3–9 mg·L−1
COD: 42–103 mg·L−1
PO4–P: 0.8–3.4 mg·L−1
NH4–N: 4.0–33 mg·L−1
Norg: 2–5 mg·L−1
LRV (total coliforms): 3.7LRV (fecal coliforms): 4.2
LRV (E. coli): 3.7
Crops irrigation(tomato and
fennel)
Meeting WHOguidelines [81]
Prefilter + UF(pilot plant,
two months)
Secondary effluentof WWTP
UF: 0.01 µm(200 kDa),UF modes:crow flow
Inlet flow: 10 m3·h−1
TMP: 0.30–1.20 bar
pH: 6.3–7.5T: 19–25 ◦C
EC: 1584–1950 µS·cm−1
Turbidity: 1–7 NTUTSS: 1–8 mg·L−1
COD: 26–69 mg·L−1
E. coli: 3000–36,000CFU·100 mL−1
Total coliforms:9100–96,000 CFU·100 mL−1
Turbidity: <0.2 NTUTSS: <0.2 mg·L−1
COD: 20–60 mg·L−1
E. coli: 0 CFU·100 mL−1
Total coliforms: 0 CFU·100 mL−1
Agricultureirrigation
Meeting WHOguidelines [77]
Prefilters + UF(pilot scale)
Syntheticsecondary sewage
effluent
UF: 1 kDa/0.002 µm(tubular);
25 kDa/0.008 µm(spiral wound)
UF modes:cross flow
TMP: 1.0–3.3 barFlow velocity:
0.2 m·s−1
COD: 18.5–67 mg·L−1
Turbidity: 9.43–46.4 NTUTSS: 13–30 mg·L−1
Color: 41–81EC: 320–366 µS·cm−1
A(254 nm): 0.25–1.051pH: 7.7–7.81
COD: 64.38–80.4%Turbidity: 96.75–99.61%
Color: 0–53.49%Absorbance (254 nm):
76.6–91.94%
Non-potable reuse(not detailed)
Meeting WHOguidelines [78]
A: absorbance; CFU: colony forming unit; EC: electrical conductivity; LRV: log10 removal value; SAC: spectral absorption coefficient.

Membranes 2020, 10, 131 13 of 54
Table 7. Hybrid MF/UF membrane with chemical/physical processes after conventional secondary treatment for water reuse applications.
Membrane Process(Scale and
Operation Duration)Feed Wastewater Operating
Conditions Feed Characteristics Permeate Quality/Removal Rate Applicationfor Reuse Standard Basis References
GAC+MF (submerged)(lab scale, 140 d)
Secondary treated waterof the sewage treatment
plant in Sung-kyunkwan University
MF: 0.22 µmFlux: 98 L·m−2
·h−1
TMP: 0–0.4 bar
pH: 7.62–8.02Turbidity: 2.2–10.3 NTU
TSS: 4–20 mg·L−1
UV260: 0.28–0.32 cm−1
DOC: 6–8 mg·L−1
COD: 10–30 mg·L−1
TN: 30–50 mg·L−1
TP: 15–30 mg·L−1
Turbidity: 0.1–0.4 NTU, 100%TSS: 100%
UV260: 0.26–0.3 cm−1, 60%DOC: 2–4 mg·L−1, 40–46%
COD: 8–25 mg·L−1, 53%TN: 20–40 mg·L−1 15%TP: 10–20 mg·L−1, 13%
Not mentioned WHO guidelines [100]
Submerged MF–GAC(Semi-batch, 60 d)
Biologically treatedsewage effluent
MF: 0.14 µm, flat sheetNF: 700 Da, flat sheet
TMP: ≤4 barFlux: 2.5 L·m−2
·h−1
GAC: 10% dailyreplacement
pH: 6.8–7.6EC: 520–1120 µS·cm−1
DOC: 3.6–7.7 mg·L−1
DOC: 2.4 ± 0.2 mg·L−1, 53 ± 5%PPCPs: <5 ng·L−1 (for each)
Not mentioned
Australian and NewZealand Guidelines
for Fresh and MarineWater Quality
[88]
Coagulation + MF(lab scale, 5 months)
Secondary effluentfrom WWTP
Coagulant:10–50 mg·L−1 alumina
MF: 0.1, 0.22 µm;TMP: 0.34 bar
Turbidity: 19.7 ± 87.9 NTUTOC: 7.2 ± 6.5 mg·L−1
pH: 7.0 ± 0.2UV254: 0.040–0.058 cm−1
Alkalinity: 202.8 ± 12.2 mg·L−1
as CaCO3TSS: 14.4 ± 25.8 mg·L−1
Turbidity: 0.11–0.13 NTU, >93%;TOC: 1.30–1.56 mg·L−1, 23.5–35.5%UV254: 0.019–0.02 cm−1, 52.5–54.5%
Not mentioned Not mentioned [99]
Coagulation + PAC + UF(lab scale)
Secondary effluentfrom WWTP
UF: 50 kDaTMP: 1 bar
Coagulant: FeCl3
pH: 7.4Turbidity: 18 NTU
TSS: 35 mg·L−1
BOD5: 30 mg·L−1
COD: 77 mg·L−1
EC: 1350 µS·cm−1
Zeta potential: 4.118 mV
COD: 13.33–21 mg·L−1
Turbidity: 0.5–0.8 NTUZeta potential: −0.332–0.166 mV
Not mentioned Not mentioned [106]
PAC + UF(lab scale, ~1 h)
Secondary effluent fromdomestic WWTP
UF: 100 kDaTMP: 1 bar
pH: 7.1–7.6Turbidity: 0.9–1.5 NTU
TOC: 3.3–5.2 mg·L−1
UV254: 0.09–0.12 cm−1
COD: 25–32 mg·L−1
Color: 18–24 CUColiforms: 300–700 mL−1
DOC: 22.2–28.8%UV254: 33.7–38.3%
urban reuse,agricultural,
landscape andindustrial reuse
Not mentioned [107]
MF+UF Secondary effluent fromurban WWTP
MF: 0.2 µm, hollowfiber, 0.2–0.8 bar (TMP)UF: 0.05 µm, flat sheet,
0.2–0.6 bar (TMP)
Turbidity: 4–20 NTUTSS: 11–87 mg·L−1
T-UV253.7: 11–41%Nematode eggs: 0–200 Un·L−1
E. coli: 104–106 CFU·100 mL−1
Fecal coliforms: 104–106 CFU·100 mL−1
Coliphages: 103–104 PFU·100 mL−1
Turbidity: 0–0.9 NTUTSS: 1–7 mg·L−1
T-UV253.7(%): 0Nematode eggs: 0
E. coli: 0 CFU·100 mL−1
Fecal coliforms: 0–9 CFU·100 mL−1
Coliphages: 0–1PFU·100 mL−1
Not mentioned Water reuse guidelinesof US EPA [108,109]
CFU: colony forming unit; EC: electrical conductivity; PPCPs: pharmaceuticals and personal care products; SAC: spectral absorption coefficient.

Membranes 2020, 10, 131 14 of 54
2.3. MBR-Based Treatment for Water Reuse
Besides chemical and physical processes, biologic processes could also be combined with amembrane system based on its advantage in the degradation of microorganisms [110]. Alternatively,Membrane Bioreactor (MBR), a combination system, is mostly constituted with a conventional activatedsludge process (CAS) and a submerged or external MF/UF membrane process. The CAS process is abiologic process that is mainly used for reduction of organic matters in the wastewater, and usuallyincludes an aeration tank used for biologic degradation and a secondary clarifier (sedimentation tank),where the sludge is separated from the treated effluent [111]. The effect of the membrane is to increasethe concentration in the biologic reactor, to retain the particulate phase within the bioreactor andallow permeate to pass to the next process or be discharged/reused [112]. In MBRs, biodegradationand membrane separation are performed simultaneously, thus maximizing wastewater treatmentefficiency. Compared to conventional activated sludge with a membrane post-treatment process,MBRs perform better in processes producing high biodegradation efficiency, small footprint, smallersludge production, good resistance to shock loading and automation capability [113]. This sectiondoes not aim to provide an exhaustive review of MBR used for water reuse as it has been the topicof numerous previous review papers, but it rather aims to give a comparison point for the otherprocesses presented in this study. A review by Wu et al. [45] detailed the non-potable and potableapplication of various MBR systems for greywater reclamation with numerous MBRs case analysis.Normally, the wastewater generated from households or office buildings from streams without fecalcontamination is called greywater, which is less polluted than municipal wastewater and easier to betreated for reuse. The reclaimed water is proved to satisfy the guidelines of US EPA and WHO reuseapplications, such as flushing toilets, irrigation, washing cars, recharging aesthetically pleasing naturalor underground water systems. It is reported that the MBRs performed better in the removal of organicmatters, resulting in relatively less energy and economy consumption compared with conventionalCAS processes. In addition, Wu et al. [45] and Atasoy et al. [114] both stated that greywater producedless organic foulant for MBRs together with the lower driving force and lower membrane fouling.It is important to note that (i) greywater used in these papers contains fewer organics, fewer bacteriaand pathogens than municipal wastewater; (ii) the reported permeate fluxes of MBRs for greywatertreatment were relatively lower compared to conventional centralized MBRs for municipal wastewatertreatment (generally within a range of 15–30 L·m−2
·h−1 for organic membrane) which resulted in athinner density of fouling [113] and (iii) lower fouling potential on membrane results in lower energyconsumption. Studies summarized in Table 8 are focused on MBRs for municipal wastewater treatmentand reuse applications. The results indicate that the MBRs could effectively remove organics, TSS,nutrients in various forms, surfactants and micropollutants from various wastewater. MBRs havebeen reported to consistently achieve removal rates of 90–95% for COD, 80–99% for NH4–N and70–99% for total phosphorus (TP), respectively [115]. Although feed characteristics among variousmunicipal WWTPs showed a large difference, the results of organic removal ratios in the MBRspresented only slight dissimilarities. Apart from greywater reuse, black water (containing fecal matter)and domestic wastewater can also be reused under MBR treatment, which has been verified by severalresearchers such as Purnell et al., Atasoy et al. and Xing et al. [114,116,117]. The application ofreclaimed municipal water can be in non-potable uses with MBRs or additional processes. In addition,MBRs are considered as the cost-effective technology for wastewater treatment which can be operatedunder a widely organic loading rate, high concentration of mixed liquor suspended solids (MLSS)and a large amount of feed flow. This view can be supported by Tam et al. [118] who described theseparately MBR and MF processes on the same sewage treatment, when the water production bothachieved the reuse level for toilet flushing, the MF feed was secondary treated effluent whereas theMBR feed was just degritted sewage. Nevertheless, MBRs are confirmed to produce high qualifiedwater production even under higher concentration of COD, BOD5, TSS, TN, TP and turbidity in thefeed. In general, municipal wastewater after the MBR treatment process has been usually reused astoilet flushing [119–121]—and some even can be reused for irrigation [122]. Studies have demonstrated

Membranes 2020, 10, 131 15 of 54
that MBR treatment removed different types of microorganisms, including enteric viruses in somestudies, more effectively than in conventional secondary treatment, performed on both pilot-scale andwithin full-scale municipal WWTPs [112,123,124]. It is important to note that the removal value is afunction of the inlet concentration and outlet after MBR. As stated by De Luca et al. [125,126], the MBRprocess was able to achieve, respectively 2.7 and 1.7 higher log reduction value (LRV) of somaticcoliphages and F-RNA specific bacteriophages compared to CAS process. Similarly, it was reportedby Francy et al. [123] that LRV for all organisms, including enteric viruses, were higher by MBRtreatment (3.0 to >6.7) than by conventional secondary treatment (1.5 to 4.2) in municipal wastewatertreatment. Hirani et al. [127] compared six MBR systems with membrane pore sizes ranges from 0.03to 0.1 µm to evaluate their removal capability on bacteria and phages. The results showed the LRVsof coliform bacteria, fecal coliform bacteria and indigenous MS-2 coliphages with ranges of 5.8–6.9,5.5–6.0 and 2.6–3.4, respectively, were in minor difference among different MBR systems. In addition,Chaudhry et al. [128] demonstrated the MBR process could provide more than 4-log reduction ofadenovirus and norovirus GII, and over 5-log reduction of F+ coliphage, and provided evidence forassigning virus disinfection credit to similar MBRs for reclaim wastewater [128]. The above casesconfirmed the stable effectiveness of MBRs on certain bacteria removal whatever the pore sizes, but itis not for all microorganisms. Additionally, Hirani et al. [127] also reported the removal efficiency ofseeded coliphages among different MBRs, the LRVs ranged greatly from 1.0 to 4.4 which is correlatedto the membrane pore size distribution from 0.1 to 0.03 µm to some extent. For the same purpose,other studies draw a similar conclusion on the removal of seeded viruses in MBRs with LRVs ranginggreatly from 0.4 to 5.8 with membrane pore sizes ranging from 0.1 µm to 0.4 µm [129,130]. However,size exclusion by the membrane is probably the dominant removal mechanism for bacteria and virusesin MBRs with intact membranes, but not exclusively. Other removal mechanisms, such as adsorptionto the biomass, pore blocking and pore constriction may also play an important role [127]. Althoughthe size of viruses are smaller than microfiltration pores, it is possible to achieve high removal rates ofthem mainly after the buildup of a biofilm on the membrane, which is in the same removal mechanismof MF mentioned above [124,131].
Furthermore, the effective biodegradation integrated with membrane performance leads to moreadvantages than separated processes, i.e., less organic foulants on the membrane, smaller footprint,faster plant activation, no biologic sedimentation units and less sludge production [125,132]. As aresult, (1) particle separation can be achieved without sedimentation before MBR systems, but withmembrane filtration [126]; (2) sludge production from MBRs is less than CAS [58,115]; (3) MBRs canprovide footprint savings due to a higher organic loading rate and greater reactor depth compared toCAS. Membrane fouling remains a major obstacle that hinders faster commercialization of MBRs dueto its influences on flux decline, membrane lifetime span, backwash frequency, energy cost, and evenpermeate quality. Generally, membrane fouling in MBRs should be blamed for both membranepore-clogging and sludge cake deposition on membranes which is usually the predominant foulingcomponent [133]. In fact, the complex nature of membrane foulants and activated sludge is theculprit to various fouling formation, such as cake fouling, pore blocking and extracellular polymericsubstances (EPS) or soluble microbial products adsorption on/within membrane surface [134]. To controlfouling, aeration is effective to remove cake fouling thus enhances the membrane flux, especially forsubmerged membrane [113,135–138]. But high aeration also brings impacts on biomass characteristics,since colloids and solutes would be the major membrane foulants which cannot be removed effectivelyby increasing shear stress [139]. In addition, since irreversible fouling still increased by physical washes(permeate backwash, air bubbles) directly influences the long-term operation of MBRs, chemicalcleaning is necessary during the filtration process [134]. However, chemical cleaning should be limitedto a minimum frequency when it can still maintain a sustainable operation of MBRs, because frequentchemical cleaning may lead to membrane damage, chemical agents’ consumption and environmentalpollutions. In summary, MBRs provide qualified permeate for water reuse, while improvementsneed to be found to decrease membrane fouling and the related energy consumptions. In this case,

Membranes 2020, 10, 131 16 of 54
it is necessary to find new anti-fouling methods for the MBRs. For instance, a novel magneticallyinduced membrane vibration system has resulted in higher flux at lower fouling rates compared withconventional submerged MBRs [140,141]. The vibration MBR was found to be a promising strategy inefficient fouling control and significant energy savings in future research.
More recently, anaerobic MBR (AnMBRs) are getting increasing attention and interest. UnlikeMBR, AnMBR consists of a primary anaerobic bioreactor and a secondary MF/NF membrane bioreactor.First, the microorganisms in the anaerobic bioreactor convert organic carbon and BOD5 in wastewaterinto biogas (methane) and CO2. Second, membranes separate the microorganisms and other suspendedsolids from the treated effluent. The main advantage of wastewater treatment by AnMBRs is thenatural aspects of the bioprocess such as the reduction of the overall energy demand, wide loadingrate decreasing the need for aeration, increasing energy recovery from methane production andproducing less secondary sludge [48,142,143]. These features create eco-environmental effects andsupplement the energy cost during wastewater treatment. However, as AnMBRs become increasingpopular on wastewater treatment, few cases have been investigated on whether AnMBRs alone canbe used for wastewater reclamation. Once Song et al. [48] tested the performance of AnMBR onsynthetic domestic wastewater in lab, the results showed that although the effluent after AnMBRachieved the high removal efficiency on COD (98.4 ± 0.4%), TOC (98.7 ± 0.3%) and TN (20.4 ± 11%),the quality cannot meet reuse standards due to the high concentration of COD (101.5 ± 22.9 mg·L−1)and TN (132.5 ± 16.9 mg·L−1) in the effluent. It showed the water production may contain moreorganic and inorganic matters from the AnMBRs than from MBRs. In addition, it has been reportedthat AnMBRs caused serious membrane fouling potential with high mixed liquor suspended solid(MLSS) concentration [143] and need longer biomass retention time to support the slow-growinganaerobic microorganisms than aerobic MBRs [144]. To improve the hydraulic performance of AnMBRs,some articles found several solutions. For example, the anoxic-aerobic MBR system which separatesthe anoxic process and MBR process is helpful in the improvement of permeate quality together withenergy saving [118]. According to Liu et al. [145], low TSS in the feed water, such as mixed liquor,contributes to a significant reduction of gas sparging demand for membrane scouring in an AnMBR.More interestingly, when combining AnMBR with the further zeolite–RO process by Li et al. [146],the permeate can finally reach potable reuse level. Therefore, further treatment process after AnMBR,such as physically adsorption, precipitation, advanced membrane filtration or disinfection, is necessaryto control the fouling potential and increase the treatment efficiency of AnMBRs, when applied to waterreuse processes [145] and the performance of some AnMBRs with a further treatment step, will bedescribed in the next section.
These three sections showed that after UF/MF combined with secondary treatment or afterMBR processes, water reuse is feasible for non-potable applications mostly. Consequently, for moreadvanced reuse applications, complementary treatments such as NF, RO or forward osmosis (FO)are often needed, and these will be the subject of the following Sections 2.4 and 2.5. In addition,the combination of MF/UF with disinfection or advanced oxidation processes are also recommendedfor an improvement on water production safety, described in Section 2.6. In addition to the mentionedprocesses, additional posttreatment process after MF/UF, such as electrodialysis [147], can also beapplied on wastewater treatment for reuse. However, it is rare to apply these combinations onmunicipal wastewater reuse because of the complex operational procedures, cleaning processes anddifficulty to achieve cost-effective results based on the current references.

Membranes 2020, 10, 131 17 of 54
Table 8. Membrane bioreactors (MBR) for water reuse applications.
Membrane Process(Scale and
Operating Duration)Operating Conditions Feed Characteristics Permeate Quality/Removal Rate
(in Average)Application for
Reuse Standard Basis References
Aerobic MBR(pilot plant, 30 d)
Feed: mixed municipal andindustrial wastewaterMF: 0.4 µm, flat-sheet
Flux: 83 L·m−2·h−1
MLSS: 1600–2300 mg·L−1
HRT: 8 hSRT: 25 days
pH: 7.3 ± 0.62SS: 223 ± 32 mg·L−1
COD: 250 ± 64 mg·L−1
Al: 250 ± 70 µg·L−1
Fe: 180 ± 80 µg·L−1
Pb: 340 ± 190 µg·L−1
Cu: 610 ± 170 µg·L−1
Ni: 160 ± 90 µg·L−1
Cr: 225 ± 105 µg·L−1
Coliforms: 106 MPN·100 mL−1
SS: <5 mg·L−1, >98%COD: 41–51 mg·L−1, >75%
Al: 81%Fe: 53%Pb: 94%Cu: 91%Ni: 59%Cr: 49%
Coliforms: <140 MPN·100 mL−1, 99.9%
Reused for processwater in industries,
cleaning, recreationalwater supplies or
discharged tosurface waters.
Not mentioned [148]
Aerobic MBR + GAC(water recycle plant,
12 months)
Feed: Primary effluent ofmunicipal wastewater
recycling plantUF: 0.04 µm
HRT: 3.2 h (MBR) + 0.58 h (GAC)
BOD5: 46.2–262.1 mg·L−1
COD: 142.0–512.0 mg·L−1
SS: 47.5–240 mg·L−1
BOD5: < 1.9 mg·L−1, >96%COD:< 48.3 mg·L−1, >65.9%
SS: < 7.2 mg·L−1, >85%Fecal coliforms: 0.3 CFU·100 mL−1
Phages: 3.9–5.6 log reduction
Non-potableCalifornia
Department ofPublic Health
[116]
Aerobic submergedMBR (pilot-scale,
50 days)
Feed: black waterfrom household
MF: 0.4 µmFlux: 30–40 L·m−2
·h−1
HRT: 36 h
pH: 7.6BOD5: 406 mg·L−1
Total COD: 1218 mg·L−1
Soluble COD: 417 mg·L−1
TN: 188 mg·L−1
NH4+-N: 155 mg·L−1
TP: 21.3 mg·L−1
TSS: 560 mg·L−1
Total coliform: >106 100 mL−1
BOD5: 8 ± 4 mg·L−1, 98%Total COD: 42 ± 8.81 mg·L−1, 96%
TSS: 2 ± 1.19 mg·L−1, 99%TN: 19 ± 4.73 mg·L−1, 89%
NH4+-N: 11 ± 3.76 mg·L−1, 92%NOX-N: 8 ± 3.1 mg·L−1
Total coliforms: 0, 100%
Toilet flushing,Cleaning,Irrigation
Water reuse standardsof EPA, EU,
WHO, Turkey[114]
Aerobic submergedMBR (pilot plant,
6 months)
Feed: hotel greywaterUF: 0.04 µm, hollow fiber
Flux: 20 L·m−2·h−1
COD: 41–500 mg·L−1
BOD5: 36–295 mg·L−1
TN: 2.6–25 mg·L−1
Ammonia N: 0.3–14 mg·L−1
TP: 0–6.7 mg·L−1
Total count: 1.5 × 10⁷–4.1 × 107 CFU·100 mL−1
Total coliforms: 1.4 × 10⁶–4.1 × 106 CFU·100 mL−1
E. coli: <1.1 × 106 CFU·100 mL−1
COD: <36 mg·L−1
TN:<10 mg·L−1
Ammonia N: <8 mg·L−1
Total count: 5.8 × 10³–1.6 × 105 CFU·100 mL−1
Total coliforms: 0.27 × 10²–2.1×102 CFU·100 mL−1
E. coli: <1.1 × 102 CFU·100 mL−1
Intestinal Enterococci /Nematodes:<1 CFU·100 mL−1
Legionella spp.: <1 CFU·100 mL−1
Non-potable reuse Spanish waterreuse standard [149]

Membranes 2020, 10, 131 18 of 54
Table 8. Cont.
Membrane Process(Scale and
Operating Duration)Operating Conditions Feed Characteristics Permeate Quality/Removal Rate
(in Average)Application for
Reuse Standard Basis References
Aerobic MBR(External):
Pilot plant for162 days
Feed: urban wastewaterUF: 0.02 µm/300 kDa
Flux: 75–150 L·m−2·h−1
HRT: 5 dSRT: 5–30 days
COD: 200–800 mg·L−1
SS: 100–600 mg·L−1
NH3-N: 10–30 mg·L−1
Coliform: 105–106·L−1
Turbidity: 50–70 NTUpH: 7.5–8.5
COD: 9.4 mg·L−1, 97%;SS: nd, 100%;
NH3-N: 0.2–1.3 mg·L−1, 96.2%;Turbidity: <2 NTU
Coliform: ndpH: 8.2
Directly for municipalpurposes or indirectly
for industrialuses after
additional treatment
Water reuse standardof China [117]
Vertical submergedMBR (pilot scale for
600 days)
Feed: municipal wastewaterin Korea
UF: 0.45 µmFlux: 6.2 L·m−2
·h−1
HRT: 8 hSRT: 60 days
COD: 232 ± 41 mg·L−1
TSS: 220 ± 52 mg·L−1
TN: 42 ± 5 mg·L−1
TP: 3.2 ± 0.4 mg·L−1
Volatile fatty acids: <1.0 mg·L−1
pH: 7.3 ± 0.1Alkalinity as CaCO3:
145 ± 47 mg·L−1
COD: 9.0 ± 3.6 mg·L−1, 96%TSS: 220 ± 52 mg·L−1
TN: 10.6 ± 2.6 mg·L−1, 74%TP: 0.7 ± 0.2 mg·L−1, 78%
Total colony counts: 24 CFU·mL−1
Turbidity: 0.18 NTU,pH: 7.3
Urban or rural reuse,such as toilet flushing,
sprinkling andcar washing
Drinking waterstandards of Korea
and the WHO[150]
HRT: hydraulic retention time; SRT: solids retention time; nd: not detected.

Membranes 2020, 10, 131 19 of 54
2.4. NF/RO/FO-Based Treatment Processes for Water Reuse
Nanofiltration (NF) or reverse osmosis (RO) have been recognized as an effective means providingsafe and reliable source of water supplies for both potable water and non-potable water purposes [79].NF/RO technologies are outstanding in wastewater reuse applications, especially in potable reuselevels, because NF/RO can eliminate effectively organic micropollutants which are the most concernsby humans, such as endocrine-disrupting compounds, pharmaceutically active compounds, pesticides,disinfectant by -products, trace organics, etc. [151,152]. In addition, the processes of NF or RO areboth highly capable of reducing turbidity, TSS, color, COD and TOC completely from the feed water.In addition, NF/RO processes also show significant removal efficiency on conductivity, TDS, alkalinity,salinity, hardness and ions from the feed which can be of particular interest for irrigation and potablepurposes. Due to the difference of membrane resistances, the pressure driving force and energycosts are lower for NF compared to RO. In addition, forward osmosis (FO) is a promising membranetechnology in the wastewater treatment field using a similar membrane to RO or NF membranes, but anosmotic pressure difference as a driving force [153–155]. Like the RO membrane, the FO membranecan guarantee a high rejection rate of solute, heavy metal and micropollutants [156,157]. Detailedinformation on NF, RO and FO for municipal wastewater reuse will be provided in the next paragraphs.
For NF removal efficiency, the separation characteristics of NF include pore-size steric mechanism(convective flow), solution–diffusion mechanisms and electrostatic interactions [63]. In addition to thesubstances that can be removed by MF/UF, high removals of constituents such as dissolved solids,dissolved salt ions, organic carbon, inorganic ions, and other organic compounds can be achieved byNF due to tiny pore sizes [45,158]. NF especially provides high rejection of divalent and multivalentions, such as sodium sulfate, while it also permeates parts of monovalent ions (such as sodium chloride)through the membrane [63]. For example, Dalar et al. [159] demonstrated that the coupled MBR andNF system could remove almost all divalent and multivalent ions, such as PO4
3− and SO42−, but only
removed less than 60% monovalent ions, such as NO3−, Na+ and Cl−. Similarly, Bunani et al. [160]
reported that the permeate produced by different NF membranes both contained less than 10 mg·L−1
divalent ions (Ca2+, Mg2+ and SO42−), but contained concentrations higher than 206 mg·L−1 for Cl−,
134 mg·L−1 for Na+, 31 mg·L−1 for HCO3−. However, if comparing the Ca2+ removal efficiency by NF
in Table 9, as in the work of Dolar et al. [159], the removal efficiency of Ca2+ seems less compared withother divalent ions, such as SO4
2− and Mg2+. Actually, ion rejection by NF membranes depends on thecombination of electrostatic and steric interactions associated with charge shielding, Donnan exclusionand the degree of ion hydration [161]. In addition, rejection mechanisms by NF highly depend onmembrane properties, physicochemical properties of solutes and feed characteristics (such as ionscontent, pH, organic matter concentration, etc.).
Whereas RO was originally conceived of as a method of producing potable water from the seaor brackish sources from the 1960s, the technology now is also widely applied on a large scale inmunicipal wastewater treatment and reuse [162,163]. The rejection mechanism of RO includes sizeexclusion, charge exclusion and physical–chemical interactions between solute and solvent [164,165].As expected, RO retention capacities are better than NF due to its almost nonporous nature, reflected inhigher removal of organic compounds, monovalent ions, TDS and conductivity [159,166,167]. As listedin Table 9, the conductivity removal by NF is usually effective, but not completely, ranging between40% and 90%, while RO shows excellent separation performance on almost complete salinity removal.For example, Falizi et al. [168] designed parallel filtration tests with both NF and RO in order to find amore optimized method to reuse wastewater on agricultural irrigation, the results proved that ROcould remove conductivity, TDS and various ions significantly while NF showed relatively lowerremoval efficiency. In addition, Shanmuganathan et al. [88] selected several NF and RO to filtrate themicrofiltered and biologically treated sewage water. NF alone on monovalent ions removal couldonly reduce < 5% of NO3
−, < 20% of Cl− and Na+ from the feed, while RO showed high rejectionability on monovalent ions with > 88% removal of all ions. Similar removal results were also obtainedfor micropollutants, such as pharmaceuticals and personal care products (PPCPs) of which the RO

Membranes 2020, 10, 131 20 of 54
process showed a wide range of higher rejection rate (from 10% to 60%) than NF [88]. The same resultscould also be proved by Gündogdu et al. [169]. However, it should be noted that some NF and ROmembranes materials are selective in removing micropollutants probably related to their rejectionmechanisms [170]. For instance, the removal efficiency diminished considerably for micropollutantswith a neutral or positive charge, of which the removal through RO was near 100% for naproxen, versus20% for acetaminophen (neutral) and 60% for atenolol (positive) [171]. In addition, Simon et al. [172]assessed the adsorption of ibuprofen by NF and RO membranes was directly linked to the electrostaticrepulsion among the pollutant, membrane and the solution’s pH. According to Shanmuganathanet al. [88], the diffusion phenomenon degrades the membrane’s efficiency in removing substancesby adsorption.
However, due to their tiny and/or nonporous characteristics, the requirements of feed water forNF and RO membranes are relatively higher than MF and UF, because even small particles such asthe NOM and submicron particulates in the feed are prone to cause severe fouling problems on thesemembranes [173,174]. In particular, biofouling, the irreversible adhesion on a membrane caused bymicroorganisms and the extracellular polymers, has been considered as the main obstacle duringlong term NF/RO operation [174–177]. In order to improve filtration performance, pretreatmentprocesses ahead of NF/RO are required to reduce the potential of fouling development [79,178].Pretreatment can prolong membrane lifespan and save costs, with the capacity to remove more organiccompounds comprised of the soluble microbial products and extracellular polymeric substances.Conventional pretreatment processes before NF or RO consist of sedimentation, clarification,coagulation and flocculation, scale inhibition, activated carbon adsorption, dual media filter ordissolved air flotation [179]. However, it is more common to apply non-conventional pretreatmentprocesses ahead of NF/RO, such as MF, UF and MBRs [177,180]. Some review papers [79,180] suggestedthat the non-conventional pretreatments were more effective than the conventional pretreatments forproducing better water quality, despite biofouling attack and for minimizing the overall treatmentcost. Notably, before NF/RO processes, the pretreatment with MF, UF, MBRs would be more efficientfor fouling control than with cartridge (~10 µm) pretreatment which enable colloids and suspendedparticles to pass through membranes [181]. Table 9 summarizes the NF/RO-based membrane treatmentstudies applied to municipal wastewater reuse and most of them using non-conventional pretreatmentprocesses before NF/RO. For example, MF could definitely provide better water quality improvementtogether with expenditure saving compared with lime pretreatment, as MF can reduce microbialcontamination thereby reducing the rates of fouling and biofilm formation in subsequent RO [68].Municipal wastewater treatment by hybrid pretreatment with NF/RO processes improves the producedwater quality to potable reuse level. For instance, the hybrid MBR with NF or RO treatment systemcould both significantly remove all organic compounds investigated in this study with over 95%removal efficiency for all, thus producing an adequate permeate for indirect drinking water reuse [182].Similar results were also reported by Jacob et al. [183] with the combination of MBR and NF/RO systemand by Garcia et al. [152] with the combined MF and NF/RO system. Despite the fact that MBR is mostcommonly designed with MF or UF membranes, an innovative MBR designed with NF membranewas used before RO in the work of Tay et al. [184], the results showed that NF–MBR process providedhigher organic/inorganic removal and the calculated energy consumption proves the feasibility ofthe NF–MBR+RO system for higher recovery water reclamation, compared to UF–MBR+RO system.This will be further discussed in Section 2.5. Besides having the advantages of energy recovery byAnMBRs, as stated in Section 2.3, the combination of AnMBR and RO systems could achieve waterreuse with direct energy recovery from municipal wastewater with minimized sludge production andsignificant energy savings [145,185]. As technology advances, innovative technologies occur in thepretreatment field to enhance filtration performance and overcome difficulties for specific conditions,as for example in Singapore. Gu et al. [185] proposed an AnMBR+RO+ion exchange (IE) system totreat raw municipal wastewater for NEWater production. Here, the NEWater represents the high-gradereclaimed water produced from treated used water that is purified further using advanced membrane

Membranes 2020, 10, 131 21 of 54
technologies, making the water ultra-clean and safe to indirect potable reuse in Singapore [22]. In thisprocess, AnMBR removed 95.6% influent COD and converted 76.8% of COD to methane equivalentto 48% of the total energy the system consumed. RO rejected more than 95% of organic carbon,ammonium, phosphate and major ions from AnMBR effluent. Finally, IE was performed as a furtherpolishing step mainly to remove residual ammonium under 1 mg·L−1 to meet the NEWater qualityrequirements for industrial and indirect potable use. This proposed process was estimated to reduce68.3% of net energy consumption compared to the current process (secondary treatment + MF + RO)for NEWater production, together with a significant space saving [186].
Forward osmosis (FO) also called as direct osmosis is a new membrane-separation processin which water moves spontaneously across a semi-permeable membrane from the feed solution(lower osmotic pressure) side to the draw solution (higher osmotic pressure) side [157,187]. Differentfrom the pressure-driven membranes, FO is an osmotically driven technology operated at very low oreven non-hydraulic pressure during wastewater treatment [188]. Compared to NF/RO, FO membraneshave a lower membrane fouling potential due to loose formation and less compaction of cake foulantsin the absence of hydraulic pressure [189]. When fouling occurs, it is readily reversible comparedto pressure-driven membrane processes [190]. Kwan et al. [191] compared the biofouling formationon FO and RO with the same feed water, the results showed that FO biofilms grew in a looselyorganized thick layer with lower hydraulic resistance to water flow and slower flux decline, while RObiofilms grew in tightly organized layer with a larger amounts of EPS per cell resulting in greaterbiofilm-enhanced osmotic pressure and hydraulic resistance to water flow. FO membranes presenthigh contaminant rejection rates, high flux recovery after cleaning and high water recovery usinglow-grade energy resources [192,193]. However, one of the key factors on FO performance is thechoice of an appropriate draw solution which should be characterized by high osmotic pressuregeneration, inexpensive, non-toxic to the environment and efficient regeneration [194]. It shouldbe noted that when applying FO processes to wastewater treatment, further treatment is requiredto simultaneously separate product water for reuse and recover draw solution [195,196]. One ofthe most common combinations is the hybrid FO-RO system, in which the inlet wastewater firstlydiffuses into high concentrated draw solution through the FO membrane, and then the diluteddraw solution will be filtered by RO to separate water production and continuously reconstitutethe draw solution [192]. In the hybrid process, FO is likely performed as a high-level pretreatmentprocess which produces minimum fouling on RO than the other non-conventional pretreatments.The other combinations include hybrid forward osmosis with membrane bioreactors (FO–MBR),membrane distillation (FO-MD) and nanofiltration (FO–NF) which are promising technologies forwastewater reuse [197]. FO–MBR, also called osmosis membrane bioreactor (OMBR), is a newlyemerging technology for water reuse in recent years. OMBR combines activated sludge treatmentwith FO membrane separation, usually followed by a post-treatment, such as RO [198]. In OMBRoperation, feed water is extracted from the mixed liquor into the highly concentrated draw solution bythe forward osmosis (FO) process, then organic matters and bacteria can be retained in the bioreactorand thus increase their biodegradation during operation [190,199]. FO–AnMBR system can producemethane during wastewater treatment, with conversion rates probably between 0.2–0.3 LCH4. gCOD
−1
in lab studies. [195]. This methane production can act as an energy supplement during wastewatertreatment processes. Membrane distillation (MD) is an effective process for draw solution reconcentrateand permeated water recovery after the FO process, especially for high salinity separation from feedwastewater [189,200]. As reported by Husnain et al. [201], the FO–MD system could be operated at astable and equal water flux for both FO and MD membranes over long-term experiments, together withmore than 3 logs (>99.9%) removal of ammonium, COD, arsenic and combined solutes in both syntheticand real wastewaters. According to Corzo et al. [197], a hybrid FO using magnesium chloride as drawsolution with NF system successfully produced reused water for agricultural irrigation with stablepermeability and low membrane fouling during long term operation. However, the weakness of thesystem was over 40% higher energy consumption than a traditional UF-RO system, mainly due to draw

Membranes 2020, 10, 131 22 of 54
solution loss. Giagnorio et al. [202] proved the potential implementation of a hybrid FO–NF system onwastewater reuse, with a 85% water recovery. Interestingly, when using seawater as draw solution,it is possible to make desalination and wastewater treatment at the same time [196,203]. For example,a FO–RO system stated by Volpin et al. [193] used seawater as a draw solution to filter secondaryeffluent which led to reduced seawater osmotic pressure, thereby reducing the operating pressureof the RO to desalinate the diluted seawater. This FO–RO hybrid process achieved both wastewaterreclamation and seawater dilution. Another popular process, OMBR–RO, is also recommended forthis purpose. Compared to conventional MBR–RO, Luo et al. [190] confirmed that OMBR–RO processnot only prevented the downstream RO process from severe membrane fouling, but also reduced theneed for RO concentrate disposal, thus reducing energy consumption for seawater desalination andwastewater recovery. From the economical assessment, FO supports lower costs during treatment.For example, Cornelissen et al. [198] calculated a 18–23% cost savings by OMBR–RO system comparedby conventional MBR–RO for wastewater reuse, with the following operating conditions: a fluxof 20 L m−2 h−1 at TMP of 0.1 bar on MBR and a flux of 15 L m−2 h−1 at TMP of 14.5 bars on RO(MBR–RO); a flux of 20 L m−2 h−1 at 0.5-M NaCl on FO and a flux of 30 L m−2 h−1 at TMP of 31.7 barson RO (FO–RO). Therefore, lower desalination energy demand and lower water augmentation canbe achieved while delivering safe water for direct potable reuse due to the double dense membranebarrier protection.
Compared with the MF/UF/MBR based treatment processes, there are more research articleson wastewater reuse focusing on NF/RO processes. After all, the choice of a membrane systemshould be based on feed water quality and its application purpose to forego unnecessary expenses.For example, because NF or RO membranes have high removal ability on alkali, salinity and otherorganic and inorganic ions, the direct permeate decreases the soil permeability, loses pH balanceand nutrients balance necessary for plant growth which is not a positive for irrigation reuse [204].In this situation, many studies blend NF/RO permeate with less treated wastewater to produce waterviable for irrigation and improve the reuse rate of treated wastewater at the same time [168,204,205].Although FO is developing fast recently, there are not many related reports and cases on the applicationof municipal wastewater treatment and reuse. One of the key challenges to accomplish sustainablewater recovery in FO is the separation and recovery of draw solutes, which accounts for most of theenergy consumption [188]. In future research, the regeneration of draw solutes should be accomplishedwithout using energy-intensive processes like RO. In addition, researches should also focus on theideal membrane material, the mechanisms of membrane fouling and the cleaning strategies.

Membranes 2020, 10, 131 23 of 54
Table 9. Nanofiltration (NF)/reverse osmosis (RO)/ forward osmosis (FO) coupled with pretreatment processes for wastewater reuse applications.
Process (Scale andOperation Duration) Feed Water Operating
Conditions Feed Characteristics Final permeate quality(Removal Rate)
Applicationfor Reuse Standard Basis References
(Biologic methods) + NF(lab scale, 6 h)
Bio-treatedmunicipal
wastewater
TMP: 10 barNF: 150 Da (CA),200 Da (PTFC),
flat sheet
TDS: 3150–3908 mg·L−1
EC: 6303–7815 µS·cm−1
pH: 8.13–8.34Salinity: 3.51–4.17 g·kg−1
Turbidity: 0.15–0.39 NTUNa+: 1018–1091 mg·L−1
Ca2+: 195–218 mg·L−1
K+: 80.3–96.8 mg·L−1
Mg2+: 134–150 mg·L−1
NH4–N: 0.10–0.11 mg·L−1
HCO3−: 408–440 mg·L−1
SO42−: 261–299 mg·L−1
Cl−: 1834–1848 mg·L−1
PO4–P: 2.10–2.28 mg·L−1
NO3–N: 8.55–8.65 mg·L−1
NO2–N: 0.21–0.22 mg·L−1
Si: 10.5–12.5 mg·L−1
COD: 29.8–30.5 mg·L−1
Color: 21.1–22.3 HazenTOC: 13.7–16.5 mg·L−1
TDS: 340–1150 mg·L−1
EC: 690–2300 µS·cm−1
pH: 7.59–7.60Salinity: 0.34–1.16 g·kg−1
Turbidity: <0.02 NTUNa+: 134–353 mg·L−1
Ca2+: 0.54–7.12 mg·L−1
K+: 14.5–30.7 mg·L−1
Mg2+: 0.41–4.8 mg·L−1
NH4–N: 0.06–0.07 mg·L−1
HCO3−: 31–57.2 mg·L−1
SO42−: <0.05 mg·L−1
Cl−: 206–572 mg·L−1
PO4–P: <0.05 mg·L−1
NO3–N: 3.75–5.63 mg·L−1
NO2–N: 0.06–0.07 mg·L−1
Si: 4.07–4.75 mg·L−1
COD: 4.49–7.18 mg·L−1
Color: 1.85–2.1 HazenTOC: 1.7–3.34 mg·L−1
Irrigation FAO Irrigation andDrainage Paper [160]
Submerged MBR+ NFMunicipal
wastewater afterprimary treatment
UF: 200 kDa,hollow fiber
NF: 150–300 Da,TMP: 0.1–0.5 bar (UF);
41 bar (NF)
(raw wastewater)EC: 1174 ± 2 µS·cm−1
pH: 7.22 ± 0.11TSS: 488 ± 48 mg·L−1
Turbidity: 248 ± 11 NTUDOC: 126.6 ± 7.3 mg·L−1
COD: 478 ± 132 mg·L−1
F−: 0.096 ± 0.003 mg·L−1
Cl−: 156.0 ± 2.4 mg·L−1
NO2−: 64.35 mg·L−1
NO3−: 144.53 ± 42.17 mg·L−1
PO43−: 9.631 ± 1.428 mg·L−1
SO42−: 36.33 ± 0.84 mg·L−1
Na+: 71.14 ± 0.48 mg·L−1
K+: 11.85 ± 0.14 mg·L−1
Mg2+: 22.05 ± 0.04 mg·L−1
Ca2+: 110.7 ± 0.2 mg·L−1
SAR: 1.61 ± 0.01
EC: 397 µS·cm−1
pH: 8.06TSS: 0 mg·L−1
Turbidity: 0.23 NTUDOC: 0.35 mg·L−1
COD: < 5 mg·L−1F−: n.a. mg·L−1
Cl−: 63.77 mg·L−1
NO2−: 0.3728 mg·L−1
NO3−: 63.1 mg·L−1
PO43−: n.a. mg·L−1
SO42−: 0.464 mg·L−1
Li+: ndNa+: 38.01 mg·L−1
NH4+: nd
K+: 5.9 mg·L−1
Mg2+: 3.04 mg·L−-1
Ca2+: 29.9 mg·L−1
SAR: 1.77
AgriculturalIrrigation (50% ofMBR effluent and
50% ofNF permeate)
WHO andFAO guidelines [159]

Membranes 2020, 10, 131 24 of 54
Table 9. Cont.
Process (Scale andOperation Duration) Feed Water Operating
Conditions Feed Characteristics Final permeate quality(Removal Rate)
Applicationfor Reuse Standard Basis References
NFMBR effluent from
domesticwastewater
Lp0: 6.2L·m−2
·h−1·bar−1
TMP: 8 bar
UV254 nm: 0.148–0.155UV210 nm: 1.579–3.207TOC: 6.0–8.0 mg·L−1
COD: 12–13 mg·L−1
TSS: <2 mg·L−1
Mg2+: 8.9–9.8 mg·L−1
Ca2+: 25.0–28.4 mg·L−1
EC: 631–894 µS·cm−1
UV254 nm >95%UV210 nm: 75–81%
TOC: 82–95%EC: 92–94%
Not mentioned Not mentioned [166]
UF+NF
Syntheticmunicipal
wastewater afteraerobic activatedsludge process
UF: 30 kDa, PESNF: 270 Da, PATMP: 1–6 bar
COD: 243.34 mg·L−1
TP: 7.53 mg·L−1
NH3–N: 0.67 mg·L−1
NO2-N: 4.32 mg·L−1
NO3–N: 34.43 mg·L−1
COD: 3.68 mg·L−1
TP: 0.19 mg·L−1
NH3–N: 0.14 mg·L−1
NO2-N: 0.14 mg·L−1
NO3–N: 1.37 mg·L−1
Inner industrialreuse,
Garden irrigation
China municipalwater reusestandards
[206]
Forward osmosis (FO)+ NF
Secondary effluentfrom WWTP
Flux:2.4 L·m−2
·h−1 for FOFlux: 3.3 or
6.6 L·m−2·h−1 for NF
E. coli: 0 CFU·100 mL−1
TSS: <1 mg·L−1
Turbidity: 0.22 NTUEC: 5.33 dS·m−1
SAR: 10.6 meq·L−1
B: 1.17 mg·L−1
Arsenic: 0.0015 mg·L−1
Chrome: 0.0041 mg·L−1
Copper: 0.002 mg·L−1
Manganese: 0.018 mg·L−1
Molybdenum: 0.002 mg·L−1
Nickel: 0.0016 mg·L−1
Selenium: <0.004 mg·L−1
Conductivity: 1 mS·cm−1
B: <0.4 mg·L−1
SAR: 1.98 meq·L−1
Agriculturalirrigation
Spanish waterreuse legislation(RD1620/2007)
[197]
OMBR + RO Syntheticwastewater
FO: flat sheet,thin-film composite(TFC), 0.5-M NaCl
draw solution.RO: flat sheet, TFC,
polyamideFlux: 4–8 L·m−2
·h−1
Glucose: 100 mg·L−1
Peptone: 100 mg·L−1
KH2PO4: 17.5 mg·L−1
MgSO4: 17.5 mg·L−1
FeSO4: 10 mg·L−1
CH3COONa: 225 mg·L−1
Urea: 35 mg·L−1
31 TrOCs: 5 µg·L−1
for each TrOC
The system achieved the effectiveremoval of bulk organic matter,nutrients and almost completeremoval of all 31 trace organic
contaminants investigated
Not mentioned Not mentioned [190,207]

Membranes 2020, 10, 131 25 of 54
Table 9. Cont.
Process (Scale andOperation Duration) Feed Water Operating
Conditions Feed Characteristics Final permeate quality(Removal Rate)
Applicationfor Reuse Standard Basis References
NF and/or RO(Semi-batch, 60 d)
Microfiltered,biologically
treatedsewage effluent
MF: 0.14 µm, flat sheetNF: 700 Da, flat sheet,
4 barRO: 100 Da
pH: 6.8–7.6EC: 520–1120 µS·cm−1
DOC: 3.6–7.7 mg·L−1
SAR: 39F−: 0.7–1.1 mg·L−1
Cl−: 150–300 mg·L−1
NO3−: 1.0–1.3 mg·L−1
PO43–: 0.74–0.99 mg·L−1
SO42−: 49–51 mg·L−1
Na+: 81–120 mg·L−1
K+: 15–21 mg·L−1
Ca2+: 21–40 mg·L−1
Mg2+: 10–15 mg·L−1
BO33−: 0.04–0.06 mg·L−1
Blending NF permeate and ROpermeate at ratio of 50: 50.
DOC: 95 ± 2%(NF), >99% (RO)
SAR: 8Na+: 57 mg·L−1
Cl−: 109 mg·L−1
Ca2+: 7 mg·L−1
Mg2+: 5 mg·L−1
K+: 6 mg·L−1
S: 0.5 mg·L−1
NO3−: 7 mg·L−1
B: <0.1 mg·L−1
PPCPs (12 types): <57 ng·L−1 perPPCP with NF; all <5 ng·L−1 perPPCP with RO, except caffeine
39 ng·L−1
Irrigation
Australian andNew ZealandGuidelines for
Fresh and MarineWater Quality
[88]
ROMBR effluent from
domesticwastewater
TMP: 4–12 barsInitial Permeability:3.6 L·m−2
·d−1·bar−1
UV254 nm: 0.148–0.155UV210 nm: 1.579–3.207TOC: 6.0–8.0 mg·L−1
COD: 12–13 mg·L−1
TSS: <2 mg·L−1
Mg2+: 8.9–9.8 mg·L−1
Ca2+: 25.0–28.4 mg·L−1
EC: 631–894 µS·cm−1
UV254 nm > 95%UV210 nm: 90–97%
TOC: 91–98%EC: 96–98%
Not mentioned Not mentioned [166]
MBR/MF + RO Degritted sewage
Flow rate:MBR: 40 m3
·d−1;MF: 0.4 µm
RO: 19 m3·d−1
TSS: 201 mg·L−1
BOD5: 198 mg·L−1
COD: 391 mg·L−1
TKN: 43 mg·L−1
Nitrate N: 0.2 mgN·L−1
TDS: 337 mg·L−1
pH: 7.2Color: 133 Hazen
Alkalinity: 179 mg·L−1
Si: 12 mg·L−1
Turbidity: 59 NTUE. coli: 4.1 × 107CFU·100 mL−1
Virus: 6.2 × 104 PFU·100 mL−1
Total Estrogens: 182 µg·L−1
TSS: <2 mg·L−1
BOD5: <2 mg·L−1
COD: <2 mg·L−1
TKN: 0.1 mg·L−1
Nitrate N: 0.9 mgN·L−1
TDS: 42 mg·L−1
pH: 5.4Color: <1 Hazen
Alkalinity: 5.1 mg·L−1
Si: 0.5 mg·L−1
EC: 27µS·cm−1
E. coli: ndVirus: nd
Total Estrogens: 4.7 µg·L−1
Both for potableand non-
potable reuse
USEPA andWHO guidelines [118]

Membranes 2020, 10, 131 26 of 54
Table 9. Cont.
Process (Scale andOperation Duration) Feed Water Operating
Conditions Feed Characteristics Final permeate quality(Removal Rate)
Applicationfor Reuse Standard Basis References
MF+ROSecondary treated
effluentfrom sewage
MF: 26 m3·d−1; 0.4 µm
RO: 19 m3·d−1
TSS: 2 mg·L−1
BOD5: 3 mg·L−1
COD: 23 mg·L−1
TKN: 3.1 mg·L−1
Nitrate N: 4.7 mgN·L−1
TDS: 364 mg·L−1
pH: 7.2Color: 44 Hazen
Alkalinity: 71 mg·L−1
Si: 11.7 mg·L−1
Turbidity: 0.6 NTUE. coli:
2.8 × 105 CFU·100 mL−1
Virus: 97 PFU·100 mL−1
Total Estrogens: 38 µg·L−1
Odor: 2
TSS: <2 mg·L−1
BOD5: <2 mg·L−1
COD: <2 mg·L−1
TKN: 0.3–0.4 mg·L−1
Nitrate N: 0.71–1.43 mgN·L−1
TDS: 17–24 mg·L−1
pH: 5.3–5.5Color: <2.5 Hazen
Alkalinity: 2.7–3.3 mg·L−1
Si: 0.3–0.7 mg·L−1
EC: 24–33µS·cm−1
E. coli: ndVirus: nd
Total Estrogens: <4.4 µg·L−1
Odor: 1
Both for potableand non-
potable reuse
EPA andWHO guidelines [118]
MBR+RO (pilot scale,112 days)
Primary municipalwastewater
UF: 0.04 µm, hollowfiber.TMP: 0.42 bar(UF), 15.2 bar (RO)
TSS: 100–1930 mg·L−1
Turbidity: 7–308 NTUCOD: 122–2205 mg·L−1
DOC: 2.12–10.21 mg·L−1
(after MBR)UV254: 0.30–4.00
TN: 12.6–205 mg·L−1
Pb: 1–16 µg·L−1
Ni: 1–33.7 µg·L−1
Cu: 1–1345 µg·L−1
Cr: 1–746 µg·L−1
TSS: <1 mg·L−1
Turbidity: 0.01–0.13 NTUCOD: <32 mg·L−1
DOC: 1.04–4.1 mg·L−1
UV254: 0.001–0.01TN: 17–21 mg·L−1
Pb: <1 µg·L−1
Ni: <1 µg·L−1
Cu: <1 µg·L−1
Cr: <1 µg·L−1
Not mentioned Not mentioned [208]
AnMBR+RO(lab scale)
Syntheticmunicipal
wastewater
Flux:20 L·m−2
·h−1
COD: 400 mg·L−1
NH4+-N: 45 mg·L−1
PO43−-P: 5 mg·L−1
NaHCO3: 500 mg·L−1
CaCl2·2H2O: 45 mg·L−1
MgSO4·7H2O: 20 mg·L−1
FeSO4·7H2O: 20 mg·L−1
FeCl3·7H2O: 1.5 mg·L−1
Ammonium-N: 2.1 mg·L−1
Phosphate–P: 0.03 mg·L−1
TOC: 0.13 mg·L−1
Sodium: 3.2 mg·L−1
Potassium: 0.084 mg·L−1
Calcium: 0.05 mg·L−1
Iron: <0.005 mg·L−1
Chloride: 4.7 mg·L−1
Sulfate: 0.5 mg·L−1
Conductivity: 47 µS·cm−1
Discharge toreservoirs for
indirectlypotable reuse
Guidelines forNEWater
in Singapore[185]

Membranes 2020, 10, 131 27 of 54
Table 9. Cont.
Process (Scale andOperation Duration) Feed Water Operating
Conditions Feed Characteristics Final permeate quality(Removal Rate)
Applicationfor Reuse Standard Basis References
AnMBR + RO(lab scale)
Simulation ofmunicipal
wastewaterUF: 0.02 µm
Sucrose: 210 mg·L−1
Meat extract: 41.7 mg·L−1
Peptone: 60 mg·L−1
NH4Cl: 95.5 mg·L−1
KH2PO4: 22 mg·L−1
CaCl2·2H2O: 10 mg·L−1
FeSO4·7H2O: 10 mg·L−1
MgSO4·7H2O: 10 mg·L−1
NaHCO3: 400 mg·L−1
TOC: 0.17 ± 0.02 mg·L−1
NH4–N: 0.81 ± 0.09 mg·L−1
Phosphate–P: <0.01 mg·L−1
Na+: 2.30 ± 0.12 mg·L−1
K+: 0.16 ± 0.01 mg·L−1
Ca2+: 0.04 ± 0.01 mg·L−1
Mg2+: <0.01 mg·L−1
Iron:<0.01 mg·L−1
Aluminum:<0.01 mg·L−1
Chloride: 2.35 ± 0.50 mg·L−1
Sulfate: 0.06 ± 0.01 mg·L−1
EC: 24.19 ± 1.21 µS·cm−1
NEWater productGuidelines for
NEWater inSingapore
[145]
NF–MBR+RO Municipalwastewater
NF: 200–300 DaFlux: 10 L·m−2
·h−1
MLSS:513 ± 96 mg·L−1
COD: 389.8 ± 169.9 mg·L−1
DOC: 48.3 ± 13.9 mg·L−1
Ca2+: 28.9 ± 3.5Mg2+: 7.9 ± 1.2 mg·L−1
Na+: 105.2 ± 6.9 mg·L−1
TN: 40.7 ± 6.1NH4–N: 40.9 ± 4.5 mg·L−1
NH3–N: ndPO4
3−: 23.6 ± 3.2 mg·L−1
EC: 859.5 ± 18.9 mS·cm−1
NF permeate:COD: 99.6 ± 0.8%
DOC: 0.5–2.5 mg·L−1,97.5% ± 1.8%
Biopolymer: ndHumic substances: 0.1 mg·L−1
Not mentioned Not mentioned [184]
SAR: sodium adsorption ratio; PPCPs: pharmaceuticals and personal care products; TKN: total Kjeldahl nitrogen; FAO: Food and Agriculture Organization; TrOCs: traceorganic contaminants.

Membranes 2020, 10, 131 28 of 54
2.5. Membrane-Based Treatments with Disinfection and Advanced Oxidation Processes for Water Reuse
Although membrane separation processes are available to produce qualified permeate at arelatively high level, even to potable reuse, the health risks still exist, because micropollutants arenot always completely removed and microorganisms can regrow during long-term transportation ofwater. In this condition, disinfection and advanced oxidation processes both as advanced technologies,are significantly effectively used as a supplementary process with membrane separation to eliminatethe non-rejected micropollutants and microorganisms completely and in a remanent manner.
Disinfection is the essential treatment for healthy water reuse by reducing TOC and inactivating ordestroying the pathogen microorganisms. The disinfection of water is usually carried out by physicalprocesses (such as UV) [209] or by chemical disinfectants or sanitizers (such as chlorine, chlorine dioxide,hydrogen peroxide, ozone and chloramines, etc.) or by a combined process. Although membraneseparation processes can reduce the microbial pathogens greatly, it is necessary to set up a disinfectionprocess for terminal and remanent treatment to ensure safe levels of pathogens in case of externalpollution of the effluent. The commonly used disinfection processes and their general performancesare listed in Table 10. Among these approaches, chlorination is considered as the most commondisinfectant in the form of gaseous chlorine, chloramines and sodium hypochlorite [210]. Chloraminesare moderately effective on the inactivation of bacterial pathogens, while gaseous chlorine and sodiumhypochlorite are both effective on the inactivation of bacterial and viral pathogens through generatingfree chlorine. Ozonation and UV processes are identified as more robust disinfection alternatives whenused against protozoa, although ozone even has limited efficacy against Cryptosporidium [211,212].According to De Sanctis et al. [213], although the investigated disinfection processes (UV and peraceticacid) had effective results for E. coli, somatic coliphages and total coliforms, they were both ineffectiveon C. perfringens spores conversely. Furthermore, the disinfectants used in chemical disinfection arerelatively strong oxidants that can transform organics to disinfectant byproducts (DBP) [214]. The DBPsof the chlorination process are quite complex and variable. Chloramine is similar to chlorine gas andchlorine except for cyanogen chloride. In contrast, UV radiation is a non-byproduct process, and theDBPs of chlorine dioxide are less complex than chlorination processes, which usually produce chlorite,chlorate and chlorides. The selection of disinfection methods should be associated with influentcharacteristics, effluent quality, disinfectant agent toxicity, byproduct formation, cost and the finalapplications [211].
Disinfection helps to improve removal efficiency on microorganisms that cannot be eliminatedby membrane processes, mainly MBR and MF or provide a disinfection remanent effect. Many casesof these combinations have been performed on water reuse applications, as showed in Table 11.In the combination of MBR with a post chlorination process described by Franca et al. [125] inmunicipal wastewater treatment, the chlorination of the permeate, after MBR, permitted furtherimprovement in microbiologic characteristics, but without any variation on its physicochemicalparameters. In practical applications, the managers always want to use disinfectants, mostlychlorination agents, with optimization on maximizing microorganism inactivation while minimizingthe formation of DBP that are challenging to remove in the advanced treatment train [215]. A newsequential chlorination process using short-term free chlorine and chloramine has been developed onwastewater reuse applications, resulting in quick microorganism inactivation by free chlorine, low DBPsproduction and long-term residual retention by chloramine [215–217]. Similarly, the disinfection processsequential UV with chlorine is also proposed on the wastewater reuse application. As reported byWang et al. [218], the treated permeate, after sequential UV/chlorine combination, could reduce the doseof chlorine, and decrease the genotoxicity from MBR–MF permeate, when compared to chlorinationalone. With pretreatment of 4 mJ·cm−2 UV, 1 mg·L−1 chlorine was sufficient to inactivate bacteriaunder the undetected level, while 5 mg·L−1 chlorine was needed for complete disinfection withoutUV dose. Therefore, increased UV dose leads to stronger damage to bacteria, which is beneficialfor chlorine disinfection efficiency with lower chlorine concentration. In addition, the combinationof various disinfection processes has attracted increased attention, because the combination would

Membranes 2020, 10, 131 29 of 54
include a wider range of pathogens, improve reliability through redundancy, reduce DBPs and savepotential cost. For instance, it was found by Haaken et al. [219] that electrolysis can prevent reactivationof bacteria, after UV irradiation, through electrochemical production of oxidants in biologicallytreated wastewater. As a result, the hybrid UV disinfection, with the electrolysis unit, could ensure areliable, sustained bacterial reduction and prevent the reactivation of reversibly damaged coliforms.In addition, Liberti et al. [220] recommended the combination of H2O2/Ag+ to be applied as anadvanced, long acting residual disinfectant for high quality effluents compared with H2O2/Cu2+. Thebactericidal activity (E. Coli tested) by a combined H2O2/Ag+ system could be additive—and improvedwith a pH and temperature increase—while the combination of H2O2/Cu2+ decreased both bactericidaland viricidal effects significantly because of the complexation of copper by organic matter whenapplied to tertiary effluent.
Advanced oxidation processes (AOPs) have been widely demonstrated to be reliable for wastewatertreatment since they have a high capacity to oxidize nearly all organic pollutants mainly throughthe generation of hydroxyl radicals (OH•) or SO4
2− [221]. Based on the review by Silva et al. [170],AOPs have been demonstrated to be highly effective in micropollutant removal. In fact, if thedisinfection processes described in Table 10 are considered as primary disinfection, AOPs can beconsidered as secondary disinfection or post-treatment disinfection [222]. Because some AOP designscan also play a role as disinfection, these AOPs become an integrated solution to some water qualityproblems [223]. For example, ozonation treatment of wastewater is well-known and used for bothdisinfection (taste and odor regulation, discoloration, germs and microorganism destruction) andoxidation (removal of micropollutants). Therefore, the application of AOPs stand out in degradationof micropollutants in both raw water and wastewater as well in the degradation of byproductsfrom primary disinfectants and in high oxidation potential [224,225]. The oxidation mechanism ofAOPs include 2 steps of oxidation: toxic pollution in feed is firstly oxidized into biodegradablecompounds, then oxidized into nontoxic compounds, such as water, carbon dioxide and inorganicsalts. The realization of AOPs commonly depends on separate or various combinations of commonlyused ozone (O3), hydrogen peroxide (H2O2), catalysts and ultraviolet light (UV) to produce •OHunder mild conditions (low temperature and pressure) [47]. Some other AOPs depend on ultrasonicirradiation, electrohydraulic cavitation, X-ray or gamma-ray radiolysis [222]. According to AOP-relatedreview articles, photolysis processes, ozone-based AOPs including ozonation, O3/UV, O3/H2O2 andO3/H2O2/UV, hydrogen peroxide-based methods (i.e., H2O2/UV, Fenton, Fenton-like, hetero-Fenton andphoto-Fenton), heterogeneous photocatalysis (TiO2/UV and TiO2/H2O2/UV systems) and sonochemicaland electrochemical AOPs (EAOPs) are the commonly used as single or combined types for AOPsin wastewater treatment [226,227]. Beyond the summaries, the innovative solar driven AOPs areattracting more attention recently, such as H2O2/sunlight, TiO2/sunlight, H2O2/TiO2/sunlight, naturalphoto-Fenton [228]. All of these showed possibilities in the purification of effluent from urbanwastewater plants for reuse. From these AOPs, ozonation, UV/ozone, UV/hydrogen peroxide andphotocatalysis are most frequently studied and utilized for many applications. Based on this information,the aim of this review is to report the applications, and the results that advances of AOPs in wastewatertreatment technologies have produced, with the purpose of providing insight towards the applicationof such technologies for efficient water reuse.
Currently, the combination of membrane filtration with AOPs is advantageous in wastewatertreatment since it enables us to permanently solve or alleviate the problems of membrane fouling,to remove more microorganisms and micropollutants from water—and to reduce the disposal ofgenerated concentrates during membrane separation [229]. Table 12 shows the performance ofmembranes combined with AOPs on wastewater reuse applications. The combination of AOPsmembrane filtration for municipal wastewater reuse are typically in two types: (a) pretreatmentprocess to degrade organic compounds in the membrane feed stream; (b) posttreatment process formineralization of non-rejected micropollutants in the permeate stream [226]. The use of AOPs onmembrane concentrates to reduce the discharge problem could also be an interesting option but

Membranes 2020, 10, 131 30 of 54
has not been studied yet in the field of municipal wastewater reuse. AOPs as the pretreatment stepbefore membrane processes are usually aimed at controlling membrane fouling potentials throughoxidation of organic matters and micropollutants. As described by Qi et al. [230], an integratedozone-biologic aerated filter system was shown to provide qualified effluent before the posttreatmentby UF–RO during wastewater treatment, which contributed to improving the end permeate quality,decreasing membrane fouling and decreased energy consumption. Indeed, when combining ozonewith the biologic method in wastewater treatment, ozone contributes to removing more COD, color,pathogens and increasing the biodegradability of the wastewater. H2O2/UV process before NFcould significantly remove organic compounds and micropollutants (pesticide alachlor and hydrogensulfide) in groundwater, thus mitigate the biofouling control and improve membrane cleanability [231].As stated by Ganiyu et al. [226], the commonly used AOPs for pretreatment of membranes areozonation and photolysis, with or without H2O2, while other AOPs, such as Fenton, photocatalysis andelectrochemical AOPs, are not available on oxidation of low concentration pollutants in large volumewater systems. AOPs as posttreatment of membrane processes are commonly used to complementmembrane filtration because of its benefits of disinfection and oxidation degradation, sometimessimultaneously. Especially when applied to reclaimed wastewater on directly or indirectly potablereuse, AOPs as the terminal process can reduce micropollutants, microorganisms and trace organiccontaminants that are non-rejected by membranes, under limited levels, for drinking water. Based onthe reused cases of membranes combined with AOPs in Table 12, UV/H2O2 is found to be the commoncombination of AOPs used as posttreatment. As reported in two studies [232,233], both of themconnected MF/RO processes with UV/H2O2 to treat secondary municipal wastewater for potable reuse,mainly aiming at eliminating the micropollutants, low molecular weight organic compounds, bacteriaand viruses in the effluent. The results showed the hybrid MF/RO with UV/H2O2 processes not onlyensure the effluent quality for potable reuse, but also contributes to the improvement by lowering,by 20%, economic cost and CO2 emission, than MBR or MF with UV/H2O2 process. While AOPs helpto improve membrane filtration performance, membranes, in contrast, contribute to better resultsof AOPs. AOPs and membrane separation complement each other. As Moser et al. [234] stated,the hybrid MBR + H2O2/UV + NF process resulted in a 20% savings of both operational expendituresand capital expenditures, compared to the MBR+H2O2/UV process on the same wastewater treatmentand provided good water quality for reuse. In addition, hybrid membranes with novel AOPs haveoccurred with favorable development potential. For example, the photocatalytic MBR is consideredto be a promising method for organic matter removal from municipal wastewater [235], additionally,a hybrid UV–C + MF process in Membrane Photoreactor has resulted in high removal efficacy forvarious pathogen germs with contact times as low as 8 s [236].
Although there are many reports focused on the hybrid membrane–AOPs processes on wastewatertreatment, the cases targeted at municipal wastewater treatment for reuse are fewer. The generaldisadvantages of AOPs include the relatively high operating costs and the limited large-scaleapplications of this very powerful technology. Although AOPs are effective in mineralizing mostorganic compounds, resulting in TOC decrease, in many cases they bring out harmful byproductsformation in the effluent [237]. AOPs are favorable in high removal efficiency on bacteria and viruses,but sometimes the reactivation of bacteria need to be controlled by disinfection before reuse. Therefore,another point worth mentioning is that even if the effluent is not toxic after various AOPs, it maybecome toxic after final disinfection (such as with chlorine) because interference from many emergingpollutants in wastewater could occur. Based on these unwanted reactions, the application of AOPsmay also lead to a TDS and/or TOC increase, which should definitely be removed before reuse [238].Therefore, the overall optimization of AOP (cost and water quality performance) needs to be improvedfor wastewater reuse treatment, especially for potable reuse. Most notably, NF or RO membranes,with excellent contaminant rejecting capacity, could reduce the reliance on AOPs, which would includea reduction in dosage requirements and total energy use.

Membranes 2020, 10, 131 31 of 54
Table 10. General effectiveness of commonly used disinfection processes [212,239].
Disinfection MethodEffectiveness of Inactivation By Products Secondary
Disinfection *Stability
Bacteria Viruses Protozoa
Chemical
Chlorination
Chlorine Cl2
++++ ++++ +
Trihalomethanes,Haloacetic acids,Haloacetonitriles,
Haloketones,Chloral hydrate,
Chloropicrin,Cyanogen chloride,
Chlorate,Chloramines
++++ stable
Sodium hypochlorite(NaClO)
Chloramines +++ ++ +
Dichloramines,Trichloramines,
Cyanogen chloride,Chloral hydrate
++++ stable
Chlorine dioxide(ClO2) ++++ ++++ +++
Chlorites,Chlorates,Chlorides
+++ unstable
Ozonation ++++ ++++ +++
BromateAldehydes
KetonesKetoacids
Carboxylic acidsBromoform
Brominated acetic acids
– unstable
Physical UV +++ ++ ++++ – – unstable
* Secondary disinfection: keep disinfection status in the water distribution system to prevent regrowth of pathogens. ++++: excellent; +++: good, ++: moderate; +: poor; -: noor non-function

Membranes 2020, 10, 131 32 of 54
Table 11. Combination of membrane processes with disinfection processes for wastewater reuse applications.
Process Feed for Disinfection Performance of Disinfection Applications References
MBR + Chlorination Secondary effluent ofmunicipal WWTP
Chlorination helps to inactive bacteria and residualviruses from MBR. Compared to the MBR permeate,
effluent after chlorination stands out at:complete removal on thermo-tolerant coliforms,
E. coli, Enterococci, F-RNA specific bacteriophagesand bacteriophages infecting Bacteroides fragilis;Increasing removal efficiency on total coliforms,
Fecal coliforms and Somatic coliphages for whichLRV are 1, 0.6 and 1.5, respectively, compared to
MBR permeate.
urban (e.g., street cleaning,vehicle washing) and
agricultural reuse.[125]
MBR + UV Raw Sewage
UV disinfection is proposed to provide an extrabarrier for
removal of pathogens, ensuring high-quality effluentstandards.
The hybrid process showed a high removal efficiency(90%) on most trace organic chemical contaminants.
Agriculture reuse [240]
Membrane filtered process +sequential chlorination
Tertiary effluent ofmunicipal WWTP
Sequential chlorination is beneficial to optimize freechlorine (virus and N-nitrosodimethylamine control)
and chloramine disinfection (trihalomethane,haloacetic acid and coliform control).
The increase of chlorine residual and the contacttime also increased the formation of unregulated
halogenated DBP classes.
Direct potable reuse [215]
MBR + sequential UV/chlorine Tertiary effluent ofmunicipal WWTP
Sequential UV/chlorine processes with a suitabledose of disinfectants decreased microorganism
concentrations below detection limits, includingheterotrophic plate count, total bacteria count and
total coliforms.The disadvantage is the byproducts produced by
disinfection (60.2 ug·L−1 Trihalomethanes).
Reclaimed water [241]

Membranes 2020, 10, 131 33 of 54
Table 11. Cont.
Process Feed for Disinfection Performance of Disinfection Applications References
Ozonation + MF Secondary effluent frommunicipal WWTP
Ozone helps to improve removal efficiency on color,COD, TN and turbidity in wastewater and lowerfouling potential on MF, but with less impact on
TP removal.Feed water quality:pH: 7.2 ± 0.61;
COD: 35.0 ± 8.15 mg·L−1
Turbidity: 1.53 ± 1.82 NTU; SS: 7.1 ± 5.9 mg·L−1;UV254: 0.095 ± 0.021 cm−1; DOC: 6.29 ± 1.53 mg·L−1;
Color: 30 ± 4 CU; T–P: 2.98 ± 1.68 mg·L−1;T–N: 11.1 ± 3.4 mg·L−1
Permeate:pH: 7.6; COD: 14–25 mg·L−1;
Turbidity: 0.61–0.87 NTU; Color: 2–3 CU;TP: 2.67–2.84 mg·L−1; TN: 6.2–7.9 mg·L−1
Wastewater reuse proposed bySouth Korean Ministry
of Environment[242]
Ozone + biologic activatedcarbon (BAC) + MF +UF
Secondary effluent frommunicipal WWTP
The combined O3/BAC/MF/RO train was effectivefor eliminating N-nitrosamines and the total
toxicity-weighted byproductprecursor concentrations
Potable reuse [243]
Sedimentation + UV/peraceticacid (PAA) /ozone (O3)
Secondary effluent frommunicipal WWTP in Italy
All three disinfectants can provide qualified effluentfor irrigation, according to WHO, with enough
contact time and quantity. Through comparison,UV physical disinfection showed extremely fastest
kinetics with contact time < 20 sec.
Irrigation proposed byWHO guidelines [220]

Membranes 2020, 10, 131 34 of 54
Table 12. Combination of membrane processes with advanced oxidation processes (AOPs) for wastewater reuse applications.
Process Feed for Disinfection Performance of AOPs Applications References
UV/S2O82− or UV/H2O2
RO concentrate in municipalwastewater recycling facilities
in California
3 Both AOPs were effective in significantly removing fourpharmaceuticals with 250 mJ·cm−2 average fluence
requirement. Specially, UV/S2O82− provides significantly
better performance treatment for some constituents.3 In the UV/H2O2 process, effluent organic matter coulddecrease ~75% of the OH•, reducing ~75% degradation
efficiency on the target contaminants.3 In UV/S2O8
2− process, although effluent organic matterdecreased ~93% of the SO4
2−, because daughter radicals Cl−
contributed to contaminant degradation, the reduction incontaminant degradation efficiency was only ~75–80%.
Discharge [244]
Biologicmedia filtration +
O3 + UV +Chlorination
Secondary treated wastewater
3 The whole process showed wide and high removalefficiency on various compounds (Nitrosamines,
Endocrine-disrupting chemicals, pharmaceuticals,herbicides, perfluorinated compounds, etc.),
which achieved more than 69% of total removal of mostcompounds (387 specific analytes).
3 Ozone significantly increased the degradation rate onmost contaminants.
3 However, ozonation caused some contaminant increases(N-nitrosodimethylamine, bisphenol, desisopropyl atrazine)
in the effluent and chlorination produced relatedbyproducts (Trihalomethanes, desmethyl atrazine,
chloral hydrate).
Reuse forirrigation, dual
recirculationand fire fighting
[245]
MF + RO + UV/H2O2
Secondary effluent fromconventional wastewater
treatment facility
3 UV/H2O2 process degraded the remaininglow-molecular-weight organic compounds
and micropollutants.3 UV-AOP increased the 6-log of virus removal credits after
RO treatment.3 The operation MF+RO+UV/H2O2 process accounted forabout 70–75% energy demand and 75–80% CO2 emission
compared to a UF osmosis MBR system, respectively,with the positive relationship with disposal pressure.
Potable reuse,Recharge to groundwater [232]

Membranes 2020, 10, 131 35 of 54
Table 12. Cont.
Process Feed for Disinfection Performance of AOPs Applications References
MF + RO + UV/H2O2secondary municipal
wastewater
3 UV/H2O2 provides good water quality for reuse,which significantly removed over 98% of each testedmicropollutant, including N-nitrosodimethylamine,
endocrine disrupting compounds, herbicides,pesticide (Metaldehyde) . . .
3 MF/RO+ UV/H2O2 was shown to be the mostcost-effective process, with around 20% lower operationalexpenditures than MF- UV/H2O2 without requirement in
RO concentrate disposal.
Potable reuse [233]
MF + Ozonation Treated greywater
3 The oxidation process improved the removal efficiency ofE. coli, total coliform, Salmonella and Staphylococcus,
from 30% after MF, to 100% after ozonation.3 All pathogenic microorganisms were removed at the
contact time range of 0–15 min with O3
Firefighting,plants irrigation, toilet
flushing and car washing[246]

Membranes 2020, 10, 131 36 of 54
2.6. Water Recovery and Energy Consumption of Membrane-Bases Processes for Water Reuse
The desired goal of researchers and companies on wastewater reuse treatment is to maximizeeconomic benefits and provide optimum parameters for long term stable operation during membranefiltration. Although many articles are published in the field of municipal wastewater reuse, most ofthem focus on the feasibility and innovation of the processes, the hydraulic performance, the removalefficiency and optimization of the processes. Less are focused on the real productivity, wastewaterrecovery rate, energy consumption or total cost during long term operations. Among all the referencesmentioned in the above tables of this review, only a few of them stated the relevant energy consumption,mostly estimated in pilot scales (Table 13). The water recovery rate from wastewater by membrane-basedtechnologies may be influenced by feed water characteristics, the permeate consumption by physicaland chemical cleaning and filtration time, etc. The net energy consumption may depend on thetreatment technologies, the chemical reagents consumption and other supplementary energy production(e.g., methane), etc.
Table 13. Wastewater recovery rate and energy consumption of membrane-based technologies.
Process Productivity Membrane Flux Recovery Rate Energy Consumption References
GAC + MF 30 L·m−2·h−1 98% [100]
UF (pilot plant,2 years) < 0.7 m3
·h−1 17–22 L·m−2·h−1 [81]
UF (pilot plant,two months) 7.7–9.0 m3
·h−1 330–380 L·m−2·h−1 82.3–96.5% (without
chemical cleaning) [77]
UF 1.0 m3·h−1 28.5 L·m−2
·h−1 About 85% (withoutchemical cleaning) [109]
MBR +disinfection 21.5 L·m−2
·h−1 <0.5 kWh ·m−3
(with productivity > 15 m3·d−1)
[149]
FO + NF0.16 (FO) and
0.187–0.35 (NF)m3·h−1
FO: 2.4 L·m−2·h−1; NF:
3.3 or 6.6 L·m−2·h−1 3.44–4.57 kWh ·m−3 [197]
RO 0.79 m3·h−1 65–75% (RO itself) [118]
RO 0.04 m3·h−1 50% (RO itself) [208]
NF–MBR + RO
MBR permeate flux:10 L·m−2
·h−1;RO permeate flux:
20 L·m−2·h−1
90% 0.739 kWh·m−3 [184]
UF–MBR + RO
MBR permeate flux:10 L·m−2
·h−1;RO permeate flux:
20 L·m−2·h−1
75% 0.732 kWh·m−3 [184]
MBR + RO 0.518 kWh ·m−3 [145]
AnMBR + RO
AnMBR permeateflux: 10–20 L·m−2
·h−1
RO permeate flux:20 L·m−2
·h−1
RO: 75%(RO itself)
0.333 kWh ·m−3 (considerenergy recoverywith methane)
[145]
AnMBR + RO+ IE
MF permeate flux:10 L·m−2
·h−1
RO: 20 L·m−2·h−1
RO: 75%(RO itself)
0.915 kWh·m−3
(total consumption);0.368 kWh·m−3 (consider
energy recoverywith methane)
[185]

Membranes 2020, 10, 131 37 of 54
From Table 13, low-pressure driven membrane technologies (MF, UF, MBR) support higherproductivity per unit area and present higher water recovery, with over 85% recovery rate. The waterrecovery for high-pressure driven membranes (NF, RO) and FO are relatively lower. Generally,the water recovery by RO itself (the percentage of permeate separated from the feed water) ranges from50–75% because the remaining 25–50% of the RO feed water is usually concentrated with waste [247].Some studies have reprocessed the RO concentrate for reuse. For example, the hybrid process ofRO- electrodialysis reversal by Venzke et al. [248] improved the water recovery from 75% to 87.3%,but the applied technology is complex with high energy consumption. In addition, although FO isadvantageous considering the operating pressures leading to low energy consumption, the wastewaterrecovery rate is not high. As studied by Singh et al. [249], the water recovery by FO was only 57% withan average flux of 5.3 L·m−2
·h−1 over 24 h’s operation.In net energy comparison, low-pressure driven membrane technologies always have lower energy
consumption. According to Atanasova et al. [149], with an inlet flowrate to an MBR over 15 m3·d−1,
the net energy consumption was less than 0.5 kWh m−3, even including the cost of disinfection. The netenergy costs of an MBR on municipal wastewater treatment are relatively low ranging from 0.19 to1.07 kWh·m−3 [137,250]. It should be noted the above data can only be used as a reference, not asthe actual energy consumption for municipal wastewater reuse treatment. In addition, the processeswith NF, RO and FO directly increased the energy consumption without consideration of biogas forenergy recovery (Table 13), because of the increased TMP, membrane maintenance, etc. The hybridMBR +RO processes in Table 13 have net energy consumption around 0.518 to 0.739 kWh·m−3 [145,184],while the combined FO+NF system consumed 3.44–4.57 kWh·m−3, which is not suitable for industrialscale application because of high economic cost. However, it is worth discussing the energy recoveryby biogas generated in AnMBR. With the energy recovery by methane, the AnMBR + RO systemcould save 0.185 kWh·m−3 net energy and the AnMBR + RO + IE system could save 0.547 kWh·m−3
net energy [145,185].In conclusion, as seen in real cases of municipal wastewater reuse treatment, the wastewater
recovery rate and net energy consumption are more likely considered as the two main factors, on thebasis of meeting required reuse level, because they are important indicators to determine whether themethod is cost effective or not. In the future, it could be more interesting to focus on the economicprediction of membraned-based technologies, which will be the reference for the future developmentof wastewater reuse field.
3. Challenges, Prospects and Conclusions
While the reuse of municipal wastewater presents a promising approach to reduce water pollutionand release water scarcity, the proportion of reused wastewater is quite low. The total volume ofwater reuse is approximately 14.2 billion m3
·y−1 worldwide reported in Global Water Market 2017,which is less than 4% of the total volume of domestic wastewater (250 to 350 billion m3
·y−1) [6,26].Actually, the reuse proportion differs significantly among various countries and regions based on realconditions. In extreme water shortage areas, the Arab Region, 23% of collected wastewater is beingreused, mostly for irrigation and groundwater recharge [10]. The Singapore government, with the willto be independent from water demand, reaches 40% reuse of total wastewater. Some countries likeIsrael and Tunisia keep ahead in wastewater reuse-with-reuse rates over 80%. In addition, the USA asa pioneer in waster reuse concepts and technology holds over one-fifth of the reused water capacityworldwide whereas it only provides a national water reuse rate of 9.7%. In Europe, approximately2.4% of the total treated urban wastewater effluent is reused. Under this global situation, the waterreuse approach is a promising market with high potential. As the European Parliament estimatedwith its proposal in May, 2020, increasing water reuse in agricultural irrigation from 1.7 billion m3
·y−1
to 6.6 billion m3·y−1 by 2025 could reduce water stress by 5% [37]. Generally, the implementation
of wastewater facilities requires a substantial capital expense. Under the integrated water resourcesmanagement of a region, the implementation of wastewater reuse may require government grants or

Membranes 2020, 10, 131 38 of 54
subsidies. Unfortunately, institutional barriers, financial allocation, and different agency priorities canmake water reuse projects difficult to progress in some cases.
Currently, reused water production from various membrane-based treatment fulfils multiple wateruse objectives. However, the ultimate decision to promote wastewater reuse depends on economicfactors, government regulations and policies, and most importantly, public acceptance reflecting on thewater demand, security and requirements for reliable water supply in local conditions. The wastewaterreuse guidelines are not unified in the world even for the same water reuse purpose. The “Guidelinesfor the safe use of wastewater, excreta and greywater in agriculture and aquaculture”, publishedby the WHO in 2006, is considered as the most relevant document regulating wastewater reuse,being widely adopted or referred to, by many countries [251]. Moreover, some countries developstronger reuse standards that provide more guarantees of safe reuse. For example, the reuse standardin France supplements the regulation of microorganisms, including Fecal Enterococci, F-specific phagesFNA and Spore of sulfating anaerobic bacteria, than the WHO [252]. However, upon investigationby M. Gurel et al. [253], it is seen that in the U.S., quality limits differ from state-to-state, and thatimplementing a single standard seems difficult due to national and/or local circumstances. In parallelto scientific evidence and advanced technologies, continuous improvement in the existing reusestandards and guidelines by revising/expanding is necessary. In addition, control and monitoringduring reuse applications along with the public feedback is necessary for safety assessment. It isalso worth noting that cultural and religious differences direct public opinion and acceptance ofwastewater reuse. In addition, some developing countries still implement the direct use of treatedwastewater without accordance with standards and associated risks. In this case, it is suggested toenact wastewater quality standards step-by-step, over suitable periods and according to treatmentcapabilities, for developing countries.
Anti-fouling is always the research hotspot in membrane filtration. In this case, a periodicalcleaning procedure is necessary for each membrane filtration system. In addition, many studiesare focused on the membranes anti-fouling enhancement by selection of new starting monomers,improvement of interfacial polymerization process, the hybrid organic/inorganic membrane, and moreattractively, the surface modification of conventional membranes by physical and chemicalmethods [254–256]. In general, the modified membrane permeation performance can be improvedsignificantly without sacrificing its retention properties, and its anti-fouling performance is morefavorable than the unmodified one [257,258]. Thus, the modified membrane is a promising optionfor treating produced water, especially if applied in the wastewater reuse field or compliance withdisposal regulations.
The raw wastewater quality variation in terms of living styles, seasonal change and peak periods,could finally influence the treatment performance, such as the effluent quality, organic load ratesand fouling mechanisms [121,259,260]. Moreover, although many studies achieved reuse objectivessuccessfully as mentioned in the last sections, the published reports still lack long-term and/orlarge-scale (industrial scale) operation and monitoring of the filtration performance and optimizationof fouling control strategies. In these cases, studies should focus much closer on real conditions of thetargeted wastewater, make comprehensive consideration of the potential impact factors as much aspossible, and deliberate optimization of operational conditions under non-ideal situations.

Membranes 2020, 10, 131 39 of 54
During long-term investigation, it can be logically predicted that successful non potable reuseis more likely to build the degree of familiarity and trust required by the public for acceptance [261].In the global water reuse market, 97.7% of water production is reused for non-potable purposes,of which 52% is for irrigation and 20% is for industrial process water recirculation. On the other hand,only 2.3% of water production is used for potable purposes and mostly for indirect potable reuse [262].For instance, the NEWater in Singapore’s potable reuse application cannot be directly used, instead,it needs to be discharged into reservoirs to mix with rainwater before being collectively treated in thewater treatment plants for potable use [22]. The reason why the distribution of potable reuse is low(2.3%) could mainly be blamed on public concerns of health risks and expensive cost of advancedtreatment processes. However, highly treated water production, when it is successfully used in morepractical applications (e.g., potable water), may earn enough support to make up for the high cost oftreatment. In the process of collecting references, we found more published research articles focusingon NF/RO processes aimed at achieving acceptable potable reuse levels, compared to the MF/UF/MBRbased treatment processes. With the advanced science development, driven by increasing demandfor high quality potable water, population growth and limited resources, it is expected we’ll see anexpansion in the potable reuse applications, especially in water scarcity regions in the future [263].This requires ensured access to credible scientific information for the public, decision makers and thelocal media, toward improving understanding of water supplies in the region and the costs/benefitsanalysis of water supply treatment options.
Lastly, several studies performed life cycle assessment of wastewater reclamation as a decentralizedapproach to urban wastewater management [264–266]. They emphasized that local wastewaterreclamation is environmentally preferable to the common centralized system, especially for non-potableuses, agricultural and urban, with environmental and economic advantages. Reuse of treatedwastewater is particularly beneficial when it can replace desalinated water [264]. Therefore,a comprehensive life cycle assessment of membrane-based techniques on municipal wastewatertreatment is critically needed, especially in different scenarios (developing countries vs. developedcountries; countries facing water scarcity vs. countries with sufficient water; countries with electricityas energy source vs. countries with sufficient renewable energy).
This review gave a comprehensive elaboration on the global water reuse situation, reuse regulationand membraned-based treatment performance on municipal wastewater reuse. The membrane-basedtreatment processes, such as direct membrane filtration and hybrid membrane systems, have beenmainly evaluated in this review. The advantages and limitations of them on reuse purposes, are listedin Table 14. Membrane separation processes often provide superior quality to the treated wastewaterto meet local reuse guidelines. This work emphasized the performances of the different treatmentprocesses: the pollutant removal capacity, microorganism removal, membrane fouling potential,productivity, reuse purposes, water recovery rate and energy consumption. Furthermore, futureresearch focusing on micropollutant removal, fouling mechanism strategies, resource recovery, and lifecycle assessment of membrane-based municipal treatment strategies, for potable and non-potablereuse applications, continues to need further systematic investigation.

Membranes 2020, 10, 131 40 of 54
Table 14. Advantages and disadvantages of various membrane-based treatment processes.
Treatment Processes Reuse Level Advantages Disadvantages
MF/UF-based treatment Non-potable reuse: toilet flushing, urbanuses, irrigation, etc.
• Low-pressure driven process, high flux andhigh permeability.• Low energy cost
• Effective removal of high molecular weight matters,bacteria and viruses.
• UF can almost eliminate all the bacteria, protozoaand viruses, compared to MF.
• MF/UF membranes pretreated withphysical/chemical process results in low fouling
potential, long term operation and higher load rate.
• Health risks potential for humans.• Incomplete removal of low molecular
weight matters, dissolved organics, salinityand micropollutants, etc.• Fouling potential
MBRsNon-potable reuse: Toilet flushing,cleaning, process water, urban uses,
irrigation, etc.
• Low-pressure driven process, high flux andhigh permeability.• Low energy cost
• Effective removal of organics, TSS, nutrients like N, P,S in various forms, surfactants and micropollutants from
various wastewater with biologic process.• Less organic foulants on the membrane, smaller
footprint, faster plant activation, no biologicsedimentation units and less sludge production
compared to CAS process.• Particularly, AnMBRs hold significant potential to
reduce the overall energy demand, together withresource recovery
• Health risks potential for humans.• Incomplete removal of low molecular
weight matters, dissolved organics, salinityand micropollutants, etc.
• Fouling potential with membranepore-clogging and sludge cake deposition
NF/RO-based treatmentNon-potable and potable reuse:
agricultural irrigation, groundwaterrecharge, indirect potable water, etc.
• High removal efficiency of micropollutants,microorganisms and salinity, EC, other dissolved organic
and inorganic matters.• Reduce human health concerns• High level of reuse applications
• High-pressure driven process, with lowflux and low permeability.• High energy cost.
• Pretreatment demand• Biofouling caused by microorganisms.
FO-based treatmentNon-potable and potable reuse:
agricultural irrigation, groundwaterrecharge, indirect potable water, etc.
• FO: non external pressure driven process• Lower membrane fouling potential than RO due to
less formation and compaction of cake layers on FOmembranes in the absence of hydraulic pressure• High flux recovery after cleaning and high water
recovery using low-grade energy resources• Combination of municipal wastewater treatment
with seawater desalination
• FO is a process of dilution, which needsfurther separation treatment.
• High requirements for the selection ofdraw solution and membrane material

Membranes 2020, 10, 131 41 of 54
Table 14. Cont.
Treatment Processes Reuse Level Advantages Disadvantages
Disinfection/AOPscombined with
membrane process
Non-potable or potable reuse based onthe membrane types
• Disinfection can always act as the last step to ensurewater quality and disinfection for human health.
• Disinfection absolutely eliminates microorganisms.• Long-term effects of disinfectants, such as chlorine.• AOPs absolutely eliminates organic pollutions,
micropollutants and microorganisms.• Improvement of water reuse levels when combined
with MF/UF/MBRs.
• Formation of harmful byproducts bothfrom disinfection and AOPs.
• High chemical cost and unstable storageof chemicals in AOPs

Membranes 2020, 10, 131 42 of 54
Author Contributions: J.Y. wrote the manuscript with support, input and discussions from M.M., P.M. and L.E.All authors have read and agreed to the published version of the manuscript.
Funding: This research received no external funding.
Acknowledgments: The authors would like to acknowledge the China Scholarship Council for partial financialsupport (201801810046).
Conflicts of Interest: The authors declare no conflict of interest.
References
1. Asano, T.; Levine, A.D. Wastewater reclamation, recycling and reuse: Past, present, and future. Water Sci.Technol. 1996, 33, 1–14. [CrossRef]
2. Kadeli, L. Guidelines for Water Reuse; U.S. Environmental Protection Agency: Washington, DC, USA, 2012;p. 643.
3. Hlavinek, P.; Popovska, C.; Mahrikova, I. Risk Management of Water Supply and Sanitation Systems; SpringerScience & Business Media: Berlin/Heidelberg, Germany, 2009; ISBN 978-90-481-2365-0.
4. The Global Risks Report 2019; World Economic Forum: Cologny-Geneva, Switzerland, 2019; ISBN 978-1-944835-15-6.5. Wastewater Report 2018: The Reuse Opportunity; The International Water Association: London, UK, 2018;
pp. 1–24.6. Lautze, J.; Stander, E.; Drechsel, P.; da Silva, A.K.; Keraita, B. Global Experiences in Water Reuse; International
Water Management Institute (IWMI): Sunil Mawatha, Battaramulla, 2014; ISBN 978-92-9090-791-6.7. Angelakis, A.N.; Eslamian, S.; Dalezios, N. Water scarcity management: Part 1: Methodological framework.
Int. J. Glob. Environ. Issues 2018, 17, 1. [CrossRef]8. Paul, R.; Kenway, S.; Mukheibir, P. How scale and technology influence the energy intensity of water recycling
systems-An analytical review. J. Clean. Prod. 2019, 215, 1457–1480. [CrossRef]9. Alcalde Sanz, L.; Gawlik, B. Water Reuse in Europe-Relevant Guidelines, Needs for and Barriers to Innovation;
Publications Office of the European Union: Luxembourg, 2014.10. UNESCO. Wastewater: The Untapped Resource; The United Nations World Water Development Report;
UNESCO: Paris, France, 2017; ISBN 978-92-3-100201-4.11. Nahal, S. A Blue Revolution–global water. ESG Sustain. 2012, 1–139.12. Wade Miller, G. Integrated concepts in water reuse: Managing global water needs. Desalination 2006, 187,
65–75. [CrossRef]13. Lam, K.-C.; Zhu, T. Environmental Impact Assessment in China; Research Center for Strategic Environmental
Assemet: Hong Kong, China, 2009.14. Saptarshi, D. Wastewater Recycling: A Multi-Billion Dollar Opportunity For India To Avoid The Impending
Water Crisis. Available online: https://swachhindia.ndtv.com/wastewater-recycling-multi-billion-dollar-opportunity-india-avoid-forthcoming-water-crisis-7182/ (accessed on 16 November 2017).
15. Mudgal, S.; Van Long, L.; Saïdi, N.; Haines, R.; McNeil, D.; Jeffrey, P.; Smith, H.; Knox, J.; EuropeanCommission; Directorate-General for the Environment; et al. Optimising Water Reuse in the EU: Final Report;Publications Office: Luxembourg, 2015; ISBN 978-92-79-46835-3.
16. Kim, E.; Park, J.; Lee, J.; Han, I. Modernization of the Sewerage System in Korea; Republic of Korea Mnistry ofEnvironment: Sejong, Korea, 2016.
17. Tal, A. Rethinking the sustainability of Israel’s irrigation practices in the Drylands. Water Res. 2016, 90,387–394. [CrossRef]
18. Jacob, M. Progress against the National Target of 30% of Australia’s Wastewater Being Recycled by 2015; Departmentof Sustainability, Environment, Water, Population and Communities: Canberra, Australia, 2015; pp. 1–79.
19. Jiménez-Cisneros, B. The Planned and Unplanned Reuse of Mexico City’s Wastewater; Universidad NacionalAutónoma de México: Mexico City, Mexico, 2012; p. 3.
20. Asano, T.; Maeda, M.; Takaki, M.; Asano, T. Wastewater reclamation and reuse in Japan: Overview andimplementation examples. Water Sci. Technol. 1996, 34, 219–226. [CrossRef]
21. Ogoshi, M.; Suzuki, Y.; Asano, T. Water reuse in Japan. Water Sci. Technol. 2001, 43, 17–23. [CrossRef]22. Thai Pin Tan; Stuti Rawat. NEWater in Singapore; Glob. Water Forum: Singapore, 2018; Available online:
https://globalwaterforum.org/2018/01/15/newater-in-singapore/ (accessed on 15 January 2018).

Membranes 2020, 10, 131 43 of 54
23. Bahri, A.; Brissaud, F. Wastewater reuse in Tunisia: Assessing a national policy. Water Sci. Technol. 1996, 33,87–94. [CrossRef]
24. Klay, S.; Charef, A.; Ayed, L.; Houman, B.; Rezgui, F. Effect of irrigation with treated wastewater ongeochemical properties (saltiness, C, N and heavy metals) of isohumic soils (Zaouit Sousse perimeter,Oriental Tunisia). Desalination 2010, 253, 180–187. [CrossRef]
25. Hochstrat, R.; Wintgens, T.; Melin, T.; Jeffrey, P. Assessing the European wastewater reclamation and reusepotential—A scenario analysis. Desalination 2006, 188, 1–8. [CrossRef]
26. Tejero, I.F.G.; Zuazo, V.H.D. Water Scarcity and Sustainable Agriculture in Semiarid Environment: Tools, Strategies,and Challenges for Woody Crops; Academic Press: Cambridge, MA, USA, 2018; ISBN 978-0-12-813165-7.
27. Bwapwa, J.; Jaiyeola, A. Treatment of Domestic/Municipal and Industrial Wastewater Using Microalgae:Review. Int. Proc. Chem. Biol. Environ. Eng. 2016, 97, 1–8. [CrossRef]
28. Marcos von, S. Wastewater Characteristics, Treatment and Disposal; Biological Wastewater Treatment Series;IWA Publ.: London, UK, 2007; ISBN 978-1-84339-161-6.
29. Nolde, E. Greywater reuse systems for toilet flushing in multi-storey buildings–over ten years experience inBerlin. Urban Water 2000, 1, 275–284. [CrossRef]
30. Li, F.; Wichmann, K.; Otterpohl, R. Review of the technological approaches for grey water treatment andreuses. Sci. Total Environ. 2009, 407, 3439–3449. [CrossRef]
31. Racar, M.; Dolar, D.; Špehar, A.; Košutic, K. Application of UF/NF/RO membranes for treatment and reuse ofrendering plant wastewater. Process Saf. Environ. Prot. 2017, 105, 386–392. [CrossRef]
32. Pidou, M. Hybrid Membrane Processes for Water Reuse; School of Applied Science Department of SustainableSystems Centre for Water Science, Cranfield University: Cranfield, UK, 2006.
33. Pasquini, L.; Munoz, J.-F.; Pons, M.-N.; Yvon, J.; Dauchy, X.; France, X.; Le, N.D.; France-Lanord, C.; Görner, T.Occurrence of eight household micropollutants in urban wastewater and their fate in a wastewater treatmentplant. Statistical evaluation. Sci. Total Environ. 2014, 481, 459–468. [CrossRef]
34. Touraud, E.; Roig, B.; Sumpter, J.P.; Coetsier, C. Drug residues and endocrine disruptors in drinking water:Risk for humans? Int. J. Hyg. Environ. Health 2011, 214, 437–441. [CrossRef]
35. Henze, M. Wastewater Treatment: Biological and Chemical Processes; Springer: Berlin/Heidelberg, Germany,1995; ISBN 978-3-540-58816-0.
36. Organiztion, W.H. Guidelines for the Safe Use of Wastewater, Excreta and Greywater; World Health Organiztion:Geneva, Switzerland, 2006; Volume 4, ISBN 92-4-154685-9.
37. European Parliament. European Parliament Legislative Resolution of 13 May 2020 on the Council Positionat First Reading with a View to the Adoption of a Regulation of the European Parliament and of the Councilon Minimum Requirements for Water Reuse (15301/2/2019–C9-0107/2020–2018/0169(COD)); European Union:Brussels, Belgium, 2020.
38. Rhodes, R.; Trussell Henry, A.; Anderson Edmund, G.; Archuleta James, C. Water Reuse: Potential for Expandingthe Nation’s Water Supply Through Reuse of Municipal Wastewater; National Academies Press: Washington, DC,USA, 2012; ISBN 978-0-309-22460-4.
39. Smith, K.; Liu, S.; Liu, Y.; Guo, S. Can China reduce energy for water? A review of energy for urban watersupply and wastewater treatment and suggestions for change. Renew. Sustain. Energy Rev. 2018, 91, 41–58.[CrossRef]
40. Sonune, A.; Ghate, R. Developments in wastewater treatment methods. Desalination 2004, 167, 55–63.[CrossRef]
41. Rajasulochana, P.; Preethy, V. Comparison on efficiency of various techniques in treatment of waste andsewage water–A comprehensive review. Resour.-Effic. Technol. 2016, 2, 175–184. [CrossRef]
42. Kalkan, Ç.; Yapsakli, K.; Mertoglu, B.; Tufan, D.; Saatci, A. Evaluation of Biological Activated Carbon (BAC)process in wastewater treatment secondary effluent for reclamation purposes. Desalination 2011, 265, 266–273.[CrossRef]
43. Kivaisi, A.K. The potential for constructed wetlands for wastewater treatment and reuse in developingcountries: A review. Ecol. Eng. 2001, 16, 545–560. [CrossRef]
44. Kumar Gupta, V.; Ali, I.; Saleh, T.A.; Nayak, A.; Agarwal, S. Chemical treatment technologies for waste-waterrecycling—An overview. RSC Adv. 2012, 2, 6380–6388. [CrossRef]
45. Wu, B. Membrane-based technology in greywater reclamation: A review. Sci. Total Environ. 2019, 656,184–200. [CrossRef]

Membranes 2020, 10, 131 44 of 54
46. Cherchi, C.; Kesaano, M.; Badruzzaman, M.; Schwab, K.; Jacangelo, J.G. Municipal reclaimed water formulti-purpose applications in the power sector: A review. J. Environ. Manag. 2019, 236, 561–570. [CrossRef]
47. Warsinger, D.M.; Chakraborty, S.; Tow, E.W.; Plumlee, M.H.; Bellona, C.; Loutatidou, S.; Karimi, L.;Mikelonis, A.M.; Achilli, A.; Ghassemi, A.; et al. A review of polymeric membranes and processes for potablewater reuse. Prog. Polym. Sci. 2018, 81, 209–237. [CrossRef]
48. Song, X.; Luo, W.; Hai, F.I.; Price, W.E.; Guo, W.; Ngo, H.H.; Nghiem, L.D. Resource recovery from wastewaterby anaerobic membrane bioreactors: Opportunities and challenges. Bioresour. Technol. 2018, 270, 669–677.[CrossRef]
49. Diaz-Elsayed, N.; Rezaei, N.; Guo, T.; Mohebbi, S.; Zhang, Q. Wastewater-based resource recovery technologiesacross scale: A review. Resour. Conserv. Recycl. 2019, 145, 94–112. [CrossRef]
50. Gupta, V.K. Suhas Application of low-cost adsorbents for dye removal–A review. J. Environ. Manag. 2009, 90,2313–2342. [CrossRef]
51. Lee, K.P.; Arnot, T.C.; Mattia, D. A review of reverse osmosis membrane materials for desalination—Development to date and future potential. J. Membr. Sci. 2011, 370, 1–22. [CrossRef]
52. Shon, H.K.; Phuntsho, S.; Chaudhary, D.S.; Vigneswaran, S.; Cho, J. Nanofiltration for water and wastewatertreatment-A mini review. Drink. Water Eng. Sci. 2013, 6, 47–53. [CrossRef]
53. Padaki, M.; Surya Murali, R.; Abdullah, M.S.; Misdan, N.; Moslehyani, A.; Kassim, M.A.; Hilal, N.; Ismail, A.F.Membrane technology enhancement in oil–water separation. A review. Desalination 2015, 357, 197–207.[CrossRef]
54. Van der Bruggen, B.; Mänttäri, M.; Nyström, M. Drawbacks of applying nanofiltration and how to avoidthem: A review. Sep. Purif. Technol. 2008, 63, 251–263. [CrossRef]
55. Tchobanoglous, G.H. Wastewater Engineering Treatment and Resource Recovery; McGraw-Hill Education:New York, NY, USA, 2013; pp. 1–2048.
56. Bruggen, B.V.D.; Vandecasteele, C.; Gestel, T.V.; Doyen, W.; Leysen, R. A review of pressure-driven membraneprocesses in wastewater treatment and drinking water production. Environ. Prog. 2003, 22, 46–56. [CrossRef]
57. Guo, W.; Ngo, H.-H.; Li, J. A mini-review on membrane fouling. Bioresour. Technol. 2012, 122, 27–34.[CrossRef]
58. Lin, H.; Peng, W.; Zhang, M.; Chen, J.; Hong, H.; Zhang, Y. A review on anaerobic membrane bioreactors:Applications, membrane fouling and future perspectives. Desalination 2013, 314, 169–188. [CrossRef]
59. Field, R.W.; Pearce, G.K. Critical, sustainable and threshold fluxes for membrane filtration with waterindustry applications. Adv. Colloid Interface Sci. 2011, 164, 38–44. [CrossRef]
60. Mortensen Eric, R.; Cath Tzahi, Y.; Brant Jonathan, A.; Dennett Keith, E.; Childress Amy, E. Evaluation ofMembrane Processes for Reducing Total Dissolved Solids Discharged to the Truckee River. J. Environ. Eng.2007, 133, 1136–1144. [CrossRef]
61. Nguyen, T.-T.; Kook, S.; Lee, C.; Field, R.W.; Kim, I.S. Critical flux-based membrane fouling control of forwardosmosis: Behavior, sustainability, and reversibility. J. Membr. Sci. 2019, 570–571, 380–393. [CrossRef]
62. Bacchin, P.; Aimar, P.; Field, R.W. Critical and sustainable fluxes: Theory, experiments and applications.J. Membr. Sci. 2006, 281, 42–69. [CrossRef]
63. Abdel-Fatah, M.A. Nanofiltration systems and applications in wastewater treatment: Review article.Ain Shams Eng. J. 2018, 9, 3077–3092. [CrossRef]
64. Asano, T. (Ed.) Water Reuse: Issues, Technology, and Applications, 1st ed.; McGraw-Hill: New York, NY, USA,2007; ISBN 978-0-07-145927-3.
65. Nath, K. Membrane Separation Processes; PHI Learning Pvt. Ltd.: Delhi, India, 2017; ISBN 978-81-203-5291-9.66. Dach, H. Comparaison des Opérations de Nanofiltration et D’osmose Inverse pour le Dessalement Sélectif
des eaux Saumatres: De L’échelle du Laboratoire au Pilote Industriel. Ph.D. Thesis, Université d’Angers,Angers, France, 2008.
67. Gallego-Molina, A.; Mendoza-Roca, J.A.; Aguado, D.; Galiana-Aleixandre, M.V. Reducing pollution fromthe deliming–bating operation in a tannery. Wastewater reuse by microfiltration membranes. Chem. Eng.Res. Des. 2013, 91, 369–376. [CrossRef]
68. Wintgens, T.; Melin, T.; Schäfer, A.; Khan, S.; Muston, M.; Bixio, D.; Thoeye, C. The role of membraneprocesses in municipal wastewater reclamation and reuse. Desalination 2005, 178, 1–11. [CrossRef]
69. Madaeni, S.S.; Fane, A.G.; Grohmann, G.S. Virus removal from water and wastewater using membranes.J. Membr. Sci. 1995, 102, 65–75. [CrossRef]

Membranes 2020, 10, 131 45 of 54
70. Huang, H.; Young, T.A.; Schwab, K.J.; Jacangelo, J.G. Mechanisms of virus removal from secondarywastewater effluent by low pressure membrane filtration. J. Membr. Sci. 2012, 409–410, 1–8. [CrossRef]
71. Herath, G.; Yamamoto, K.; Urase, T. Removal of viruses by microfiltration membranes at different solutionenvironments. Water Sci. Technol. 1999, 40, 331–338. [CrossRef]
72. Langlet, J.; Ogorzaly, L.; Schrotter, J.-C.; Machinal, C.; Gaboriaud, F.; Duval, J.F.L.; Gantzer, C. Efficiency ofMS2 phage and Qβ phage removal by membrane filtration in water treatment: Applicability of real-timeRT-PCR method. J. Membr. Sci. 2009, 326, 111–116. [CrossRef]
73. Herath, G.; Yamamoto, K.; Urase, T. The effect of suction velocity on concentration polarization inmicrofiltration membranes under turbulent flow conditions. J. Membr. Sci. 2000, 169, 175–183. [CrossRef]
74. Zheng, X.; Lü, W.; Yang, M.; Liu, J. Evaluation of virus removal in MBR using coliphages T4. Chin. Sci. Bull.2005, 50, 862–867. [CrossRef]
75. Ahn, K.-H.; Song, K.-G. Treatment of domestic wastewater using microfiltration for reuse of wastewater.Desalination 1999, 126, 7–14. [CrossRef]
76. Reissmann, F.G.; Uhl, W. Ultrafiltration for the reuse of spent filter backwash water from drinking watertreatment. Desalination 2006, 198, 225–235. [CrossRef]
77. Falsanisi, D.; Liberti, L.; Notarnicola, M. Ultrafiltration (UF) Pilot Plant for Municipal Wastewater Reuse inAgriculture: Impact of the Operation Mode on Process Performance. Water 2010, 2, 872–885. [CrossRef]
78. Muthukumaran, S.; Nguyen, D.A.; Baskaran, K. Performance evaluation of different ultrafiltration membranesfor the reclamation and reuse of secondary effluent. Desalination 2011, 279, 383–389. [CrossRef]
79. Ang, W.L.; Mohammad, A.W.; Hilal, N.; Leo, C.P. A review on the applicability of integrated/hybridmembrane processes in water treatment and desalination plants. Desalination 2015, 363, 2–18. [CrossRef]
80. Yue, X.; Koh, Y.K.K.; Ng, H.Y. Effects of dissolved organic matters (DOMs) on membrane fouling in anaerobicceramic membrane bioreactors (AnCMBRs) treating domestic wastewater. Water Res. 2015, 86, 96–107.[CrossRef]
81. Pollice, A.; Lopez, A.; Laera, G.; Rubino, P.; Lonigro, A. Tertiary filtered municipal wastewater as alternativewater source in agriculture: A field investigation in Southern Italy. Sci. Total Environ. 2004, 324, 201–210.[CrossRef]
82. Michael-Kordatou, I.; Michael, C.; Duan, X.; He, X.; Dionysiou, D.D.; Mills, M.A.; Fatta-Kassinos, D.Dissolved effluent organic matter: Characteristics and potential implications in wastewater treatment andreuse applications. Water Res. 2015, 77, 213–248. [CrossRef]
83. Matilainen, A.; Vepsäläinen, M.; Sillanpää, M. Natural organic matter removal by coagulation duringdrinking water treatment: A review. Adv. Colloid Interface Sci. 2010, 159, 189–197. [CrossRef]
84. Guo, W.S.; Vigneswaran, S.; Ngo, H.H.; Chapman, H. Experimental investigation of adsorption–flocculation–microfiltration hybrid system in wastewater reuse. J. Membr. Sci. 2004, 242, 27–35. [CrossRef]
85. Karakashev, D.; Schmidt, J.E.; Angelidaki, I. Innovative process scheme for removal of organic matter,phosphorus and nitrogen from pig manure. Water Res. 2008, 42, 4083–4090. [CrossRef]
86. Hatt, J.W.; Germain, E.; Judd, S.J. Precoagulation-microfiltration for wastewater reuse. Water Res. 2011, 45,6471–6478. [CrossRef]
87. Seo, G.T.; Suzuki, Y.; Ohgaki, S. Biological powdered activated carbon (BPAC) microfiltration for wastewaterreclamation and reuse. Desalination 1996, 106, 39–45. [CrossRef]
88. Shanmuganathan, S.; Johir, M.A.H.; Nguyen, T.V.; Kandasamy, J.; Vigneswaran, S.L. Experimental evaluationof microfiltration–granular activated carbon (MF–GAC)/nano filter hybrid system in high quality waterreuse. J. Membr. Sci. 2015, 476, 1–9. [CrossRef]
89. Vigneswaran, S.; Guo, W.S.; Smith, P.; Ngo, H.H. Submerged membrane adsorption hybrid system (SMAHS):Process control and optimization of operating parameters. Desalination 2007, 202, 392–399. [CrossRef]
90. Snyder, S.A.; Adham, S.; Redding, A.M.; Cannon, F.S.; DeCarolis, J.; Oppenheimer, J.; Wert, E.C.; Yoon, Y.Role of membranes and activated carbon in the removal of endocrine disruptors and pharmaceuticals.Desalination 2007, 202, 156–181. [CrossRef]
91. Konieczny, K.; Bodzek, M.; Rajca, M. A coagulation–MF system for water treatment using ceramic membranes.Desalination 2006, 198, 92–101. [CrossRef]
92. Zheng, X.; Mehrez, R.; Jekel, M.; Ernst, M. Effect of slow sand filtration of treated wastewater as pre-treatmentto UF. Desalination 2009, 249, 591–595. [CrossRef]

Membranes 2020, 10, 131 46 of 54
93. Fan, L.; Nguyen, T.; Roddick, F.A.; Harris, J.L. Low-pressure membrane filtration of secondary effluent inwater reuse: Pre-treatment for fouling reduction. J. Membr. Sci. 2008, 320, 135–142. [CrossRef]
94. Barbot, E.; Dussouillez, P.; Bottero, J.Y.; Moulin, P. Coagulation of bentonite suspension by polyelectrolytesor ferric chloride: Floc breakage and reformation. Chem. Eng. J. 2010, 156, 83–91. [CrossRef]
95. Prihasto, N.; Liu, Q.-F.; Kim, S.-H. Pre-treatment strategies for seawater desalination by reverse osmosissystem. Desalination 2009, 249, 308–316. [CrossRef]
96. Shon, H.K.; Vigneswaran, S.; Kim, I.S.; Cho, J.; Ngo, H.H. Fouling of ultrafiltration membrane by effluentorganic matter: A detailed characterization using different organic fractions in wastewater. J. Membr. Sci.2006, 278, 232–238. [CrossRef]
97. Fabris, R.; Lee, E.K.; Chow, C.W.K.; Chen, V.; Drikas, M. Pre-treatments to reduce fouling of low pressuremicro-filtration (MF) membranes. J. Membr. Sci. 2007, 289, 231–240. [CrossRef]
98. Lu, N.C.; Liu, J.C. Removal of phosphate and fluoride from wastewater by a hybrid precipitation–microfiltration process. Sep. Purif. Technol. 2010, 74, 329–335. [CrossRef]
99. Lee, J.-D.; Lee, S.-H.; Jo, M.-H.; Park, P.-K.; Lee, C.-H.; Kwak, J.-W. Effect of Coagulation Conditions onMembrane Filtration Characteristics in Coagulation−Microfiltration Process for Water Treatment. Environ. Sci.Technol. 2000, 34, 3780–3788. [CrossRef]
100. Kim, K.-Y.; Kim, H.-S.; Kim, J.; Nam, J.-W.; Kim, J.-M.; Son, S. A hybrid microfiltration–granular activatedcarbon system for water purification and wastewater reclamation/reuse. Desalination 2009, 243, 132–144.[CrossRef]
101. Otaki, M.; Yano, K.; Ohgaki, S. Virus removal in a membrane separation process. Water Sci. Technol. 1998, 37,107–116. [CrossRef]
102. Liu, P.; Hill, V.R.; Hahn, D.; Johnson, T.B.; Pan, Y.; Jothikumar, N.; Moe, C.L. Hollow-fiber ultrafiltration forsimultaneous recovery of viruses, bacteria and parasites from reclaimed water. J. Microbiol. Methods 2012, 88,155–161. [CrossRef]
103. Hlavinek, P.; Kukharchyk, T.; Marsalek, J.; Mahrikova, I. Integrated Urban Water Resources Management;Springer Science & Business Media: Berlin/Heidelberg, Germany, 2006; ISBN 978-1-4020-4684-1.
104. Crini, G.; Lichtfouse, E. Advantages and disadvantages of techniques used for wastewater treatment. Environ.Chem. Lett. 2019, 17, 145–155. [CrossRef]
105. Crini, G.; Lichtfouse, E.; Wilson, L.D.; Morin-Crini, N. Adsorption-Oriented Processes Using Conventionaland Non-conventional Adsorbents for Wastewater Treatment. In Green Adsorbents for Pollutant Removal:Fundamentals and Design; Crini, G., Lichtfouse, E., Eds.; Environmental Chemistry for a Sustainable World;Springer International Publishing: Cham, Switzerland, 2018; pp. 23–71. ISBN 978-3-319-92111-2.
106. Abdessemed, D.; Nezzal, G.; Ben Aim, R. Coagulation—Adsorption—Ultrafiltration for wastewater treatmentand reuse. Desalination 2000, 131, 307–314. [CrossRef]
107. Lee, C.W.; Bae, S.D.; Han, S.W.; Kang, L.S. Application of ultrafiltration hybrid membrane processes for reuseof secondary effluent. Desalination 2007, 202, 239–246. [CrossRef]
108. Gómez, M.; de la Rua, A.; Garralón, G.; Plaza, F.; Hontoria, E.; Gómez, M.A. Urban wastewater disinfectionby filtration technologies. Desalination 2006, 190, 16–28. [CrossRef]
109. Gómez, M.; Plaza, F.; Garralón, G.; Pérez, J.; Gómez, M.A. A comparative study of tertiary wastewatertreatment by physico-chemical-UV process and macrofiltration–ultrafiltration technologies. Desalination2007, 202, 369–376. [CrossRef]
110. Hernández Leal, L.; Temmink, H.; Zeeman, G.; Buisman, C.J.N. Bioflocculation of grey water for improvedenergy recovery within decentralized sanitation concepts. Bioflocculation Grey Water Improv. Energy RecoveryDecentralized Sanit. Concepts 2010, 101, 9065–9070. [CrossRef]
111. Wang, Z.; Wu, Z. Distribution and transformation of molecular weight of organic matters in membranebioreactor and conventional activated sludge process. Chem. Eng. J. 2009, 150, 396–402. [CrossRef]
112. Ottoson, J.; Hansen, A.; Björlenius, B.; Norder, H.; Stenström, T.A. Removal of viruses, parasitic protozoaand microbial indicators in conventional and membrane processes in a wastewater pilot plant. Water Res.2006, 40, 1449–1457. [CrossRef]
113. Judd, S. The MBR Book: Principles and Applications of Membrane Bioreactors for Water and Wastewater Treatment;Elsevier: Amsterdam, The Netherlands, 2010; ISBN 978-0-08-096767-7.
114. Atasoy, E.; Murat, S.; Baban, A.; Tiris, M. Membrane Bioreactor (MBR) Treatment of Segregated HouseholdWastewater for Reuse. CLEAN–Soil Air Water 2007, 35, 465–472. [CrossRef]

Membranes 2020, 10, 131 47 of 54
115. Hai, F.I.; Yamamoto, K.; Lee, C.-H. Membrane Biological Reactors: Theory, Modeling, Design, Management andApplications to Wastewater Reuse, 2nd ed.; IWA Publishing: London, UK, 2018; ISBN 978-1-78040-916-0.
116. Purnell, S.; Ebdon, J.; Buck, A.; Tupper, M.; Taylor, H. Removal of phages and viral pathogens in a full-scaleMBR: Implications for wastewater reuse and potable water. Water Res. 2016, 100, 20–27. [CrossRef]
117. Xing, C.-H.; Tardieu, E.; Qian, Y.; Wen, X.-H. Ultrafiltration membrane bioreactor for urban wastewaterreclamation. J. Membr. Sci. 2000, 177, 73–82. [CrossRef]
118. Tam, L.S.; Tang, T.W.; Lau, G.N.; Sharma, K.R.; Chen, G.H. A pilot study for wastewater reclamation andreuse with MBR/RO and MF/RO systems. Desalination 2007, 202, 106–113. [CrossRef]
119. Fountoulakis, M.S.; Markakis, N.; Petousi, I.; Manios, T. Single house on-site grey water treatment using asubmerged membrane bioreactor for toilet flushing. Sci. Total Environ. 2016, 551–552, 706–711. [CrossRef]
120. Merz, C.; Scheumann, R.; El Hamouri, B.; Kraume, M. Membrane bioreactor technology for the treatment ofgreywater from a sports and leisure club. Desalination 2007, 215, 37–43. [CrossRef]
121. Santasmasas, C.; Rovira, M.; Clarens, F.; Valderrama, C. Grey water reclamation by decentralized MBRprototype. Resour. Conserv. Recycl. 2013, 72, 102–107. [CrossRef]
122. Kraume, M.; Scheumann, R.; Baban, A.; El Hamouri, B. Performance of a compact submerged membranesequencing batch reactor (SM-SBR) for greywater treatment. Desalination 2010, 250, 1011–1013. [CrossRef]
123. Francy, D.S.; Stelzer, E.A.; Bushon, R.N.; Brady, A.M.G.; Williston, A.G.; Riddell, K.R.; Borchardt, M.A.;Spencer, S.K.; Gellner, T.M. Comparative effectiveness of membrane bioreactors, conventional secondarytreatment, and chlorine and UV disinfection to remove microorganisms from municipal wastewaters.Water Res. 2012, 46, 4164–4178. [CrossRef]
124. Farahbakhsh, K.; Smith, D.W. Removal of coliphages in secondary effluent by microfiltration—Mechanismsof removal and impact of operating parameters. Water Res. 2004, 38, 585–592. [CrossRef]
125. Zanetti, F.; De Luca, G.; Sacchetti, R. Performance of a full-scale membrane bioreactor system in treatingmunicipal wastewater for reuse purposes. Bioresour. Technol. 2010, 101, 3768–3771. [CrossRef]
126. De Luca, G.; Sacchetti, R.; Leoni, E.; Zanetti, F. Removal of indicator bacteriophages from municipalwastewater by a full-scale membrane bioreactor and a conventional activated sludge process: Implicationsto water reuse. Bioresour. Technol. 2013, 129, 526–531. [CrossRef]
127. Hirani, Z.M.; DeCarolis, J.F.; Adham, S.S.; Jacangelo, J.G. Peak flux performance and microbial removal byselected membrane bioreactor systems. Water Res. 2010, 44, 2431–2440. [CrossRef]
128. Chaudhry, R.M.; Nelson, K.L.; Drewes, J.E. Mechanisms of Pathogenic Virus Removal in a Full-ScaleMembrane Bioreactor. Environ. Sci. Technol. 2015, 49, 2815–2822. [CrossRef]
129. Lv, W.; Zheng, X.; Yang, M.; Zhang, Y.; Liu, Y.; Liu, J. Virus removal performance and mechanism of asubmerged membrane bioreactor. Process Biochem. 2006, 41, 299–304. [CrossRef]
130. Shang, C.; Wong, H.M.; Chen, G. Bacteriophage MS-2 removal by submerged membrane bioreactor. Water Res.2005, 39, 4211–4219. [CrossRef] [PubMed]
131. Ueda, T.; Horan, N.J. Fate of indigenous bacteriophage in a membrane bioreactor. Water Res. 2000, 34,2151–2159. [CrossRef]
132. Quist-Jensen, C.A.; Macedonio, F.; Drioli, E. Membrane technology for water production in agriculture:Desalination and wastewater reuse. Desalination 2015, 364, 17–32. [CrossRef]
133. Lee, J.; Ahn, W.-Y.; Lee, C.-H. Comparison of the filtration characteristics between attached and suspendedgrowth microorganisms in submerged membrane bioreactor. Water Res. 2001, 35, 2435–2445. [CrossRef]
134. Meng, F.; Chae, S.-R.; Drews, A.; Kraume, M.; Shin, H.-S.; Yang, F. Recent advances in membrane bioreactors(MBRs): Membrane fouling and membrane material. Water Res. 2009, 43, 1489–1512. [CrossRef]
135. Robles, Á.; Ruano, M.V.; Charfi, A.; Lesage, G.; Heran, M.; Harmand, J.; Seco, A.; Steyer, J.-P.; Batstone, D.J.;Kim, J.; et al. A review on anaerobic membrane bioreactors (AnMBRs) focused on modelling and controlaspects. Bioresour. Technol. 2018, 270, 612–626. [CrossRef]
136. Bouhabila, E.H.; Ben Aïm, R.; Buisson, H. Fouling characterisation in membrane bioreactors. Sep. Purif. Technol.2001, 22–23, 123–132. [CrossRef]
137. Verrecht, B.; Maere, T.; Nopens, I.; Brepols, C.; Judd, S. The cost of a large-scale hollow fibre MBR. Water Res.2010, 44, 5274–5283. [CrossRef]
138. Hong, S.P.; Bae, T.H.; Tak, T.M.; Hong, S.; Randall, A. Fouling control in activated sludge submerged hollowfiber membrane bioreactors. Desalination 2002, 143, 219–228. [CrossRef]

Membranes 2020, 10, 131 48 of 54
139. Fan, F.; Zhou, H. Interrelated effects of aeration and mixed liquor fractions on membrane fouling for submergedmembrane bioreactor processes in wastewater treatment. Environ. Sci. Technol. 2007, 41, 2523–2528. [CrossRef]
140. Bilad, M.R.; Mezohegyi, G.; Declerck, P.; Vankelecom, I.F.J. Novel magnetically induced membrane vibration(MMV) for fouling control in membrane bioreactors. Water Res. 2012, 46, 63–72. [CrossRef] [PubMed]
141. Low, S.C.; Cheong, K.T.; Lim, H.L. A vibration membrane bioreactor. Desalin. Water Treat. 2009, 5, 42–47.[CrossRef]
142. Harb, M.; Hong, P.Y. Anaerobic Membrane Bioreactor Effluent Reuse: A Review of Microbial Safety Concerns.Fermentation 2017, 3, 39. [CrossRef]
143. Wang, K.M.; Martin Garcia, N.; Soares, A.; Jefferson, B.; McAdam, E.J. Comparison of fouling betweenaerobic and anaerobic MBR treating municipal wastewater. H2Open J. 2018, 1, 131–159. [CrossRef]
144. Le-Clech, P.; Chen, V.; Fane, T.A.G. Fouling in membrane bioreactors used in wastewater treatment.J. Membr. Sci. 2006, 284, 17–53. [CrossRef]
145. Liu, H.; Gu, J.; Wang, S.; Zhang, M.; Liu, Y. Performance, membrane fouling control and cost analysis of anintegrated anaerobic fixed-film MBR and reverse osmosis process for municipal wastewater reclamation toNEWater-like product water. J. Membr. Sci. 2020, 593, 117442. [CrossRef]
146. Li, Y.; Sim, L.N.; Ho, J.S.; Chong, T.H.; Wu, B.; Liu, Y. Integration of an anaerobic fluidized-bed membranebioreactor (MBR) with zeolite adsorption and reverse osmosis (RO) for municipal wastewater reclamation:Comparison with an anoxic-aerobic MBR coupled with RO. Chemosphere 2020, 245, 125569. [CrossRef]
147. Nataraj, S.K.; Sridhar, S.; Shaikha, I.N.; Reddy, D.S.; Aminabhavi, T.M. Membrane-based microfiltration/
electrodialysis hybrid process for the treatment of paper industry wastewater. Sep. Purif. Technol. 2007, 57,185–192. [CrossRef]
148. Hosseinzadeh, M.; Nabi Bidhendi, G.; Torabian, A.; Mehrdadi, N. A Study on Membrane Bioreactor for WaterReuse from the Effluent of Industrial Town Wastewater Treatment Plant. Iran. J. Toxicol. 2014, 8, 983–990.
149. Atanasova, N.; Dalmau, M.; Comas, J.; Poch, M.; Rodriguez-Roda, I.; Buttiglieri, G. Optimized MBR forgreywater reuse systems in hotel facilities. J. Environ. Manag. 2017, 193, 503–511. [CrossRef]
150. Chae, S.R.; Kang, S.T.; Lee, S.M.; Lee, E.S.; Oh, S.E.; Watanabe, Y.; Shin, H.S. High reuse potential of effluentfrom an innovative vertical submerged membrane bioreactor treating municipal wastewater. Desalination2007, 202, 83–89. [CrossRef]
151. Tepuš, B.; Simonic, M.; Petrinic, I. Comparison between nitrate and pesticide removal from ground waterusing adsorbents and NF and RO membranes. J. Hazard. Mater. 2009, 170, 1210–1217. [CrossRef] [PubMed]
152. Garcia, N.; Moreno, J.; Cartmell, E.; Rodriguez-Roda, I.; Judd, S. The application of microfiltration-reverseosmosis/nanofiltration to trace organics removal for municipal wastewater reuse. Environ. Technol. 2013, 34,3183–3189. [CrossRef] [PubMed]
153. Wang, K.Y.; Yang, Q.; Chung, T.-S.; Rajagopalan, R. Enhanced forward osmosis from chemically modifiedpolybenzimidazole (PBI) nanofiltration hollow fiber membranes with a thin wall. Chem. Eng. Sci. 2009, 64,1577–1584. [CrossRef]
154. Su, J.; Yang, Q.; Teo, J.F.; Chung, T.-S. Cellulose acetate nanofiltration hollow fiber membranes for forwardosmosis processes. J. Membr. Sci. 2010, 355, 36–44. [CrossRef]
155. Tang, W.; Ng, H.Y. Concentration of brine by forward osmosis: Performance and influence of membranestructure. Desalination 2008, 224, 143–153. [CrossRef]
156. Li, L.; Shi, W.; Yu, S. Research on Forward Osmosis Membrane Technology Still Needs Improvement inWater Recovery and Wastewater Treatment. Water 2020, 12, 107. [CrossRef]
157. Fang, Y.; Bian, L.; Bi, Q.; Li, Q.; Wang, X. Evaluation of the pore size distribution of a forward osmosismembrane in three different ways. J. Membr. Sci. 2014, 454, 390–397. [CrossRef]
158. Bellona, C.; Drewes, J.E.; Xu, P.; Amy, G. Factors affecting the rejection of organic solutes during NF/ROtreatment—A literature review. Water Res. 2004, 38, 2795–2809. [CrossRef]
159. Dolar, D.; Racar, M.; Košutic, K. Municipal Wastewater Reclamation and Water Reuse for Irrigation byMembrane Processes. Chem. Biochem. Eng. Q 2019, 3, 417–425. [CrossRef]
160. Bunani, S.; Yörükoglu, E.; Sert, G.; Yüksel, Ü.; Yüksel, M.; Kabay, N. Application of nanofiltration for reuseof municipal wastewater and quality analysis of product water. Desalination 2013, 315, 33–36. [CrossRef]
161. Gozálvez-Zafrilla, J.M.; Sanz-Escribano, D.; Lora-García, J.; León Hidalgo, M.C. Nanofiltration of secondaryeffluent for wastewater reuse in the textile industry. Desalination 2008, 222, 272–279. [CrossRef]

Membranes 2020, 10, 131 49 of 54
162. Potts, D.E.; Ahlert, R.C.; Wang, S.S. A critical review of fouling of reverse osmosis membranes. Desalination1981, 36, 235–264. [CrossRef]
163. Greenlee, L.F.; Lawler, D.F.; Freeman, B.D.; Marrot, B.; Moulin, P. Reverse osmosis desalination: Water sources,technology, and today’s challenges. Water Res. 2009, 43, 2317–2348. [CrossRef] [PubMed]
164. Radjenovic, J.; Petrovic, M.; Ventura, F.; Barceló, D. Rejection of pharmaceuticals in nanofiltration and reverseosmosis membrane drinking water treatment. Water Res. 2008, 42, 3601–3610. [CrossRef] [PubMed]
165. Bellona, C.; Drewes, J.E. The role of membrane surface charge and solute physico-chemical properties in therejection of organic acids by NF membranes. J. Membr. Sci. 2005, 249, 227–234. [CrossRef]
166. Jacob, M.; Guigui, C.; Cabassud, C.; Darras, H.; Lavison, G.; Moulin, L. Performances of RO and NF processesfor wastewater reuse: Tertiary treatment after a conventional activated sludge or a membrane bioreactor.Desalination 2010, 250, 833–839. [CrossRef]
167. Uyanık, I.; Özkan, O.; Koyuncu, I. NF-RO Membrane Performance for Treating the Effluent of an OrganizedIndustrial Zone Wastewater Treatment Plant: Effect of Different UF Types. Water 2017, 9, 506. [CrossRef]
168. Falizi, N.J.; Hacıfazlıoglu, M.C.; Parlar, I.; Kabay, N.; Pek, T.Ö.; Yüksel, M. Evaluation of MBR treatedindustrial wastewater quality before and after desalination by NF and RO processes for agricultural reuse.J. Water Process Eng. 2018, 22, 103–108. [CrossRef]
169. Gündogdu, M.; Jarma, Y.A.; Kabay, N.; Pek, T.Ö.; Yüksel, M. Integration of MBR with NF/RO processesfor industrial wastewater reclamation and water reuse-effect of membrane type on product water quality.J. Water Process Eng. 2019, 29, 100574. [CrossRef]
170. Silva, L.L.S.; Moreira, C.G.; Curzio, B.A.; da Fonseca, F.V. Micropollutant Removal from Water by Membraneand Advanced Oxidation Processes—A Review. J. Water Resour. Prot. 2017, 9, 411–431. [CrossRef]
171. Dolar, D.; Gros, M.; Rodriguez-Mozaz, S.; Moreno, J.; Comas, J.; Rodriguez-Roda, I.; Barceló, D. Removalof emerging contaminants from municipal wastewater with an integrated membrane system, MBR–RO.J. Hazard. Mater. 2012, 239–240, 64–69. [CrossRef] [PubMed]
172. Simon, A.; Nghiem, L.D.; Le-Clech, P.; Khan, S.J.; Drewes, J.E. Effects of membrane degradation on theremoval of pharmaceutically active compounds (PhACs) by NF/RO filtration processes. J. Membr. Sci. 2009,340, 16–25. [CrossRef]
173. Leiknes, T.; Ødegaard, H.; Myklebust, H. Removal of natural organic matter (NOM) in drinking watertreatment by coagulation–microfiltration using metal membranes. J. Membr. Sci. 2004, 242, 47–55. [CrossRef]
174. Al-Juboori, R.A.; Yusaf, T. Biofouling in RO system: Mechanisms, monitoring and controlling. Desalination2012, 302, 1–23. [CrossRef]
175. Baker, J.S.; Dudley, L.Y. Biofouling in membrane systems—A review. Desalination 1998, 118, 81–89. [CrossRef]176. Kim, A.S.; Chen, H.; Yuan, R. EPS biofouling in membrane filtration: An analytic modeling study. J. Colloid
Interface Sci. 2006, 303, 243–249. [CrossRef]177. Malaeb, L.; Ayoub, G.M. Reverse osmosis technology for water treatment: State of the art review. Desalination
2011, 267, 1–8. [CrossRef]178. Chae, S.-R.; Yamamura, H.; Choi, B.; Watanabe, Y. Fouling characteristics of pressurized and submerged
PVDF (polyvinylidene fluoride) microfiltration membranes in a pilot-scale drinking water treatment systemunder low and high turbidity conditions. Desalination 2009, 244, 215–226. [CrossRef]
179. Valavala, R.; Sohn, J.; Han, J.; Her, N.; Yoon, Y.; Valavala, R.; Sohn, J.; Han, J.; Her, N.; Yoon, Y. Pretreatmentin Reverse Osmosis Seawater Desalination: A Short Review. Environ. Eng. Res. 2011, 16, 205–212. [CrossRef]
180. Jamaly, S.; Darwish, N.N.; Ahmed, I.; Hasan, S.W. A short review on reverse osmosis pretreatmenttechnologies. Desalination 2014, 354, 30–38. [CrossRef]
181. Boddu, V.M.; Paul, T.; Page, M.A.; Byl, C.; Ward, L.; Ruan, J. Gray water recycle: Effect of pretreatmenttechnologies on low pressure reverse osmosis treatment. J. Environ. Chem. Eng. 2016, 4, 4435–4443. [CrossRef]
182. Alturki, A.A.; Tadkaew, N.; McDonald, J.A.; Khan, S.J.; Price, W.E.; Nghiem, L.D. Combining MBR andNF/RO membrane filtration for the removal of trace organics in indirect potable water reuse applications.J. Membr. Sci. 2010, 365, 206–215. [CrossRef]
183. Jacob, M.; Li, C.; Guigui, C.; Cabassud, C.; Lavison, G.; Moulin, L. Performance of NF/RO process for indirectpotable reuse: Interactions between micropollutants, micro-organisms and real MBR permeate. Desalin.Water Treat. 2012, 46, 75–86. [CrossRef]

Membranes 2020, 10, 131 50 of 54
184. Tay, M.F.; Liu, C.; Cornelissen, E.R.; Wu, B.; Chong, T.H. The feasibility of nanofiltration membrane bioreactor(NF-MBR)+reverse osmosis (RO) process for water reclamation: Comparison with ultrafiltration membranebioreactor (UF-MBR)+RO process. Water Res. 2018, 129, 180–189. [CrossRef]
185. Gu, J.; Liu, H.; Wang, S.; Zhang, M.; Liu, Y. An innovative anaerobic MBR-reverse osmosis-ion exchangeprocess for energy-efficient reclamation of municipal wastewater to NEWater-like product water. J. Clean. Prod.2019, 230, 1287–1293. [CrossRef]
186. Yin, Z.; Yang, C.; Long, C.; Li, A. Effect of integrated pretreatment technologies on RO membrane fouling fortreating textile secondary effluent: Laboratory and pilot-scale experiments. Chem. Eng. J. 2018, 332, 109–117.[CrossRef]
187. Ferrari, F.; Pijuan, M.; Rodriguez-Roda, I.; Blandin, G. Exploring Submerged Forward Osmosis for WaterRecovery and Pre-Concentration of Wastewater before Anaerobic Digestion: A Pilot Scale Study. Membranes2019, 9, 97. [CrossRef]
188. Zou, S.; He, Z. Enhancing wastewater reuse by forward osmosis with self-diluted commercial fertilizers asdraw solutes. Water Res. 2016, 99, 235–243. [CrossRef]
189. Hube, S.; Eskafi, M.; Hrafnkelsdóttir, K.F.; Bjarnadóttir, B.; Bjarnadóttir, M.Á.; Axelsdóttir, S.; Wu, B. Directmembrane filtration for wastewater treatment and resource recovery: A review. Sci. Total Environ. 2020,710, 136375. [CrossRef]
190. Luo, W.; Phan, H.V.; Xie, M.; Hai, F.I.; Price, W.E.; Elimelech, M.; Nghiem, L.D. Osmotic versus conventionalmembrane bioreactors integrated with reverse osmosis for water reuse: Biological stability, membranefouling, and contaminant removal. Water Res. 2017, 109, 122–134. [CrossRef] [PubMed]
191. Kwan, S.E.; Bar-Zeev, E.; Elimelech, M. Biofouling in forward osmosis and reverse osmosis: Measurementsand mechanisms. J. Membr. Sci. 2015, 493, 703–708. [CrossRef]
192. Cath, T.Y.; Childress, A.E.; Elimelech, M. Forward osmosis: Principles, applications, and recent developments.J. Membr. Sci. 2006, 281, 70–87. [CrossRef]
193. Volpin, F.; Fons, E.; Chekli, L.; Kim, J.E.; Jang, A.; Shon, H.K. Hybrid forward osmosis-reverse osmosis forwastewater reuse and seawater desalination: Understanding the optimal feed solution to minimise fouling.Process Saf. Environ. Prot. 2018, 117, 523–532. [CrossRef]
194. Chun, Y.; Mulcahy, D.; Zou, L.; Kim, I.S. A Short Review of Membrane Fouling in Forward Osmosis Processes.Membranes 2017, 7, 30. [CrossRef]
195. Ansari, A.J.; Hai, F.I.; Price, W.E.; Drewes, J.E.; Nghiem, L.D. Forward osmosis as a platform for resourcerecovery from municipal wastewater-A critical assessment of the literature. J. Membr. Sci. 2017, 529, 195–206.[CrossRef]
196. Der Bruggen, B.V.; Luis, P. Forward osmosis: Understanding the hype. Rev. Chem. Eng. 2015, 31, 1–12.[CrossRef]
197. Corzo, B.; de la Torre, T.; Sans, C.; Escorihuela, R.; Navea, S.; Malfeito, J.J. Long-term evaluation of a forwardosmosis-nanofiltration demonstration plant for wastewater reuse in agriculture. Chem. Eng. J. 2018, 338,383–391. [CrossRef]
198. Cornelissen, E.R.; Harmsen, D.; Beerendonk, E.F.; Qin, J.J.; Oo, H.; de Korte, K.F.; Kappelhof, J.W.M.N.The innovative Osmotic Membrane Bioreactor (OMBR) for reuse of wastewater. Water Sci. Technol. 2011, 63,1557–1565. [CrossRef]
199. Zhang, H.; Ma, Y.; Jiang, T.; Zhang, G.; Yang, F. Influence of activated sludge properties on flux behavior inosmosis membrane bioreactor (OMBR). J. Membr. Sci. 2012, 390–391, 270–276. [CrossRef]
200. Sun, Y.; Tian, J.; Zhao, Z.; Shi, W.; Liu, D.; Cui, F. Membrane fouling of forward osmosis (FO) membranefor municipal wastewater treatment: A comparison between direct FO and OMBR. Water Res. 2016, 104,330–339. [CrossRef] [PubMed]
201. Husnain, T.; Liu, Y.; Riffat, R.; Mi, B. Integration of forward osmosis and membrane distillation for sustainablewastewater reuse. Sep. Purif. Technol. 2015, 156, 424–431. [CrossRef]
202. Giagnorio, M.; Ricceri, F.; Tagliabue, M.; Zaninetta, L.; Tiraferri, A. Hybrid Forward Osmosis–Nanofiltrationfor Wastewater Reuse: System Design. Membranes 2019, 9, 61. [CrossRef] [PubMed]
203. Valladares Linares, R.; Li, Z.; Yangali-Quintanilla, V.; Ghaffour, N.; Amy, G.; Leiknes, T.; Vrouwenvelder, J.S.Life cycle cost of a hybrid forward osmosis–low pressure reverse osmosis system for seawater desalinationand wastewater recovery. Water Res. 2016, 88, 225–234. [CrossRef] [PubMed]
Membranes 2020, 10, 131 51 of 54
204. Shanmuganathan, S.; Vigneswaran, S.; Nguyen, T.V.; Loganathan, P.; Kandasamy, J. Use of nanofiltration andreverse osmosis in reclaiming micro-filtered biologically treated sewage effluent for irrigation. Desalination2015, 364, 119–125. [CrossRef]
205. Bunani, S.; Yörükoglu, E.; Yüksel, Ü.; Kabay, N.; Yüksel, M.; Sert, G. Application of reverse osmosis for reuseof secondary treated urban wastewater in agricultural irrigation. Desalination 2015, 364, 68–74. [CrossRef]
206. Wang, L.; Liang, W.; Chen, W.; Zhang, W.; Mo, J.; Liang, K.; Tang, B.; Zheng, Y.; Jiang, F. Integrated aerobicgranular sludge and membrane process for enabling municipal wastewater treatment and reuse waterproduction. Chem. Eng. J. 2018, 337, 300–311. [CrossRef]
207. Luo, W.; Hai, F.I.; Price, W.E.; Elimelech, M.; Nghiem, L.D. Evaluating ionic organic draw solutes in osmoticmembrane bioreactors for water reuse. J. Membr. Sci. 2016, 514, 636–645. [CrossRef]
208. Dialynas, E.; Diamadopoulos, E. Integration of a membrane bioreactor coupled with reverse osmosis foradvanced treatment of municipal wastewater. Desalination 2009, 238, 302–311. [CrossRef]
209. Mishra, V.; Abrol, G.S.; Dubey, N. Chapter 14-Sodium and Calcium Hypochlorite as Postharvest Disinfectantsfor Fruits and Vegetables. In Postharvest Disinfection of Fruits and Vegetables; Siddiqui, M.W., Ed.; AcademicPress: Cambridge, MA, USA, 2018; pp. 253–272. ISBN 978-0-12-812698-1.
210. Li, H.Y.; Osman, H.; Kang, C.W.; Ba, T. Numerical and experimental investigation of UV disinfection forwater treatment. Appl. Therm. Eng. 2017, 111, 280–291. [CrossRef]
211. Collivignarelli, M.; Abbà, A.; Benigna, I.; Sorlini, S.; Torretta, V. Overview of the Main Disinfection Processesfor Wastewater and Drinking Water Treatment Plants. Sustainability 2017, 10, 86. [CrossRef]
212. Gadelha, J.R.; Allende, A.; López-Gálvez, F.; Fernández, P.; Gil, M.I.; Egea, J.A. Chemical risks associated withready-to-eat vegetables: Quantitative analysis to estimate formation and/or accumulation of disinfectionbyproducts during washing. EFSA J. 2019, 17, e170913. [CrossRef]
213. De Sanctis, M.; Del Moro, G.; Levantesi, C.; Luprano, M.L.; Di Iaconi, C. Integration of an innovativebiological treatment with physical or chemical disinfection for wastewater reuse. Sci. Total Environ. 2016,543, 206–213. [CrossRef] [PubMed]
214. Sharma, V.K. Disinfection performance of Fe(VI) in water and wastewater: A review. Water Sci. Technol.2007, 55, 225–232. [CrossRef] [PubMed]
215. Furst, K.E.; Pecson, B.M.; Webber, B.D.; Mitch, W.A. Tradeoffs between pathogen inactivation and disinfectionbyproduct formation during sequential chlorine and chloramine disinfection for wastewater reuse. Water Res.2018, 143, 579–588. [CrossRef]
216. Chen, C.; Zhang, X.; He, W.; Han, H. Simultaneous control of microorganisms and disinfection by-productsby sequential chlorination. Biomed. Environ. Sci. BES 2007, 20, 119.
217. Li, S.; Shu, Y.; Tang, X.; Lin, P.; Wang, J.; Zhang, X.; Chen, C. Reaction patterns of NDMA precursors during thesequential chlorination process of short-term free chlorination and monochloramination. Sep. Purif. Technol.2018, 204, 196–204. [CrossRef]
218. Wang, X.; Hu, X.; Hu, C.; Wei, D. Sequential use of ultraviolet light and chlorine for reclaimed waterdisinfection. J. Environ. Sci. 2011, 23, 1605–1610. [CrossRef]
219. Haaken, D.; Dittmar, T.; Schmalz, V.; Worch, E. Disinfection of biologically treated wastewater and preventionof biofouling by UV/electrolysis hybrid technology: Influence factors and limits for domestic wastewaterreuse. Water Res. 2014, 52, 20–28. [CrossRef]
220. Liberti, L.; Lopez, A.; Notarnicola, M.; Barnea, N.; Pedahzur, R.; Fattal, B. Comparison of advanceddisinfecting methods for municipal wastewater reuse in agriculture. Water Sci. Technol. 2000, 42, 215–220.[CrossRef]
221. Agulló-Barceló, M.; Polo-López, M.I.; Lucena, F.; Jofre, J.; Fernández-Ibáñez, P. Solar Advanced OxidationProcesses as disinfection tertiary treatments for real wastewater: Implications for water reclamation.Appl. Catal. B Environ. 2013, 136–137, 341–350. [CrossRef]
222. Ike, I.A.; Lee, Y.; Hur, J. Impacts of advanced oxidation processes on disinfection byproducts from dissolvedorganic matter upon post-chlor(am)ination: A critical review. Chem. Eng. J. 2019, 375, 121929. [CrossRef]
223. Bhagyaraj, S.M.; Oluwafemi, O.S.; Kalarikkal, N.; Thomas, S. Applications of Nanomaterials: Advances and KeyTechnologies; Woodhead Publishing: Cambridge, UK, 2018; ISBN 978-0-08-101972-6.
224. Ike, I.A.; Linden, K.G.; Orbell, J.D.; Duke, M. Critical review of the science and sustainability of persulphateadvanced oxidation processes. Chem. Eng. J. 2018, 338, 651–669. [CrossRef]

Membranes 2020, 10, 131 52 of 54
225. Von Gunten, U. Oxidation Processes in Water Treatment: Are We on Track? Environ. Sci. Technol. 2018, 52,5062–5075. [CrossRef]
226. Ganiyu, S.O.; van Hullebusch, E.D.; Cretin, M.; Esposito, G.; Oturan, M.A. Coupling of membrane filtration andadvanced oxidation processes for removal of pharmaceutical residues: A critical review. Sep. Purif. Technol.2015, 156, 891–914. [CrossRef]
227. Brienza, M.; Katsoyiannis, I.A. Sulfate Radical Technologies as Tertiary Treatment for the Removal ofEmerging Contaminants from Wastewater. Sustainability 2017, 9, 1604. [CrossRef]
228. Ferro, G.; Fiorentino, A.; Alferez, M.C.; Polo-López, M.I.; Rizzo, L.; Fernández-Ibáñez, P. Urban wastewaterdisinfection for agricultural reuse: Effect of solar driven AOPs in the inactivation of a multidrug resistant E.coli strain. Appl. Catal. B Environ. 2015, 178, 65–73. [CrossRef]
229. Ho, D.P.; Vigneswaran, S.; Ngo, H.H. Photocatalysis-membrane hybrid system for organic removal frombiologically treated sewage effluent. Sep. Purif. Technol. 2009, 68, 145–152. [CrossRef]
230. Qi, L.; Wang, X.; Xu, Q. Coupling of biological methods with membrane filtration using ozone as pre-treatmentfor water reuse. Desalination 2011, 270, 264–268. [CrossRef]
231. Song, W.; Ravindran, V.; Koel, B.E.; Pirbazari, M. Nanofiltration of natural organic matter with H2O2/UVpretreatment: Fouling mitigation and membrane surface characterization. J. Membr. Sci. 2004, 241, 143–160.[CrossRef]
232. Holloway, R.W.; Miller-Robbie, L.; Patel, M.; Stokes, J.R.; Munakata-Marr, J.; Dadakis, J.; Cath, T.Y. Life-cycleassessment of two potable water reuse technologies: MF/RO/UV–AOP treatment and hybrid osmoticmembrane bioreactors. J. Membr. Sci. 2016, 507, 165–178. [CrossRef]
233. James, C.P.; Germain, E.; Judd, S. Micropollutant removal by advanced oxidation of microfiltered secondaryeffluent for water reuse. Sep. Purif. Technol. 2014, 127, 77–83. [CrossRef]
234. Moser, P.B.; Ricci, B.C.; Reis, B.G.; Neta, L.S.F.; Cerqueira, A.C.; Amaral, M.C.S. Effect of MBR-H2O2/UVHybrid pre-treatment on nanofiltration performance for the treatment of petroleum refinery wastewater.Sep. Purif. Technol. 2018, 192, 176–184. [CrossRef]
235. Szymanski, K.; Morawski, A.W.; Mozia, S. Effectiveness of treatment of secondary effluent from a municipalwastewater treatment plant in a photocatalytic membrane reactor and hybrid UV/H2O2–ultrafiltrationsystem. Chem. Eng. Process.-Process Intensif. 2018, 125, 318–324. [CrossRef]
236. Rodríguez-Chueca, J.; Mesones, S.; Marugán, J. Hybrid UV-C/microfiltration process in membranephotoreactor for wastewater disinfection. Environ. Sci. Pollut. Res. Int. 2019, 26, 36080–36087. [CrossRef][PubMed]
237. Fernández-Alba, A.R.; Hernando, D.; Agüera, A.; Cáceres, J.; Malato, S. Toxicity assays: A way for evaluatingAOPs efficiency. Water Res. 2002, 36, 4255–4262. [CrossRef]
238. Belgiorno, V.; Rizzo, L.; Fatta, D.; Della Rocca, C.; Lofrano, G.; Nikolaou, A.; Naddeo, V.; Meric, S. Review onendocrine disrupting-emerging compounds in urban wastewater: Occurrence and removal by photocatalysisand ultrasonic irradiation for wastewater reuse. Desalination 2007, 215, 166–176. [CrossRef]
239. Gerrity, D.; Pecson, B.; Trussell, R.S.; Trussell, R.R. Potable reuse treatment trains throughout the world.J. Water Supply Res. Technol.-Aqua 2013, 62, 321–338. [CrossRef]
240. Nghiem, L.D.; Tadkaew, N.; Sivakumar, M. Removal of trace organic contaminants by submerged membranebioreactors. Desalination 2009, 236, 127–134. [CrossRef]
241. Wang, X.; Hu, X.; Wang, H.; Hu, C. Synergistic effect of the sequential use of UV irradiation and chlorine todisinfect reclaimed water. Water Res. 2012, 46, 1225–1232. [CrossRef]
242. Park, C.; Hong, S.-W.; Chung, T.H.; Choi, Y.-S. Performance evaluation of pretreatment processes in integratedmembrane system for wastewater reuse. Desalination 2010, 250, 673–676. [CrossRef]
243. Chuang, Y.-H.; Szczuka, A.; Shabani, F.; Munoz, J.; Aflaki, R.; Hammond, S.D.; Mitch, W.A. Pilot-scalecomparison of microfiltration/reverse osmosis and ozone/biological activated carbon with UV/hydrogenperoxide or UV/free chlorine AOP treatment for controlling disinfection byproducts during wastewaterreuse. Water Res. 2019, 152, 215–225. [CrossRef] [PubMed]
244. Yang, Y.; Pignatello, J.J.; Ma, J.; Mitch, W.A. Effect of matrix components on UV/H2O2 and UV/S2O82−advanced oxidation processes for trace organic degradation in reverse osmosis brines from municipalwastewater reuse facilities. Water Res. 2016, 89, 192–200. [CrossRef] [PubMed]

Membranes 2020, 10, 131 53 of 54
245. Blackbeard, J.; Lloyd, J.; Magyar, M.; Mieog, J.; Linden, K.G.; Lester, Y. Demonstrating organic contaminantremoval in an ozone-based water reuse process at full scale. Environ. Sci. Water Res. Technol. 2016, 2, 213–222.[CrossRef]
246. Kim, J.; Song, I.; Oh, H.; Jong, J.; Park, J.; Choung, Y. A laboratory-scale graywater treatment system basedon a membrane filtration and oxidation process—Characteristics of graywater from a residential complex.Desalination 2009, 238, 347–357. [CrossRef]
247. RO Reject Recovery; Pure Water Group: Sprundel, Switzerland, 2019; Available online: https://purewatergroup.com/ro-reject-recovery/ (accessed on 21 June 2020).
248. Venzke, C.D.; Giacobbo, A.; Ferreira, J.Z.; Bernardes, A.M.; Rodrigues, M.A.S. Increasing water recovery rateof membrane hybrid process on the petrochemical wastewater treatment. Process Saf. Environ. Prot. 2018,117, 152–158. [CrossRef]
249. Singh, N.; Dhiman, S.; Basu, S.; Balakrishnan, M.; Petrinic, I.; Helix-Nielsen, C. Dewatering of sewage fornutrients and water recovery by Forward Osmosis (FO) using divalent draw solution. J. Water Process Eng.2019, 31, 100853. [CrossRef]
250. Pretel, R.; Robles, A.; Ruano, M.V.; Seco, A.; Ferrer, J. The operating cost of an anaerobic membrane bioreactor(AnMBR) treating sulphate-rich urban wastewater. Sep. Purif. Technol. 2014, 126, 30–38. [CrossRef]
251. Choukr-Allah, R.; Ragab, R.; Rodriguez-Clemente, R. Integrated Water Resources Management in theMediterranean Region: Dialogue towards New Strategy; Springer Science & Business Media: Berlin/Heidelberg,Germany, 2012; ISBN 978-94-007-4755-5.
252. Relatif à L’utilisation D’eaux Issues du Traitement D’épuration des Eaux Résiduaires Urbaines PourL’irrigation de Cultures ou D’espaces Verts. Available online: https://www.legifrance.gouv.fr/affichTexte.do?cidTexte=JORFTEXT000022753522 (accessed on 2 August 2010).
253. Gurel, M.; Iskender, G.; Ovez, S.; Arslan-Alaton, I.; Tanik, A.; Orhon, D. A global overview of treatedwastewater guidelines and standards for agricultural reuse. Fresenius Environ. Bull. 2007, 16, 590–595.
254. Li, Y.; Su, Y.; Zhao, X.; Zhang, R.; Liu, Y.; Fan, X.; Zhu, J.; Ma, Y.; Liu, Y.; Jiang, Z. Preparation of AntifoulingNanofiltration Membrane via Interfacial Polymerization of Fluorinated Polyamine and Trimesoyl Chloride.Ind. Eng. Chem. Res. 2015, 54, 8302–8310. [CrossRef]
255. Kang, G.; Cao, Y. Development of antifouling reverse osmosis membranes for water treatment: A review.Water Res. 2012, 46, 584–600. [CrossRef] [PubMed]
256. Rana, D.; Matsuura, T. Surface Modifications for Antifouling Membranes. Chem. Rev. 2010, 110, 2448–2471.[CrossRef] [PubMed]
257. Alzahrani, S.; Mohammad, A.W. Challenges and trends in membrane technology implementation forproduced water treatment: A review. J. Water Process Eng. 2014, 4, 107–133. [CrossRef]
258. Li, Y.S.; Yan, L.; Xiang, C.B.; Hong, L.J. Treatment of oily wastewater by organic–inorganic composite tubularultrafiltration (UF) membranes. Desalination 2006, 196, 76–83. [CrossRef]
259. Rashid, S.S.; Liu, Y.-Q. Assessing environmental impacts of large centralized wastewater treatment plantswith combined or separate sewer systems in dry/wet seasons by using LCA. Environ. Sci. Pollut. Res. 2020,1–17. [CrossRef]
260. Aygun, A.; Nas, B.; Berktay, A. Influence of High Organic Loading Rates on COD Removal and SludgeProduction in Moving Bed Biofilm Reactor. Environ. Eng. Sci. 2008, 25, 1311–1316. [CrossRef]
261. Marks, J.S. Taking the public seriously: The case of potable and non potable reuse. Desalination 2006, 187,137–147. [CrossRef]
262. Aitken, V.; Bell, S.; Hills, S.; Rees, L. Public acceptability of indirect potable water reuse in the south-east ofEngland. Water Supply 2014, 14, 875–885. [CrossRef]
263. Burgess, J.; Meeker, M.; Minton, J.; O’Donohue, M. International research agency perspectives on potablewater reuse. Environ. Sci. Water Res. Technol. 2015, 1, 563–580. [CrossRef]
264. Meneses, M.; Pasqualino, J.C.; Castells, F. Environmental assessment of urban wastewater reuse: Treatmentalternatives and applications. Chemosphere 2010, 81, 266–272. [CrossRef]

Membranes 2020, 10, 131 54 of 54
265. Pasqualino, J.C.; Meneses, M.; Castells, F. Life Cycle Assessment of Urban Wastewater Reclamation andReuse Alternatives. J. Ind. Ecol. 2011, 15, 49–63. [CrossRef]
266. Jeong, H.; Broesicke, O.A.; Drew, B.; Crittenden, J.C. Life cycle assessment of small-scale greywater reclamationsystems combined with conventional centralized water systems for the City of Atlanta, Georgia. J. Clean. Prod.2018, 174, 333–342. [CrossRef]
© 2020 by the authors. Licensee MDPI, Basel, Switzerland. This article is an open accessarticle distributed under the terms and conditions of the Creative Commons Attribution(CC BY) license (http://creativecommons.org/licenses/by/4.0/).