Embed Size (px)
Citation preview

12
Membrane Technology in Biological Wastewater Treatment
12.1
Introduction
The high performance of membrane technology has been proven in recent years ina wide range of fields, such as chemical industry, medical technology, drinking wa-ter treatment, biotechnology and environmental technology. The German workgroups of the DWA (ATV-DVWK 2000a, b, 2002a, b; DWA 2005) have provided ex-cellent reports on the application of membranes in the field of wastewater treat-ment. Also, the Chemical Engineering School at the RWTH Aachen has providedimportant knowledge of fundamentals and applications in the whole area of mem-brane technology (Rautenbach and Albrecht 1981, 1989; Melin and Rautenbach2004).
The continuous development of membrane materials and membrane design onthe one hand and the knowledge of operational management on the other handhave fostered the growth of membrane technology in wastewater treatment. Manyquestions have yet to be answered, however, especially in activated sludge systems:
• How can we best implement membranes in activated sludge systems?• Do we need primary settlers if we use a membrane activated sludge process?• Which membrane modules and operating modes are effective and energy effi-
cient? • Is it possible to perform nitrification and phosphate elimination in combination
with membrane processes?
The number of membrane processes installed for the treatment of municipalwastewater is rather low but steadily increasing. In Germany, several large mem-brane processes for wastewater treatment plants (>11 000 inhabitants) are in oper-ation or being planned (MUNLV 2003). The largest one (for 80 000 inhabitants;about 1900 m3 h–1) has been in operation since 2004 in the wastewater treatmentplant (WWTP) at Nordkanal (DWA 2005). The biggest industrial membrane pro-cess in biological wastewater treatment for a flow rate of about 200 m3 h–1 has beenin operation near Dortmund since 2004 for the treatment of wastewater from thepharmaceutical production plant of Schering AG (Achtabowski and Neuhaus2005).
291
Fundamentals of Biological Wastewater Treatment. Udo Wiesmann, In Su Choi, Eva-Maria DombrowskiCopyright © 2007 WILEY-VCH Verlag GmbH & Co. KGaA, WeinheimISBN: 978-3-527-31219-1
SOFTbank E-Book Center Tehran, Phone: 66403879,66493070 For Educational Use.

Industrial wastewater treatment plants are often characterized by low flow ratesand high pollutant concentrations. The benefit of using membranes is the possibil-ity to reuse water in different qualities and the gain of reusable material as well asenvironmental aspects integrated in the production process. Examples for treat-ment of water and wastewater with membranes are given in Table 12.1.
Membrane processes have different targets, such as meeting the guidelines ofwastewater quality standards, the recovery of components or the reuse of the treat-ed water. In the field of municipal wastewater treatment, micro- and ultrafiltrationprocesses are predominantly applied with the target of avoiding the need for a sec-ondary clarifier, increasing the bacterial concentration in activated sludge processor producing an effluent free from suspended solids. In industrial wastewatertreatment and water reuse, nanofiltration and reverse osmosis are preferentiallyused.
292 12 Membrane Technology in Biological Wastewater Treatment
Table 12.1 Examples of membrane processes in wastewater and polluted river water treatment (MUNLV 2003).
Municipal, commercial and industrial applications
Micro- and MBR for treatment of:ultrafiltration – municipal, pharmaceutical
– rendering plant– food industry wastewater– landfill leachateTertiary filtration of treated wastewaterTreatment of distillery wastewaterTreatment of electro dip coating water, oil-in-water emulsions and
degreasing-processes in metal industriesReuse of concentrated water-soluble lacquersPretreatment for production of boiler feed waterTreatment of polluted river water with integrated precipitationElimination of phosphate, iron and manganese
Nanofiltration Elimination of specific compounds like EDS in wastewaterDesalination of wastewaterDiscoloring of wastewater in textile and cellulose industriesConcentration of landfill leachate
Reverse Concentration of CaSO4 from mine-drainage waterosmosis Recycling of silver from washing water in photo industry
Treatment of wastewater in textile-dye industryConcentration of washing water in cellulose industriesReuse of phosphor acidTreatment of chlorine waterTreatment of landfill leachateDesalinationReuse of water
SOFTbank E-Book Center Tehran, Phone: 66403879,66493070 For Educational Use.

12.2
Mass Transport Mechanism
12.2.1
Membrane Characteristics and Definitions
Membranes are flat, semi-permeable structures that are permeable for at least onecomponent and are impermeable for others. According to the nomenclature ofmembrane technology, various membrane processes are characterized accordingto the molar mass or diameter of the transported component, the aggregate stateon the two sides of the membrane as well as the separation principle. The transportcan be caused by gradients of concentration or pressure. Pressure-driven mem-brane processes like micro-, ultra- and nanofiltration as well as reverse osmosis areused in wastewater treatment.
Figure 12.1 shows the classification of membrane processes based on the aver-age particle diameter or molar mass, with a few examples of wastewater compo-nents. Note that the ranges of the separation processes overlap with respect to theparticle diameter and the driving pressure.
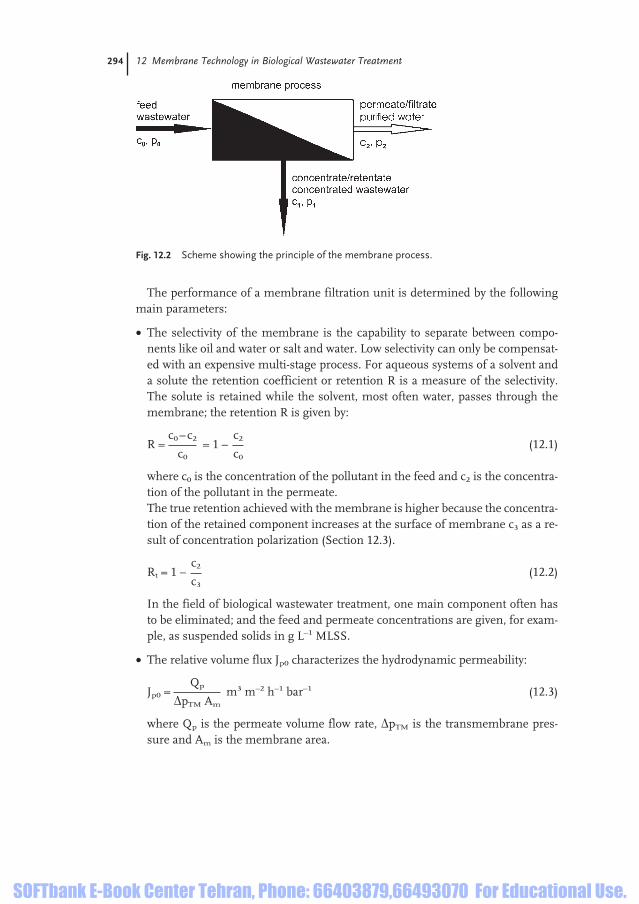
The functional principle behind membrane processes used in wastewater treat-ment are filtration or sorption and diffusion, whereby the wastewater feed is divid-ed into a cleaned part, i.e. the filtrate or permeate, and a concentrated part, i.e. theconcentrate or retentate (Fig. 12.2).
29312.2 Mass Transport Mechanism
Fig. 12.1 Classification of membrane processes used in wastewatertreatment (MUNLV 2003; Rautenbach 1997).
SOFTbank E-Book Center Tehran, Phone: 66403879,66493070 For Educational Use.
The performance of a membrane filtration unit is determined by the followingmain parameters:
• The selectivity of the membrane is the capability to separate between compo-nents like oil and water or salt and water. Low selectivity can only be compensat-ed with an expensive multi-stage process. For aqueous systems of a solvent anda solute the retention coefficient or retention R is a measure of the selectivity.The solute is retained while the solvent, most often water, passes through themembrane; the retention R is given by:
R = = 1 – (12.1)
where c0 is the concentration of the pollutant in the feed and c2 is the concentra-tion of the pollutant in the permeate.The true retention achieved with the membrane is higher because the concentra-tion of the retained component increases at the surface of membrane c3 as a re-sult of concentration polarization (Section 12.3).
Rt = 1 – (12.2)
In the field of biological wastewater treatment, one main component often hasto be eliminated; and the feed and permeate concentrations are given, for exam-ple, as suspended solids in g L–1 MLSS.
• The relative volume flux Jp0 characterizes the hydrodynamic permeability:
Jp0 = m3 m–2 h–1 bar–1 (12.3)
where Qp is the permeate volume flow rate, ÄpTM is the transmembrane pres-sure and Am is the membrane area.
Qp
ÄpTM Am
c2
c3
c2
c0
c0 –c2
c0
294 12 Membrane Technology in Biological Wastewater Treatment
Fig. 12.2 Scheme showing the principle of the membrane process.
SOFTbank E-Book Center Tehran, Phone: 66403879,66493070 For Educational Use.

• The gradient of trans-membrane pressure, i.e. the driving force, is given by:
Äp′ = – p2 (12.4)
which takes into account the pressure drop along the cross-section of the mem-brane p0 – p1.
• Mechanical stability and resistance to fouling and scaling must be considered asother important factors.
Low permeability of a given membrane can be compensated by increasing the mem-brane surface area. The permeate flux Jp or the permeate velocity wp is given by:
Jp = wp = m3 m–2 h–1 (12.5)
The flux and the retention coefficients R and Rt are not constant along the surfacearea of a membrane, even if there is no variability in the quality of the membranematerial. The concentration of the retained component increases continuously andaffects the flux and retention coefficients.
In wastewater treatment, transmembrane pressure ÄpTM varies from 0.1 bar upto 120 bar. The characteristic cut-off of a membrane corresponds either to the par-ticle diameter (in microns) or to the molar mass (measured in Dalton) of the larg-est retained substance.
Qp
Am
p0 +p1
2
29512.2 Mass Transport Mechanism
Fig. 12.3 Concentration and pressure gradients through a solution-diffusion membrane. We have to distinguish Äp′ of Eq. (12.4) from Äp of Figure 12.3.
SOFTbank E-Book Center Tehran, Phone: 66403879,66493070 For Educational Use.

The cut-off of a membrane is determined as the molar mass of macro-moleculesand dissolved substances with a retention coefficient of 90% or 95%. It is deter-mined experimentally by the fractional separation curves for ultrafiltration mem-branes with different substances (Rautenbach 1997) and is often used for the char-acterization of membrane processes with the exception of microfiltration.
Various transport models are employed when studying the selectivity of differ-ent membranes and their transport mechanisms (Rautenbach 1997):
• A black-box model resulting from a large base of experimental results from realsystems of combinations of treated fluids and membranes.
• Semi-empirical models for the real system with regard to physical and chemicalparameters (solution-diffusion and pore model).
• Structural models in fundamental research.
Here we use semi-empirical models because it is common engineering practice toutilize the understanding of physical properties together with results of investigat-ing process parameters. The solution–diffusion model (reverse osmosis and partlynanofiltration) and the pore model (ultra- and microfiltration) can be used with thephysical and chemical background information to reduce the required number ofexperiments for studies and to quantitatively optimize membrane filtration opera-tion in the area of wastewater treatment.
The design and layout of biological wastewater treatment plants with membranebioreactor (MBR) technology has to focus on the requirements of the activatedsludge process. The first guidelines were formulated by ATV-DVWK (2000b) withspecial regard to reactor volume, oxygen transfer rate, pre-treatment of wastewater,sludge disposal and, of course, membrane performance and cleaning (Section12.3).
First we will focus on the most common mechanistic models of mass transportthrough membranes. They are based on diffusion and convection. Then we willconsider resistances to mass transfer, like concentration polarization as well as thecombination of transport mechanisms and resistances. A further combination ofmodels, e.g. the solution–diffusion model and the pore model, is necessary whenusing membranes with an active, deep layer, a porous carrier layer or if a gel-layeris formed.
12.2.2
Mass Transport Through Non-porous Membranes
The solution–diffusion model describes reverse osmosis in ideal membranes aswell as nanofiltration processes in non-porous membranes.
The transport of a component through a non-porous membrane is only possibleby dissolution and diffusion. In this idealized model of mass transport, the mem-brane is treated like a liquid. Figure 12.3 shows the concentration and pressuregradients for an asymmetric membrane, where the active layer is responsible forseparation and the supporting layer for mechanical stability.
296 12 Membrane Technology in Biological Wastewater Treatment
SOFTbank E-Book Center Tehran, Phone: 66403879,66493070 For Educational Use.

The specific mass transfer rate of diffusion is described by Fick’s first law:
JD = – D∇c′ (12.6)
where c′ is the concentration of the dissolved component and D is the diffusion co-efficient.
The diffusion coefficient D is idealized to be independent of concentration. Thatmeans D is constant and not affected by location in the membrane or by concen-tration. For one-dimensional diffusion, the diffusive flux follows as:
JD = – D g m–2 h–1 (12.7)
or (see Fig. 12.3):
JD = – D (12.8)
This is a solution for the steady-state mass balance for diffusion across two planes(e.g. through a thin plate membrane at the points z and z + dz):
0 = – (12.9)
and considering Eq. (12.7):
0 = �D � = D (12.10)
According to Henry’s law, we obtain for ideal systems with linear sorption charac-teristics with respect to the dissolved impurity concentration in the membrane c′:
c = Hc′ (5.6)
JD = (c0 –c2) = B (c0 –c2) (12.11)
with:
B = (12.12)
The membrane constant for the dissolved impurity B is independent of pressurebut is a function of temperature because H and D vary with temperature.
The diffusive water flux follows in analogy to (12.8):
JDW = DW (12.13)
Because of the water surplus, the absorption equilibrium can be described via (par-tial) pressure:
c′W = H′W p (12.14)
and the water flux follows taken together with Eq. (12.13):
c′0W –c′2W
Äz
D
ÄzH
D
ÄzH
d2 c′dz2
dc′dz
d
dz
dJD
dz
c′0 –c′2Äz
dc′dz
29712.2 Mass Transport Mechanism
SOFTbank E-Book Center Tehran, Phone: 66403879,66493070 For Educational Use.

JDW = (p0 – p2) (12.15)
Usually, the water flux is written as a function of the pressure difference:
JDW = ñA(p0 –p2) (12.16)
with:
A = (12.17)
as the membrane constant A and ñ as the density of water. Note that, in contrast tothe dimensionless H (see Eq. 5.6), H′w has the dimension g (m3 bar)–1 (Eq. 12.14).
The membrane constant A for the solvent (here water) is a function of tempera-ture as well as a function of membrane properties [Dw (T), H′w (T)] and the thick-ness of the active layer Äz.
Equation (12.16) is valid if the osmotic pressure Π is negligible. Otherwise thediffusive flux is:
JDW = ñA(p0 –p2 –ÄΠ) (12.18)
with:
Π = – (12.19)
it follows:
ÄΠ = (lnai,o – lnai,2) (12.20)
ai = ãixi = ãi (1 –xj) (12.21)
where ai is the solvent activity, ãi is the activity coefficient, xi is the mole fraction, xj
is the mole fraction of the solute, Vi is the molar volume of the solvent and R is thegas constant.
For ideal mixtures or for very low solute concentrations (xj<<1) the activity coef-ficient ãi is unity (Mulder 2000) and the activity becomes:
ln ai = ln xi = ln (1–xj) ≈ –xj (12.22)
Thus, using the equation for the state of ideal gases for diluted solutions the molarconcentration follows according to the amount of moles Nj and NΣ:
cj = = ≈ (12.23)
At least the osmotic pressure difference between membranes follows:
ÄΠ = RT (c0 –c2) (12.24a)
respectively for dissociating compounds, including the osmotic coefficient â:
ÄΠ = âRT (c0 –c2) (12.24b)
xj
Vj
xj NΣ
V
Nj
V
RT
Vi
RT lnai
Vi
DW H′WñÄz
DW H′WÄz
298 12 Membrane Technology in Biological Wastewater Treatment
SOFTbank E-Book Center Tehran, Phone: 66403879,66493070 For Educational Use.

where c0 is the feed molar concentration of the solute, c2 is the permeate molarconcentration of the solute and â is the osmotic coefficient for the change in num-bers of moles by dissociation, depending on the degree and stoichiometrics of thedissociation reaction (Rautenbach and Albrecht 1981).
From Eqs. (12.23) and (12.24) it follows that ÄΠ is high for high values of c0 andfor low values of c2. Considering concentration polarization, the solute concentra-tion at the membrane surface is c3 >c0 (Section 12.3).
The membrane constants A and B depend on temperature according to expo-nential functions (Rautenbach 1997) because of its influence on D and H (B inEq. 12.12) and on DW and H′W [A in Eq. (12.17)]. Yet the temperature dependencyof B is often neglected for practical purpose. A and B have to be determined experi-mentally. They characterize the permeability of the membrane; the quotient A/B isa degree for the selectivity of the system. For a low A/B the selectivity is high.
Often the designer’s aim is to calculate:
• The flow rate of the water through membrane wp.• The permeate concentration c2.
With the flow rate of permeate wp (Fig. 12.3), we obtain the mass flux JD for thesolute with c2:
JD = wp c2 (12.25)
and for water:
JDW = wp ñ (12.26)
From Eqs. (12.18) and (12.26), the permeate flow rate can be calculated:
wp = = A (p0 –p2 –ÄΠ) (12.27)
From Eqs. (12.25) and (12.11), considering the flow rate according to Eq. (12.27),we obtain:
c2 = = (12.28)
and finally the result for the permeate concentration c2:
c2 = (12.29)
For p0 –p2 =ÄΠ, no water is transported through the reverse osmosis membranebut the dissolved compound is transported, giving finally c2 =c0.
At the membrane surface, some important effects may occur, e.g. concentrationpolarization and fouling processes that have to be taken into consideration (Section12.3). In reverse osmosis and nanofiltration processes osmotic pressure is impor-tant, but even in ultrafiltration processes osmotic pressure can have an effect. Athigh fluxes and high retention values, the concentration of macromolecules atmembrane surface becomes quite high (see Problem 12.1).
Bc0
A(p0 –p2 –ÄΠ) + B
B(c0 –c2)
A (p0 –p2 –ÄΠ)
JD
wp
JDW
ñ
29912.2 Mass Transport Mechanism
SOFTbank E-Book Center Tehran, Phone: 66403879,66493070 For Educational Use.

12.2.3
Mass Transport Through Porous Membranes
The pore model is based on the assumption that the membrane pores are muchsmaller than the diameter of the retained particles but are permeable to water. Incontrast to the solution–diffusion model, water does not diffuse through the pores;rather it flows under the influence of pressure and frictional forces. The pore sys-tem is ideally straight and parallel; and each pore has the same circular size. As aresult of the small capillary diameter, laminar flow conditions are given andHagen–Poiseuille’s law is valid. For pores with diameter d and length L, one canwrite in dimensionless notation:
î = (12.30)
with Reynolds number:
Re = (12.31)
and resistance number î:
î = (12.32)
with wpo as the flow rate in a capillary pore.In reality, the length of pores L is greater than the membrane thickness Äz.
Therefore, a mean tortousity µ is defined:
µ = (12.33)
The flow rate of permeate wp is now given by Hagen–Poiseuille’s law (usingEqs. 12.30 to 12.33) with porosity å:
wp =wpo å = (12.34)
Carman and Kozeny’s pore model (Carman 1956) assumes a pore system formedof equally sized spheres in a packed bed. With permeate flux:
Jp = wp = (12.35)
av = (12.36)
the hydraulic diameter dh for packed beds is introduced (Rautenbach and Albrecht1981):
dh = (12.37)
where av is the volume-specific surface area.
4å
(1–å) av
Apo
V
Äpå3
2ç (1 –å)2 av2 µÄz
d2 å
µÄz
Äp
32ç
L
Äz
d
L
Äp1/2 ñw2
po
wpo d
í
64
Re
300 12 Membrane Technology in Biological Wastewater Treatment
SOFTbank E-Book Center Tehran, Phone: 66403879,66493070 For Educational Use.

Equation (12.35) is known as the Carman–Kozeny equation. For sphere-packedbeds, the tortousity is given as µ=25/12 (Rautenbach and Albrecht 1989). With themembrane constant A*:
A* = (12.38)
the equation shows the linear dependence of permeate flux on the driving force,i.e. the pressure gradient across the membrane:
Jp = A* Äp (12.39)
Comparing the diffusive water flux according to Eq. (12.16), A* corresponds to theproduct of the density and the membrane constant A used in the solution–diffu-sion model.
The linear behavior of Jp in relation to Äp depends only on the membrane con-stant A* of a given membrane. A* must be determined experimentally because itdepends on viscosity, which is a function of temperature. Figure 12.4 shows themembrane-controlled flux.
This model fits micro- and ultrafiltration processes, but in practice a gel layer atthe surface of the membrane and a depositing of particles also affects mass trans-port (see Section 12.3).
12.3Mass Transfer Resistance Mechanisms
12.3.1Preface
In pressure-controlled membrane filtration (e.g. in the field of wastewater treat-ment), mass transfer across the membrane is affected by multiple resistances be-fore and behind the membrane surface. In the case of asymmetric membranesused in ultrafiltration and reverse osmosis, one has a combination of local trans-port resistances. The resistance of the active layer is mostly rate-limiting. In reverseosmosis and in some cases of ultrafiltration, permeate fluxes are low and concen-tration polarization is insignificant because of the high diffusive back-flow of thesmall molecules. All components, even those at the surface of the membrane, re-main soluble; here the membrane itself controls the mass transfer.
In every case where a concentration polarization profile can occur the effect canbe controlled more or less by the flow conditions along the surface of membraneand it is therefore influenced by membrane module design (Section 12.4).
We will now discuss resistances to mass transfer and the most common modelfor the calculation of the concentration c3 at the membrane surface in combinationwith mass transport mechanisms for solution–diffusion and the pore model.
å3
2ç (1 –å)2 av2 µÄz
30112.3 Mass Transfer Resistance Mechanisms
SOFTbank E-Book Center Tehran, Phone: 66403879,66493070 For Educational Use.

12.3.2
Mass Transfer Resistances
Membrane-controlled mass transfer provides the simplest operational conditionfor porous membrane systems with pressure as the driving force. Equation (12.39)is often written in the form of Darcy’s Law (Darcy 1856):
Jp = (12.40)
with:
Rm = = ç·A*–1 m–1 (12.41)
for laminar flow as resistance of membrane Rm. Jp is only controlled by the clean,non-blocked membrane and shows linear behavior (Fig 12.4). A further hydraulicresistance due to pore blocking and adsorption Rf can be considered:
Jp = (12.42)
During a membrane filtration process, the solute concentration at the membranesurface rises; and when the concentration c3 exceeds the solubility limit crystalliza-tion occurs. A gel layer, also known as a sludge cake, is formed by the deposit ofsolids as well as by the growth of bacteria (see Fig. 12.5 in the next section andFig. 12.9 in Section 12.4.3). Practice normally shows non-linear behavior becausethe gel layer controls mass transport (Fig. 12.4).
Gel layer or sludge cake formation is often found above a so-called critical flux(see Section 12.5). The accumulated material simply adds a further resistance Rc
for the sludge cake to the resistance of the free or blocked membrane:
Äp
ç (Rm +Rf)
2 (1 –å)2 a2v µÄz
å3
Äp
çRm
302 12 Membrane Technology in Biological Wastewater Treatment
Fig. 12.4 Permeate flux plot as a function of pressure difference.
SOFTbank E-Book Center Tehran, Phone: 66403879,66493070 For Educational Use.

Jp = (12.43)
respectively:
Jp = (12.44)
12.3.3
Concentration Polarization Model
The classic concentration polarization model describes the fluxes according to con-vective flow and retransfer of the solute, i.e. back diffusion through concentrationboundary layer dependent on the concentration gradient between the bulk regionand the surface of the membrane (Fig. 12.5).
One solution to the mass balance in the boundary layer with thickness ä is ob-tained at steady state conditions, dJΣ/dz = 0. There are two parts of the total flux:the flux of the solute counter to the z-direction, – wp c, and the back diffusion of the solute, –D dc/dz. Assuming that the permeate velocity is independent of the z-coordinate it follows that:
JΣ = – wp c – D (12.45)
After differentiation of Eq. (12.45), we obtain at steady-state conditions:
0 = wp + D (12.46)d2 c
dz2
dc
dz
dc
dz
Äp
çRΣ
Äp
ç (Rm +Rf +Rc)
30312.3 Mass Transfer Resistance Mechanisms
Fig. 12.5 Concentration polarization on the feed side and boundary layer.
SOFTbank E-Book Center Tehran, Phone: 66403879,66493070 For Educational Use.

A possible solution of Eq. (12.46) is the exponential function:
c = a1 + a2 exp (a3 z) (12.47)
and after differentiating Eq. (12.47):
= a3 a2 exp (a3 z) (12.48)
= a32 a2 exp (a3 z) (12.49)
Three boundary conditions are necessary to determine the constants a1, a2 and a3.According to Fig. 12.5: (1) at the boundary layer with thickness ä, the concentrationis the same as in the bulk flow c0, (2) the highest concentration c3 is attained at thesurface of membrane at z = 0, and finally, (3) the condition for the permeate flux ofthe solute is the equality of the sum of convective flux and the back diffusive flux atthe membrane surface:
z = ä, c = c0 (12.50)
z = 0, c = c3 (12.51)
z = 0, –wp c2 = – wp c3 – D ⎜z=0
(12.52)
From Eqs. (12.48) and (12.49) in Eq. (12.46) we obtain:
0 = wp a3 a2 exp (a3 z) + D a23 a2 exp (a3 z) (12.53)
and finally for the constant a3:
a3 = – (12.54)
From Eqs. (12.52) and (12.51) we obtain:
– wp c2 = – wp c3 – D a3 a2 (12.55)
or with Eq. (12.54):
a2 = c3 – c2 (12.56)
Finally, considering condition Eq. (12.50), then Eq. (12.47) gives:
c0 = a1 + (c3 – c2) exp �– ä� (12.57)
respectively:
a1 = c0 – (c3 – c2) exp �– ä� (12.58)
Now, all three integration constants are known and the concentration profile nearmembrane (0^z^ä) follows to:
wp
D
wp
D
wp
D
dc
dz
d2 c
dz2
dc
dz
304 12 Membrane Technology in Biological Wastewater Treatment
SOFTbank E-Book Center Tehran, Phone: 66403879,66493070 For Educational Use.

c = c0 – (c3 –c2) exp �– ä� + (c3 –c2) exp �– z� (12.59)
Considering Eq. (12.51), a simple result describes the dimensionless concentrationpolarization as a function of velocity wp and diffusion coefficient D of the retainedcomponent at the membrane surface z = 0 according to Eq. (12.59):
= exp � ä� (12.60)
The permeate flow rate wp is then given by:
wp = kL ln � � (12.61)
with the mass transfer coefficient:
kL = (12.62)
The mass transfer coefficient can be expressed by dimensionless numbers with wcf
as the cross-flow rate:
Sherwood number: Sh = (12.63)
Schmidt number: Sc = (12.64)
Reynolds number: Re = (12.65)
These numbers and L/d result from a dimensional analysis of the problem. Thedetermination of the relation between the Sherwood, Schmidt and Reynolds num-bers as well as L/d is based on the analogy between heat and mass transport(Table 12.2). For laminar flow and simple geometric conditions, they can be calcu-lated by solving mass and momentum balances. The relations presented are
wcf d
í
í
D
kL d
D
D
ä
c3 –c2
c0 –c2
wp
D
c3 – c2
c0 – c2
wp
D
wp
D
30512.3 Mass Transfer Resistance Mechanisms
Table 12.2 Sherwood number for different flow conditions experimentally proved for mass transport by Linton and Sherwood (1950) and Rautenbach and Albrecht (1981).
Sherwood number Flow condition
Tube Sh = 1.62 (Re Sc d/L)1/3 LaminarSh = 0.023 Re7/8 Sc1/4 TurbulentSh = 0.04 Re3/4 Sc1/3 Turbulent
Canal with rectangular Sh = 1.85 (Re Sc dh/L)1/3 Laminar cross-section Sh = Shtube Turbulent
Re Sc dh/L > 102
SOFTbank E-Book Center Tehran, Phone: 66403879,66493070 For Educational Use.

proven experimentally for mass transport by convection and diffusion in tubes forlaminar and turbulent flow conditions (Linton and Sherwood 1950) and in chan-nels for laminar flow conditions (Rautenbach and Albrecht 1981).
From steady-state laminar flow in tubes of diameter d and length L as well asd/LP1:
Sh = 1.62 �Re Sc �1/3
(12.66)
is valid. After calculation of kL from Eq. (12.66) and introduction into Eq. (12.61),the permeate rate follows:
wp = 1.62 � �1/3
ln � � (12.67)
We must determine not only the concentrations but also the diffusive coefficientD. A possible approximation for D is given by the Stokes Einstein equation inEq. (5.4) as a function of absolute temperature T, solute radius R, dynamic viscos-ity ç and with the Boltzmann constant K (Section 5.1; Mulder 2000):
D = (5.4)
Deviations arise if D and í become dependant on concentration, as observed in theultrafiltration of macromolecules, or when the cross flow rate rises for small valuesof d/L (Rautenbach 1997). This occurs particularly in ultrafiltration processes inthe field of wastewater treatment if suspended solids are present which accumu-late at the boundary layer.
12.3.4
Solution–diffusion Model and Concentration Polarization
The aim is now to calculate wp and c2 as well as ÄΠ. Thus, we need three indepen-dent equations. Considering the increasing concentration c3 at the membrane sur-face for the calculation of ÄΠ and JD, we obtain Eqs. (12.68) and (12.69) fromEq. (12.24b), respectively Eq. (12.11) and (12.12).
ÄΠ = âRT (c3 –c2) (12.68)
JD = B (c3 –c2) (12.69)
For the solution diffusion model (reverse osmosis and nanofiltration) wp followsaccording to Eqs. (12.27) and (12.68):
wp = A(p0 –p2 –âRT(c3 –c2)) (12.70)
Equations for the concentration of the retained component c3 and the permeate c2
are given for c2 according to Eqs. (12.29) and (12.27):
c2 = (12.71)Bc3
wp +B
K T
6 πηR
c3 –c2
c0 –c2
D2 wcf
dL
d
L
306 12 Membrane Technology in Biological Wastewater Treatment
SOFTbank E-Book Center Tehran, Phone: 66403879,66493070 For Educational Use.

The third independent equation is given by elimination of c3 from Eq. (12.61):
c3 = c2 + (c0 –c2) exp (12.72)
After introducing Eq. (12.72) in Eq. (12.71), c3 and c2 can be eliminated:
B c0 exp B c0
c2 = = (12.73)
wp + B exp wp exp �– � + B
c3 follows from Eq. (12.72).
With Eqs. (12.72) and (12.73) in Eq. (12.70), we finally obtain an implicit equationfor wp:
wp c0 exp
wp = A Äp – â RT (12.74)wp + B exp
Equation (12.74) can only be solved by graphical or numerical methods after deter-mination of kL using one of the empirical equations in Table 12.3 (see Section12.4.1). With these solutions, c3 and c2 can be calculated using Eqs. (12.72) and(12.73).
There is, however, a correlation between the true retention coefficient Rt and c3,the concentration at the surface of the membrane according to Eq. (12.2). WithEqs. (12.70) and (12.71), we obtain the true retention coefficient Rt which can becalculated using Eqs. (12.72) and (12.73):
Rt = 1 – (12.75)
Explicit solutions of Eq. (12.74) are possible for some specific cases:
1. If concentration polarization does not occur, c3 =c0, exp (wp/kL)= 1 follows fromEqs. (12.60) and (12.62). Solving the quadratic equation we obtain:
wp = A �Äp – â RT � (12.76)
2. Furthermore, if the membrane is not permeable for the solute (B = 0), the per-meate specific flow rate is:
wp = A (Äp – âRTc0) (12.77)
3. In the case of low feed concentration c0, then ÄΠ can be neglected:
wp = AÄp (12.78)
wp c0
wp +B
B
A(p0 –p2 –âRT(c3 –c2)) + B
wp
kL
wp
kL
wp
kL
wp
kL
wp
kL
wp
kL
30712.3 Mass Transfer Resistance Mechanisms
� �
SOFTbank E-Book Center Tehran, Phone: 66403879,66493070 For Educational Use.

12.3.5
The Pore Model and Concentration Polarization
The permeate flow rate is determined with the pore model via the resistance in se-ries models, as described in Sections 12.3.2.
Different authors use the resistance in a series of models and describe mathemat-ical approaches as well as experimental investigations for estimation of the resis-tances used in Eq. (12.43) (Fu and Dempsey 1998; Melin et al. 2001; Geissler et al.2003; Wintgens et al. 2003). For example, resistances were summarized by Chang etal. (2002) for microfiltration in MBR with Rm =3–22·1011 m–1, Rc =3–48·1011 m–1
and Rf =10–11 m–1 for different membrane materials. In ultrafiltration processes for the reuse of surfactants Rm =5·1012 m–1 and Rf =5–9.1·1012 m–1 was experi-mentally determined for PES membranes for various surfactants (Goers 2000).
The resistance of the sludge cake Rc is a function of the concentration at themembrane surface. It follows from Eq. (12.43) according to the concentration po-larization model.
Chang and Fane (2000) describe the shear stress on micro and ultrafiltrationmembrane surfaces from air bubbling of submerged hollow fibers by slug flowconditions, i.e. based on two-phase flow conditions influenced by the formation ofTaylor bubbles. Melin et al. (2001) and Wintgens et al. (2003) use the same modelof slug flow conditions, considering concentration polarization and hydrodynamiceffects. They use experimental data from the full-scale wastewater treatment plantRödingen in Germany to obtain coefficients for their model. Further investigationsare summarized by Stephenson et al. (2000).
12.4
Performance and Module Design
12.4.1
Membrane Materials
The efficiency of membrane filtration processes in wastewater treatment is deci-sively influenced by the selection of the membrane material for the wastewater tobe treated with regard to the particles and dissolved compounds it contains. There-fore, the membrane material has to be chosen carefully by the supplier in cooper-ation with the plant engineers. It is usually necessary to perform investigations inlaboratory or pilot scale and to test different membrane materials and modules.Table 12.3 presents an overview of common membrane materials.
Depending on the composition and properties of the wastewater to be treated aswell as on the membrane’s mechanical stability, it is possible to use either organicor inorganic solid materials. Once commonly used, cellulose membranes are nowused less often in recent times compared to polymer membranes, like polysulfonePS, polyacrylonitrile PAN and polyethersulfone PES. Because of their resistance tohigh temperatures and chemical stress, the use of inorganic materials like ceram-ics, aluminum, refined steel and glass is becoming more important (MUNLV 2003).
308 12 Membrane Technology in Biological Wastewater Treatment
SOFTbank E-Book Center Tehran, Phone: 66403879,66493070 For Educational Use.

Membranes are either symmetric or asymmetric in structure. That means theyexhibit a homogenous or inhomogeneous dispersion of material. An asymmetricmembrane is constructed by two layers of one material with different porosities(a phase inversion membrane), or by two layers of different materials (a compositemembrane).
The very thin and dense active layer of about 1 µm on the feed side is responsiblefor the membrane’s performance and permeability. The porous second layer is thesupporting structure. Higher fluxes are attainable, especially for solution diffusionmembrane processes, with asymmetric membranes. Both composite and phase inversion membranes can be constructed as porous or non-porous membranes(Rautenbach 1997).
12.4.2
Design and Configuration of Membrane Modules
12.4.2.1 Preliminary RemarksThe following informations are valid generally for all possible applications. Thereare several very different ways to construct membrane modules by the arrange-ment of the inlet and outlet streams. For example, a three-end module for cross-flow configuration consists of a frame construction for the selected membrane
30912.4 Performance and Module Design
Table 12.3 Common membrane materials and membrane structures used in membrane processes (according to ATV-DVWK 2002a).
Membrane Membrane Active layer structure material material
Microfiltration Symmetric, Polymer and Polypropylene PP porous ceramic Polyvinylidenfluoride PVDF
Polysulphone PSUAluminium oxideRefined steelTitanium dioxideZirconium dioxide
Ultrafiltration Asymmetric, Polymer phase inversion, Polysulphone PSUporous composite membrane Reg. cellulose
and ceramic Polyacrylnitrile PANPolyethersulphone PESTitanium dioxideZirconium dioxidePolyvinylidenfluoride PVDF
Nanofiltration Asymmetric, Polymer phase inversion, Polyamide PA dense composite membrane (Zirconium dioxide)
Polyethersulphone PESCellulose acetate CA
Reverse osmosis Asymmetric, Polymer phase inversion, Polyamide PA 95% dense composite membrane Cellulose acetate AC 5%
SOFTbank E-Book Center Tehran, Phone: 66403879,66493070 For Educational Use.
310 12 Membrane Technology in Biological Wastewater Treatment
Tabl
e12
.4C
hara
cter
istic
s, a
dvan
tage
s an
d di
sadv
anta
ges
of p
late
and
tubu
lar
mem
bran
e m
odul
es (
MU
NLV
200
3; V
DM
A 2
005)
.
Tubu
lar
mem
bran
esPl
ate
mem
bran
es
Tubu
lar
mod
ule
Cap
illar
y m
odul
eH
ollo
w fi
ber
mod
ule
Plat
e an
d fr
ame
Spir
al w
ound
M
embr
ane
cush
ion
mod
ule
mod
ule
Act
ive
laye
rIn
side
Ou
t-/i
nsi
deO
ut-
/in
side
Ou
tsid
eO
uts
ide
Ou
tsid
e
Inte
rnal
dia
met
er
5.5–
25m
m0.
25–5
.5m
m0.
04–0
.25
mm
Mem
bran
e su
rfac
eca
. 80
m2
m–
3ca
. 100
0m
2m
–3
ca. 1
000
0 m
2m
–3
40–1
00m
2m
–3
ca. 1
000
m2
m–
340
0m
2m
–3
area
–vol
um
e ra
tio
Con
figu
rati
onC
ross
flo
wD
ead
end/
cros
s D
ead
end
Cro
ss f
low
Dea
d en
d/cr
oss
Dea
d en
d/cr
oss
flow
flow
flow
Adv
anta
ges
Low
blo
ckin
g,
Hig
h s
urf
ace
Ver
y h
igh
su
rfac
e Si
mpl
e ex
chan
ge
Hig
h s
urf
ace
Low
pre
ssu
re d
rop,
low
pre
ssu
re d
rop,
ar
ea–v
olu
me
rati
o,ar
ea–v
olu
me
rati
o,of
mem
bran
es,
area
–vol
um
e ra
tio,
lo
w f
oulin
gge
l lay
er c
ontr
olle
dlo
w d
esig
n c
osts
, lo
w s
peci
fic
low
blo
ckin
gfe
wer
sea
ls,
perm
eate
bac
k-m
embr
ane
cost
s,
low
des
ign
cos
tsw
ash
ing
stab
le a
gain
st h
igh
pr
essu
re
Dis
adva
nta
ges
Low
su
rfac
eLo
w c
ompr
essi
onB
lock
age,
M
any
seal
s,Lo
ng
perm
eate
Low
su
rfac
e
area
–vol
um
e ra
tio
stre
ngt
hpr
essu
re d
rop
low
su
rfac
e w
ays,
ar
ea–v
olu
me
rati
o,
area
–vol
um
e n
o m
ech
anic
al
man
y se
als
rati
o cl
ean
ing,
hig
h
bloc
kage
dan
ger
SOFTbank E-Book Center Tehran, Phone: 66403879,66493070 For Educational Use.

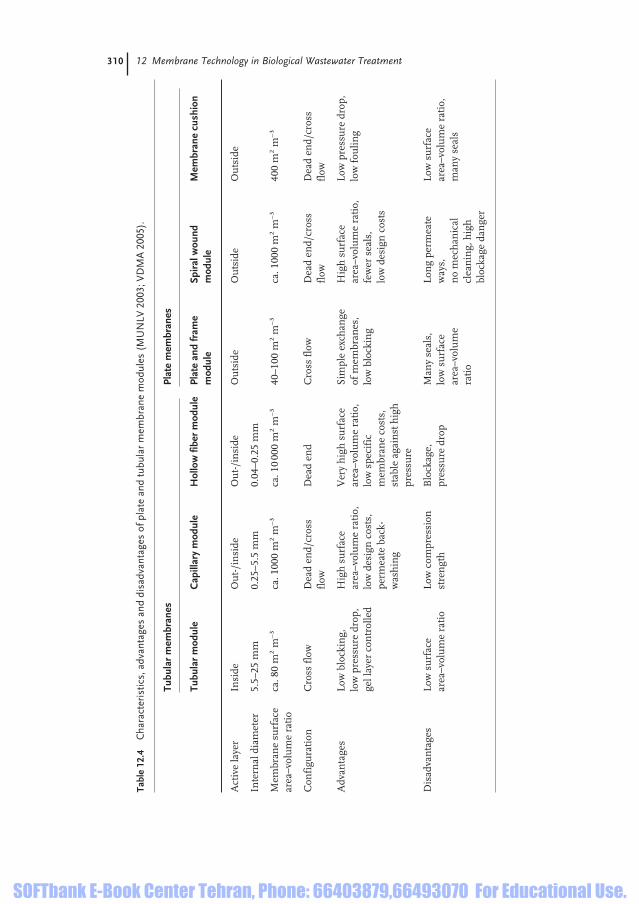
material with connections to one inlet (feed) and two outlet streams (permeate andconcentrate) and a pump providing the driving pressure. Modules with tubular orplate membranes are described in Table 12.4.
Five principle configurations are commonly found (Stephenson et al. 2000):
• Plate-and-frame modules, commonly known from electrolysis stacks, are oftenused for micro- and ultrafiltration and less often for reverse osmosis (e.g. Kubota flat panel; Fig. 12.6a). Similarly, there are membrane cushions with per-meate spacers and support plates welded together with the plate membranes.
• Spiral-wound modules are the standard configuration for reverse osmosis andnanofiltration modules.
31112.4 Performance and Module Design
Fig. 12.6 Membrane modules in submerged mode. (a) Kubota flat panel,submerged in an unit with bubble diffusor. (b) Zenon hollow fibermodule, with air bubbling and a hollow fiber in detail.
SOFTbank E-Book Center Tehran, Phone: 66403879,66493070 For Educational Use.

• Membrane cushions are although used in ultra- and nanofiltration modules.• Hollow fine fiber (Zenon; Fig. 12.6b) and capillary membranes are self-support-
ing membranes with out-to-in flow direction for hollow fibers and in-to-out flowdirection for capillary ones.
• Tubular membranes are used for high turbulence and good cleaning character-istics (Berghof 2005; Fig. 12.7a). An example for a complete process is the Wehr-le ultrafiltration plant in Fig. 12.7b.
Module design has to fulfil the following requirements:
• High ratio of membrane area to module bulk volume.• Low pressure drop, low energy demand.• High degree of turbulence on the feed side to promote mass transfer.• Low costs per unit membrane area.• Good cleaning management.
312 12 Membrane Technology in Biological Wastewater Treatment
Fig. 12.7 Membrane modules in cross-flow mode. (a) Berghof tubular moduleand membranes. (b) Wehrle, MBR, ultrafiltration plant for the food industry.
SOFTbank E-Book Center Tehran, Phone: 66403879,66493070 For Educational Use.

For the treatment of a feed with a high suspended solids concentration, the de-mands for a high membrane area : volume ratio together with a design that facili-tates cleaning is inconsistent and a compromise is necessary. Furthermore, hydro-philic behavior, attainable permeate volume flux, cut-off and operational life of themembrane have to be taken into account. Configurations such as dead-end, sub-merged and cross-flow mode are used for ultra- and microfiltration.
12.4.2.2 Dead-end ConfigurationIn the dead-end filtration process, the flow of the wastewater stream is orthogonalto the membrane and no retentate stream is produced. A two-end module is needed (Fig. 12.8a).
As a consequence, the retained colloids and macromolecules build a layer on themembrane surface which has to be removed periodically. This configuration re-sults in an unsteady process which demands a two-end module and is only suitableif the feed suspended solids concentration is low.
31312.4 Performance and Module Design
Fig. 12.8 Configuration of membrane filtration modules: (a) dead-end mode, (b) submerged mode, (c) cross-flow mode.Ät1 = backwashing period; Ät2 = chemical enhanced cleaning period.
SOFTbank E-Book Center Tehran, Phone: 66403879,66493070 For Educational Use.

12.4.2.3 Submerged ConfigurationA special configuration of a two-end module is the submerged mode because across flow near membrane surface is applied without producing an additional stream (Fig. 12.8b). To minimize the building of a sludge cake layer and to avoidthe high energy cost for high turbulence cross flow, a submerged system is used.The membranes are immersed directly in the activated sludge tank, where intensi-fied aeration produces cross flow at the membrane surface (see Fig. 12.6b). Inves-tigations have been performed on the influence of shear stress induced by bubbles(see Section 12.3.5). Permeate is removed by vacuum at transmembrane pressuresof about 0.05 bar to 0.6 bar (Günder 1999; ATV-DVWK 2002b).
Transmembrane pressure is remarkably lower than 1 bar because of the drop inpressure which results from the water column above the submerged membrane.The rejected biomass remains in the bioreactor and the purified water passesthrough the membranes, usually from the outside in. Hollow fibers are flexibleand move slightly to reduce gel layer formation because they are slightly longerthan the module length and are therefore free to move (see Fig. 12.8b).
One significant characteristic of the submerged system is its operation in quasisteady state, in contrast to dead-end mode, and its higher frequency of back washing.Compared to the cross-flow configuration, there is less energy used (per m3 per-meate) but a greater membrane surface area is needed because of the low attainablefluxes in submerged systems. Recently, submerged systems have become highly sig-nificant in the field of aerobic biological wastewater treatment. The advantages anddisadvantages of dead-end and submerged mode are summarized in Table 12.5.
Enhanced permeate flux was proven to be a result of two-phase flow. Gas-sparged ultrafiltration with tubular membranes has been investigated experimen-tally with different suspensions as well as with river water (Chang and Fane 2000;Cabbasud et al. 2001) although computational fluid dynamics (CFD) were used tomodel this two-phase flow conditions (Taha and Cui 2002).
12.4.2.4 Cross-flow ConfigurationIn cross-flow filtration, the wastewater flow is parallel to the membrane (Fig.12.8c). There is a continuous retentate stream in addition to the feed and permeatestream; and a three-end module is necessary. The retained material builds a layeron the surface of the membrane which can be influenced by the cross-flow rate.Thus the process is in continuous operation (see Table 12.5).
The reversible gel layer can be controlled by cross-flow conditions, while an irre-versible gel layer has to be removed by a cleaning procedure. Gel layer-controlledfiltration helps to protect microfiltration membranes from pore blockage. In gen-eral, there are two methods to control the severity of the reversible gel layer. Whenhigh turbulence at the membrane surface is realized by higher cross-flow rate withor without air injection, it leads to high energy costs. Higher turbulence can be ob-tained, though, by the use of smaller hydraulic diameters of membrane canals intubular or flat membranes. This, however, increases the risk of blockage. Some ex-amples of alternative methods to produce higher turbulence are the modules withrotor and stator system, e.g. VRM-Modul in WWTP Knautnaundorf (Stein 2003).
314 12 Membrane Technology in Biological Wastewater Treatment
SOFTbank E-Book Center Tehran, Phone: 66403879,66493070 For Educational Use.

Another way to control gel layer formation is to use interval back flushing butwith the disadvantage of a poor water recovery rate in the range of 80–90% of thefeed flow. Intervals for back-flushing and chemically enhanced cleaning dependgreatly on water quality and are often necessary in the case of river water process-ing (Dietze 2004).
12.4.3
Membrane Fouling and Cleaning Management
12.4.3.1 Types of Fouling ProcessesThe major symptoms of fouling are a decline in flux over operating time, increas-ing transmembrane pressure, sludge cake formation and changes to the retentioncoefficient Rt (see Eq. 12.75). Stationary filtration behavior is not possible. Fouling
31512.4 Performance and Module Design
Table 12.5 Advantages and disadvantages of dead-end (unsteady and submerged mode) and cross-flow mode in membrane filtration of wastewater (Chang and Fane, 2000; ATV-DVWK 2002b; Melin and Rautenbach 2004).
Configuration of MBR Advantages and disadvantages
Dead-end mode Unsteady state processRequires low suspended solids in feed streamLow specific energy costs of 0.1–0.5 kWh m–3
Module and membrane blockingBack-washing if stable versus compressionLong filtration intervalsPeriodic cleaning managementFinal filtration of wastewater
Submerged mode Quasi-steady stateHigh suspended solids in the feed treatableLow specific energy costs of 0.3–0.7 kWh m–3
Low fluxes of about 10–30 L m–2 h–1
Less stress for biomassTwo-phase flow pattern for hydrodynamical influence on deposits,
permanent bubblingHigh investment, low operational costsBack-washing with and without airShort filtration intervalsPeriodic cleaning management
Cross-flow mode Requires reversible gel layer for steady state processin steady state High suspended solids treatable
Highest specific energy costs of 2.5–6.0 kWh m–3
High fluxes of about 100 L m–2 h–1
With cross-flow of wcf 3–6 m s–1
High stress for biomassLow investment but high operational costsBack-washing with and without airPeriodic cleaning management
SOFTbank E-Book Center Tehran, Phone: 66403879,66493070 For Educational Use.

occurs if a critical flux is exceeded. Chang et al. (2002) defined the critical flux asthe highest flux for which the transmembrane pressure remains constant based ondata from a step-by-step increase in flux, depending on the type of membrane ma-terial, MLSS and cross-flow velocity. However, there is a transition between con-centration polarization and stagnant cake formation (Chen et al. 1997). For a rela-tively high c3, polymerization and precipitation can occur, resulting in solid cakes.To a certain extent, nearly every feed component leads to membrane fouling.
The formation of surface deposits on membranes is influenced by feed compo-sition, flow conditions, the chemical nature of the membrane and interactionsbetween components and the membrane. The type of fouling depends on the na-ture of deposit components (Fleming 1995). We distinguish:
• Scaling or mineral fouling is the deposit of inorganic material with crystal struc-tures like salts.
• Organic fouling is the deposit of organic material like grease, oil, surfactants,proteins and humic substances.
• Colloidal fouling is the deposit of particles like clay and metal-oxides or hydrox-ides.
• Bio-fouling is the formation of bio-films by microorganisms captured and grow-ing at the surface. A secondary phenomenon is the excretion of enzymes and ex-tracellular polymeric substances (EPS) which influence the gel layer.
Deposits which can be detached by cleaning processes, like back-flushing andmechanical cleaning, are called reversible fouling and cause a reversible gel layerformation. Deposits which lead to an irreversible gel layer formation can only beremoved by chemical cleaning procedures and are called irreversible fouling(Rautenbach and Albrecht 1989). Therefore, fouling can be controlled only to acertain degree by hydrodynamics.
Different fouling mechanisms are shown in Fig. 12.9. An irreversible sludgecake layer is formed by particles, contaminants and agglomerates of contaminantswhich are bigger than the pore size of the membrane.
Due to the heterogeneous nature of bioreactors, mixed liquor fouling is difficultto predict and control in a MBR. Factors affecting fouling are (Chang et al. 2002;Lee et al. 2003; Rosenberger 2003; Shon et al. 2004):
• The membrane material hydrophobicity, porosity and pore size and distribution.• The mass of microorganism MLSS and of extra-cellular polymeric substances
EPS, floc structure, dissolved matter and floc size.• The operating conditions e.g. configuration, cross flow velocity, aeration, hy-
draulic and solid retention time and trans-membrane pressure.
12.4.3.2 Membrane Cleaning StrategiesTo reduce the two negative influences of concentration polarization and decreas-ing flux rates which result from fouling, a cleaning strategy has to be developed to-gether with the membrane suppliers which is adapted to the wastewater character-istics, the membrane material and the configuration of the membrane filtration
316 12 Membrane Technology in Biological Wastewater Treatment
SOFTbank E-Book Center Tehran, Phone: 66403879,66493070 For Educational Use.

process. In general, process integrated back-flushing during the filtration processis used to maintain a constant flux. Periodically in situ cleaning with chemicals andintensive washing with chemicals ex situ are necessary to remove irreversible de-posits.
MBR processes in submerged or cross-flow mode often use fixed-interval back-washing or back-flushing with permeate, whereby reverse flow is used to wash-outreversible fouling. Usually, a filtration process cycle of about 10 min is followed bya back-washing time of 1 min, resulting in a water recovery of at least 90% asshown in Fig. 12.8. Experiments are necessary to optimize two factors: (a) per-meate loss by back-washing and (b) the slight decrease in permeate flux which re-quires maintenance cleaning to recover 100% flux. In submerged systems, inten-sified aeration in a range of 0.21–3.0 m3 m–2 h–1 is also used to prevent fouling(Benedek and Côté 2003; Cornel et al. 2001).
Maintenance cleaning is done at longer intervals with various chemicals. Thechemicals used and the interval chosen must be specifically adapted to the range ofapplication to avoid membrane damage or the formation of harmful substances(ATV-DVWK 2002b). Chemical cleaning usually restores the permeate flux butproduces a certain amount of contaminated water.
In situ chemically enhanced cleaning procedures (intermediate cleaning) areused in MBR processes if the flux decreases by about 20% down to 100 L m–2 h–1
bar–1, or as dictated by a cleaning management time table.
31712.4 Performance and Module Design
Fig. 12.9 Fouling mechanisms, adapted from Melin and Rautenbach (2004).
SOFTbank E-Book Center Tehran, Phone: 66403879,66493070 For Educational Use.

Acidic solutions are used particularly for the elimination of inorganic foulingcausing substances and alkaline solutions for the oxidation of organic foulants.Disinfectants may be used to eliminate microorganisms. Commonly used com-mercial purifiers contain active chlorine concentrations between 300 mg L–1
(Wehrle Umwelt 2005) and 2000 mg L–1 (MUNLV 2003), or may contain specialmixtures of acids, leaching agents, surfactants, active enzymes (Berghof 2005) orhydrogen peroxide (AV Aggerwasser 2005). Tests are also often performed with cit-ric acid, NaOH, HCL, oxalic acid (Wozniak 2003) and nitro-hydrochloric acid. So-dium hypochlorite is known to recover total permeability, but its use is decreasingbecause of the damage caused to microorganisms at high concentrations (MUNLV2003). Heating of the purifiers, sometimes in a separate tank, may be necessary toreach the required cleaning temperature of 35–40°C.
An intensive ex situ cleaning (main cleaning) is necessary at least twice a year.The typical cleaning management program combines alternating chemical clean-ing and clean water rinsing for neutralization and a reaction procedure enhancedwith chemicals.
12.5
Membrane Bioreactors
12.5.1
Final Treatment (Behind the Secondary Clarifier)
The methods of industrial and municipal wastewater treatment have alreadyachieved a high standard by combining biological and mechanical processes andadditional treatment steps for the elimination of phosphorus and nitrogen (seeChapter 10). However, the microbiological quality of effluents is still a burden forsurface waters. Pathogens like bacteria, viruses and parasites are a problem, partic-ularly for bathing waters in summer, or in areas with drinking water reservoirs.There are different standards in effect, such as the EU Water Framework Directive(EU 2000) with the aim to reach a high ecological water quality by 2015, or the EECCouncil Directive 76/160/EEC of 8 December 1975 concerning the quality of bath-ing waters (EEC 1991; Table 12.6).
Ultra- and microfiltration are of high interest as a post-treatment method aftersedimentation, and recently, as an alternative to the traditional gravity settlers usedin municipal wastewater treatment to meet the quality standards mentioned above.
The high efficiency of membrane systems as a final treatment in municipalWWTP was investigated and proven by Altmann et al. (1995) in Berlin–Ruhleben.In pilot-scale experiments, five different membrane systems were investigated in combination with phosphate precipitation. Microorganisms were found to beeliminated by a factor of several orders of magnitude and viruses were typically adsorbed on suspended solids, which were eliminated (see Fig. 12.10 in Section12.5.2). An alternative is to couple biological treatment with sand filtration.
318 12 Membrane Technology in Biological Wastewater Treatment
SOFTbank E-Book Center Tehran, Phone: 66403879,66493070 For Educational Use.

12.5.2
Membrane Bioreactors in Aerobic Wastewater Treatment
The combination of biological and membrane filtration processes is known as amembrane bioreactor (MBR) system. The benefits of MBR systems in submergedor external cross-flow mode are (ATV-DVWK, 2000b; DWA 2005):
• High microbiological quality of effluent water resulting from the high removalefficiency of suspended solids, microorganisms and viruses.
• Greater freedom to vary process parameters, like the reduction of excess sludgeor the concentration of slowly growing organisms because MBR systems are in-dependent on the sedimentation behavior of sludge.
• Volume reduction of the activated sludge tank because of higher biomass con-centration and elimination of the sedimentation tank, both resulting in a reduc-tion of the total plant footprint (Côté and Liu 2003).
The financial success of MBR is largely determined by the processes used to re-store decreased flux caused by fouling. The resulting disadvantages of MBR are thehigh investment cost for the needed membrane surface area and/or high operatingcosts for cleaning management and the energy demand for cross-flow mode on topof the cost for supplying oxygen to microorganisms (Choi 2005; DWA 2005).
The discharge of harmful substances, like endocrine-disrupting substances(EDS) into municipal and industrial wastewater and their passage through WWTPhas also been investigated (Filali-Meknassi et al. 2004). Reverse osmosis and nano-filtration processes are able to reject EDS (Fig. 12.1), but sorption was found to bethe main elimination process in sewage and industrial wastewater treatment,hence the elimination efficiency was high for MBR (Kunst 2002; Gallenkemper etal. 2003; Schäfer et al. 2003; Oschmann et al. 2005).
31912.5 Membrane Bioreactors
Table 12.6 Requirements for post treatment of effluents from WWTP Microbiological Standard in EEC Council Directive 76/160/EEC of 8 December 1975 concerning the quality of bathing water (EEC 1991).
Parameter Imperative value Guide value
Total coliform bacteria 500 10000(cells/100 mL)
Fecal coliform bacteria 100 2000 (cells/100 mL)
Streptococcus faecalis 100 –(cells/100 mL)
Salmonella – 0(cells/1 L)
Bowel viruses – 0(PFU/10 L)
SOFTbank E-Book Center Tehran, Phone: 66403879,66493070 For Educational Use.

Recently, submerged membranes have been applied in large-scale activatedsludge plants more and more often because of the economical advantages of lowpressure processes. By 2004, several commercial municipal WWTP in Germanyhad been built with submerged MBR systems for more than 100 000 inhabitants;and common permeate fluxes are 8–30 L (m2 h)–1. The percentage of submergedsystems is still increasing, evidently for small-scale systems (Bischof et al. 2005;Brinkmeyer et al. 2005).
Figure 12.10 gives an overview of the membrane filtration process in compari-son with conventional wastewater treatment.
In cross-flow mode (Fig. 12.10c), the higher operational pressure of about 3 baris provided by pressure pumps and a loop or recycling stream is used to increaseshear at the membrane surface to attain high fluxes (e.g. BIOMEMBRAT used inactivated sludge plants of food industries). Air bubbling and periodic back-flushingis possible. To date, no application of cross-flow mode in municipal WWTPs hasbeen realized.
320 12 Membrane Technology in Biological Wastewater Treatment
Fig. 12.10 MBR systems, external and submerged mode in comparisonwith a conventional activated sludge system.
SOFTbank E-Book Center Tehran, Phone: 66403879,66493070 For Educational Use.

In the submerged mode (Fig. 12.10d), the membrane modules are directly in-stalled in the activated sludge bioreactor or immersed in an aerated separate con-tainer (e.g. ZeeWeed-Cassettes; Cornel et al. 2001). Air bubbling plays a significantrole in attaining high fluxes (Section 12.4.3) and periodic back-flushing is used toreduce fouling.
The retention efficiency of the separation process is not influenced by gas bub-bles, floating sludge or bulky flocs with lower density. Performance characteristicsof MBR systems are given in Table 12.7 in comparison with conventional WWTP.The minimum solid retention time with nitrification is 15 d for both systems, ac-cording to ATV-DVWK (2000a).
In the case of a MBR, the retention time of the sludge is unaffected by sedimen-tation behavior (Fig. 12.10c, d) and very high sludge ages (see Section 6.2.3) can bereached; but for municipal WWTP sludge ages of 15 d and sludge concentration of8–16 g L–1 MLSS are common (Table 12.8). Activated sludge with such high con-centration exhibits non-Newtonian behavior, the apparent viscosity is a function ofg L–1 MLSS as well as shear gradient and affects both oxygen mass transfer and thedegree of mixing (Rosenberger 2003; Kubin 2004; Choi 2005). The relative oxygentransfer ratio αw (see Eq. 5.12) for different WWTP under operational conditions isfound to be in the range of 0.25 to 0.8 for X and the range of 1–17 g L–1 MLSS(Cornel et al. 2001; Drews and Kraume 2005; DWA 2005).
Removal efficiency rises with increasing MLSS concentration, but a maximumremoval of 96–97% cannot be exceeded. COD removal efficiency was summarizedby Kubin (2004) and Drews and Kraume (2005).
We summarize data for some German MBRs in the field of municipal wastewa-ter treatment in Table 12.8. These all operate with submerged membrane mod-ules. The positive experience gained over several years of operation has led to fur-
32112.5 Membrane Bioreactors
Table 12.7 Performance characteristic of conventional activated sludge process and MBR (Günder 1999; ATV-DVWK 2000b; Cornel et al. 2001; Côté and Liu 2003; MUNLV 2003).
Parameter Conventional MBRWWTP
X g L–1 MLSS <5 8.0–16.0tRX d 15 15.0tR h 23 3.6–8.0BX kg BSB5 kg–1 d–1 MLSS <0.08 <0.08α, O2 transfer ratio – 0.6 0.6
Effluent dataS mg L–1 COD 40–50 <30.0Nges mg L–1 <13 <13.0Pges mg L–1 0.8–1.0 <0.3Xe mg L–1 MLSS 10–15 0Microbiological – Hygienically Bathing quality critical water quality
SOFTbank E-Book Center Tehran, Phone: 66403879,66493070 For Educational Use.

ther applications. For example, in WWTP Markranstädt (Stein 2003) the hollowfiber membrane filtration modules are located in the upper part of the nitrificationtank. Mixing units are installed together with aeration to reduce fouling. An ex situ cleaning shaft located between the nitrification lines is in place to take up themodules for the cleaning procedures. Another concept is followed with separatedmembrane filtration containers in WWTP Büchel (Wozniak 2003) and WWTPRödingen (Engelhardt 2003). These filtration containers are aerated and the waste-water is recycled between the nitrification and denitrification tanks and the filtra-tion containers, where nitrification also takes place.
322 12 Membrane Technology in Biological Wastewater Treatment
Table 12.8 Membrane bioreactors in municipal wastewater treatment plants, submerged mode (Engelhardt 2003; Stein 2003; Voßenkaul et al. 2003; MUNLV 2003; Wozniak 2003; De Wilde et al. 2005; Roest et al. 2005; Rondi and Montagnoli 2005).
Year WWTP operator Company, membrane, Q AM
configuration, m3h–1) (103 m2)submerged mode
1999 Rödingen Zenon, hollow fiber 135 4.846Erftverband
2004 Nordkanal Zenon, hollow fiber 1881 85Erftverband
1999 Büchel Kubota, plate membrane 40 0.96Aggerverband
2004 Seelscheid Kubota, plate membrane 356 12.48Aggerverband
2000 Markranstädt Zenon, hollow fiber 180 8.8kommunale Wasserwerke Leipzig
2002 Knautnaundorf Martin System AG, 23 0.756 kommunale Wasserwerke rotating plate membraneLeipzig
2004 Markkleeberg Zenon, hollow fiber 710 28.4kommunale Wasserwerke Leipzig
2003 Simmerath Puron, hollow fiber Bypass 1.0Wasserverbd. Eifel-Ruhr
2003 Monheim Zenon, hollow fiber 288 12.32Stadt Monheim
2004 Waldmössingen Zenon, hollow fiber 90 5.3Stadtwerke Schramberg
2003 Schilde Zenon, hollow fiber 355 10.56(Belgium)
2003 Brescia Zenon, hollow fiber 1750 –(Italy)
2004 Varsseveld Zenon, hollow fiber 755 20.16(The Netherlands)
SOFTbank E-Book Center Tehran, Phone: 66403879,66493070 For Educational Use.

Experience with the WWTPs mentioned above has shown the importance of anintensive pre-treatment of wastewater by filtration. To reduce membrane foulingby the deposit of particles, it is necessary to perform additional pre-treatment ofwastewater with a grid or a sieve <1 mm (Engelhardt 2003; Stein 2003; DWA 2005).Especially the fibrous components of the untreated wastewater leave deposits inthe upper part of hollow fiber modules.
The costs associated with MBR systems operating in cross-flow and submergedmode have been analyzed by Melin and Rautenbach (2004), who showed in esti-mated overall operating cost of 0.57 € m–3 for cross-flow mode and 0.56 € m–3
for submerged mode in sewage WWTP at small scales with volume rates of100 m3 h–1. Overall operational costs for existing MBRs in wastewater treatment inthe food industries were found to be 0.90 € m–3 (Wienands and Streif 2005), whilethe highest costs of cross-flow mode come from the energy consumption and thehighest costs for submerged mode result from the investment in the membrane.The energy consumption of submerged systems has been measured between0.8 kWh m–3 and 4 kWh m–3. Optimization of the aeration management leads to areduction of energy consumption by about 35% and a consumption of less than1 kWh m–3 has been predicted (Engelhardt 2003).
12.5.3
Membrane Bioreactors and Nutrient Removal
To achieve nitrogen removal with a MBR system, aerobic–anoxic operation condi-tions are necessary as in the conventional process (see Section 10.4.2). A MBR of-fers good nitrification conditions because of the high retention of sludge allowed.Therefore, even slowly growing nitrifying bacteria have an excellent chance to es-tablish themselves in the aerated tank. Nitrogen removal with preliminary denit-rification (see Fig. 10.9a) and with post-denitrification (see Fig. 12.11b) is in oper-ation with MBRs (Brepols et al. 2005). Investigations have also been performed insmall-scale applications with post-denitrification without dosage of a carbonsource (Gnirß 2005; Maas 2005).
The high oxygen transfer associated with submerged membranes creates a needfor a larger denitrification zone (Engelhardt 2003; Gnirß et al. 2003; MUNLV2003). In the case of post-denitrification, the membrane modules are located in aseparate container behind the anoxic zone with optiomal aeration to avoid sludgecake formation (Adam 2004; Drews et al. 2005).
Phosphorus elimination by simultaneous precipitation is a well known tech-nique in conventional wastewater treatment and is also used in MBR. The highMLSS retention efficiency of the membrane process significantly reduces thedischarge of coagulant chemicals and leads, therefore, to less loading of rivers. Insurface water processing, Dietze (2004) achieved low phosphate concentrations(<15 µg L–1 PO4-P) in permeate using phosphorus flocculation and membrane fil-tration while reducing the coagulant and salts discharge, compared to traditionalflocculation and sand filtration.
32312.5 Membrane Bioreactors
SOFTbank E-Book Center Tehran, Phone: 66403879,66493070 For Educational Use.

Investigations have been conducted to combine biological phosphorus elimina-tion with an anaerobic zone, not only in WWTP (Section 10.4.3, Fig. 10.9a) but al-so in the MBR process to reduce the use of chemicals like FeCl3. The question re-mains whether the high sludge ages used in MBR yield higher phosphorus elimi-nation capacities. The high retention of MLSS and the prevention of phosphorusrelease caused by the high oxygen concentration in the MBR system lead to a highefficiency (Gnirß et al. 2003). Orthophosphates from release cannot be retained byultrafiltration membranes (Adam 2004).
PROBLEM 12.1
When do we have to consider the impact of osmotic pressure?Calculate the osmotic pressure for two aqueous solutions, considering com-plete retention (c2 =0 mg L–1) and neglecting concentration polarization. Thefeed contains 15 g L–1 NaCl and 15 g L–1 glucose (T = 288.2 K, R = 8.31 J mol–1
K–1).
Solution
NaCl, molar mass M = 58 g mol–1, the osmotic pressure increases as a resultof dissociation as the number of moles increases (Rautenbach and Albrecht1981). For complete dissociation of NaCl â = 2 follows, we obtain fromEq. (12.24b):
ÄΠ = = 12.4 = 12.4 = 12.4 bar105 N
m2
105 J
m3
g J mol K
L g mol K
2 ·15·8.31·288.2
58
324 12 Membrane Technology in Biological Wastewater Treatment
Fig. 12.11 MBR and nutrient removal with submerged membranes with: (a) preliminary denitrification, (b) post-denitrification without substrate dosage and with biological phosphorus removel.
SOFTbank E-Book Center Tehran, Phone: 66403879,66493070 For Educational Use.

Glucose, molar mass M = 181 g mol–1. At the cut-off of nanofiltration mem-branes, we obtain from Eq. (12.24a):
ÄΠ = = 198 = 2 = 2 = 2 bar
Considering concentration polarization and increasing concentration of thefeed in the direction of flow, the osmotic pressure increases. For particleslike bacteria or colloids >10000 g mol–1, the influence of osmotic pressure isnegligible.
PROBLEM 12.2
What membrane surface area is required for a WWTP for 100 000 inhabi-tants, considering permeate fluxes Jp10 at 10 °C? (Jp8 = 25 L m–2 h–1)The common design method of a WWTP is based on ATV-DVWK-Arbeits-blatt A 131 (ATV-DVWK 2000a). The maximum flow rate Qm is determinedby the dry-weather flow Qs and the average wastewater from other areas Qf.According to ATV-DVWK-Arbeitsblatt A 198 (ATV-DVWK 1992), the flowrate is given by:
Qm62Qs + Qf L s–1 (12.79)
To determine the maximum inlet flow rate Qm we choose:
Qm = 3.5Qs + Qf (12.80)
Qs is the average sewage flow rate according to the median discharge perhousehold, commercial and industrial wastewater, here for 100 000 inhabi-tants, with a specific volume rate of inhabitants (inh.) of 130 L (inh. d)–1. Qf is annual average extrameous wastewater from other areas, here wechoose 6000 m3 d–1.
Solution
For 100 000 inhabitants, Qm is given by:
Qm = · = 2146 m3 h–1
while the average daily flow rate Qd (dry-weather flow) is:
Qd = Qs + Qf (12.81)
The required permeate flow rate of a membrane module has to equal themaximum volume rate Qm; and the required membrane surface area AM canbe determined from permeate flux of common membrane modules. At 8 °C,a flux of Jp8 = 25 L m–2 h–1 is given. For higher temperatures (here 10 °C) theflux is about 15% higher than at 8 °C (MUNLV 2003), resulting in:
Jp10 = 1.15· 25 L m–2 h–1 = 28.75 L m–2 h–1
m3 d
d h
L inh. d
inh. d h
3.5 ·130 ·100 000 ·10–3 +6000
24
105 N
m2
105 J
m3
J
L
g J mol K
L g mol K
15·8.31·288.2
181
325Problem
SOFTbank E-Book Center Tehran, Phone: 66403879,66493070 For Educational Use.

According to Eq. (12.5), the required membrane surface area AM follows:
Am = = · = 74638 m2
For maintenance cleaning twice a year, the complete membrane area is tak-en out of operation. Each cleaning procedure lasts about 1 day; the effectivemembrane area is in operation, therefore, only 363 days year–1 or about 99%of the time. To realize the required flux, the total membrane surface area At
must be 101% of AM.
At = AM + 0.01 AM = 75.4· 103 m2
PROBLEM 12.3
How different are the volumes of a MBR and an activated sludge tank, for thesame treatment task with nitrification?Conditions with full nitrification require sludge ages of more than 15 days(ATV-DVWK 2000). The common method for a single-step activated sludgeprocess is based on the sludge loading rate BX (Günder 1999):
BX = kg BOD5 (kg MLSS d)–1 (12.82)
where BX is the sludge loading rate, Qd is the dry-weather flow rate accordingto Eq. (12.81) = 19000 m3 d–1, X is the concentration of bacteria and S is theconcentration of substrate (we choose 400 mg L–1 BOD5). For the MBR wechoose BX = 0.03 kg BOD5 (kg MLSS ·d)–1 and for a conventional plant ahigher loading rate of 0.06 kg BOD5 (kg MLSS·d)–1.
Solution
Under the assumptions of no oxygen limitation and identical percentage ofliving bacteria, an approach for processes with and without membrane isgiven by:
1. With the membrane, the concentration of microorganisms is in the rangeof 8–16 g L–1 MLSS. We choose X = 12 g L–1 MLSS (Table 12.7). The vol-ume of the aerated sludge tank for MBR follows from Eq. (12.82):
V = = = 21.1·103 m3
2. In the conventional activated sludge process under the same conditions ofS and Qd, the attainable concentration of microorganisms is X = 3 g L–1
MLSS and a higher sludge loading rate of 0.06 kg BOD5 (kg MLSS d)–1 (Ta-ble 12.7) is possible. The volume of the single-step activated sludge tank is:
V = = = 42.2·103 m3m3 kg m3 kg d
kg m3 d kg
0.4 ·19000
3 · 0.06
S Qd
X BX
m3 kg m3 kg d
kg m3 d kg
0.4 ·19000
12 · 0.03
S Qd
X BX
S Qd
V X
m3 m2 h
L h
2146
28.75
Qm
Jp10
326 12 Membrane Technology in Biological Wastewater Treatment
SOFTbank E-Book Center Tehran, Phone: 66403879,66493070 For Educational Use.

References
327References
Achtabowski, A., Neuhaus, O. 2005, DasPAA-Membranbelebungsverfahren –Konzeption und erste Betriebserfahrun-gen mit der großtechnischen Anlage, 10th Aachen Membrane Colloquium.
Adam, C. 2004, Weitgehende Phosphor- undStickstoffelimination in einer Membran-belebung mit nachgeschalteter Denitrifika-tionsstufe, VDI-Forschungsberichte, Reihe15, 250.
Altmann H.-J., Dittrich J., Gnirß R., Peter-Fröhlich A., Sarfert F. 1995, Mikrofiltra-tion von kommunalem Abwasser zurKeim- und P-Entfernung, KorrespondenzAbwasser, 42, 758–769.
ATV-DVWK 1992, Arbeitsblatt A 198(Abwassertechnische Vereinigung –Deutsche Vereinigung für Wasser-wirtschaft, Abwasser und Abfall e.V.),Vereinheitlichung und Herleitung vonBemessungswerten für Abwasseranlagen,Gesellschaft zur Förderung derAbwassertechnik GFA, St. Augustin.
ATV-DVWK 2000a, Arbeitsblatt A 131(Abwassertechnische Vereinigung –Deutsche Vereinigung für Wasser-wirtschaft, Abwasser und Abfall e.V.),Bemessung von einstufigen Belebungs-anlagen, Abwassertechnische Vereini-gung, Hennef.
ATV-DVWK 2000b, (AbwassertechnischeVereinigung – Deutsche Vereinigung fürWasserwirtschaft, Abwasser und Abfalle.V.), Membranbelebungsverfahren,Arbeitsbericht des ATV-DVWK Fach-ausschuss KA-7, KA-Wasserwirtschaft,Abwasser, Abfall, 47, 1547–1553.
ATV-DVWK 2002a, (AbwassertechnischeVereinigung – Deutsche Vereinigung fürWasserwirtschaft, Abwasser und Abfalle.V.), Aufbereitung von Industrieabwasserund Prozesswasser mit Membranverfah-ren und Membranbelebungsverfahren,Arbeitsbericht der ATV-DVWK-ArbeitsgruppeIG 5.5, Membrantechnik, Teil 1: Membran-verfahren, KA-Wasserwirtschaft, Abwasser,Abfall, 49, 1423–1431.
ATV-DVWK 2002b, (AbwassertechnischeVereinigung- deutsche Vereinigung fürWasserwirtschaft, Abwasser und Abfalle.V.), Aufbereitung von Industrieabwasserund Prozesswasser mit Membranverfah-
ren und Membranbelebungsverfahren,Arbeitsbericht der ATV-DVWK-ArbeitsgruppeIG 5.5, Membrantechnik, Teil 2: AerobeMembranbelebungsverfahren, KA-Wasser-wirtschaft, Abwasser, Abfall, 49, 1563–1571.
AV Aggerwasser 2005, AWK Membran-technik, chemische Reinigung, Firmen-mitteilung, AV Aggerwasser GmbH.
Benedek, A., Côté, P. 2003, Long termexperience with hollow fibre membranebioreactors, International DesalinationAssociation BAH03-180, 1–5.
Berghof 2005, Berghof Filtrations- undAnlagentechnik, Reinigungs- und Kon-servierungsanleitung für Berghof Rohr-module mit Stützrohr und austauschbarenMembranen zur cross-flow Filtration,Firmenmitteilung.
Bischof, F.; Meuler, S.; Hackner, T.; Reber,R. 2005, Einsatz und Erfahrung mitMembranbiologien im ländlichen Raum-Praxiserfahrungen mit Kleinkläranlagen,KA-Abwasser, Abfall, 52, 164–169.
Brepols, C.; Schäfer, H.; Engelhardt, N. 2005,Hinweise zur verfahrenstechnischenIntegration getauchter Membranfilter inkommunalen Membranbelebungs-anlagen, KA-Abwasser, Abfall, 52, 45–50.
Brinkmeyer, J.; Rosenwinkel, K.-H.; Flasche,K.; Koppmann, M.; Austermann-Haun, U.2005, Einsatz und Erfahrungen mitMembranbiologien im ländlichen Raum-Bedeutung und Chancen für die Verwen-dung in Kleinkläranlagen, KA-Abwasser,Abfall, 52, 158–163.
Cabbasud C.; Laborie S.; Durand-Bourlier L.;Laine J.M. 2001, Air sparging in ultrafiltra-tion hollow fibres: relationship betweenflux enhancement, cake characteristics andhydrodynamic parameters, Journal ofMembrane Science, 181, 57–69.
Carman, P.C. 1956, Flow of Gases ThroughPorous Media, Butterworths ScientificPublications, London.
Chang I. S.;Fane A.G. 2000, Filtration ofbiomass with axial inter-fibre upward slugflow: performance and mechanism,Journal of Membrane Science, 180, 57–68.
Chang, I. S.; Clech, P.; Jefferson, B.; Judd, S.2002, Membrane fouling in membrane bio-reactors for wastewater treatment, Journal ofEnvironmental Engineering, 2002, 1018–1029.
SOFTbank E-Book Center Tehran, Phone: 66403879,66493070 For Educational Use.

328 12 Membrane Technology in Biological Wastewater Treatment
Chen, V., Fane, A.G., Madaeni, S., Wenten,I.G. 1997, Particle deposition duringmembrane filtration of colloids: transitionbetween concentration polarization andcake formation, Journal of MembraneScience, 125, 109–122.
Choi, I. S. 2005, Aerobic degradation ofsurfactant and nitrification in a membranebioreactor (MBR) with CO2 and O2 gasanalysis, VDI-Forschungsberichte, Reihe 3,838.
Cornel, P.; Wagner, M.; Krause, S. 2001,Sauerstoffeintrag in Membranbelebungs-anlagen, 4. Aachener Tagung Siedlungs-wasserwirtschaft und Verfahrenstechnik,Membrantechnik in der Wasseraufbereitungund Abwasserbehandlung, Aachen, A14.
Côté, P; Liu, M. 2003, Immersed membranesoptions for water reuse, InternationalDesalination Association BAH03-066, 1–14.
Darcy, H. 1856, Distribution d’Eau, le Foun-taines Publiques de la Ville de Dijon, Paris.
De Wilde W.; Thoeye, C.; De Gueldre, G.2005, Operational experiences andoptimisations two years after star-up of the first full-scale MBR for domesticwastewater treatment in the Benelux, 6.Aachener Tagung Siedlungswasserwirtschaftund Verfahrenstechnik, Membrantechnik inder Wasseraufbereitung und Abwasser-behandlung, Aachen, A5.
Dietze, A. 2004, Oberflächenwasseraufberei-tung durch Membranfiltration: Einsatz derFällung/Flockung mit anschließenderUltrafiltration zur Phosphateliminierung,VDI-Forschungsberichte, Reihe 3, 813.
Drews, A.; Kraume, M. 2005, Processimprovement by application of membranebioreactors, Chemical Engineering Researchand Design, 83, 1–9.
Drews, A., Vocks, M.; Iversen, V., Lesjean,B., Kraume, M. 2005, Fouling in Mem-branbelebungsreaktoren: Erfahrungenbeim Betrieb mit diskontinuierlichemSchlammabzug, Chemie Ingenieur Technik,77, 593–599.
DWA 2005, Membranbelebungsverfahren,2. Arbeitsbericht des DWA FachausschussKA-7, KA-Abwasser, Abfall, 52, 322, draft.
EEC 1991, EEC Council Directive 76/160/EWG des Rates über die Qualität von Bade-gewässern vom 8. Dezember 1975, ABl EGvom 5.2.1976 Nr. L31 S. 1, ABl EG vom
31.12.1991 Nr. L377 S. 48, in der Fassungvom 23. Dezember 1991.
Engelhardt, N. 2003, Membranbelebungs-verfahren – eine beherrschbare underfolgreiche Technik – Erfahrungen nachvierjährigem Betrieb, 5. Aachener TagungSiedlungswasserwirtschaft und Verfahrens-technik, Membrantechnik in der Wasser-aufbereitung und Abwasserbehandlung,Aachen, A1.
EU 2000, EU Water Framework Directive2000/60/EG des Europäischen Parlamentsund des Rates vom 23. Oktober 2000 zurSchaffung eines Ordnungsrahmens für Maßnahmen der Gemeinschaft imBereich der Wasserpolitik, L327 S. 1, ABl EG vom 22.12. 2000.
Filali-Meknassi, Y.; Tyagi, R. D.; Surampalli,R. Y.; Barata, C.; Riva, M. C. 2004, Endo-crine-disrupting compounds in waste-water, sludge-treatment process, andreceiving waters, Overview, PracticePeriodical of Hazardous, Toxic, andRadioactive Waste Management, ASCE, 8,39–56.
Fleming, H.-C. 1995, Biofouling bei Membran-prozessen, Springer-Verlag, Berlin, Heidel-berg.
Fu, L.F.; Dempsey, B.A. 1998, Modelling theeffect of particle size and charge on thestructure of the filter cake in ultrafiltra-tion, Journal of Membrane Science, 149,221–240.
Gallenkemper, M.; Salehi, F.; Melin, T. 2003,Rückhalt endokrin wirksamer Substanzenmittels NF – Betriebsparameter undModellierung, 5. Aachener TagungSiedlungswasserwirtschaft und Verfahrens-technik, Membrantechnik in der Wasser-aufbereitung und Abwasserbehandlung,Aachen, P8.
Geissler, S.; Melin, T.; Zhou, H.; Zytner, R.2003, Vorhersagemöglichkeiten imHinblick auf die Filtrationsleistung vonMembranbelebungsanlagen, 5. AachenerTagung Siedlungswasserwirtschaft undVerfahrenstechnik, Membrantechnik in derWasseraufbereitung und Abwasserbehand-lung, Aachen, A13.
Gnirß, R. 2005, Semi-zentrale Erschließungeines Berliner Siedlungsgebietes mit einerMembranbelebungsanlage – Das ProjektENREM, Vortrag auf der 5. Wasserwerk-
SOFTbank E-Book Center Tehran, Phone: 66403879,66493070 For Educational Use.

329References
statt, Kolloquium des KompetenzzentrumsWasser, Berlin.
Gnirß, R.; Lesjean, B.; Buisson, H. 2003,Biologische Phosphorentfernung mit einernachgeschalteten Denitrifikation im Mem-branbelebungsverfahren, 5. AachenerTagung Siedlungswasserwirtschaft undVerfahrenstechnik, Membrantechnik in derWasseraufbereitung und Abwasserbehand-lung, Aachen, A17.
Goers, B. 2000, Spülwassermanagement undTensidrückgewinnung in Mehrprodukt-anlagen mit Membranverfahren, VDI-Forschungsberichte, Reihe 3, 671.
Günder, B. 1999, Das Membranbelebungs-verfahren in der kommunalen Abwasser-reinigung, Stuttgarter Berichte zur Sied-lungswasserwirtschaft, 45, Oldenbourg-Verlag, Munich.
Kubin, K. 2004, Einfluss unterschiedlicherVerfahrenskonzepte auf Substratabbauund Nährstoffverwertung in Membran-belebungsanlagen zur kommunalenAbwasserreinigung (PhD thesis),TU Berlin.
Kunst, S. 2002, Endokrin wirksame Substan-zen in Kläranlagen – Vorkommen, Ver-bleib und Wirkung, KA-Wasserwirtschaft,Abwasser, Abfall, 49, 1572–1577.
Lee, W.; Kang, S.; Shin, H. 2003, Sludgecharacteristics and their contribution tomicrofiltration in submerged membranebioreactors, Journal of Membrane Science,216, 217–227.
Linton, W.H.; Sherwood, T.K. 1950, Masstransfer from solid phase to water instreamline and turbulent flow, ChemicalEngineering Progress, 46, 258–264.
Maas, D. B2005, Life and Life+ – EU-Förde-rung auch für Projekte im Abwasser-bereich, KA-Abwasser, Abfall, 52, 28–30.
Melin, T.; Rautenbach, R. 2004, Membran-verfahren, Grundlagen der Modul- undAnlagenauslegung, 2. Auflage, Springer-Verlag, Berlin, Heidelberg.
Melin, T.; Wintgens, T.; Rosen, J. 2001,Ansätze zur Modellierung und Simula-tion von Membranbelebungsanlagen,4. Aachener Tagung Siedlungswasser-wirtschaft und Verfahrenstechnik,Membrantechnik in der Wasseraufbereitungund Abwasserbehandlung, Aachen, P16.
Mulder, M. 2000, Basic Principles ofMembrane Technology, 2nd ed., Kluwer
Academic Publishers, Dordrecht, ISBN 0-7923-4247-X (HB).
MUNLV 2003, Ministerium für Umwelt undNaturschutz, Landwirtschaft und Verbrau-cherschutz des Landes Nordrhein-Westfalen, Abwasserreinigung mitMembrantechnik, Membraneinsatz imkommunalen und industriellen Bereich,Hrsg. MUNLV, Düsseldorf.
Oschmann, N.; Nghiem, L.D.; Schäfer, A.I.2005, Fouling mechanism of submergedultrafiltration membranes in greywaterrecycling, Desalination 179, 215–233.
Rautenbach, R. 1997, Membranverfahren,Grundlagen der Modul- und Anlagen-auslegung, Springer-Verlag, Berlin,Heidelberg.
Rautenbach, R.; Albrecht, R. 1981, Membran-trennverfahren, Ultrafiltration und Umkehr-osmose, Salle+Sauerländer.
Rautenbach, R.; Albrecht, R. 1989, MembraneProcesses, John Wiley & Sons, Chichester,New York, Brisbane, Toronto, Singapore.
Roest van der, H.F.; Bentem van, A.G.N.;Schyns, Ir.P.; Petri, C. 2005, Uijterlinde,Varsseveld: Dutch full scale demonstrationof MBR-progress, 6. Aachener Tagung Sied-lungswasserwirtschaft und Verfahrenstechnik,Membrantechnik in der Wasseraufbereitungund Abwasserbehandlung, Aachen, A4.
Rondi, S.; Montagnoli, T. 2005, Two years ofoperation of a 42,000 m3/d MBR process:the case of ASM Brescia (Italy), 6. AachenerTagung Siedlungswasserwirtschaft undVerfahrenstechnik, Membrantechnik in derWasseraufbereitung und Abwasserbehand-lung, Aachen, A2.
Rosenberger, S. 2003, Charakterisierung von belebtem Schlamm in Membranbio-reaktoren zur Abwasserreinigung, VDI-Forschungsberichte, Reihe 3, 769.
Schäfer, A.; Wintgens, T.; Gallenkemper, M.;Melin, T. 2003, Rückhalt hormonell wirk-samer Spurenschadstoffe durch Mem-branverfahren, 5. Aachener Tagung Sied-lungswasserwirtschaft und Verfahrenstechnik,Membrantechnik in der Wasseraufbereitungund Abwasserbehandlung, Aachen, A16.
Shon, H.K.; Vigneswaran, S.; Kim, I.S.; Cho, J.; Ngo, H.H. 2004, Effect of pre-treatment on the fouling of membranes:application in biologically treated sewageeffluent, Journal of Membrane Science, 234,111–120.
SOFTbank E-Book Center Tehran, Phone: 66403879,66493070 For Educational Use.

330 12 Membrane Technology in Biological Wastewater Treatment
Stein, S. 2003, Betriebserfahrungen mitunterschiedlichen MembrantechnikenZeeWeed und VRM, 5. Aachener TagungSiedlungswasserwirtschaft und Verfahrens-technik, Membrantechnik in der Wasser-aufbereitung und Abwasserbehandlung,Aachen, A6.
Stephenson, T.; Judd, S.; Jefferson, B.;Brindle K. 2000, Membrane Bioreactors forWastewater Treatment, IWA Publishing,London.
Taha T.; Cui Z.F. 2002, CFG modelling ofgas sparged ultrafiltration in tubularmembranes, Journal of Membrane Science,210, 13–27.
VDMA 2005, VDMA-Einheitsblatt,Membrananlagen in der Wasser- undAbwassertechnik Hinweise für die Auswahl,Projektierung und Ausrüstung, VDMA24653, Beuth Verlag, Berlin.
Voßenkaul, K.; Schäfer, S.; Kullmann, C.2003, Das Puron-Membran-System – neue Konzepte für die membrangestützte
Wasseraufbereitung und Abwasser-behandlung, 5. Aachener Tagung Sied-lungswasserwirtschaft und Verfahrenstechnik,Membrantechnik in der Wasseraufbereitungund Abwasserbehandlung, Aachen, A7.
Wehrle Umwelt 2005, Wehrle UmweltGmbH, Firmenmitteilung.
Wienands, H., Streif, G. 2005, KA-Wasser-wirtschaft, Abwasser, Abfall, 52, 58–62.
Wintgens, T.; Rosen, J.; Melin, T.; Brepols,C.; Drensla, K.; Engelhardt, N. 2003,Modelling of a membrane bioreactorsystem for municipal wastewater treat-ment, Journal of Membrane Science, 216,55–65.
Wozniak, T. 2003, Ergebnisse der Unter-suchungen zum Membranbelebungs-verfahren auf der KA Büchel, 5. AachenerTagung Siedlungswasserwirtschaft undVerfahrenstechnik, Membrantechnik in derWasseraufbereitung und Abwasserbehand-lung, Aachen, A4.
SOFTbank E-Book Center Tehran, Phone: 66403879,66493070 For Educational Use.