Embed Size (px)
Citation preview

MEMBER REPORT
ESCAP/WMO Typhoon Committee
8th
IWS/2nd
TRCG Forum
2 - 6 December 2013
Macao, China
(SOCIALIST REPUBLIC OF VIET NAM)
i
CONTENTS
I. Overview of tropical cyclones which have affected/impacted Member’s area
since the last Typhoon Committee Session ............................................................. 1
1. Meteorological assessment.................................................................................... 1
1.1. Tropical Storm Bebinca (1305) ........................................................................ 1
1.2. Super Tropical Storm Rumbia (1306) .............................................................. 1
1.3. Typhoon Jebi (1309)......................................................................................... 1
1.4. Typhoon Mangkhut (1310) .............................................................................. 2
1.5. Tropical Storm Noname (1318) ....................................................................... 2
1.6. Typhoon Wutip (1321) ..................................................................................... 2
1.7. Typhoon Nari (1325) ........................................................................................ 3
1.8. Typhoon HaiYan (1330) .................................................................................. 3
2. Hydrological Assessment ...................................................................................... 4
2.1. Flood situations by Tropical cyclone in the North .......................................... 4
2.2. Flood situations by Tropical cyclone in the Central and Highland area .......... 7
3. Socio-Economic Assessment ............................................................................... 12
3.1. Damage Situation in 2013 .............................................................................. 12
3.2. Damage Situation in 2012 .............................................................................. 12
3.3. Damage Situation in 2011 .............................................................................. 13
3.4. Remedial work from the beginning of the year to mid-November 2013 ....... 13
II. Summary of progress in Key Result Areas ...................................................... 14
III. Update of Members’ Working Groups representatives ............................... 17
1. Working Group on Meteorology ....................................................................... 17
2. Working Group on Hydrology ........................................................................... 17
3. Working Group on Disaster Prevention and Preparedness ........................... 17
4. Training and Research Coordinating Group ................................................... 17
1
I. Overview of tropical cyclones which have affected/impacted Member’s
area since the last Typhoon Committee Session
1. Meteorological assessment
In 2013, 17 tropical cyclones (TCs) of tropical depression (TD) intensity and
tropical storm (TS) intensity had activated on Biendong Sea as the end of October.
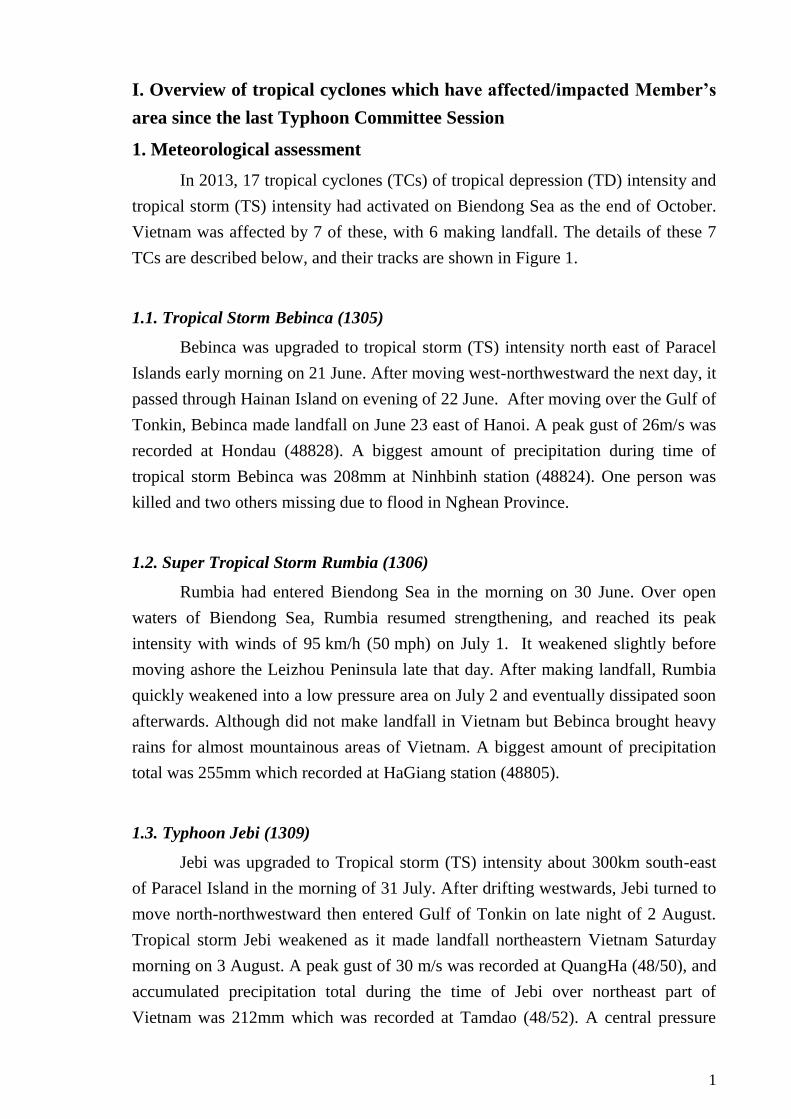
Vietnam was affected by 7 of these, with 6 making landfall. The details of these 7
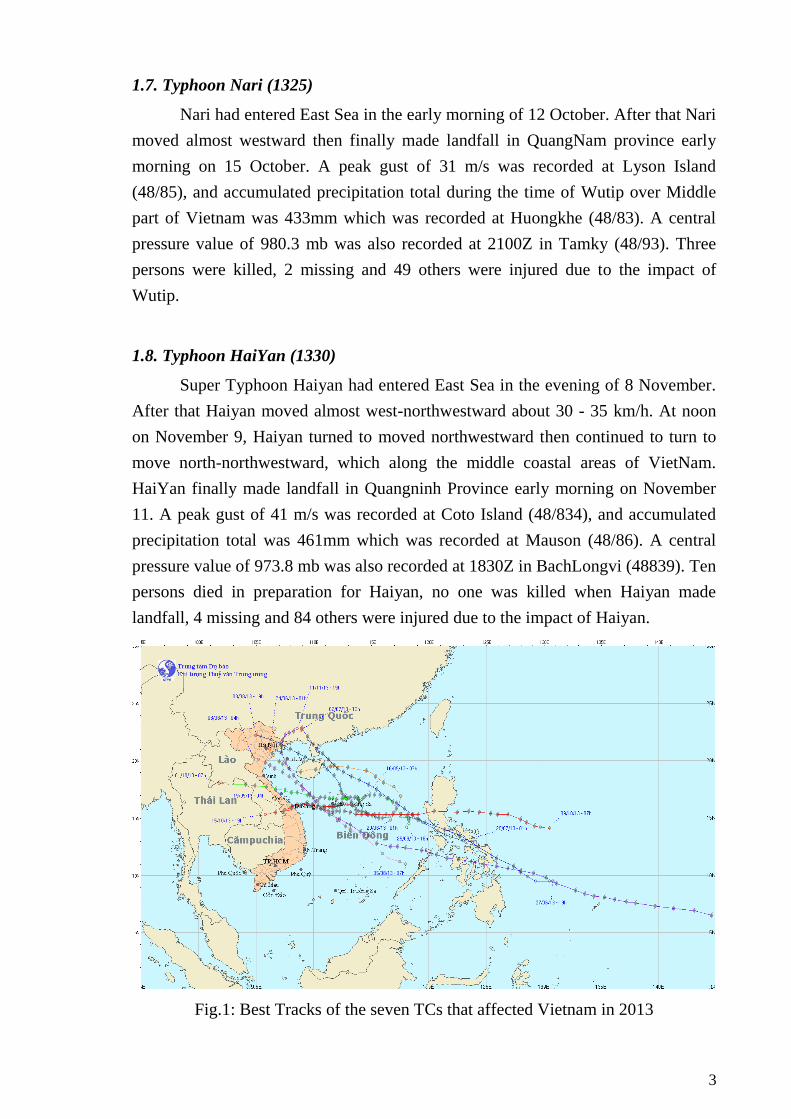
TCs are described below, and their tracks are shown in Figure 1.
1.1. Tropical Storm Bebinca (1305)
Bebinca was upgraded to tropical storm (TS) intensity north east of Paracel
Islands early morning on 21 June. After moving west-northwestward the next day, it
passed through Hainan Island on evening of 22 June. After moving over the Gulf of
Tonkin, Bebinca made landfall on June 23 east of Hanoi. A peak gust of 26m/s was
recorded at Hondau (48828). A biggest amount of precipitation during time of
tropical storm Bebinca was 208mm at Ninhbinh station (48824). One person was
killed and two others missing due to flood in Nghean Province.
1.2. Super Tropical Storm Rumbia (1306)
Rumbia had entered Biendong Sea in the morning on 30 June. Over open
waters of Biendong Sea, Rumbia resumed strengthening, and reached its peak
intensity with winds of 95 km/h (50 mph) on July 1. It weakened slightly before
moving ashore the Leizhou Peninsula late that day. After making landfall, Rumbia
quickly weakened into a low pressure area on July 2 and eventually dissipated soon
afterwards. Although did not make landfall in Vietnam but Bebinca brought heavy
rains for almost mountainous areas of Vietnam. A biggest amount of precipitation
total was 255mm which recorded at HaGiang station (48805).
1.3. Typhoon Jebi (1309)
Jebi was upgraded to Tropical storm (TS) intensity about 300km south-east
of Paracel Island in the morning of 31 July. After drifting westwards, Jebi turned to
move north-northwestward then entered Gulf of Tonkin on late night of 2 August.
Tropical storm Jebi weakened as it made landfall northeastern Vietnam Saturday
morning on 3 August. A peak gust of 30 m/s was recorded at QuangHa (48/50), and
accumulated precipitation total during the time of Jebi over northeast part of
Vietnam was 212mm which was recorded at Tamdao (48/52). A central pressure
2
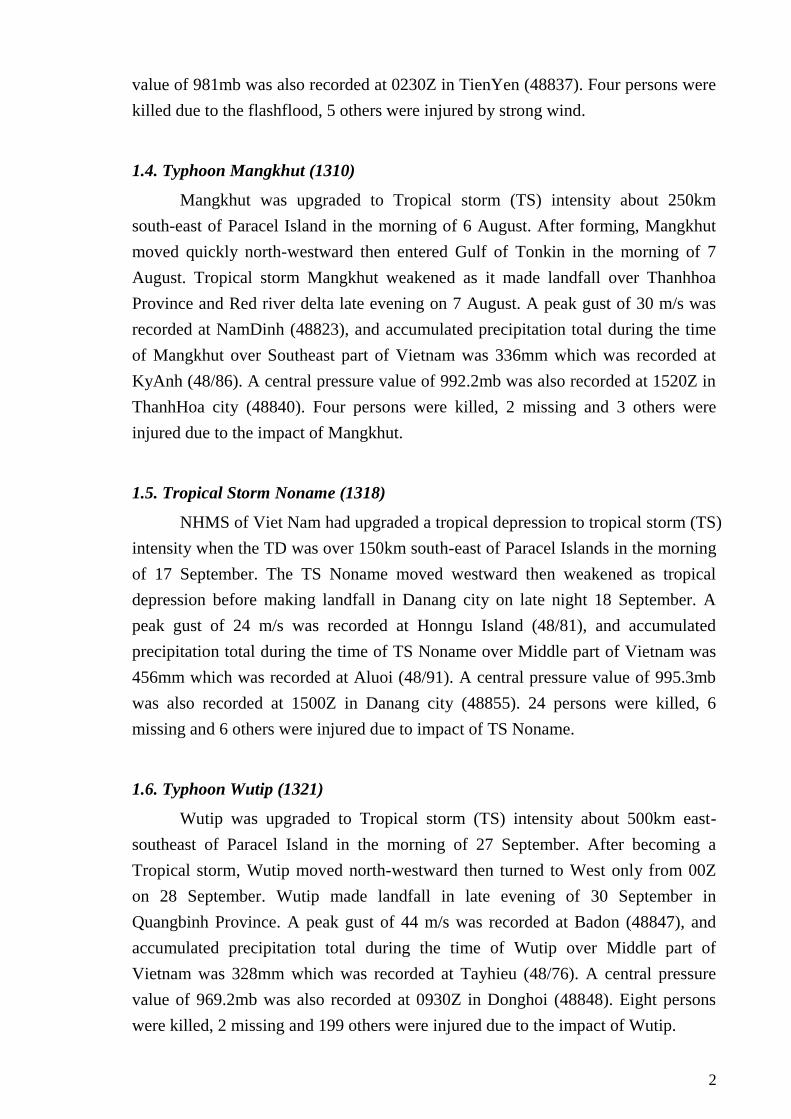
value of 981mb was also recorded at 0230Z in TienYen (48837). Four persons were
killed due to the flashflood, 5 others were injured by strong wind.
1.4. Typhoon Mangkhut (1310)
Mangkhut was upgraded to Tropical storm (TS) intensity about 250km
south-east of Paracel Island in the morning of 6 August. After forming, Mangkhut
moved quickly north-westward then entered Gulf of Tonkin in the morning of 7
August. Tropical storm Mangkhut weakened as it made landfall over Thanhhoa
Province and Red river delta late evening on 7 August. A peak gust of 30 m/s was
recorded at NamDinh (48823), and accumulated precipitation total during the time
of Mangkhut over Southeast part of Vietnam was 336mm which was recorded at
KyAnh (48/86). A central pressure value of 992.2mb was also recorded at 1520Z in
ThanhHoa city (48840). Four persons were killed, 2 missing and 3 others were
injured due to the impact of Mangkhut.
1.5. Tropical Storm Noname (1318)
NHMS of Viet Nam had upgraded a tropical depression to tropical storm (TS)
intensity when the TD was over 150km south-east of Paracel Islands in the morning
of 17 September. The TS Noname moved westward then weakened as tropical
depression before making landfall in Danang city on late night 18 September. A
peak gust of 24 m/s was recorded at Honngu Island (48/81), and accumulated
precipitation total during the time of TS Noname over Middle part of Vietnam was
456mm which was recorded at Aluoi (48/91). A central pressure value of 995.3mb
was also recorded at 1500Z in Danang city (48855). 24 persons were killed, 6
missing and 6 others were injured due to impact of TS Noname.
1.6. Typhoon Wutip (1321)
Wutip was upgraded to Tropical storm (TS) intensity about 500km east-
southeast of Paracel Island in the morning of 27 September. After becoming a
Tropical storm, Wutip moved north-westward then turned to West only from 00Z
on 28 September. Wutip made landfall in late evening of 30 September in
Quangbinh Province. A peak gust of 44 m/s was recorded at Badon (48847), and
accumulated precipitation total during the time of Wutip over Middle part of
Vietnam was 328mm which was recorded at Tayhieu (48/76). A central pressure
value of 969.2mb was also recorded at 0930Z in Donghoi (48848). Eight persons
were killed, 2 missing and 199 others were injured due to the impact of Wutip.
3
1.7. Typhoon Nari (1325)
Nari had entered East Sea in the early morning of 12 October. After that Nari
moved almost westward then finally made landfall in QuangNam province early
morning on 15 October. A peak gust of 31 m/s was recorded at Lyson Island
(48/85), and accumulated precipitation total during the time of Wutip over Middle
part of Vietnam was 433mm which was recorded at Huongkhe (48/83). A central
pressure value of 980.3 mb was also recorded at 2100Z in Tamky (48/93). Three
persons were killed, 2 missing and 49 others were injured due to the impact of
Wutip.
1.8. Typhoon HaiYan (1330)
Super Typhoon Haiyan had entered East Sea in the evening of 8 November.
After that Haiyan moved almost west-northwestward about 30 - 35 km/h. At noon
on November 9, Haiyan turned to moved northwestward then continued to turn to
move north-northwestward, which along the middle coastal areas of VietNam.
HaiYan finally made landfall in Quangninh Province early morning on November
11. A peak gust of 41 m/s was recorded at Coto Island (48/834), and accumulated
precipitation total was 461mm which was recorded at Mauson (48/86). A central
pressure value of 973.8 mb was also recorded at 1830Z in BachLongvi (48839). Ten
persons died in preparation for Haiyan, no one was killed when Haiyan made
landfall, 4 missing and 84 others were injured due to the impact of Haiyan.
Fig.1: Best Tracks of the seven TCs that affected Vietnam in 2013
4
2. Hydrological Assessment
The report present flood situation during the period of the beginning of
January and the mid of November with the different flood situations along Viet
Nam form the North to the South. Untill the report making time, flood season in the
North almost finished and has been switching to dry season while flood stituations
is stillongoing in the Central , Central highland area and the South of Viet Nam.
Following statistic counted until 15 November 2013, the number of Typhoon (TY)
and Tropical Storm (TS) appearances in the South China Sea were 14 in which 8 of
them directly made landfall in Viet Nam and mostly influenced to the Northern part,
the Central and Highland areas as major result of intensive rainfall as well as high
or medium flood events.
2.1. Flood situations by Tropical cyclone in the North
The 2013 flood season in Northern part started a bit later than previous flood
years. The first flood event ( Tieu Man flood or early flood) in Red-Thai Binh river
systems occurred in the end of May, from 24 to 30 (2-8 days later than the long-
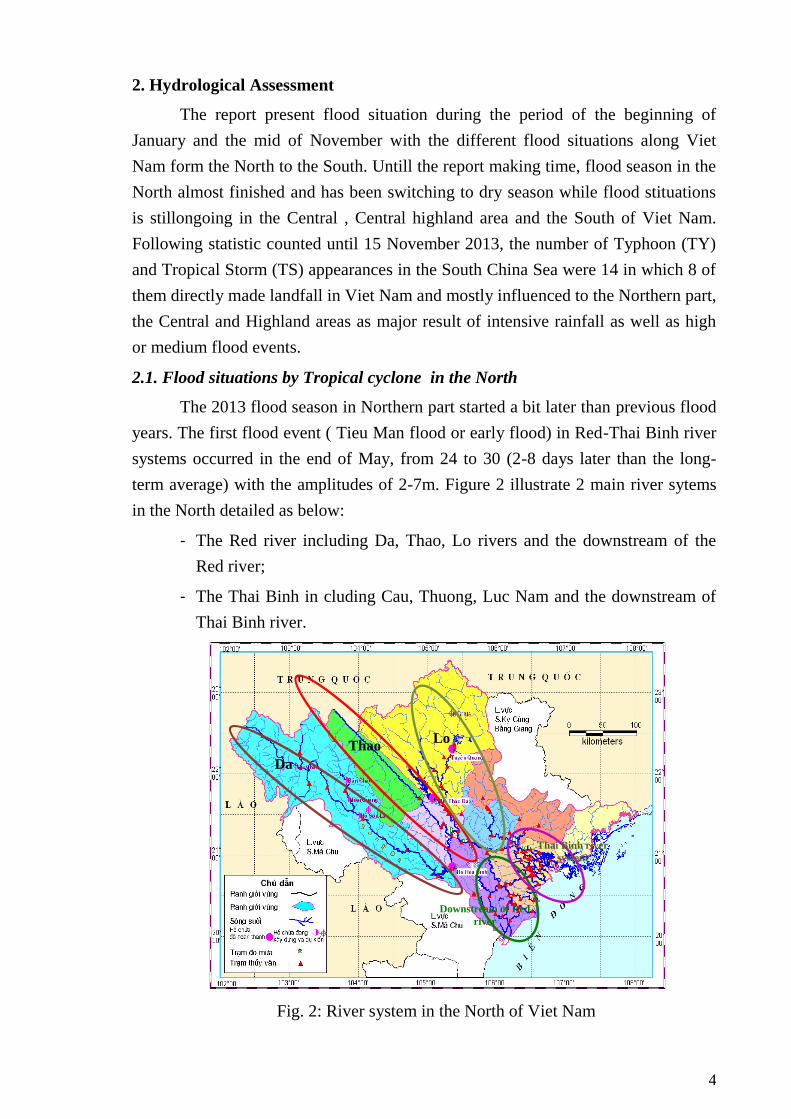
term average) with the amplitudes of 2-7m. Figure 2 illustrate 2 main river sytems
in the North detailed as below:
- The Red river including Da, Thao, Lo rivers and the downstream of the
Red river;
- The Thai Binh in cluding Cau, Thuong, Luc Nam and the downstream of
Thai Binh river.
Fig. 2: River system in the North of Viet Nam
Da
Thao Lo
Downstream of Red
river
Thai Binh river
system
5
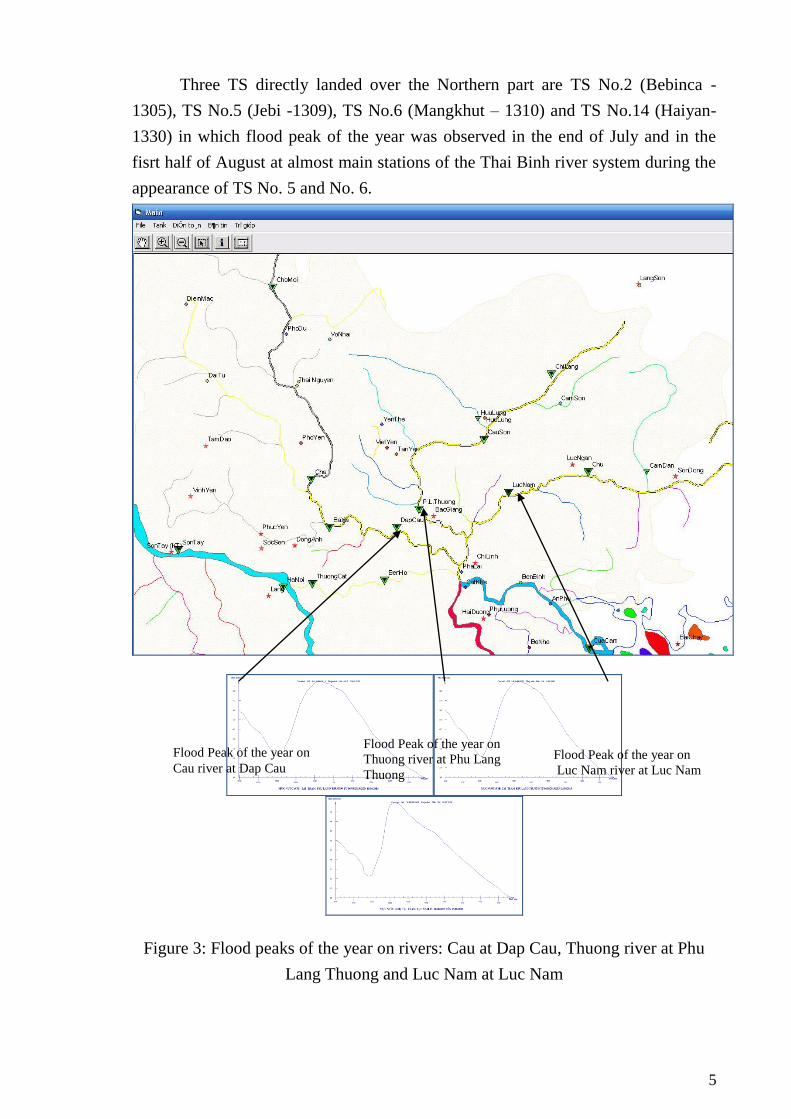
Three TS directly landed over the Northern part are TS No.2 (Bebinca -
1305), TS No.5 (Jebi -1309), TS No.6 (Mangkhut – 1310) and TS No.14 (Haiyan-
1330) in which flood peak of the year was observed in the end of July and in the
fisrt half of August at almost main stations of the Thai Binh river system during the
appearance of TS No. 5 and No. 6.
Figure 3: Flood peaks of the year on rivers: Cau at Dap Cau, Thuong river at Phu
Lang Thuong and Luc Nam at Luc Nam
Flood Peak of the year on
Thuong river at Phu Lang
Thuong
Flood Peak of the year on
Luc Nam river at Luc Nam
Flood Peak of the year on
Cau river at Dap Cau

6
Table 1 and 2 summerized information of flood charateristics in the Red and
Thai Binh river system during the end of July and the first half of August when the
appearance time of 2 those TSs. Figure 2 shows the flood peaks of the year on the
main rivers Cau, Thuong and Luc Nam belong Thai Binh river system as a result of
TS No.6 influence.
Table 1. The charateristics of flood events for main stations in the Red-Thai Binh
rivers system when TS No.5 appearance.
No Station River
Peak of
flood
event(m)
Appearance
time of
flood peak
Flood
Amplitude
(m)
Alarm
Level
(m)
1 Phu Lang
Thuong Thuong 5.83
1a.m 05-
Aug-13 258
> AL2:
0.53m
2 Đap Cau Cau 5.77 23p.m 05-
Aug-13 2.24
> AL2:
0.47m
3 Luc Nam Luc Nam 5.62 3a.m 04-
Aug-13 2.73
> AL.2:
0.32m
4 Pha Lai Thai
Binh 4.29
1a.m 05-
Aug-13 1.54
> AL.1:
0.29m
5 Yen Bai Thao 30.68 22p.m
04-Aug-13 2.22
<AL.2:
0.32m
Table 2. The charateristics of flood events for main stations in the Red-Thai Binh
rivers system when TS No.6 appearance.
No Station River
Peak of
flood
event(m)
Appearance
time of
flood peak
Flood
Amplitude
(m)
Alarm
Level
(m)
1 Phu Lang
Thuong Thuong 6.29
5a.m 10-
Aug-13 2.06 ~ AL.3
2 Đap Cau Cau 6.42 15p.m 10-
Aug-13 1.88
> AL.3:
0.12m
3 Luc Nam Luc Nam 5.44 7a.m 09-
Aug-13 1.88
> AL.2:
0.14m
4 Pha Lai Thai Binh 4.38 7a.m 10- 0.95 > AL.1:
7
No Station River
Peak of
flood
event(m)
Appearance
time of
flood peak
Flood
Amplitude
(m)
Alarm
Level
(m)
Aug-13 0.38m
5 Yen Bai Thao 31.03 12a.m 9-
Aug-13 1.73
> AL.2:
0.03m
6 Hung Thi Boi 12.85 9a.m 9-
Aug-13 5.41
> AL.3:
0.85m
7 Ben De Hoang
Long 3.71
17p.m 9-
Aug-13 1.71
> AL.2:
0.21m
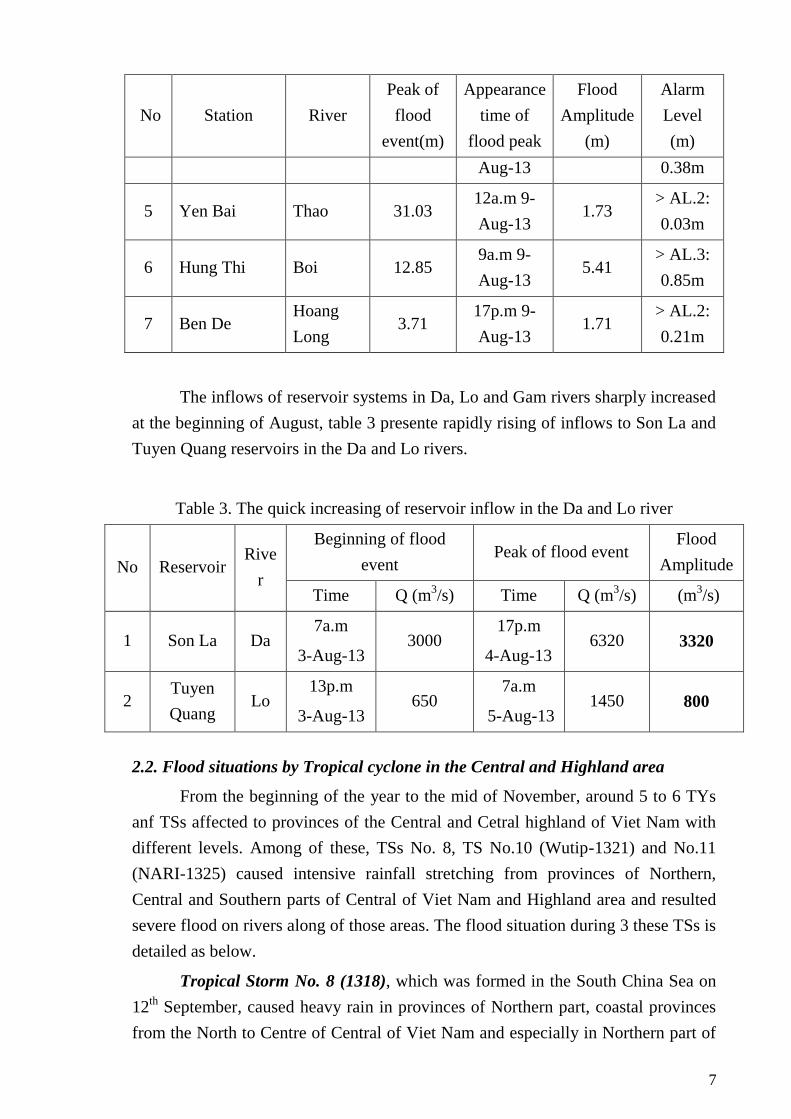
The inflows of reservoir systems in Da, Lo and Gam rivers sharply increased
at the beginning of August, table 3 presente rapidly rising of inflows to Son La and
Tuyen Quang reservoirs in the Da and Lo rivers.
Table 3. The quick increasing of reservoir inflow in the Da and Lo river
No Reservoir Rive
r
Beginning of flood
event Peak of flood event
Flood
Amplitude
Time Q (m3/s) Time Q (m
3/s) (m
3/s)
1 Son La Da 7a.m
3-Aug-13 3000
17p.m
4-Aug-13 6320 3320
2 Tuyen
Quang Lo
13p.m
3-Aug-13 650
7a.m
5-Aug-13 1450 800
2.2. Flood situations by Tropical cyclone in the Central and Highland area
From the beginning of the year to the mid of November, around 5 to 6 TYs
anf TSs affected to provinces of the Central and Cetral highland of Viet Nam with
different levels. Among of these, TSs No. 8, TS No.10 (Wutip-1321) and No.11
(NARI-1325) caused intensive rainfall stretching from provinces of Northern,
Central and Southern parts of Central of Viet Nam and Highland area and resulted
severe flood on rivers along of those areas. The flood situation during 3 these TSs is
detailed as below.
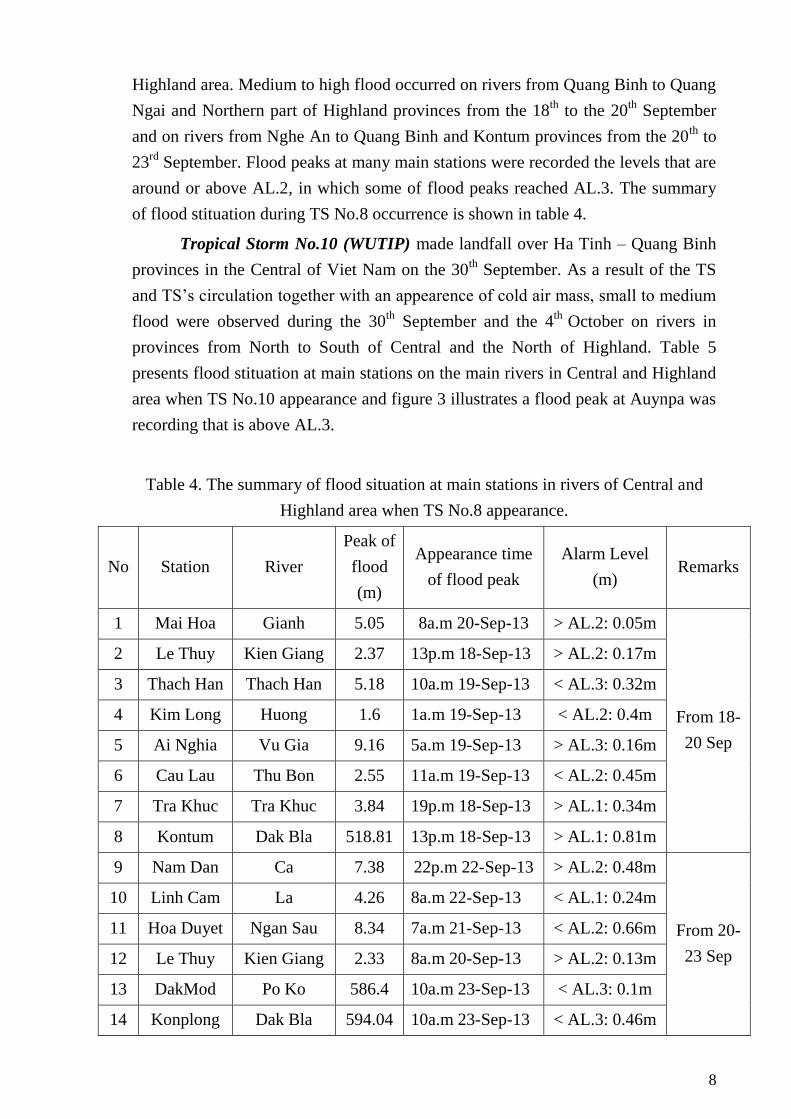
Tropical Storm No. 8 (1318), which was formed in the South China Sea on
12th
September, caused heavy rain in provinces of Northern part, coastal provinces
from the North to Centre of Central of Viet Nam and especially in Northern part of
8
Highland area. Medium to high flood occurred on rivers from Quang Binh to Quang
Ngai and Northern part of Highland provinces from the 18th
to the 20th
September
and on rivers from Nghe An to Quang Binh and Kontum provinces from the 20th
to
23rd
September. Flood peaks at many main stations were recorded the levels that are
around or above AL.2, in which some of flood peaks reached AL.3. The summary
of flood stituation during TS No.8 occurrence is shown in table 4.
Tropical Storm No.10 (WUTIP) made landfall over Ha Tinh – Quang Binh
provinces in the Central of Viet Nam on the 30th
September. As a result of the TS
and TS’s circulation together with an appearence of cold air mass, small to medium
flood were observed during the 30th
September and the 4th
October on rivers in
provinces from North to South of Central and the North of Highland. Table 5
presents flood stituation at main stations on the main rivers in Central and Highland
area when TS No.10 appearance and figure 3 illustrates a flood peak at Auynpa was
recording that is above AL.3.
Table 4. The summary of flood situation at main stations in rivers of Central and
Highland area when TS No.8 appearance.
No Station River
Peak of
flood
(m)
Appearance time
of flood peak
Alarm Level
(m) Remarks
1 Mai Hoa Gianh 5.05 8a.m 20-Sep-13 > AL.2: 0.05m
From 18-
20 Sep
2 Le Thuy Kien Giang 2.37 13p.m 18-Sep-13 > AL.2: 0.17m
3 Thach Han Thach Han 5.18 10a.m 19-Sep-13 < AL.3: 0.32m
4 Kim Long Huong 1.6 1a.m 19-Sep-13 < AL.2: 0.4m
5 Ai Nghia Vu Gia 9.16 5a.m 19-Sep-13 > AL.3: 0.16m
6 Cau Lau Thu Bon 2.55 11a.m 19-Sep-13 < AL.2: 0.45m
7 Tra Khuc Tra Khuc 3.84 19p.m 18-Sep-13 > AL.1: 0.34m
8 Kontum Dak Bla 518.81 13p.m 18-Sep-13 > AL.1: 0.81m
9 Nam Dan Ca 7.38 22p.m 22-Sep-13 > AL.2: 0.48m
From 20-
23 Sep
10 Linh Cam La 4.26 8a.m 22-Sep-13 < AL.1: 0.24m
11 Hoa Duyet Ngan Sau 8.34 7a.m 21-Sep-13 < AL.2: 0.66m
12 Le Thuy Kien Giang 2.33 8a.m 20-Sep-13 > AL.2: 0.13m
13 DakMod Po Ko 586.4 10a.m 23-Sep-13 < AL.3: 0.1m
14 Konplong Dak Bla 594.04 10a.m 23-Sep-13 < AL.3: 0.46m

9
No Station River
Peak of
flood
(m)
Appearance time
of flood peak
Alarm Level
(m) Remarks
15 Kontum 519.79 14p.m 23-Sep-13 > AL.2: 0.29m
Table 5 . The summary of flood situation at main stations in rivers of Central and
Highland area when TS No.10 appearance.
No Station River
Peak of
flood
(m)
Appearance time
of flood peak
Alarm Level
(m) Remarks
1 Mai Hoa Gianh 5.64 1a.m 01-Oct-13 > AL.2: 0.64m
TS No10
2 Le Thuy Kien Giang 1.8 1a.m 01-Oct-13 < AL.2: 0.4m
3 Nam Dan Ca 6.48 5a.m 04-Oct-13 < AL.2: 0.42m
4 Linh Cam La 3.87 7a.m 04-Oct-13 < AL.1: 0.63m
5 Tra Khuc Tra Khuc 4.3 13p.m 04-Oct-13 < AL.2: 0.7m
6 Auynpa
Ba
157.05 21p.m 03-Oct-13 > AL.3: 1.05m
7 Cung Son 33.04 13p.m 04-Oct-13 > AL.2: 1.04m
8 Phu Lam 2.94 21p.m 04-Oct-13 > AL.2: 0.25m
9 Kontum Dak Bla 518.03 9a.m 03-Oct-13 > AL.1: 0.03m
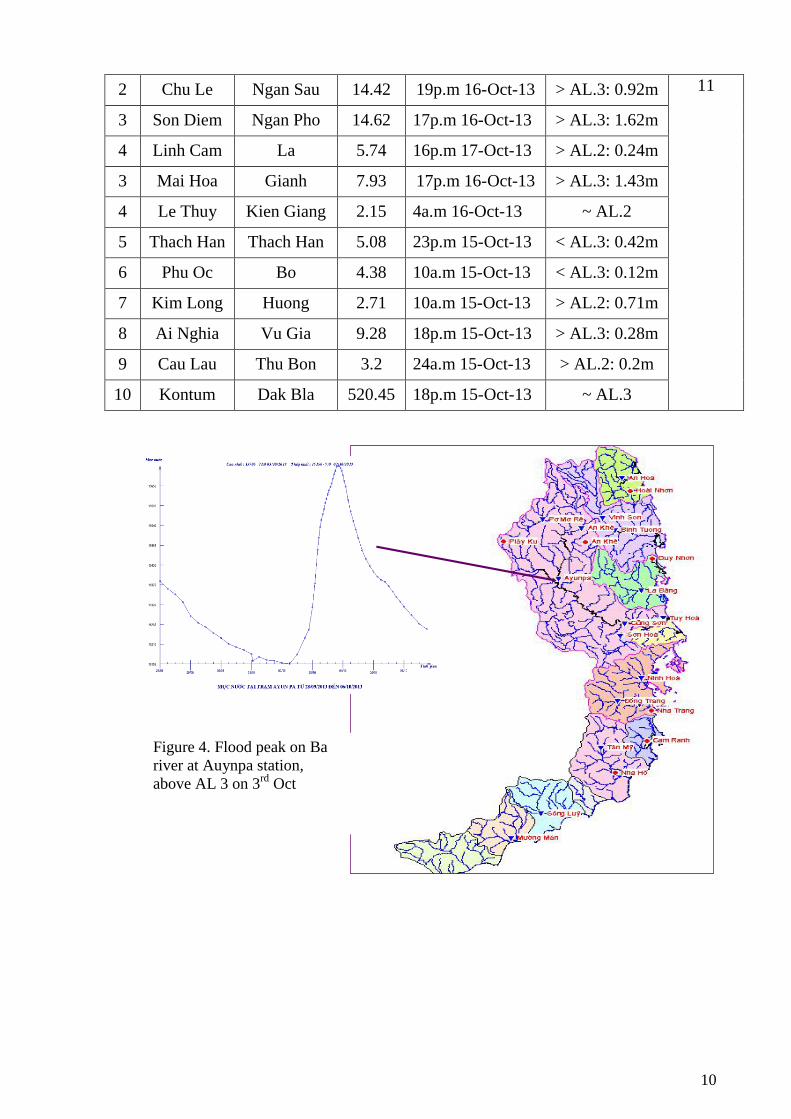
Tropical Storm No.11 (NARI) directly influenced to Viet Nam from 14 Oct
to 16 Oct, 2013. During 15 – 16 Oct, medium to high flood were observed on rivers
in Central provinces from Nghe An to Quang Nam and Kontum with high
amplitude. Some main stations were recording the water levels that are around or
above AL.3. A summary of flood stituation and illutration of high flood peaks are
presented in table 6 and figures of 4 – 6.
Table 6 . The summary of flood situation at main stations in rivers of Central and
Highland area when TS No.11 appearance.
No Station River
Peak of
flood
(m)
Appearance time
of flood peak
Alarm Level
(m)
Remark
s
1 Nam Dan Ca 6.72 24a.m 17-Oct-13 < AL.2: 0.18m TS No
10
2 Chu Le Ngan Sau 14.42 19p.m 16-Oct-13 > AL.3: 0.92m 11
3 Son Diem Ngan Pho 14.62 17p.m 16-Oct-13 > AL.3: 1.62m
4 Linh Cam La 5.74 16p.m 17-Oct-13 > AL.2: 0.24m
3 Mai Hoa Gianh 7.93 17p.m 16-Oct-13 > AL.3: 1.43m
4 Le Thuy Kien Giang 2.15 4a.m 16-Oct-13 ~ AL.2
5 Thach Han Thach Han 5.08 23p.m 15-Oct-13 < AL.3: 0.42m
6 Phu Oc Bo 4.38 10a.m 15-Oct-13 < AL.3: 0.12m
7 Kim Long Huong 2.71 10a.m 15-Oct-13 > AL.2: 0.71m
8 Ai Nghia Vu Gia 9.28 18p.m 15-Oct-13 > AL.3: 0.28m
9 Cau Lau Thu Bon 3.2 24a.m 15-Oct-13 > AL.2: 0.2m
10 Kontum Dak Bla 520.45 18p.m 15-Oct-13 ~ AL.3
Figure 4. Flood peak on Ba
river at Auynpa station,
above AL 3 on 3rd
Oct
11
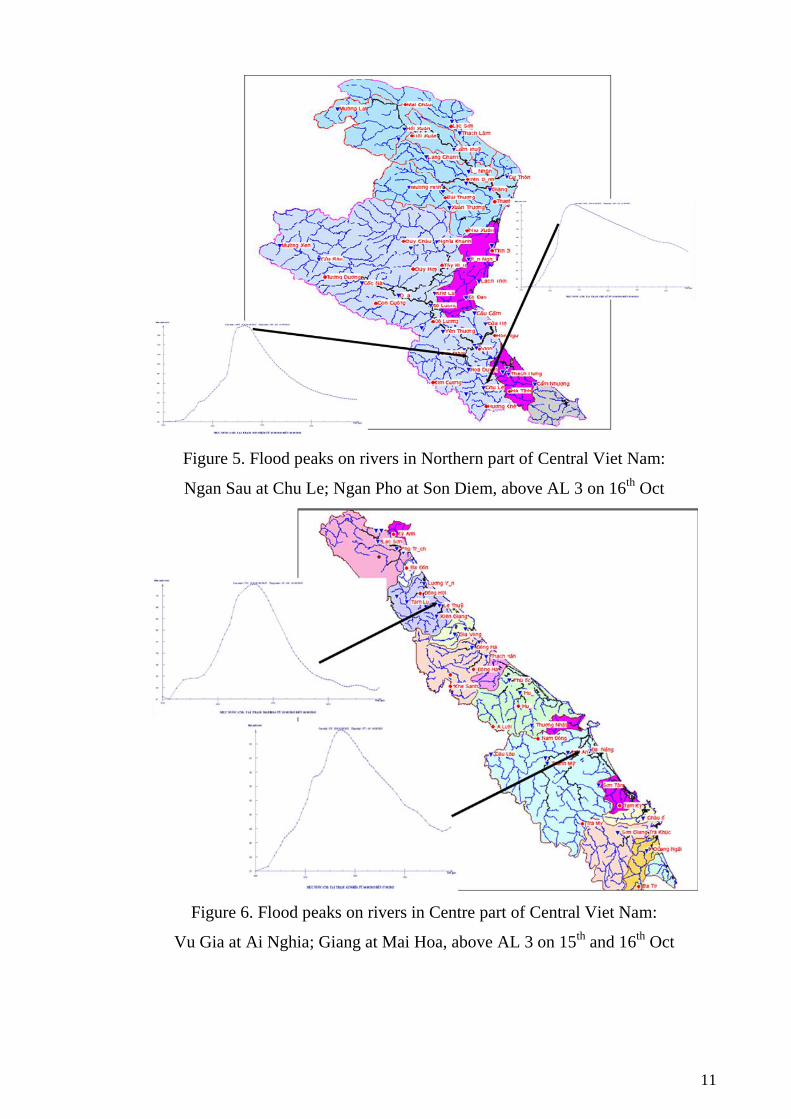
Figure 5. Flood peaks on rivers in Northern part of Central Viet Nam:
Ngan Sau at Chu Le; Ngan Pho at Son Diem, above AL 3 on 16th
Oct
Figure 6. Flood peaks on rivers in Centre part of Central Viet Nam:
Vu Gia at Ai Nghia; Giang at Mai Hoa, above AL 3 on 15th
and 16th
Oct

12
Figure 7. Flood peak on river Dak Bla at Kontum in Highland area
around AL 3 on 15th
Oct
3. Socio-Economic Assessment
3.1. Damage Situation in 2013
From the begining of this year until now, there had been 264 dead and
missing people; 800 injured ones; 11,851 collapesed and drifted houses, 706,786
houses were flooded, damaged and unroofed, 122,449 hectares of rice were
damaged; 206,172 ha of crops were damaged; 86,491 ha of industrial crops and
fruit fields were damaged; 105,058 ha of aquatic products lost; 17,379 million m3
of soil, stone and roads tumbled down. Estimated total value of material damage
was about 25,021 billion (in the storm number 15, the damage statistic only
synthesized dead or missing people, the other types of damages are being
intergrated by other localities and will be reported later) (detailed appendices are
attached).
3.2. Damage Situation in 2012
In year 2012, there were 10 hurricanes and 02 tropical depression
operating in the South China Sea; there were 11 earthquakes of magnitude 3.3
to 4.7 degrees and there were several thunderstorms and tornadoes with hails.
13
These natural calamities have created 258 dead and missing people, 408 injured
ones, 6,292 collapesed and drifted houses; 101,756 houses were flooded, damaged
and unroofed, 408 383 hectares of rice crops were damaged; 3240,069 m3 of of soil,
stone and roads tumbled down Estimated total value of material damage was about
16,000 billion (Prime Minister had decided to support the local areas, departments
and ministries affected by natural calamities to hunger relief and overcome
consequences with a total amount of: 1445.8 billion VND and 6,500 tons of rice).
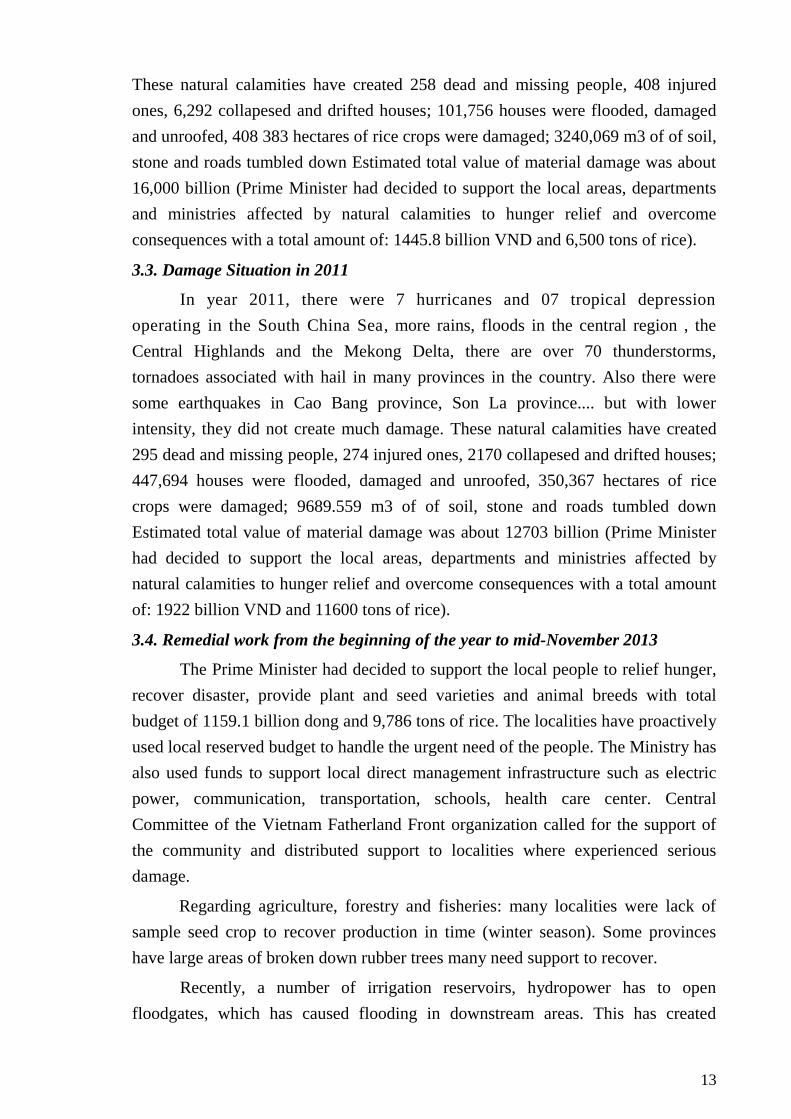
3.3. Damage Situation in 2011
In year 2011, there were 7 hurricanes and 07 tropical depression
operating in the South China Sea, more rains, floods in the central region , the
Central Highlands and the Mekong Delta, there are over 70 thunderstorms,
tornadoes associated with hail in many provinces in the country. Also there were
some earthquakes in Cao Bang province, Son La province.... but with lower
intensity, they did not create much damage. These natural calamities have created
295 dead and missing people, 274 injured ones, 2170 collapesed and drifted houses;
447,694 houses were flooded, damaged and unroofed, 350,367 hectares of rice
crops were damaged; 9689.559 m3 of of soil, stone and roads tumbled down
Estimated total value of material damage was about 12703 billion (Prime Minister
had decided to support the local areas, departments and ministries affected by
natural calamities to hunger relief and overcome consequences with a total amount
of: 1922 billion VND and 11600 tons of rice).
3.4. Remedial work from the beginning of the year to mid-November 2013
The Prime Minister had decided to support the local people to relief hunger,
recover disaster, provide plant and seed varieties and animal breeds with total
budget of 1159.1 billion dong and 9,786 tons of rice. The localities have proactively
used local reserved budget to handle the urgent need of the people. The Ministry has
also used funds to support local direct management infrastructure such as electric
power, communication, transportation, schools, health care center. Central
Committee of the Vietnam Fatherland Front organization called for the support of
the community and distributed support to localities where experienced serious
damage.
Regarding agriculture, forestry and fisheries: many localities were lack of
sample seed crop to recover production in time (winter season). Some provinces
have large areas of broken down rubber trees many need support to recover.
Recently, a number of irrigation reservoirs, hydropower has to open
floodgates, which has caused flooding in downstream areas. This has created
14
pressing in the public community. When heavy rainfall exceeds the capacity of
water storage, the opening of floodgates is unavoidable. However, in order to avoid
possible damage, we need to build warning system and regulations to implement the
warnings, instructions to direct people to the implementation of preventive
measures. On the other hand, in the long-term, we need to plan the downstream
population, create safe corridors drainage. Infrastructure for transportation, dykes,
irrigation dams, schools, health centers and other public buildings is only a
temporary fix to operate , require investment to upgrade permanent safety before the
next disaster .
II. Summary of progress in Key Result Areas
Title of item: Progress in interpreting Regional Forecasting Support Center - Ha Noi in
SWFDP of WMO at South-East Asia
Main text:
The SWFDP-SeA webpage is developed and taken into operationally since June 2012
under the link of http://www.swfdp-sea.com.vn (username: swfdp-sea and password: RA2
- in case sensitive) for NHMSs of Lao PDR, Combodia, Thailand to access and use
available products (see Fig. 1 and 2). At present, the following products are operationally
provided through the SWFDP-SeA portal:
- Short range (1-2 days) and Medium range (3-5 days) Guidance products: the guidance is
made by forecasters of NHMS of Vietnam and operationally issued at 00UTC. The
guidance includes warning maps related to severe weather such as heavy rainfall, strong
wind for responsible areas and categorical warning table for all given locations of relevant
countries.
- MTSAT-2’s IR1 and VIS products: horizontal resolution of 5km x 5km, 48 pictures per
day, update every 30 minutes
- Global Satellite Mapping of Precipitation (GSMAP) is global rainfall estimates by the
retrieval algorithm for brightness temperatures from satellite-born microwave radiometers.
The horizontal resolution is 0.25 x 0.25 deg, 24 pictures per day, update every 1 hour. The
delayed time is about 4 hours
- Storm tracks: this product is developed by NHMS of Vietnam in order to issue warning
the direction and speed of the movements of deep convective systems of up to 3 hours. The
algorithms are based on 3 steps: motion vector fields are derived two successive images
using multi-scale variational method; deep convective clouds are simply recognized by
multi-threshold method from MTSAT-2 data (infrared channels); and convective systems
are separated by deep first searching (DFS) algorithm

15
- ASCAT: this product provides a measure of wind speed and direction near the sea
surface. The measurements are obtained through the processing of scatterometer data
originating from the ASCAT instrument on EUMETSAT's Metop-A satellite.
- Global deterministic NWP products from GSM model of JMA, GFS of NCEP and
NOGAPS of US Navy, GEM of CMC and GME of DWD. The products of GSM, GFS and
NOGAPS has resolution of 0.5 x 0.5 deg. Meanwhile, GEM and GME products have
respectively resolution of 0.6 x 0.6 deg and 0.3 x 0.3 deg. All of global model products is
updated every 6 hours at 00UTC, 06UTC, 12UTC and 18UTC. The available surface
forecasting products include charts for precipitation, pressure of mean sea level,
temperature at 2 meters, wind at 10 meters, 1000-500mb thickness. For upper levels (850,
700, 500 and 300mb), the forecasting charts of wind and geo-potential height, relative
humidity, relative vorticity and vertical velocity is also provided.
- Global Ensemble Prediction Products based on 21 ensemble members of GFS ensemble
system (NAEPS) for forecasting 5-10 day ahead: these products have resolution of 1.0 x
1.0 deg and are updated every 12 hours at 00UTC and 12UTC. The available EPS products
include charts for ensemble mean (i.e. pressure of mean sea level, wind and geo-potential
height at 850mb and temperature at 850mb), stamp map of 24-hours accumulated
precipitation, and probabilistic maps (i.e. 24-hours precipitation quartile, 24-hours
precipitation probability, 24-hours maximum wind-gust probability, 24-hours maximum
CAPE probability, etc). In addition, the EPS-diagram for the 22 locations of Cambodia, 17
locations of Lao PDR and 16 locations of Thailand are also provided.
- Regional Ensemble Prediction Products based on two operational EPS of NHMS of
Vietnam, namely is SREPS and LEPS. The SREPS (Short Range Ensemble Prediction
System) is multi-model multi analysis EPS in which running HRM (High resolution
Regional Model of DWD) and WRF (with two dynamic cores ARW and NMM) with
initial and boundary conditions separately from 5 global models including GSM, GEM,
GFS, GEM and NOGAPS. The SREPS has 15 members with resolution of 0.15 x 0.15 deg
and is updated every 6 hours at 00UTC, 06UTC, 12UTC and 18UTC. The main aim of
SREPS is in order to provide ensemble products for forecasting 1-3 days ahead. The LEPS
is developed to provide ensemble products from 3 to 5 days ahead by running HRM model
with initial and boundary conditions separately from 21 members of global EPS of GFS
model. The LEPS has 15 members with resolution of 0.2 x 0.2 deg and is updated every 12
hours at 00UTC, and 12UTC. All available ensemble mean and probabilistic products of
SREPS and LEPS is the same as with NAEFS.
Identified opportunities/challenges, if any, for further development or collaboration:
The SWFDP-SeA webpage is taken into operationally since June 2012 and the forecasters
of NHMS’s Lao PDR, Combodia, Thailand can access and use available products as above
mentioned. Recently, NHMS’s of Philippines and Myanmar are interested in the SWFDP-
16
SeA webpage and asked NHMS’s Vietnam to expand responsible areas of specific
products to cover these countries. In order to ensure all functions of WMO’s RFSC and
improve predictability of severe weather phenomena for South-East Asia in SWFDP
project, the key task in 2014 will be more paid attention to:
- Provide forecast product of the motion of observed precipitation areas up to 3 hours
ahead (1 hour cycle) using Semi-Lagrangian advection scheme in combination with
satellite data
- Provide tropical cyclone track and intensity forecasting products based on RSMCs and
NWP models
- Provide verification products for guidance and near real-time NWP verification products
- Provide weather forecasting charts from regional non-hydrostatic model with 2-5km
resolution to increase predictability of severe weather phenomena
- Add “Forecast Forum” tool in SWFDP-SeA website in order to NHMS’s forecaster can
discuss and share information
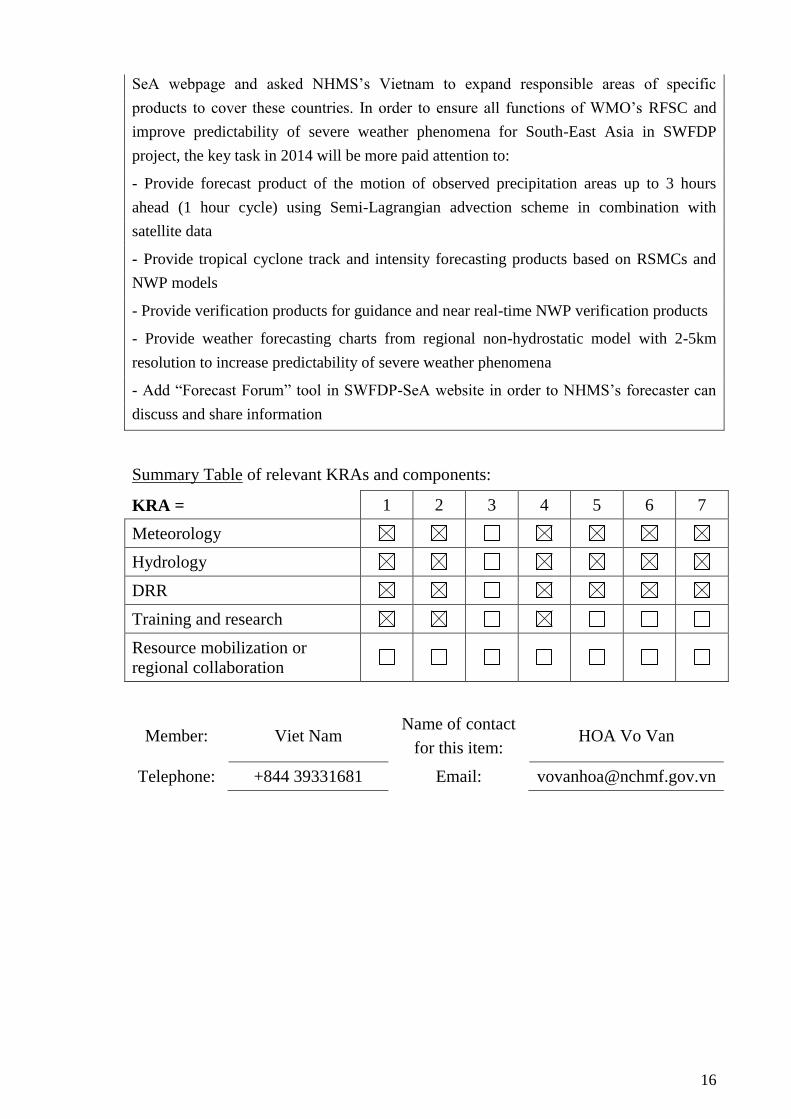
Summary Table of relevant KRAs and components:
KRA = 1 2 3 4 5 6 7
Meteorology
Hydrology
DRR
Training and research
Resource mobilization or
regional collaboration
Member: Viet Nam Name of contact
for this item: HOA Vo Van
Telephone: +844 39331681 Email: [email protected]

17
III. Update of Members’ Working Groups representatives
1. Working Group on Meteorology
Vo Van HOA Mr
Deputy chief of Research and Development Division of National Center for
Hydro-Meteorological Forecasting
No. 4 Dang Thai Than Str.Hanoi, Vietnam.
Tel: (84-4) 3 933 1681, Fax: (+84-4) 38254278, Mobile: (+84) 912509932
Email: [email protected]; [email protected];
2. Working Group on Hydrology
Dang Thanh MAI Dr
Deputy director of National Center for Hydro-Meteorological Forecasting
No. 4 Dang Thai Than Str.Hanoi, Vietnam.
Tel: (84-4) 3 8 256 278, Fax: (+84-4) 38254278, Mobile: (+84) 947109558
Email: [email protected]
3. Working Group on Disaster Prevention and Preparedness
1. Dr. Vu Kien Trung
Deputy Director of Department of Dike Management, Flood and Storm control
Directorate of Water Resources, Ministry of Agriculture and Rural
Development, Vietnam.
A4 Building, No. 4 Ngoc Ha Str., Ba Dinh, Hanoi, Vietnam.
Fax: 84-4-7335701 e-mail: [email protected]
Telephone number: Office: 84-4-7335695
2. Mr. Nguyen Hiep
Deputy head of Flood and storm Management Division, Department of Dike
Management, Ministry of Agriculture and Rural Development, Vietnam.
A4 Building, No. 4 Ngoc Ha Str., Ba Dinh, Hanoi, Vietnam.
Fax: 84-4-7335701 e-mail: [email protected]
Telephone number: Office: 84-4-7335695
4. Training and Research Coordinating Group
Nguyen Dai KHANH

18
Director of Science-Technology and International Coopertation Department of
National Hydro-Meteorological Service of Viet Nam
N4, Dang Thai Than Street, Ha Noi, Viet Nam
Fax: 844 3 8260779/ 3 8257740 e-mail: [email protected]
Telephone number: Office: 844 38244120 Home: 844 3 8251059