Embed Size (px)
Citation preview

MEMA APRC Fall 2006 MEMA APRC Fall 2006 ConferenceConference
““The Manufacturers’ Agenda on The Manufacturers’ Agenda on Capitol Hill”Capitol Hill”
Thursday, October 12Thursday, October 12thth, 2006, 2006
Patrick J. Cleary,Patrick J. Cleary,
Senior Vice President, Senior Vice President,
Communications, NAMCommunications, NAM

Manufacturing Manufacturing Strengths:Strengths:
12% of 12% of GGross ross DDomestic omestic PProductroduct
●80% >Retail
●62% >
●150% >
Construction, Mining and Agriculture
Transportation and Utilities
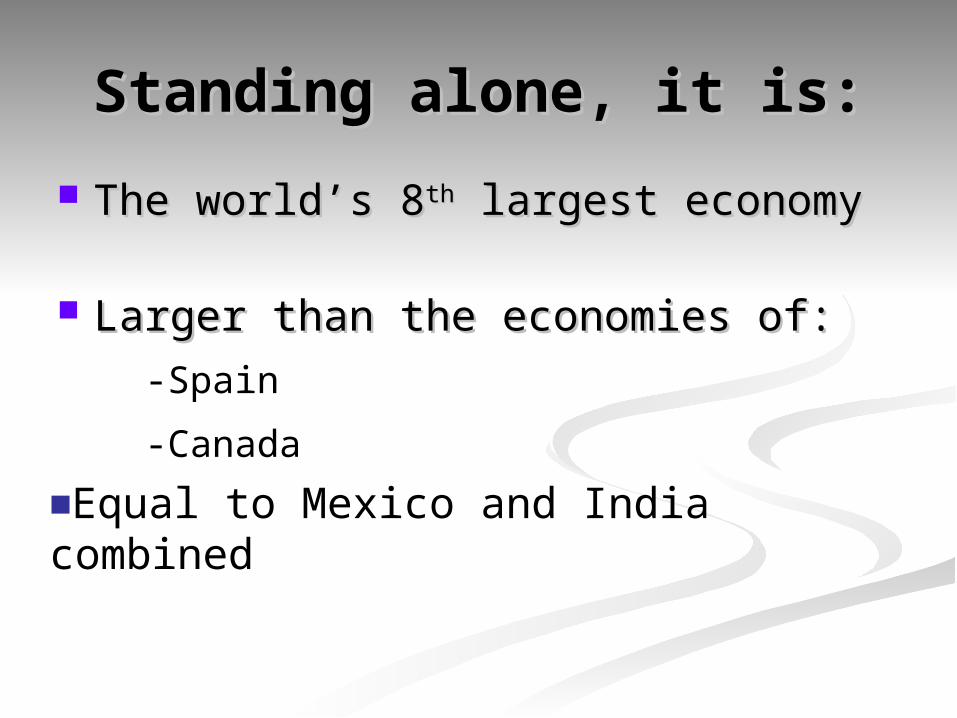
Standing alone, it is:Standing alone, it is:
The world’s 8The world’s 8thth largest economy largest economy
Larger than the economies of:Larger than the economies of:
-Spain
-Canada
■Equal to Mexico and India combined

Manufacturing is responsible for nearly Manufacturing is responsible for nearly two-thirds (62%) of all U.S. exports of goods two-thirds (62%) of all U.S. exports of goods and services.and services.
Manufacturing is responsible for Manufacturing is responsible for three fifthsthree fifths of all industrial R & Dof all industrial R & D
Manufacturing is responsible for Manufacturing is responsible for 90%90% of all of all patents.patents.
-Agriculture: $60billion/yearly
-Manufacturing: $60billion/monthly

Manufacturing employs Manufacturing employs 14 million 14 million peoplepeople
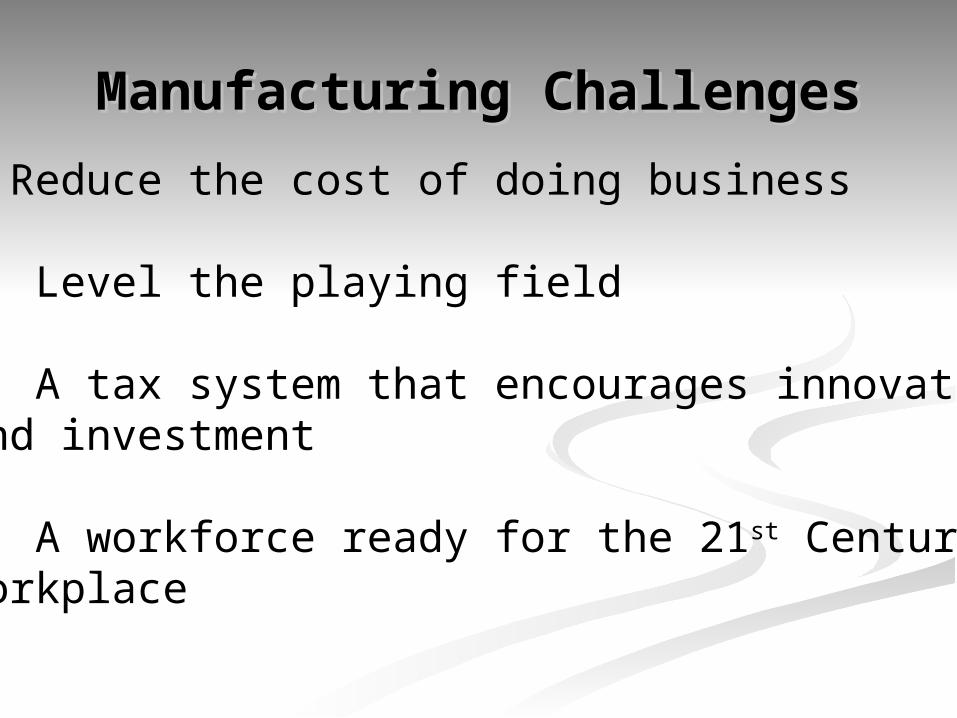
Manufacturing ChallengesManufacturing Challenges
1.Reduce the cost of doing business
2. Level the playing field
3. A tax system that encourages innovation and investment
4. A workforce ready for the 21st CenturyWorkplace

1. Reduce The Cost Of Doing 1. Reduce The Cost Of Doing BusinessBusiness
-31.7% Cost disadvantages vs. Our trading partners/competitors
-Non-Wage Costs
-Doesn’t include cost of Workplace Regulations
-Highest Pollution Abatement Costs in the World
-2nd Highest Corporate Tax Rate in the World
-Highest Natural Gas Prices in the World
-Highest Tort Costs in the World
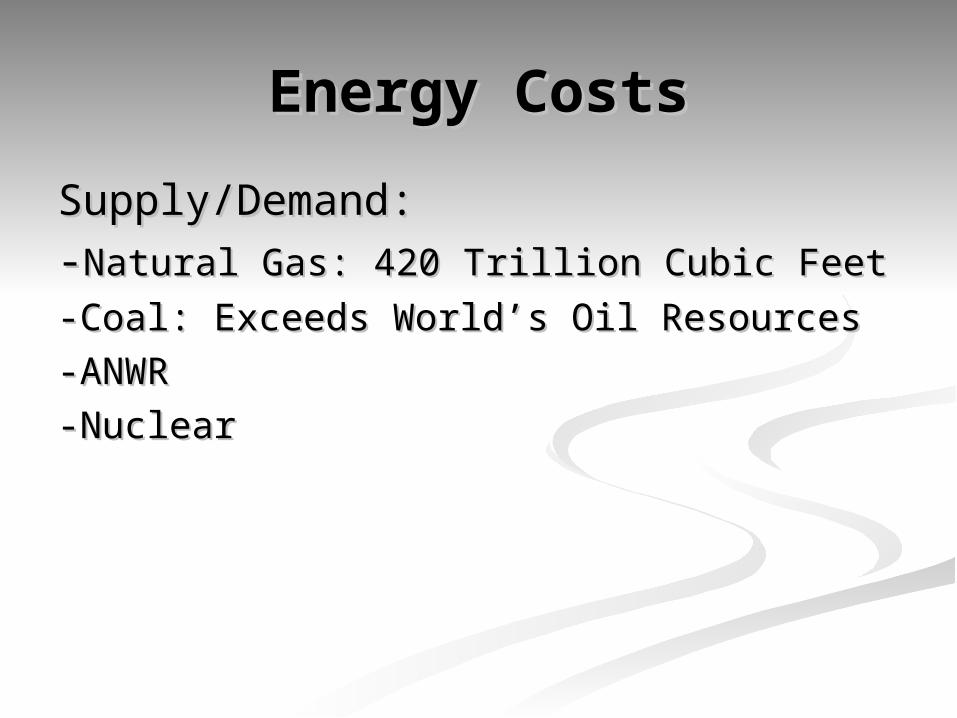
Energy CostsEnergy Costs
Supply/Demand:Supply/Demand:
--Natural Gas: 420 Trillion Cubic FeetNatural Gas: 420 Trillion Cubic Feet
-Coal: Exceeds World’s Oil Resources-Coal: Exceeds World’s Oil Resources
-ANWR-ANWR
-Nuclear-Nuclear

Legal CostsLegal Costs
-2% of GDP-2% of GDP
-Larger than the economies of: -Larger than the economies of: Hong Kong Hong Kong HungaryHungaryVietnam Vietnam VenezuelaVenezuelaPortugalPortugal PeruPeruAlgeria Algeria IsraelIsraelRomaniaRomania IrelandIrelandCzech RepublicCzech Republic MoroccoMoroccoDenmarkDenmark NigeriaNigeriaChileChile KazakhstanKazakhstanNorwayNorway SingaporeSingaporeFinlandFinland BelarusBelarus…………..and 173 others..and 173 others

2. Level Playing Field2. Level Playing Field
Vis a vis China, this means:Vis a vis China, this means:
-No currency manipulation-Respect for intellectual property-No illegal subsidies
-Compliance with all WTO rules
■ ■ More Free Trade More Free Trade AgreementsAgreements

3. Tax System That 3. Tax System That Encourages Innovation & Encourages Innovation &
InvestmentInvestment
-Make Tax Cuts Permanent-Make Tax Cuts Permanent
-R&D Tax Credit-R&D Tax Credit

The United States Leads The United States Leads The way in Innovation The way in Innovation

Manufacturers AreManufacturers AreTechnology LeadersTechnology Leaders

4. A Ready Workforce4. A Ready WorkforceChart 1: Engineering Degrees
0
70,000
140,000
210,000
1985 1990 1995 2000
Number of first university degrees
China
Japan
Korea
United States
Source: National Science Foundation

Chart 2: U.S. Graduate Degrees in Mathematics, Engineering and Physical & Computer Sciences
46%
28%
54%
72%
0%
25%
50%
75%
100%
1983 2001
Share
U.S. Citizens
Non-US Citizens
Source: National Science Foundation
SolutionsSolutions
Lean Not Spoken Here
Prosperity ProjectProsperity Projectwww.nam.org/P2www.nam.org/P2

SolutionsSolutions
1. Reduce Cost of doing business1. Reduce Cost of doing businessTaxesTaxesRegulationsRegulationsLegal CostsLegal CostsEnergyEnergy
2. Level Playing Field:2. Level Playing Field:Open New MarketsOpen New Markets
3. “Which is More Important?”3. “Which is More Important?”4. Stand Out of Our Light4. Stand Out of Our Light
[email protected]/[email protected]/202.637.3124www.ShopFloor.orgwww.ShopFloor.org