Embed Size (px)
Citation preview

oag.com
The World’s Most Connected Airports
© 2016 OAG Aviation Worldwide Limited. All rights reserved
Published: Nov 2016
MegahubsIndex
2016

© 2016 OAG Aviation Worldwide Limited. All rights reserved
OAG Megahubs Index 2016 – The World’s Most Connected Airports
2
Contents
About OAG Megahubs 2016 3Top 50 Megahubs 4Key Highlights 5Top 25 Low-Cost Megahubs 6Top Megahubs by Region 8 –AsiaPacific 8 – Europe 8 – Middle East and Africa 9 – Latin America 9 – North America 9About OAG Connections Analyser 12Glossary of Codes 14

3oag.com
The OAG Megahubs Index 2016 reveals the 50 most connected airports in the world as measured by the ratio of scheduled seat capacity to the number of destinations served by the airport – a Connectivity Index. It harnesses the world’s most comprehensive schedules database to dynamically build connections through a dedicated analytics platform, Connections Analyser.
Enabling common comparison between leading airports; the Megahubs Index measures an airport’s effectiveness as a connecting point on a global and regional basis to highlight the evolving nature of the Megahub model.
The OAG Megahubs Index 2016 presents connectivity data as a series of tables based on regional location and airline type.
About OAG Megahubs Index 2016
OAG has calculated the total number of all possible connections between inbound and outboundflightswithinasix-hourwindowatthelargest 100 airports in the world (based on departing scheduled seat capacity for the 12 months to September 2016) based on the busiest day for global aviation in 2016.
For the purposes of this analysis, in addition to the in-built business rules within OAG Connections Analyser, the following customisable criteria were chosen for all operating flights:• Single connections only to/from the chosen airports;• Maximum circuity of 150*;• Minimum Connection Time (MCT) varies by individual airport as OAG holds MCT
information for every commercial airport in operation;• Maximum Connection Window of 6 hours*
Analysis has been further enhanced by including OAG’s MCT Exceptions Table within our Connections Analyser tool. At any one time, there are typically around 120,000 exceptions globally. These are typically less than the published MCTs and it is the responsibility of the airlines involved to ensure that the connection time remains viable for passengers to make the connection.
* 2015 criteria was based on maximum circuity of 180 and maximum connection window of 8 hours
Methodology

© 2016 OAG Aviation Worldwide Limited. All rights reserved
OAG Megahubs Index 2016 – The World’s Most Connected Airports
4
The Top 50 Megahubs are those airports with the highest ratio of possible scheduled connections to the number of destinations served by the airport.
Online and interline connections are included and utilising the power of Connections Analyser, low-cost carriers’ (LCC) connections are also included.
Top 50 Megahubs
Rank Airport Country Connectivity Index
1 ORD USA 1204
2 ATL USA 997
3 DFW USA 709
4 DEN USA 633
5 CLT USA 588
6 LAX USA 580
7 CGK Indonesia 566
8 SEA USA 470
9 SFO USA 449
10 PHX USA 431
11 HND Japan 418
12 MSP USA 414
13 IAH USA 409
14 DTW USA 398
15 LHR UK 397
16 SYD Australia 389
17 BOS USA 366
18 PHL USA 352
19 YYZ Canada 328
20 FRA Germany 301
21 AMS Netherlands 296
22 DEL India 286
23 CGH Brazil 285
24 LAS USA 282
25 MEX Mexico 279
Rank Airport Country Connectivity Index
26 EWR USA 268
27 SIN Singapore 262
28 BOM India 260
29 CDG France 257
30 YVR Canada 254
31 JFK USA 252
32 DCA USA 249
33 HKG Hong Kong 244
34 MEL Australia 237
35 MIA USA 236
36 KUL Malaysia 234
37 IST Turkey 233
38 MDW USA 232
39 BOG Colombia 228
40 PEK China 226
41 GRU Brazil 223
42 SLC USA 220
43 BKK Thailand 210
44 PVG China 208
45 CAN China 201
46 MUC Germany 200
47 BWI USA 199
48 DXB UAE 194
49 ICN South Korea 188
50 SUB Indonesia 186

5oag.com
Key Highlights
Top 50 Megahubs share by region
• Chicago O’Hare International Airport (ORD) is the largest Megahub in the world. On a single day in August, there were over 270,000 possible connections between flights arriving at ORD and flights departing within a six-hour window.
• US airports continue to lead the world when it comes to making large airports work as Megahubs. Nine of the Top 10 Megahubs are located in the US, one more than in 2015. Overall, there are 22 US airports among the Top 50 Megahubs.
• The highest ranking Megahub outside of the US is Jakarta’s Soekarno–Hatta International Airport (CGK) in Indonesia, which is ranked in 7th place. On the busiest day there were over 40,000 potential connections between flights within six hours, connecting passengers between 71 destinations.
• London Heathrow Airport (LHR) is the highest-ranked Megahub in Europe, ranked 15th overall. Last year it was placed well ahead of other European rivals but the gap appears to be closing with Frankfurt (FRA) ranked 20th and Amsterdam (AMS) ranked 21st.
• Sao Paulo Congonhas Airport (CGH) is the largest Megahub in Latin America but its ranking has fallen since the 2015 edition, from 7th place to 23rd.
Asia Pacific
Europe
Middle East and Africa
North America
Latin America
30%
12%
2%
48%
8%
© 2016 OAG Aviation Worldwide Limited. All rights reserved
OAG Megahubs Index 2016 – The World’s Most Connected Airports
6
MDWBWIDEN
MEXLAX
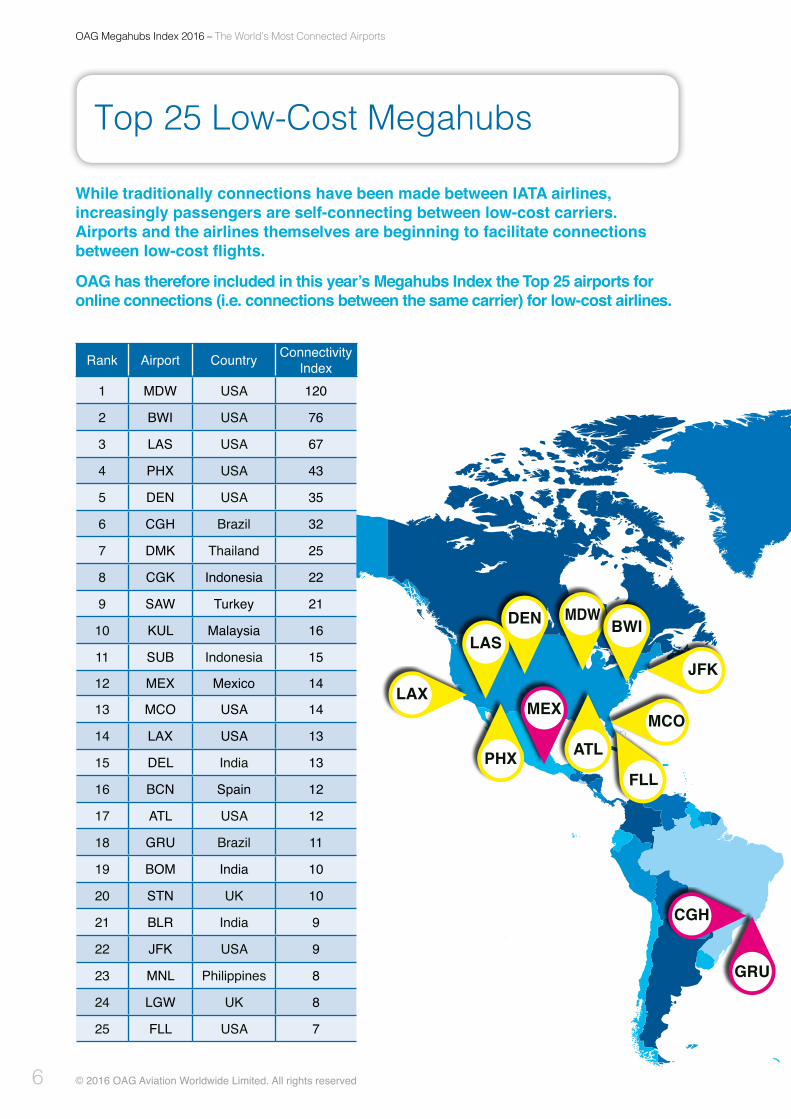
While traditionally connections have been made between IATA airlines, increasingly passengers are self-connecting between low-cost carriers. Airports and the airlines themselves are beginning to facilitate connections between low-cost flights.
OAG has therefore included in this year’s Megahubs Index the Top 25 airports for online connections (i.e. connections between the same carrier) for low-cost airlines.
Top 25 Low-Cost Megahubs
Rank Airport Country Connectivity Index
1 MDW USA 120
2 BWI USA 76
3 LAS USA 67
4 PHX USA 43
5 DEN USA 35
6 CGH Brazil 32
7 DMK Thailand 25
8 CGK Indonesia 22
9 SAW Turkey 21
10 KUL Malaysia 16
11 SUB Indonesia 15
12 MEX Mexico 14
13 MCO USA 14
14 LAX USA 13
15 DEL India 13
16 BCN Spain 12
17 ATL USA 12
18 GRU Brazil 11
19 BOM India 10
20 STN UK 10
21 BLR India 9
22 JFK USA 9
23 MNL Philippines 8
24 LGW UK 8
25 FLL USA 7
CGH
GRU
FLL
ATL
JFK
MCO
LAS
PHX
7oag.com
SAW
LGW
DMK MNL
STN
DEL
BOM
KUL
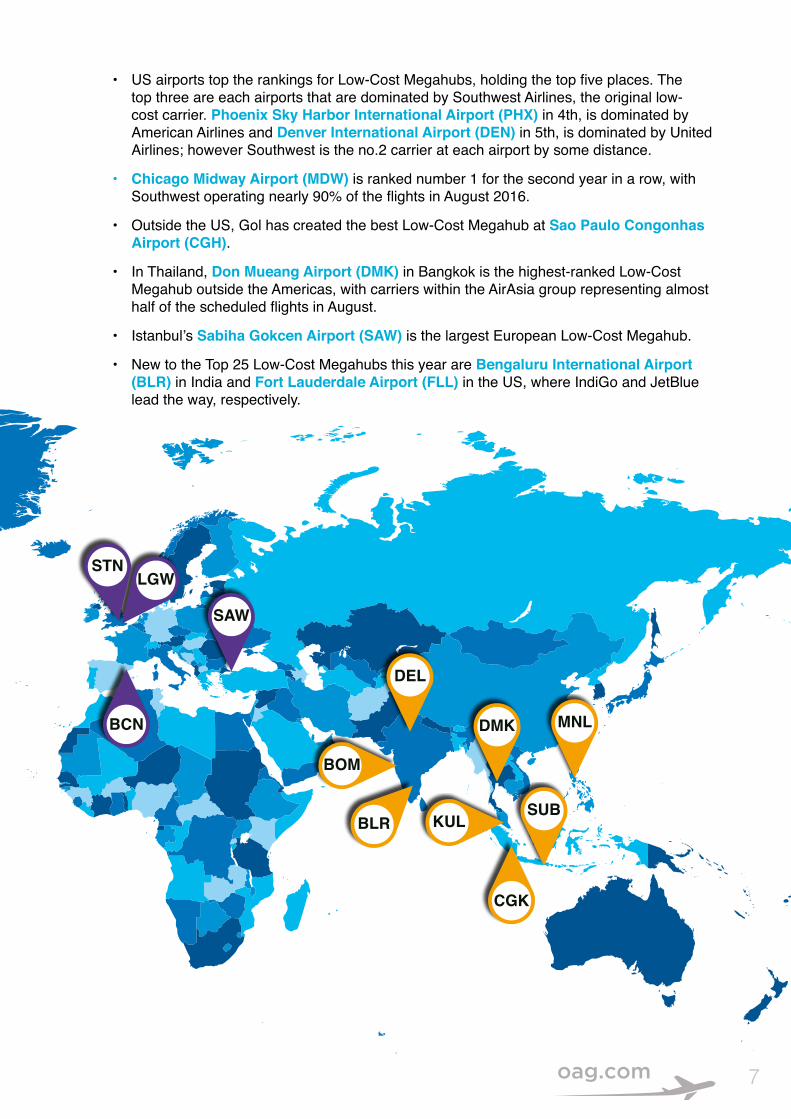
• US airports top the rankings for Low-Cost Megahubs, holding the top five places. The top three are each airports that are dominated by Southwest Airlines, the original low-cost carrier. Phoenix Sky Harbor International Airport (PHX) in 4th, is dominated by American Airlines and Denver International Airport (DEN) in 5th, is dominated by United Airlines; however Southwest is the no.2 carrier at each airport by some distance.
• Chicago Midway Airport (MDW) is ranked number 1 for the second year in a row, with Southwest operating nearly 90% of the flights in August 2016.
• Outside the US, Gol has created the best Low-Cost Megahub at Sao Paulo Congonhas Airport (CGH).
• In Thailand, Don Mueang Airport (DMK) in Bangkok is the highest-ranked Low-Cost Megahub outside the Americas, with carriers within the AirAsia group representing almost half of the scheduled flights in August.
• Istanbul’s Sabiha Gokcen Airport (SAW) is the largest European Low-Cost Megahub.
• New to the Top 25 Low-Cost Megahubs this year are Bengaluru International Airport (BLR) in India and Fort Lauderdale Airport (FLL) in the US, where IndiGo and JetBlue lead the way, respectively.
BLR
CGK
SUB
BCN

© 2016 OAG Aviation Worldwide Limited. All rights reserved
OAG Megahubs Index 2016 – The World’s Most Connected Airports
8
AsiaPacific
Europe
Rank Airport Country Connectivity Index
1 CGK Indonesia 5662 HND Japan 4183 SYD Australia 3894 DEL India 2865 SIN Singapore 2626 BOM India 2607 HKG Hong Kong 2448 MEL Australia 2379 KUL Malaysia 234
10 PEK China 226
Rank Airport Country Connectivity Index
1 LHR UK 3972 FRA Germany 3013 AMS Netherlands 2964 CDG France 2575 IST Turkey 2336 MUC Germany 2007 FCO Italy 1678 MAD Spain 1559 ZRH Switzerland 122
10 SVO Russian Federation 120
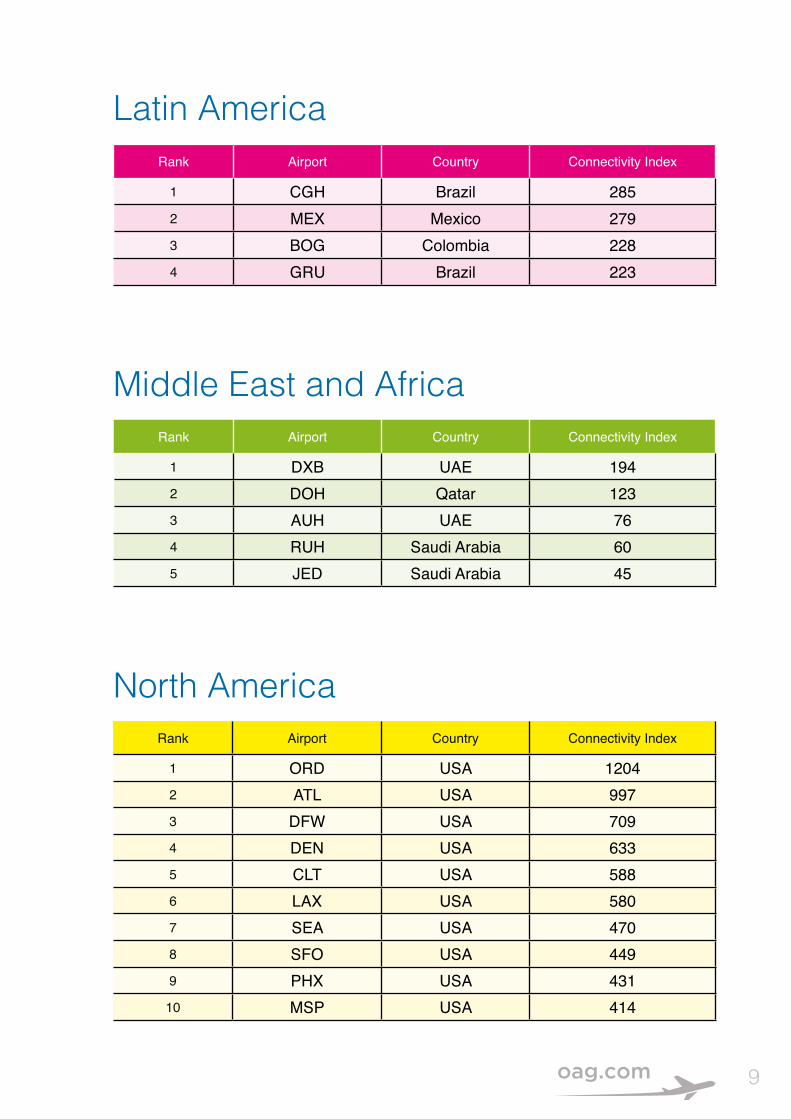
Top Megahubs by Region
9oag.com
North America
Latin America
Middle East and Africa
Rank Airport Country Connectivity Index
1 CGH Brazil 2852 MEX Mexico 2793 BOG Colombia 2284 GRU Brazil 223
Rank Airport Country Connectivity Index
1 DXB UAE 1942 DOH Qatar 1233 AUH UAE 764 RUH Saudi Arabia 605 JED Saudi Arabia 45
Rank Airport Country Connectivity Index
1 ORD USA 12042 ATL USA 9973 DFW USA 7094 DEN USA 6335 CLT USA 5886 LAX USA 5807 SEA USA 4708 SFO USA 4499 PHX USA 431
10 MSP USA 414

© 2016 OAG Aviation Worldwide Limited. All rights reserved
OAG Megahubs Index 2016 – The World’s Most Connected Airports
10
Top Megahubs by Region
ATL
CLTSFO
ORD
LAX
MSP
SEA
DFW
PHX
DEN
BOG
LHR
MAD
AMS
ZRH
MEX
CGH
GRU
CDG
FCO

11oag.com
CGK
SIN
MEL
HND
DELHKG
BOM
SYD
PEK
DXB
RUH
DOH
JEDAUH
IST
MUC
FRA
SVO
FCO
KUL
© 2016 OAG Aviation Worldwide Limited. All rights reserved
OAG Megahubs Index 2016 – The World’s Most Connected Airports
12
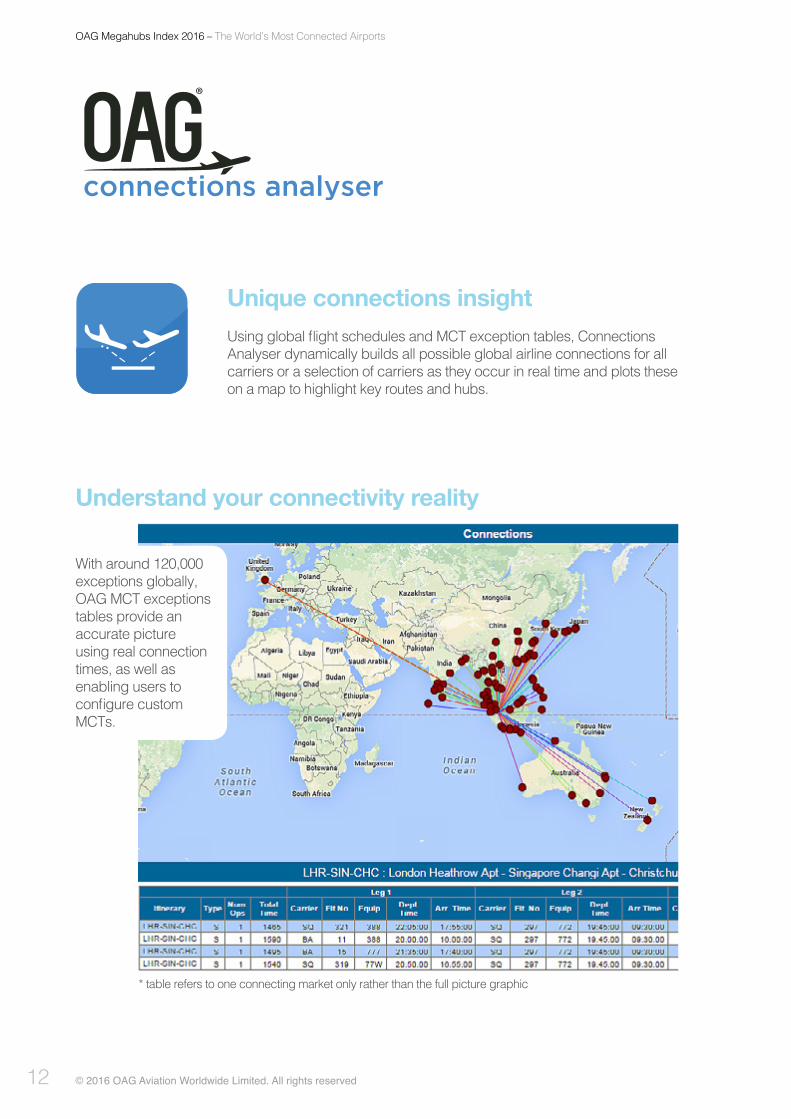
Unique connections insightUsingglobalflightschedulesandMCTexceptiontables,ConnectionsAnalyser dynamically builds all possible global airline connections for all carriers or a selection of carriers as they occur in real time and plots these on a map to highlight key routes and hubs.
Understand your connectivity reality
connections analyser
With around 120,000 exceptions globally, OAG MCT exceptions tables provide an accurate picture using real connection times, as well as enabling users to configurecustomMCTs.
* table refers to one connecting market only rather than the full picture graphic

13oag.com
Review missed connectivity opportunities
Evaluate connectivity potential
Contact www.oag.com/connections or email [email protected]
‘What if’ analysis with different MCTs, phantom flightsandpotential airline partners
Evaluate potential missed connections at a gateway airport by one or more carriers
* table refers to one connecting market only rather than the full picture graphic

© 2016 OAG Aviation Worldwide Limited. All rights reserved
OAG Megahubs Index 2016 – The World’s Most Connected Airports
14
Glossary of Codes
Code CountryAMS Amsterdam Netherlands
ATL Atlanta Hartsfield-Jackson Intl USA
BCN Barcelona Spain
BKK Bangkok Suvarnabhumi International Thailand
BLR Bengaluru IndiaBOG Bogota ColombiaBOM Mumbai India
BOS Boston Edward L Logan Intl USA
BWI Baltimore Washington International USA
CAN Guangzhou ChinaCDG Paris Charles de Gaulle France
CGH Sao Paulo Congonhas BrazilCGK Jakarta Soekarno-Hatta Indonesia CLT Charlotte USA
DCA Washington Ronald Reagan National USA
DEL Delhi IndiaDEN Denver Intl USA
DFW Dallas Dallas/Fort Worth Intl USA
DMK Bangkok Don Mueang International Thailand
DTW Detroit Metropolitan Wayne County USA
DXB Dubai International UAE
EWR Newark Liberty International USA
FLL Fort Lauderdale/Hollywood Intl USA
FRA Frankfurt International Germany
GRU Sao Paulo Guarulhos Intl BrazilHKG Hong Kong International Hong KongHND Tokyo Intl (Haneda) Japan
IAH Houston George Bush Intercont. USA
ICN Seoul Incheon International South Korea
IST Istanbul Ataturk Turkey
Code Country
JFK New York J F Kennedy International USA
KUL Kuala Lumpur International Malaysia
LAS Las Vegas McCarran International USA
LAX Los Angeles International USALGW London Gatwick UK
LHR London Heathrow UK
MCO Orlando International USAMDW Chicago Midway Intl USAMEL Melbourne Airport AustraliaMEX Mexico City Juarez Intl MexicoMIA Miami International USA
MNL Manila Ninoy Aquino International Philippines
MSP Minneapolis/St Paul International USA
MUC Munich International Germany
ORD Chicago O'Hare International USA
PEK Beijing Capital Intl ChinaPHL Philadelphia International USAPHX Phoenix Sky Harbor Intl USA
PVG Shanghai Pudong International China
SAW Istanbul Sabiha Gokcen Turkey
SEA Seattle-Tacoma International USA
SFO San Francisco USASIN Singapore Changi SingaporeSLC Salt Lake City USASTN London Stansted UKSUB Surabaya Indonesia SYD Sydney Kingsford Smith AustraliaYVR Vancouver International Canada
YYZ Toronto Lester B Pearson Intl Canada
SUB Surabaya Juanda IndonesiaSYD Sydney Kingsford Smith AustraliaYVR Vancouver International Canada
YYZ Toronto Lester B Pearson Intl Canada

15oag.com
schedules analyser
traffic analyser
DOTanalyser
connections analyser
mapper
The best aviation analysis, to drive the best business decisions.
Our analytics suite helps you monitor airline frequency and capacity trends, identify new airline routes and services, understand passenger traffic flows and evaluate airline connection performance.
Learn more:www.oag.com/analytics
© 2016 OAG Aviation Worldwide Limited.All rights reserved
For more information, contact:
Media EnquiriesWorldwideHannah Lock / Lucy Figiel +44 (0)118 909 0909 [email protected]
USAGil Haylon 1 (617) 969-9191 [email protected]
General EnquiriesCaroline Mather OAG [email protected]
Usage and attribution – OAG, the air travel intelligence company
This information can be reproduced in whole or in part, online or in print, for non–commercial purposes only but must include attribution to OAG with the following description ‘OAG, the air travel intelligence company’ and a link to www.oag.com.
oag.com
Disclaimer The intended recipient (“The Customer”) acknowledges that all data provided by or available through OAG is owned either by OAG Aviation Worldwide Ltd or by a third party provider (“The Owners”) and that the customer shall not acquire any ownership or interest in such data.
OAGdataissolelyforthebenefitandpurposesoftheintended recipient and may not be disclosed to, used by or copied by anyone other than the intended recipient. OAG Aviation Worldwide Ltd has used reasonable efforts in collecting and preparing data in the report but cannot and does not warrant that the information contained in this report is complete or accurate. OAG Aviation Worldwide Ltd hereby disclaims liability to any person for any loss or damage caused by errors or omissions in this report.