Embed Size (px)
Citation preview
* Corresponding author at: Tel.: +1 919 541 7981 E-mail address: [email protected]
Please cite this article as: Menetrez M.Y. Meeting the U.S. renewable fuel standard: a comparison of biofuel pathways. Biofuel Research Journal 4 (2014)
110-122.
.
Biofuel Research Journal 4 (2014) 110-122
Review Paper
Meeting the U.S. renewable fuel standard: a comparison of biofuel pathways Marc Y. Menetrez
United State Environmental Protection Agency, Office of Research and Development, National Risk Management Research Laboratory, Air Pollution
Prevention and Control Division, Research Triangle Park, NC 27711, USA.
HIGHLIGHTS
The year 2014 will see a significant increase in
the U.S. production of cellulosic ethanol to a total of
104 Mgal/yr (394 x103 m3/yr) when three new plants
are brought under full operation.
The accomplished increase in U.S. cellulosic
ethanol production although significant, will remain
far below the mandated 2014 Renewable Fuel
Standard of 1.75 Bgal/yr (6.6 x10⁶ m3/yr).
Potential pathways for producing biofuels from
algae were evaluated and compared for their
feedstock and footprint demands, as well as
productivity potential.
The U.S. commercial production of renewable
fuels is increasingly behind levels mandated by the
Renewable Fuel Standard. Algae based fuels could
be developed to help fill this growing gap.
GRAPHICAL ABSTRACT
ARTICLE INFO ABSTRACT Article history: Received 30 October 2014 Received in revised form 16 November 2014
Accepted 17 November 2014 Available online 1 December 2014
Keywords:
Renewable energy
Ethanol
Biodiesel
Algae
Biofuel pathway
The production of renewable energy is undergoing rapid development. Ethanol primarily derived from corn and biodiesel
made from recycled cooking oil and agricultural grains are established sources of renewable transportation fuel. Cellulosic
ethanol production is increasing substantially, but at a rate below expectations. If future renewable fuel projections are to be
accomplished, additional sources will be needed. Ideally, these sources should be independent of competing feedstock use
such as food grains, and require a minimal footprint. Although the uses of algae seem promising, a number of demonstrations
have not been economically successful in today‟s market. This paper identifies efforts being conducted on ethanol and
biodiesel production and how algae might contribute to the production of biofuel in the United States. Additionally, the
feedstock and land requirements of existing biofuel pathways are compared and discussed.
© 2014 BRTeam. All rights reserved.

Menetrez / Biofuel Research Journal 4 (2014) 110-122
Please cite this article as: Menetrez M.Y. Meeting the U.S. renewable fuel standard: a comparison of biofuel pathways. Biofuel Research Journal 4 (2014)
110-122.
.
1. Introduction
The 2007 Energy Independence and Security Act (EISA) (H.R. 6) and the 2005 federal renewable fuel standard (RFS) stipulates that, by 2022, the
United States must produce 15 billion gallons per year (Bgal/yr) or 56.8
million cubic meters (x106 m3/yr) of corn-based ethanol (CBE), 16 Bgal/yr (60.6 Mm3/yr) of cellulosic biofuels, 1 Bgal/yr (3.8 x10⁶ m3/yr) of biodiesel,
and 4 Bgal/yr (15.1 x10⁶ m3/yr) of advanced biofuels (other than corn-based
ethanol) (Environmental News Service, 2011; Public Law 110–140, 2007; RFS Renewable Fuels Association, 2012). Achieving a total production goal
of 36 Bgal/yr (136 x106 m3/yr) of renewable fuel by 2022 is a substantial
challenge, largely due to the established RFS requirement for cellulosic ethanol (see Table 1). However, U.S. biofuel production is substantial and
growing.
Table 1.
Renewable Fuel Projections (Public Law 110–140, 2007; Thompson et al., 2010; Environmental
News Service, 2011; RFS Renewable Fuels Association, 2012).
Year
Corn-
based
Ethanol
(CBE)
Bgal (x106
m3/yr)
Cellulosic
Ethanol
Bgal (x10
6
m3/yr)
Biodiesel a
Bgal (x106
m3/yr)
Advanced
Biofuel
Bgal
(x106m
3/yr)
Total RFS
Bgal
(x106m
3/yr)
Total biofuel
(minus CBE)
Bgal (x106m
3/yr)
2013
13.8 (52.2)
1.0 (3.8)
1.0 (3.8)
0.75 (2.8)
16.6 (62.6)
2.8 (10.4)
2014
14.4 (54.5)
1.8 (6.6)
1.0 (3.8)
1.0 (3.8)
18.2 (68.7)
3.8 (14.2)
2015
15.0 (56.8)
3.0 (11.4)
1.0 (3.8)
1.5 (5.7)
20.5 (77.6)
5.5 (20.8)
2016
15.0 (56.8)
4.2 (15.9)
1.0 (3.8)
2.0 (7.6)
22.3 (84.2)
7.3 (27.4)
2017
15.0 (56.8)
5.5 (20.8)
1.0 (3.8)
2.5 (9.5)
24.0 (90.8)
9.0 (34.1)
2018
15.0 (56.8)
7.0 (26.5)
1.0 (3.8)
3.0 (11.4)
26.0 (98.4)
11.0 (41.6)
2019
15.0 (56.8)
8.5 (32.2)
1.0 (3.8)
3.5 (13.2)
28.0 (106.0)
13.0 (49.2)
2020
15.0 (56.8)
10.5 (39.7)
1.0 (3.8)
3.5 (13.2)
30.0 (113.6)
15.0 (56.8)
2021
15.0 (56.8)
13.5 (51.1)
1.0 (3.8)
3.5 (13.2)
33.0 (124.9)
18.0 (66.1)
2022
15.0 (56.8)
16.0 (60.6)
1.0 (3.8)
4.0 (15.1)
36.0 (136.3)
21.0 (79.5)
a EISA is not specific on biodiesel after 2012.
The RFS projected production of multiple renewable fuels listed in Table 1 establishes guidance in consideration of environmental consequences while
advocating fuel production practices with lower associated green-house gas
(GHG) emission.
2. Meeting the RFS challenge for cellulosic ethanol -
current to future
production
As of 2014, the production of CBE (from more than 200 ethanol plants) was 15 Bgal/yr (56.8
x106 m3/yr) (equal to the 2022 RFS) (Parker, 2012a;
Ethanol Producers Digest, 2013). The majority of this ethanol (or
approximately 13.3 Bgal [50.3 x10⁶ m3/yr]) was used for the 10% additive to gasoline (Parker, 2012a). Biodiesel production, largely from yellow grease
(recycled vegetable oil), soy bean oil, and canola oil, was 1.0 Bgal/yr (3.8
x106 m3/yr) (equal to the 2022 RFS), from more than 200 biodiesel plants (U.S. Biodiesel Digest, 2011; U.S. Energy Information Administration,
2012a;
Biodiesel Industry Directory, 2013). Cellulosic ethanol plant
production capacity is currently 20 million gallons per year (75.7x10³
m3/yr),
as listed in Table 2. Thus, production is already at or above the 2022 RFS
levels for biodiesel and CBE biofuels (U.S. Energy Information
Administration, 2012a;
Ethanol Producers Digest, 2013).
As of early 2014, there were twelve commercial cellulosic ethanol plants
in operation, and they have a combined capacity of producing a total of 20
Mgal/yr (75.7x10³
m3/yr), (listed in Table 2), more than triple the 2013 capacity of 6.25 Mgal/yr (23.7x10³
m3/yr) (Ethanol Producers Digest, 2013).
As listed in Table 2, the Indian River Bioenergy Plant has the capability of
producing 8 Mgal/yr (30.3x10³
m3/yr) (as well as 5 megawatts of electric power), and the Fiberight Blairstown Plant can produce 6 Mgal/yr (22.7x10³
m3/yr) however, the other ten facilities are demonstration pilot plants, with a
production limit of less than 1.4 Mgal/yr (5.3x10³
m3/yr) (Shaffer, 2012; Ethanol Producers Digest, 2013). These demonstration projects have proven
that their technology is successful. The RFS challenge (listed in Table 1) to
produce 1.75Bgal/yr (6.6 x10⁶ m3/yr) of cellulosic ethanol in 2014 is unlikely,
and the possibility of meeting future RFS demands seems increasingly distant.
Five major cellulosic ethanol plants, listed in Table 2, are currently under construction that when in operation will produce in excess of 104 Mgal/yr
(393.7x10³ m3/yr). The Poet and Royal plant in Emmetsburg, Iowa is referred
to as „Project Liberty‟ and is located near other Poet CBE plants (Shaffer, 2012). The plant was constructed at a cost of $250 million, will produce 20 to
28 Mgal/yr (75.7 to 106 x103 m3/yr) from corn-stover, and is expected to be
operational in 2014 (Shaffer, 2012). Poet is an established ethanol manufacturer that owns and operates 27 CBE plants in the U.S. (Shaffer,
2012). The successful operation of the Project Liberty plant and the
established availability of corn stover could lead to further expansion and additional plants. (Poet is also currently extracting 250,000 t/yr [227 x106
kg/yr] or 68 Mgal/yr [257 x103 m3/yr], of corn oil from 25 equipped CBE
plants [Biodiesel Magazine, 2013; Ethanol Producers Digest, 2013].) As mentioned, in addition to the Project Liberty plant that will be
completed this year, there are four other major projects underway, i.e.
Abengoa Bioenergy‟s cellulosic ethanol plant using corn stover in Kansas; Blue Fire Renewables, LLC.‟s plant, in Mississippi (that will use wood
waste); Dupont Danisco‟s plant, in Iowa that will use corn stover; and
Enerkem Alberta‟s plant, in Alberta Canada that will use municipal solid waste (Shaffer, 2012; Ethanol Producers Digest, 2013). Table 2 lists the
commercial cellulosic ethanol plants and their stages of
construction/operation. There are three stages: (1) “Existing Plants”, consisting of nine existing plants in intermittent operation with a combined
capacity of 20 Mgal/yr (75.7x10³ m3/yr); (2) “Under Construction” consisting
of nine plants with a combined capacity of 104 Mgal/yr (394 x103 m3/yr); and; (3) “Proposed Plants” consisting of 16 proposed plants with a combined
capacity of 368 Mgal/yr (1.4 x10⁶ m3/yr) (Shaffer, 2012; Ethanol Producers
Digest, 2013). It should be understood that the existing plants are demonstration plants, many of which may not maintain production on a
continuous basis since their purpose may not be to produce ethanol
economically. These small scale plants are used to study the details of the process, demonstrate the feasibility of the technology and conduct process
optimization studies. An acceptable level of proof of the viability and
sustainability of a major cellulosic ethanol plant (producing a minimum of 10 Mgal/yr [37.9x10³ m3]) entails the successful operation of a year or more,
with an acceptable level of profit.
Based on data compiled by the U.S. Energy Information Administration and reported in Bloomberg News, the cellulosic ethanol industries will
increase production significantly in 2014 due to refinery startups (Shaffer,
2012; U.S. Energy Information Administration, 2012a; Ethanol Producers Digest, 2013). The „Ethanol Producers Digest‟ has estimated that the 2013
level of 20 Mgal/yr (75.7x10³ m3/yr) will increase to a total of 104 Mgal/yr
(394 x103 m3/yr) when plants that already are under construction are brought into operation (Shaffer, 2012; Ethanol Producers Digest, 2013). Even if these
optimistic predictions for cellulosic ethanol production are achieved,
production still will remain far below the 2014 RFS of 1.75 Bgal/yr (6.6 x10⁶
m3/yr) (Herndon, 2012).
The total capacity of all three stages of cellulosic ethanol plants listed in
Table 2 (Existing 20 MMgal/yr (75.7x10³ m3/yr), Under Construction 104 Mgal/yr (394 x103 m3/yr), and Proposed Plants 368 Mgal/yr [1.4 x10⁶ m3/yr])
would yield an estimated maximum production rate total of 492 Mgal/yr (1.9 x10⁶ m3/yr) at some future date. As a theoretical exercise, the production rate
of 492 Mgal/yr (1.9 x10⁶ m3/yr) of cellulosic ethanol if attained by 2017,
would greatly improve U.S. capacity, however, it would make up only 11% of the 5.5 Bgal/yr (20.8 x10⁶ m3/yr), which is specified in the 2017 RFS listed in
Table 1. Additionally, until an established cellulosic ethanol plant has been
fully operational, production costs, operational and maintenance requirements, and environmental impacts will not be known (Herndon, 2012;
Shaffer, 2012; Ethanol Producers Digest, 2013).
The cellulosic ethanol production requirement of the RFS presents a great commercial challenge. This is largely due to the fact that the development of
a new industry based on cutting-edge research is a complex matter, and the
associated timelines are difficult to predict. Additionally, the cost of an average size cellulosic ethanol plant of 20 to 25 Mgal/yr (75.7 x10³ to
94.6x10³ m3/yr), can range from $200 to $250 million, a daunting investment
(Menetrez, 2012). Still, the RFS production standard represents an important national goal that encourages the development of additional sources of
renewable ethanol and bio diesel. While the cellulosic ethanol industry
111

Menetrez / Biofuel Research Journal 4 (2014) 110-122
Please cite this article as: Menetrez M.Y. Meeting the U.S. renewable fuel standard: a comparison of biofuel pathways. Biofuel Research Journal 4 (2014)
110-122.
.
establishes itself, the RFS goal illustrated in Table 1, continues to climb with
each year. The development of additional renewable fuel sources seems
necessary to achieve the 2022 RFS goal of producing a total of 36 Bgal/yr
(136 x106 m3/yr) of renewable fuel.
3. Biofuel production pathways
The following discussion of biofuel pathways illustrated in Figure 1,
compares the parallel nature of biofuel production. The extraction of oils and
sugars from a large variety of feedstocks can be utilized for final product
development. The production of biofuel can be accomplished using different organisms and processes while producing a range of end products. Out of the
many variables, process scenarios were chosen to serve as examples of
possible pathways for the production of biofuel (Fig. 1). The pathways chosen represent ideal, but realistic alternatives. The generation of
ethanol was
diagramed by autotrophic algae pathways, taking into consideration both
direct generation and indirect generation through the conversion of carbohydrates (Andersen and Andersen, 2006; Shen et al., 2009).
The generation of biodiesel was diagramed by way of autotrophic and
heterotrophic algae as well as agricultural grain oils and recycled vegetable oils (Chisti, 2007; Gouveia et al., 2009; Meng et al., 2009).
The generation of biofuels is often referred to as first or second (also
known as advanced) generation. First generation biofuels are derived from the sugars or vegetable oils from grown crops, such as corn, sugar cane or
rapeseed oil, palm oil. These feedstocks can easily be converted into ethanol
or biodiesel. However, second generation biofuels are made from cellulosic feedstock or woody crops, agricultural or municipal waste which are
comparatively more involved to convert into sugars or oils. Once extracted,
these sugars and oils can also be converted into ethanol and biodiesel, as depicted in Figure 1.
Biofuels, such as biodiesel, ethanol, and various petroleum products, can
be produced by a large variety of biologically-dependent processes (Menetrez, 2012). Both natural and genetically modified organisms (GMOs)
(algae, bacteria, fungi, and yeast) have been used to generate biofuels directly
or indirectly by producing biofuel intermediate products such as oil,
Table 2.
Renewable Fuel Projections (Public Law 110–140, 2007; Thompson et al., 2010; Environmental News Service, 2011; RFS Renewable Fuels Association, 2012).
Plants Location Feedstock Capacity Mgal/yr (x10
6m
3/yr)
Existing Plants
American Process Inc/Alpena Biorefinery Alpena MI Wood Sugars 0.8 (3.0)
BP Biofuels Demonstration Plant, Jennings LA Energy Grasses 1.4 (5.3)
DupontDanisco Cellulosic Ethanol LLC Vonore TN Corn Stover, Switchgrass 0.3 (1.0)
Enerkem Inc. Westbury QC Treated Wood 1.0 (3.8)
Fiberight Demonstration Plant Lawrenceville VA MSW 0.5 (1.9)
Fiberight Blairstown LLC Blairstown IA MSW 6.0 (22.7)
ICM Inc. Pilot Integrated Cellulosic Bio St. Joseph MO Corn fiber, switchgrass 0.3 (1.2)
Indian River Bioenergy Center Vero Beach FL Veg., Agric Waste, MSW 8.0 (30.3)
Iogen Inc. Ottawa ON Straw 0.5 (2.0)
Mascoma Corporation Rome NY Woody Biomass 0.2 (0.8)
Western Biomass Energy, LLC Upton WY Cellulosic 0.5 (1.9)
ZeaChem Boardman Biorefinery LLC Boardman OR Poplar 0.3 (1.0)
Total 19.8 (74.8)
Plants Under Construction
Abengoa Bioenergy Biomass Hugoton KS Corn Stover, Switchgrass 25.0 (94.6)
American Process Inc. Demonstration Plant Thomaston GA Sugarcane bagasse, wood 0.3 (1.1)
Blue Fire Renewable LLC Fulton MS Wood Waste 19.0 (71.9)
DupontDanisco Cellulosic Ethanol LLC Nevada IA Corn Stover 30.0 (113.6)
Enerkem Alberta Biofuels LP Edmonton AB Sorted MSW 10.0 (37.9)
Freedom Pines Biorefinery Soperton GA Woody Biomass 2.0 (7.6)
Poet-DSM Advanced Biofuels LLC Emmetsburg IA Corn Stover 20.0 (75.7)
Quad County Cellulosic Ethanol Plant Galva IA Corn Fiber 2.0 (7.6)
Woodland Biofuels Inc SarniaON Canada Wood Waste 0.5 (2.0)
Total 108.8 (411.9)
Proposed Plants
Advanced Biofuels Corp Moses Lake WA Cellulose 6 (22.7)
Agresti LLC Pikeville KY MSW 20 (75.7)
Atlantic Ethanol Inc. Providence RI Wood Waste 10 (37.9)
Canergy LLC Brawley CA Energy cane 25 (94.6)
Chemtex International Inc., Project Alpha Clinton NC Energy Grasses 20 (75.7)
Enerkern Mississippi Biofuels LLC Pontotoc MS RDF, Wood residue 10 (37.9)
Enerkern Green Field Varennes QC RDF, C&D debris 10 (37.9)
Fulcrum BioEnergyInc.Sierra Biofuels McCarran NV RDF 10 (37.9)
Mascoma Corporation Drayton Valley AB Hardwood 20 (75.7)
Mascoma Corp/Frontier Renewable Res. Kinross MI Hardwood 20 (75.7)
Mendota Bioenergy LLC Tranquility CA Energy beets 1 (3.8)
Nipawin Biomass Ethanol Co-operative Nipawin SK Waste Wood, Straw 26 (98.4)
Sunset Ethanol Inc Fernley NV Switchgrass, Sorgum 5 (18.9)
The Green Fuel Association Bieber II Bieber CA Switchgrass 40 (151.4)
The Green Fuel Association Corning II Corning CA Switchgrass 40 (151.4)
The Green Fuel Association Dorris II Dorris CA Switchgrass 40 (151.4)
Woodland Biofuels Inc. Newton Falls NY Wood Waste 20 (75.7)
World Ethanol Institute, LLC Lenox GA Paulownia 20 (75.7)
ZeaChem Boardman Biorefinery LLC Boardman OR Poplar, Straw 25 (94.6)
Total 368 (1393)
112

Menetrez / Biofuel Research Journal 4 (2014) 110-122
Please cite this article as: Menetrez M.Y. Meeting the U.S. renewable fuel standard: a comparison of biofuel pathways. Biofuel Research Journal 4 (2014)
110-122.
.
carbohydrates, and sugars or enzymes (Briggs, 2004;
Hu et al., 2006; Becker,
2007; Li et al., 2007; Adams, et al., 2008; Evangelista et al., 2008; Graham et al., 2008; Hu et al., 2008; Lundquist et al., 2010; González-
Fernández et al.,
2011; Venkata Mohan et al., 2011; Menetrez, 2012).
The composition of many dry mass plant feedstocks (corn kernels, corn stover, switchgrass, poplar hybrid) commonly used for biofuel generation can
vary (Table 3). Carbohydrates are either soluble sugars (made of glucose,
sucrose, or fructose), or storage carbohydrates (composed of starch or fructans) (Sukenik et al., 1991; Burkholder, 1998; American Heritage, 2005;
Dien et al., 2006; Dien and Bothast, 2009; Gao et al., 2010; U.S. Department
of Agriculture, 2011; U.S. Department of Agriculture, 2012).
Table 3.
Constituents of plant feedstock biomass by % of dry matter (Dien et al., 2006; Dien and
Bothast, 2009).
Constituent
Corn kernels
Corn stover
Switchgrass
Poplar hybrid
Either Ext. (nonpolar)
4.6
4.6
1.0
4.2
Protein
9.1
4.0
3.2
1.2
Starch
72.0
0.0
3.9
0.0
Cellulose
2.0
36.0
28.3
42.4
Hemicellulose
3.6
23.4
24.5
19.0
Klasonlignon
trace
18.6
15.4
25.7
Ash
1.5
12.5
5.4
1.8
Fig.1. Biofuel Pathways (conventional bioethanol, cellulosic bioethanol, autotrophic and heterotrophic algae)
.
113

Menetrez / Biofuel Research Journal 4 (2014) 110-122
Please cite this article as: Menetrez M.Y. Meeting the U.S. renewable fuel standard: a comparison of biofuel pathways. Biofuel Research Journal 4 (2014)
110-122.
.
4. Ethanol pathway
As apposes to ethanol derived from a petrochemical process, biologically derived ethanol sometimes referred to as bioethanol (the word ethanol is used
in this paper), is a renewable fuel. Ethanol is an alcohol obtained from the
fermentation of sugars and starches or by chemical synthesis. All four of the feedstocks shown as column headings in Table 4 can be processed to yield
simple sugars and ultimately ethanol. Ethanol is used as a solvent,
disinfectant, and as an additive to or replacement for petroleum-based fuels (American Heritage, 2005). Ethanol made from any sources (such as ethylene,
algae, or cellulose) is identical to ethanol from other sources, such as corn
starch, sugar, or sugarcane. An advantage that ethanol has over petroleum sources is that it can be produced from diverse renewable raw materials that
are abundant. As mentioned above, U.S. ethanol production is currently at 15
Bgal/yr (56.8 x10⁶ m3/yr) from corn, and the U.S. Department of Energy (DOE) and the U.S. Department of Agriculture (USDA) are supporting the
development of ethanol production from cellulosic feedstocks (plant
materials, such as wood and switchgrass) (Demain et al., 2005; Perlack et al., 2005; U.S. Dept. Of Agric., 2000, 2005, 2006; U.S. Dept. Of Energy, 2004,
2007a, 2007b; Donner et al., 2008; Farrell and Morris, 2008; National
Research Council, 2008; Tannura et al., 2008). Ethanol production in the U.S. relies almost completely on sugar-platform
feedstocks in the form of corn, and it consumes approximately one-third of
the U.S. corn harvest, of which one-third is converted into distillers grains with solubles (DDGS) (Monceaux, 2011; Schroeder, 2003). The DDGS
protein content (20 to 30%) has increased by a factor of three from the
original corn grain and is a valuable byproduct ($208-327/ton [$0.29-0.36/kg] when dehydrated to 100% DW) used for animal feed (Schroeder, 2003;
Monceaux, 2011; Broderick, 2013).
As of June 2012 the price of one bushel of corn (kernels) was $6.04/bu, ($171.40/m3) and the price of ethanol was $2.14/gal ($0.57/L) (Parker, 2012a,
b). At the yield of 2.32 gal/bu (17.4 L/m3) (low) to 2.93 gal/bu (21.9 L/m3)
(high) the conversion of one bushel (0.035m3) of corn will yield from $4.95 to $6.26 worth of ethanol at a cost per gallon (3.79 L) of $2.06 to $2.60 (Haefele
and Ross, 2009; Parker, 2012b). The feedstock to product price straddles the
break-even point, ranging from a loss of $0.08/gal ($0.02/L) to a profit of $0.46/gal ($0.12/L). The actual cost of production will vary for each plant,
dependent on staff, operating and maintenance cost and financial
commitments which are specific for the plant, but would be expected to raise cost and lower profit. Additionally, the renewable identification number
(RIN) (see RIN section below) value to the manufacturer will vary and is also
variable, but could add substantially to profits. Actual profitability would be affected by all factors which are beyond the capability of this paper. A
number of examples of corn and ethanol prices are included in Table 4, to
exemplify the variability and marginal profitability of the corn based ethanol industry. The trend of decreasing corn prices from Feb. to Aug. 2013 has
created a favorable economic climate for ethanol producers despite the
fluctuation in ethanol prices.
Table 4.
Corn feedstock to ethanol profit/loss ($/bu or $/m3) (Haefele and Ross, 2009).
The sale of DDGS, and corn oil (used for biodiesel) can account for 25%
additional revenues (3 to 4 cents/gal (0.8 to 1 cents/L) ethanol assuming a 0.3
lb/bu (4.8gm/m3) corn press yield) (Emberland, 2013). Incentives such as tax subsidies, and the revenues from the RIN mechanism created by the 2007
Energy Independence and Security Act can also improve profitability (RIN
values are discussed in more detail below, which as of May 2013 had a value of $0.79, approximately three to four times the profit margin) (Parker, 2013c,
d). The profitability of producing corn-based ethanol is subject to the dictates
of market volatility. The prices of corn, ethanol, and petroleum based products change daily, as do the opening and closing of ethanol
manufacturing plants (Gaub, 2013; Parker 2013a). These factors create a
difficult and unstable position for ethanol manufacturers that are saddled with enormous investments, long-term commitments, and ever increasing
competition for feedstocks.
The trend from 2012 to 2014 as shown in Table 4, has seen corn prices decrease from $8.07 to $3.30 per bu ($0.23 to $0.09/L) and ethanol prices
raise from $2.14 to $3.57 per gal ($0.57 to $0.94/L), and produced an increase
in profits from near zero to between $2.45 to $2.15 per gallon ($0.65 to $0.57/L). During this same period, petroleum prices have decreased to
approximately $91 per barrel and correspondingly, gasoline has decreased to
less than the price of ethanol (Marketwatch, 2014). Over the two year period decreasing gasoline prices have absorbed what was initially the blending of
ethanol from a less-expensive constituent to a cost addition. However
temporary, this exemplifies the nature of fluctuating market pressures. Climate change has brought about higher temperatures, droughts and
floods, all of which contribute to lower yields of corn and higher prices. The
marginal success of ethanol production from corn is likely to continue to vary with time, which emphasizes the need for using co-production techniques,
such as using cellulosic corn stover and grass to produce ethanol. It also
makes it clear why it is important to locate feed-lots that use DDGS near corn-based ethanol plants.
In addition to using corn to produce ethanol, a large variety of other types
of biomass can be used, including cellulosic biomass, which has already been mentioned, and feedstocks that can be used to produce ethanol. Feedstocks
that are high in carbohydrates (starches and sugars) are barley, cassava, sugar
cane, sugar beet, sorghum, bagasse, grain, potatoes, sweet potatoes, sunflowers, fruit, molasses, and wheat. These feedstocks can be processed
(using naturally occurring amylase enzymes to hydrolyze carbohydrates) to
yield simple sugars (similar to other sugar platform processes). Subsequently, Saccharomyces cerevisiae (Brewer‟s yeast) can be used to convert these
sugars to ethanol (Monceaux, 2009). In addition, many types of algae produce
carbohydrates that could contribute significantly to the production of ethanol (Chisti, 2007; Mabee et al., 2011).
Carbohydrate containing feedstocks are milled and liquified into a mash or
slurry, or they are pressed to yield a liquid (syrup) that has a high sugar content, and this syrup is cooked until it is gelatinous, after which it
undergoes enzymatic hydrolyesis using the enzyme glucoamylase
(Monceaux, 2009). The yeast S. cerevisiae is added to this sugar rich
Date
Corn Price $/bu ($/m
3)
Ethanol Price
$/gal ($/L)
Feedstock to Ethanol
High to Low Yield $/bu ($/m
3)
Range of Profit/Loss
High to Low Yield $/bu ($/m3)
6/2012
6.04 (171.40)
2.14 (0.57)
2.06 to 2.60 (58.46 to 73.78)
0.08 to -0.46 (2.27 to -13.05) a
8/2012
8.07 (229.00)
2.63 (0.70)
2.75 to 3.48 (78.04 to 98.75)
-0.12 to -0.85 (-3.41 to -24.12)b
1/2013
6.86 (194.67)
2.21 (0.58)
2.34 to 2.96 (66.40 to 84.00)
-0.13 to -0.75 (-3.69 to -21.28)c
2/2013
6.90 (195.80)
2.36 (0.62)
2.35 to 2.97 (66.69 to 84.28)
0.01 to -0.61 (0.28 to -17.31)d
4/2013
6.59 (187.00)
2.42 (0.64)
2.25 to 2.84 (63.85 to 80.59)
0.17 to -0.42 (4.82 to -11.92)e
5/2013
6.37 (180.76)
2.52 (0.67)
2.17 to 2.75 (61.58 to 78.04)
0.35 to -0.23 (9.93 to -34.90) f
7/2013
4.89 (138.76)
2.23 (0.60)
1.67 to 2.11 (47.39 to 59.88)
0.56 to 0.12 (15.89 to 3.41)g
8/2013
4.69 (133.09)
2.18 (0.58)
1.60 to 2.02 (45.40 to 57.32)
0.58 to 0.16 (16.46 to 4.54)h
9/2014
3.30 (93.64)
3.57 (0.94)
1.12 to 1.42 (31.78 to 40.30)
2.45 to 2.15 (69.52 to 61.01) i
a Parker,2012b
b Parker,2012c
c Parker, 2013a
d Parker, 2013b
e Parker, 2013c
f Parker, 2013d
g Parker, 2013e
h Parker, 2013f
i AAA Fuel Gauge Report, 2014
114

Menetrez / Biofuel Research Journal 4 (2014) 110-122
Please cite this article as: Menetrez M.Y. Meeting the U.S. renewable fuel standard: a comparison of biofuel pathways. Biofuel Research Journal 4 (2014)
110-122.
.
mixture, and the fermentation process produces ethanol and carbon dioxide
(CO2). The fermented mash contains 10 to 20 vol% ethanol and is heated to
82 to 84 ºC in a distillation process (Actual vaporization points of the constituents of the process are; methanol [wood alcohol], 64 ºC; ethanol 78
ºC; water 100 ºC) (Monceaux, 2009). Distillation of the mash and the
following distillations strip the ethanol into a condensate that contains 95 vol % ethanol. Further heating of the remaining solids evaporates water from the
mixture and produces either stillage, DDGS, or a syrup-like solution,
depending on the original feedstock (Monceaux, 2009). A comparison of alternative feedstocks by unit mass (such as ton per unit ton) that is required
to produce the same unit of mass of ethanol (i.e., a ton equivalent is
approximately 304 gal [1,150 L] of ethanol) is provided in Table 5, along with the amounts of input water and output byproducts.
An ethanol production strategy should take into account feedstock
availability, feedstock cost, processing cost, ethanol yield, process efficiency, and the sales prices of ethanol and byproducts of the process. Implicit to each
stage is the cost of transportation, i.e., transporting corn to the plant and
transporting ethanol and DDGS out of the plant. Transportation costs are significant, and they must be taken into account during the planning stage
when making decisions concerning the location of the plant. One example of
minimizing transportation costs is the location of animal feedlots near corn based ethanol plants to accommodate the large amounts of DDGS. The cost of
producing feedstock and its availability are of great importance to the long-
term sustainability of the plant. Securing a stable, long-term supply of cellulosic feedstock or algae
biomass feedstock is also of eminent importance and is uniquely difficult.
The growth requirements for the production of feedstock can be effected by many factors, such as climate, seasonal variations and environmental
limitations, which can limit or preclude growth in some areas or make it
economically infeasible to transport the product. The importance of acquiring a dependable supply of feedstock is emphasized by the cost required to
construct a plant, which was $250 million in the case of the Project Liberty
plant (Shaffer, 2012).
5. Cellulose to ethanol pathway
Milling and pretreatment (milling, including steam explosion, pH
adjustment and enzymatic hydrolysis saccharification) of cellulosic, hemicellulosic and lignocellulosic feedstocks, such as those in Table 4, can
generate sugars. Feedstocks that have demonstrated the ability to produce
various sugars from cellulose are corn stover, switchgrass, miscanthus, straw, hemp, cotton, and kena. In addition, ethanol can be produced from a variety
of cellulosic waste materials, such as paper and cardboard municipal waste
and agricultural and wood products (Dien and Bothast, 2011; Mabee et al., 2011; Monceaux, 2009). These feedstocks can be processed using naturally
occurring enzymes derived either from biological interaction directly with the
substrate feedstock or from a biological process that has harvested the enzyme and made it available for the cellulosic process. This processing yields simple
sugars, i.e., the six carbon sugars D-glucose, fructose, and sucrose, and five
carbon sugar D-xylose (Monceaux, 2009; Dien and Bothast, 2011). Then the slurry that results from the processing contains the sugars that are required to
undergo fermentation with S. cerevisiae in a manner that is similar to that of other biologically induced processes (Olsson and Hahn-Hägerdal, 1996;
Palmqvist and Hahn-Hägerdal, 2000; De Maagd et al., 2001; Kuiper, 2001;
Letourneau, 2003; High, 2004; Iogen Technology, 2005; U.S. EPA, 2008). Several processes commonly use both natural organisms and varieties of
GMOs such as the fungus Trichoderma reesei for producing commercial
cellulases (cellulose specific enzymes), which are used to convert cellulosic biomass to sugar (Palmqvist and Hahn-Hägerdal, 2000; U.S. EPA, 2008; Dien
and Bothast, 2009). Other biologically dependent cellulosic processes use
various types of fungi and bacteria (including GMO varieties) to produce cellulase, xylanase, and hemicellulase enzymes for the feedstocks listed in
Table 4 to produce fermentable sugars, which may then be used to produce
cellulosic ethanol (Palmqvist and Hahn-Hägerdal, 2000; U.S. Environmental Protection Agency, 2008; U.S. Department of Agriculture, 2013). After the
process has yielded five and/or six carbon sugars, processing continues
through yeast fermentation and distillation, similar to any other carbohydrate rich feedstock, to generate ethanol.
Generating ethanol from cellulosic feedstocks involves processes that are
similar to, but uniquely different from generating ethanol from other
feedstocks. For example, converting corn to sugar is inherently different from converting corn stover to sugar, however, the conversion of sugar to ethanol
is similar to that in other processes. A comparison of feedstocks and their
resource and footprint requirements for ethanol production are discussed below and listed in Tables 5 and 6.
Table 5.
Ethanol production process – mass of input feedstock required per unit mass of ethanol product
produced and equivalent mass of byproduct output (i.e. ton of feedstock/ton of ethanol)
(Monceaux, 2009).
Feedstock
Alternatives
Input
Materials
Feedstock
and H2O
Input
Water
input/unit
ethanol
Output
DDGS
DDGS
and stillage
Output
Stillage
output/unit ethanol
Corn kernels (maize)
3.08
0.98
0.99 -
Suger cane juice
14.41
0.0
-
11.98 ( biomass)
Wheat
3.34
1.81
1.32
-
Barley
4.03
2.89
2.0
-
Rye
3.72
2.57
1.7
-
Grain sorghum
3.05
1.64
1.04
-
Cassava chips
2.77
5.94
-
6.07 ( land application)
Potatoes
10.80
8.71 (recycle)
1.25 (cake)
-
Sugar beet syrup
3.42
0.0
0.49 (syrup)
-
Cellulosic processes must deal with the mass and volume of the feedstock
which are larger than most commonly used feedstocks such as corn. As listed
in Table 6, one ton of ethanol (303.8 gal or 1,150 L) would require three tons of corn, or up to 10 tons (9,072 kg) of corn stover (U.S. Department of
Energy, 2007b; Dien and Bothast, 2009; Monceaux, 2011).
Process
estimations predict that a 20 Mgal/yr (75,708 m3) plant using energy grasses, such as switchgrass and miscanthus, will require approximately 300,000 to
600,000 tons per year (272.2 x10⁶
to 544.3 x10⁶ kg) of feedstock delivered by
100 trucks per day. The location of the plant will impact the mean truck-route for the incoming feedstock, but transportation costs remain largely unknown,
and they include the cost of transporting the outgoing waste solids, which are
likely to contain large quantities of lignin. Lignin is commonly used for heating, or converted to liquid fuel by thermochemical processing (Dien and
Bothast, 2009; Pedroso et al., 2011).
Techniques for producing ethanol from cellulosic materials are currently being
applied to industrial scale plants. The techniques that use corn stover,
such as the Project Liberty plant, depend indirectly on the continued success of the corn ethanol industry. Although
this industry is likely to continue, it
should be recognized that this dependence brings with it inherent instabilities
due to varying economic condition. There is little doubt that the success of the cellulosic ethanol industry is vital to the future of renewable energy
(Menetrez, 2010). However, until industrial
plants, such as the Project Liberty
plant, have established a history of proven success, the viability of this industry will remain in question. Therefore, it also is necessary to explore the
potential of other forms of ethanol production.
6. Algae ethanol pathway
Development of the algae biofuel industry has the potential to generate a
variety of fuels. Commercial facilities that produce algae exist worldwide,
and they are used predominantly for manufacturing food, cosmetics, and health-related products, not biofuel. Commercial enterprises have invested
heavily and established industrial-scale, micro-algae farms that have the
potential to bring algae to a stage similar to that of cellulosic ethanol (Menetrez, 2012; Milledge, 2001). These commercial processes use a variety
of technologies, produce many different products, and usually are located in
the lower latitudes of the U.S., where temperature, climate, and solar irradiance are favorable for the growth of algae.
115

Menetrez / Biofuel Research Journal 4 (2014) 110-122
Please cite this article as: Menetrez M.Y. Meeting the U.S. renewable fuel standard: a comparison of biofuel pathways. Biofuel Research Journal 4 (2014)
110-122.
.
Algae can be used to produce ethanol and biodiesel in ponds that are open
to the atmosphere [i.e. shallow ponds or tanks that can be circular or parallel raceway ponds (PRPs)] or in closed photobioreactors (PBRs). Most of the
cultivation of algae is done in PRPs because of their low construction and
operating costs (Briggs, 2004; Li et al., 2007; Venkata Mohan et al., 2007a,b Evangelista et al., 2008; Graham et al., 2008; González- Fernández et al.,
2011). PBRs are contained, closely controlled systems in which an ideal
environment is maintained to ensure high and stable production levels of algae (Chisti, 2007; Hu et al., 2006; 2008). Algae require water, efficient
exposure to light, carbon dioxide, optimal temperature, culture density,
appropriate pH levels, and a reasonable mixing regime. The most significant
advantage that closed PBRs have over open PRPs is the ability to eliminate
the introduction of unwanted microorganisms. Controlling contamination is
necessary to achieve a stable, optimum culture and maximum yield. PBRs are often utilized for growing pure inoculant populations of microalgae in the
early stages of the process for supplying large open, raceway, paddle wheel
mixed pond PRPs where high growth rate cultivation can occur (Rosenberg et al., 2008; Lundquist, 2010).
Forms of cyanobacteria, commonly known as blue-green algae (including
GMO varieties such as those harbouring genes from
Zymomonas mobilis), can
manufacture ethanol within the microalgae cell and (lacking true cell
membranes) diffuse it into the culture media and headspace. Using a unique
autotrophic PRP, CO2
and inorganic nutrients such as those found in wastewater, ethanol can be synthesized, concentrated and recovered directly
from the PRP (Badger, 2002; Demain et al., 2005; U.S. DOE, 2008; Algenol,
2011; Snow and Smith, 2012). Algenol Biofuels in cooperation with Dow
Chemical Company, the Linde Group, the National Renewable Energy
Laboratory (NREL), Georgia Institute
of Technology, and Membrane
Technology and Research, Inc., is in the process of developing an operational
pilot-scale plant that uses this technology (Deng et al., 1999; Algenol, 2011).
Algae can produce substantial concentrations of lipids which can be used
to produce biodiesel, jet-fuel and other petroleum products; as well as carbohydrates which can be processed into ethanol; and proteins (such as
Spirulina maxima which is composed of 60-71% protein content) with high
nutritional quality that commonly are used for human and animal consumption (Dien et al., 2006). Microalgal preparations are commonly
marketed as health food, cosmetics, and animal feed (Dien et al., 2006;
Becker, 2007; Adams et al., 2009; Dien et al., 2009). The potential value of algae‟s co-products is evident when comparing the protein content to that of
other biofuel feedstocks such as corn kernels, which contains 9.1% protein
(used as distillers grains with solubles or DDGS), corn stover which contains
4% protein, switchgrass which contains 3.2% protein, and a hybrid Poplar at
1.2% protein (Dien et al., 2006; Dien et al., 2009).
7. Algae biodiesel pathway Biodiesel is a renewable fuel that is currently produced from various
feedstocks, such as, soybean oil (90% of current production), recycled vegetable oil, sunflower oil, canola oil, cottonseed oil, animal fats, and lipids
produced by algae (Chisti, 2007; Gouveia et al., 2009; Meng et al., 2009).
Lipids are long carbon-chain molecules that serve as a structural component of the membrane of the algal cell. The lipid production of algal species varies
from 20% to 80% DW. In addition, temperature, solar irradiance, the species-
specific speed of growth and process time, and the manipulation of nutrients supplied per stage of growth can all affect lipid yield (Becker, 2007; Adams,
et al., 2008; Gouveia, et al., 2009; Wageningen University, 2011). Becker
(2007) listed the lipid, carbohydrate and protein constituents of 17 common algal species, and they are presented in Table 3. Algae that belong to several
different families possess the ability to produce and accumulate a large
fraction of their dry mass as lipids. As listed in Table 3, autotrophic lipid production from the algae Botryococcus braunii
can produce 86% DW of
lipid (oil) that can be separated and converted to
biodiesel (Chisti, 2007;
Gouveia et al., 2009; Meng et al., 2009; Chisti, 2013).
Biodiesel is defined as a mono-alkyl ester of a long-chain fatty acid that
conforms to the American Society for Testing and Materials (ASTM) D6751
specifications for use in diesel engines (ASTM D6751 – 12, 2013). After
extraction and separation, algae oil is processed into biodiesel by either of two
process methods. In the classical method, the oil is mixed with an alcohol
(usually methanol) and a basic catalyst (usually potasium hydroxide (KOH),
or sodium ethanolate (CH3COONa) and heated to approximately 70 °C (at 20
psi) for several hours in a process called transesterification. The products are biodiesel (67%) and glycerol (33%) (Chisti, 2007; Coppola et al., 2009;
Gouveia et al., 2009; Meng et al., 2009).
In the second method, the oil and alcohol are mixed with the enzyme
lipase, which can be produced from a number of organisms, such as the
fungus Metarhizium anisopliae,
Aspergillus oryzae (and
A. niger)
or a
varieties of Gram-negative bacteria, i.e. Chromobacterium viscosum,
causing
transesterification at room temperature (Adachi et al, 2011; Fiametti et al.,
2011; Foley et al., 2011; Talukder, 2011). Energy consumption for producing
biodiesel is reduced in the enzyme method, and the process is made more energy efficient and less sensitive to process problems (Lam and Lee, 2011).
In addition, this process has other advantages such as; creating a high-grade
glycerin byproduct with improved value, reduced water consumption (less water washing), and reduced methanol consumption. There are no caustic
catalysts used, no soap formed and no ion exchange, or adsorbents are used
(Piedmont Biofuels, 2013).
The enzyme cost of $0.15/gal ($0.04/L) of processed biodiesel is currently outweighed by the positive attributes of the
process (Piedmont Biofuels, 2013; AAA Daily Fuel Gauge Report, 2014).
Table 6.
Ethanol production – mass of feedstock input required per equal ton mass of ethanol produced (303.8 gal [1150 L] @ $2.63/gal [$0.69/L] = $800.00), and acres/ton (m2/kg) C2H5OH.
Feedstock Alternatives and Ethanol Yield Intake feedstocks (mass/mass) Footprint required [acres/ton (m2/kg)]
Corn kernels (154 bu/acre or 1.34 m3/km
2 maize, 39.4 bu/ton or 1.5 L/kg) 3.08
b 0.75 (3.35)
g
Wheat (70 bu/acre, or 609 L/km2, 62 lb/bu or 0.8 kg/L) 3.34
b 1.80 (8.03)
h
Barley (72 bu/acre, or 626 L/km2, 48 lb/bu or 0.6 kg/L) 4.03
b 2.33 (10.39)
i
Rye (12 bu/acre, or 104 L/km2, 56 lb/bu or 0.7 kg/L) 3.72
b 4.74 (21.14)
j
Potatoes (401 bu/acre, or 3,488L/km2, 52 lb/bu or 0.7 kg/L) 10.80
b 1.04 (4.64)
j
Sugar beet (SB) root (30 ton SB/acre, or 6.7 kg/m2) 12.323
c 0.379 (1.69)
c
Sugar cane (SC) stalk (36 ton/acre SC or 8.1kg/m2) 13.54
c 0.372 (1.66)
c
Grain sorghum (1.83 ton/acre or 0.4 kg/m2) 3.05
b 1.67 (7.45)
j
Sweet sorghum stalk (39 ton/acre SSS or 8.7 kg/m2)* 21.30
c 0.548 (2.44)
c
Switchgrass (4.6 ton/acre, or 1.0 kg/m2 non-irrigated) 5-10
d 0.3-1 (1.34-4.46)
d,k,l
Corn Stover (80 gal/ton, 0.16 L/kg byproduct) 5-10 d 0**
Microalgae (30% yield DW by PBR, 23.85 ton/acre, or 5.3 kg/m2carbohydrate, byproduct)
a 2.5
e,f 0***
Microalgae (7,000gal/acre or 6,546 L/km2 by PBR) in situ 0.044 (0.195)
m
*Based on two crops per year
** Byproduct of corn kernels ***
Byproduct of microalgae oil production
a Chisti, 2007
b Monceaux, 2009 c
Amorim, 2009 d
Dien and Bothast, 2009 e Kim et al., 2011
f Lee et al., 2011
g Haefele and Ross, 2009
h Kansas Wheat Harvest Reports, 2012 i USDA, 2012
j USDA, 2011 k Pedroso et. al., 2011
l Mononoa et al., 2012
m Algenol, 2013
116
Menetrez / Biofuel Research Journal 4 (2014) 110-122
Please cite this article as: Menetrez M.Y. Meeting the U.S. renewable fuel standard: a comparison of biofuel pathways. Biofuel Research Journal 4 (2014)
110-122.
.
As of 2012, biodiesel manufacturers in North Carolina were paying the
sources of yellow grease, such as restaurants, as much as $1.50/gal ($0.40/L)
(U.S. Energy Information Administration, 2012a; Piedmont Biofuels, 2013). Yellow grease is the preferred, economical choice, although limited in
quantity, and corn oil, soybean oil and canola oil are additional feedstocks
being used (U.S. Energy Information Administration. 2012a,b,c; Piedmont Biofuels, 2013). If algae derived oil is to be economically successful, it must
be produced and supplied at a price approaching $1.50/gal ($0.40/L). With
the inclusion of transportation costs (which can vary greatly) and overall processing costs a gallon of B100 biodiesel can be produced for
approximately $3.00 to $3.10 ($0.79 to $0.82/L) (Piedmont Biofuels, 2013).
Comparing this price to petroleum-based diesel (of approximately $4.00/gal or $1.06/L) indicates an approximate profit of $1.00/gal ($0.26/L).
The profitable nature of using yellow grease for biodiesel has allowed
small plants to survive, but their production of biodiesel is limited by the supply of recycled cooking oil. There also are major biodiesel plants in
operation, such as the Louis Dreyfus Agricultural Industries plant in
Claypool, IN, which produces 80 Mgal/yr (0.3 x10⁶ m3) from soybean oil (Biodiesel Industry Directory, 2013). A biodiesel plant under construction by
Archer Daniels Midland in Lloydminster, AB, Canada, will produce 265
Mgal/yr (1.0 x10⁶ m3) from canola oil (Biodiesel Industry Directory, 2013). When the Lloydminster plant becomes operational, it will yield more than
double the output of any other plant. This scale of operation will ensure that
overall profitability is sustainable even though the profit per gallon will be less due to the high cost of the feedstock oil. It is not clear whether the plant
will satisfy the process-dependent RFA requirement for advanced biofuel of
50% GHG emission reduction. The RFA qualification could affect RIN applicability and further marginalize profits.
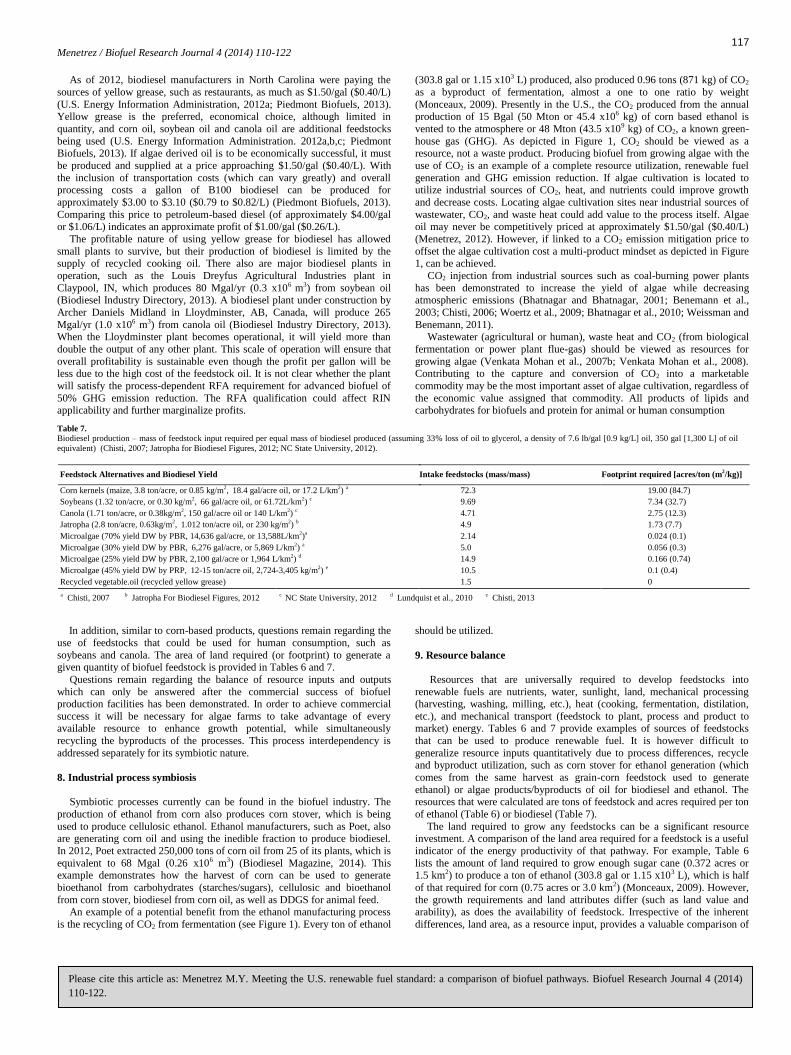
In addition, similar to corn-based products, questions remain regarding the
use of feedstocks that could be used for human consumption, such as
soybeans and canola. The area of land required (or footprint) to generate a given quantity of biofuel feedstock is provided in Tables 6 and 7.
Questions remain regarding the balance of resource inputs and outputs
which can only be answered after the commercial success of biofuel production facilities has been demonstrated. In order to achieve commercial
success it will be necessary for algae farms to take advantage of every available resource to enhance growth potential, while simultaneously
recycling the byproducts of the processes. This process interdependency is
addressed separately for its symbiotic nature.
8. Industrial process symbiosis
Symbiotic processes currently can be found in the biofuel industry. The
production of ethanol from corn also produces corn stover, which is being
used to produce cellulosic ethanol. Ethanol manufacturers, such as Poet, also are generating corn oil and using the inedible fraction to produce biodiesel.
In 2012, Poet extracted 250,000 tons of corn oil from 25 of its plants, which is
equivalent to 68 Mgal (0.26 x10⁶ m3) (Biodiesel Magazine, 2014). This example demonstrates how the harvest of corn can be used to generate
bioethanol from carbohydrates (starches/sugars), cellulosic and bioethanol
from corn stover, biodiesel from corn oil, as well as DDGS for animal feed. An example of a potential benefit from the ethanol manufacturing process
is the recycling of CO2 from fermentation (see Figure 1). Every ton of ethanol
(303.8 gal or 1.15 x10³ L) produced, also produced 0.96 tons (871 kg) of CO2
as a byproduct of fermentation, almost a one to one ratio by weight
(Monceaux, 2009). Presently in the U.S., the CO2 produced from the annual production of 15 Bgal (50 Mton or 45.4 x10⁶ kg) of corn based ethanol is
vented to the atmosphere or 48 Mton (43.5 x10⁹ kg) of CO2, a known green-
house gas (GHG). As depicted in Figure 1, CO2 should be viewed as a resource, not a waste product. Producing biofuel from growing algae with the
use of CO2 is an example of a complete resource utilization, renewable fuel
generation and GHG emission reduction. If algae cultivation is located to utilize industrial sources of CO2, heat, and nutrients could improve growth
and decrease costs. Locating algae cultivation sites near industrial sources of
wastewater, CO2, and waste heat could add value to the process itself. Algae oil may never be competitively priced at approximately $1.50/gal ($0.40/L)
(Menetrez, 2012). However, if linked to a CO2 emission mitigation price to
offset the algae cultivation cost a multi-product mindset as depicted in Figure 1, can be achieved.
CO2 injection from industrial sources such as coal-burning power plants
has been demonstrated to increase the yield of algae while decreasing atmospheric emissions (Bhatnagar and Bhatnagar, 2001; Benemann et al.,
2003; Chisti, 2006; Woertz et al., 2009; Bhatnagar et al., 2010; Weissman and
Benemann, 2011). Wastewater (agricultural or human), waste heat and CO2 (from biological
fermentation or power plant flue-gas) should be viewed as resources for
growing algae (Venkata Mohan et al., 2007b; Venkata Mohan et al., 2008). Contributing to the capture and conversion of CO2 into a marketable
commodity may be the most important asset of algae cultivation, regardless of
the economic value assigned that commodity. All products of lipids and carbohydrates for biofuels and protein for animal or human consumption
should be utilized.
9. Resource balance
Resources that are universally required to develop feedstocks into
renewable fuels are nutrients, water, sunlight, land, mechanical processing (harvesting, washing, milling, etc.), heat (cooking, fermentation, distilation,
etc.), and mechanical transport (feedstock to plant, process and product to market) energy. Tables 6 and 7 provide examples of sources of feedstocks
that can be used to produce renewable fuel. It is however difficult to
generalize resource inputs quantitatively due to process differences, recycle and byproduct utilization, such as corn stover for ethanol generation (which
comes from the same harvest as grain-corn feedstock used to generate
ethanol) or algae products/byproducts of oil for biodiesel and ethanol. The resources that were calculated are tons of feedstock and acres required per ton
of ethanol (Table 6) or biodiesel (Table 7).
The land required to grow any feedstocks can be a significant resource investment. A comparison of the land area required for a feedstock is a useful
indicator of the energy productivity of that pathway. For example, Table 6
lists the amount of land required to grow enough sugar cane (0.372 acres or 1.5 km2) to produce a ton of ethanol (303.8 gal or 1.15 x10³ L), which is half
of that required for corn (0.75 acres or 3.0 km2) (Monceaux, 2009). However,
the growth requirements and land attributes differ (such as land value and arability), as does the availability of feedstock. Irrespective of the inherent
differences, land area, as a resource input, provides a valuable comparison of
Table 7.
Biodiesel production – mass of feedstock input required per equal mass of biodiesel produced (assuming 33% loss of oil to glycerol, a density of 7.6 lb/gal [0.9 kg/L] oil, 350 gal [1,300 L] of oil
equivalent) (Chisti, 2007; Jatropha for Biodiesel Figures, 2012; NC State University, 2012).
Feedstock Alternatives and Biodiesel Yield Intake feedstocks (mass/mass) Footprint required [acres/ton (m
2/kg)]
Corn kernels (maize, 3.8 ton/acre, or 0.85 kg/m2, 18.4 gal/acre oil, or 17.2 L/km
2)
a 72.3 19.00 (84.7)
Soybeans (1.32 ton/acre, or 0.30 kg/m2, 66 gal/acre oil, or 61.72L/km
2)
c 9.69 7.34 (32.7)
Canola (1.71 ton/acre, or 0.38kg/m2, 150 gal/acre oil or 140 L/km
2)
c 4.71 2.75 (12.3)
Jatropha (2.8 ton/acre, 0.63kg/m2, 1.012 ton/acre oil, or 230 kg/m
2)
b 4.9 1.73 (7.7)
Microalgae (70% yield DW by PBR, 14,636 gal/acre, or 13,588L/km2)
a 2.14 0.024 (0.1)
Microalgae (30% yield DW by PBR, 6,276 gal/acre, or 5,869 L/km2)
a 5.0 0.056 (0.3)
Microalgae (25% yield DW by PBR, 2,100 gal/acre or 1,964 L/km2)
d 14.9 0.166 (0.74)
Microalgae (45% yield DW by PRP, 12-15 ton/acre oil, 2,724-3,405 kg/m2)
e 10.5 0.1 (0.4)
Recycled vegetable.oil (recycled yellow grease) 1.5 0
a Chisti, 2007
b Jatropha For Biodiesel Figures, 2012
c NC State University, 2012
d Lundquist et al., 2010
e Chisti, 2013
117

Menetrez / Biofuel Research Journal 4 (2014) 110-122
Please cite this article as: Menetrez M.Y. Meeting the U.S. renewable fuel standard: a comparison of biofuel pathways. Biofuel Research Journal 4 (2014)
110-122.
.
renewable fuels. Tables 6 and 7 were developed to approximate the land
resource requirement that was sufficient to produce enough feedstock to
produce one ton of fuel (ethanol in Table 6: biodiesel in Table 7). Each intake of feedstock material or area of land listed in Tables 6 and 7 can produce a
ton of ethanol or biodiesel respectively (Kansas Wheat Report 2012; USA
Biodiesel Prices.com, 2012; U.S. Energy Information Administration, 2012b). Commodity prices of corn, ethanol, biodiesel, petroleum, and petroleum-
based diesel are constantly changing based on global economic conditions
and forces. As mentioned above, every ton of corn based ethanol (303.8 gal or 1.15
x103 L) produced, also produced 0.96 tons (871 kg) of CO2 as a byproduct of
fermentation (Monceaux, 2009). The U.S. production of 15 Bgal (50 Mton or 45.4 x10⁶ kg) of corn based ethanol produced an average 48 Mton (43.5 x10⁶
kg) of CO2. The biomass of microalgae contains approximately 50% carbon,
which is obtained from the atmosphere or other sources of CO2. The injection of the additional carbon in the form of CO2 has demonstrated an increase in
algae yield while sequestering the carbon (Benemann, 2003; Weissman and
Benemann, 2003; Chisti, 2006; Menetrez, 2012). Theoretically, applying the yearly rate of CO2 production to growing algae could produce 26 Mtons (23.6
x106 kg) of algae biomass (assuming 1.83 tons CO2 per ton algae biomass),
which could be converted into biofuel, such as; 10 Mtons (9.1 x 10⁶ kg) of algae crude oil, or 6.5 Mgal (24,603 m3) of biodiesel (assuming a 40% DW
yield, and 95% separation recovery) (Christi, 2007). A substantial goal of
sustainable biofuel generation (considering the present biodiesel production level is 1Bgal/yr or 3.8 x10⁶ m3), and a substantial displacement of a GHG
which is currently being vented to the atmosphere. There are multiple
advantages to both the CO2 supplier (for resource recycling) and the algae/biofuel industry (for growth enhancement by CO2 sequestration). This
algae pathway could be promoted through RIN additions for both sides to
offset additional costs. In order to achieve a cost-efficient biofuel process, using waste products,
such as wastewater or CO2 emissions, and using land that has marginal
agricultural potential should be priorities. It is understood that the availability of land, CO2 and nutrient rich wastewater can be a difficult set of assets to
find. However, it is important that every attempt at economic advantages be
made, especially in the initial phase of industrial start-up. In addition, the use of byproducts and recycled materials should be an immediate or planned
priority. The footprint of byproducts such as corn stover or algae
carbohydrate (after lipid extraction) was listed as zero due to it not being a primary or virgin product. In each of these examples the footprint was listed
for the primary product corn kernels and algae oil for biodiesel production
(see Table 7). Eventually, the economic feasibility will be decided by the site plan (combining wastewater, CO2, and land resources) the process plan, and
operational success (including transporting resource inputs and outputs, and
containing potential contaminants). Table 6 lists two sources of ethanol produced from microalgae. The first
example utilizes PBR technology as a byproduct after the lipid fraction has
been removed, while the second uses a PRP system. Although PRP algae cultivation is the economical choice for biodiesel production purposes, PBR
cultivation is required for the direct production of algae to ethanol as
currently employed by Algenol. PBR technology is often used in hybrid PBR/PRP systems for biodiesel production. PBR systems are also used in
pilot scale CO2 capture systems. Often considered to be “niche systems” the importance of carbon capture could increase its future importance beyond
biofuel production.
A form of marine algae (Laminaria japonica) contains hydrolysate solids comprised of up to 31.0% mannitol and 7.0% glucose. GMO Escherichia coli
(KO11) can be used to convert the mannitol and glucose to ethanol, producing
about 0.4 g of ethanol per gram of carbohydrate (Kim et al., 2011). Another form of marine algae, Chlorella vulgaris was used by Lee et al. (2011) to
produce ethanol with a pretreatment of GMO E. coli (strains W3110, and
SJL2526), achieving 0.4 g ethanol/g biomass (Lee et al., 2011). These are two examples of unique processes which utilize marine algae with high sugar
contents in combination with GMO strains of E. coli that are able to produce
ethanol at a high efficiency. Although feedstock availability may be a limiting factor, these processes illustrate an innovative approach to using many forms
of algae.
Numerous species of microalgae can be used to produce lipids, proteins and carbohydrates. One such algae, Prymnesium parvum, produces
approximately equal portions of lipids, proteins and carbohydrates, i.e., about
33% of each. For the purpose of generating the numbers listed in Tables 6 and
7, the yield from algae cultivation would agree with that measured from the
growth of P. parvum. In this example, the primary product was lipids, while carbohydrates were listed as a secondary byproduct. Actual yields will depend
on the specific microalgae and the conditions of the process. Recycled
vegetable oil is listed as having a footprint of zero (similar to the byproducts listed in Table 6) due to it not being a primary and virgin product. The
production of one ton of biodiesel (263.0 gal [995 L] at a density of 7.6 lb/gal
[0.9 kg/L]) would require 2,666 lb (1,209 kg) of oil (350 gal [1,300 L] of oil, assuming a loss of approximately 33% to glycerol).
The versatility of algae for producing lipids, carbohydrates, and proteins
will be needed to create multiple products in multiple markets to satisfy economic considerations successfully. Currently, biotechnology firms and the
algae industry are focused on producing relatively low volumes of high-value
products, such as pharmaceuticals or nutritional supplements. These same industries must refocus on high volumes of biofuel production at low
competitive prices, as well as utilizing byproducts, such as protein for DDGS
and carbohydrates for ethanol (Gladue and Maxey, 1994; Unkefer et al., 2004; Foley et al., 2011; Mononoa et al., 2012).
The cultivation of algae requires nutrients that can be accessed by using
various wastewater streams, including water from the same recycled streams. It also requires heat for temperature control, which can be obtained from
sunlight (when clouds are absent, and sunlight is abundant), industrial waste
heat, or geothermal sources. In addition, algae can be utilized simultaneously for both the lipids (to produce biodiesel) and carbohydrates (to produce
ethanol).
10. Renewable identification number (RIN)
The renewable identification number (RIN) mechanism created by the 2007 Energy Independence and Security Act documents the production of
biofuel at refineries by registering every gallon (3.79 L) of biofuel that is
produced. The assigned RIN value also reflects the energy content of the biofuel (Table 8). Corn based ethanol is issued a RIN of 1 which as of May
2013 had a value of $0.79, and by July 17 2017 had risen to $1.43, much
greater than the profit margin (Haefele et al., 2009; Parker, 2012a,b,c; Emberland, 2013; Parker, 2013a,b,c,d,e).
One gallon of biodiesel derived from oil from grown and pressed feedstock
(such as soybean-based biodiesel) or recycled cooking oil (yellow grease) is issued a RIN of 1.5, and as of July 17 2013 had a RIN value of $1.30 (Parker,
2013b). Advanced biofuels, such as cellulosic ethanol (produced from
biomass such as corn stover or switchgrass), are issued a RIN of 2.5 (Weihrauch, 2007; Weisner, 2009). The EPA sets a yearly quota which
dictates the amount of biofuel blended into petroleum based transportation
fuel. Refiners, importers and blenders must comply to their EPA assigned RFS quota. The biofuel manufacturer registers every gallon produced with the
EPA at the time of sale, transfer, or export/import for the purpose of ensuring
that the biofuel is actually blended into motor fuel. The ethanol or biodiesel company issues the RIN for a month‟s production of biofuel, and this RIN is
reported to EPA using a unique, 38 character number (Weihrauch, 2007).
The RIN values are transferred with the biofuel to the purchaser (refiners, exporter, importers, and blenders of the fuel). Eventually, the bioethanol is
blended into gasoline (E10, E15, E25 E85, E100), and the biodiesel is blended into petrodiesel (B2, B5, B10, B20, B100) (Weihrauch, 2007;
Weisner, 2009).
Table 8.
Energy content of transportation fuels (Weihrauch, 2007; Consumer Energy Report, 2013;
Zfacts, 2013).
Fuel Btu/gal (Btu/L) Etoh /Fuel Ratio RIN
Ethanol (E100) 76,000 (2,008) 1 1
Biodiesel (B100) 118,296 (3,125) 0.655 Etoh/Gasoline 1.5
Gasoline 116,090 (3,067) 0.642 Etoh/Biodiesel 0.0
Cellulosic Ethanol 76,000 (2,008) 1 2.5
During economic periods in which blending biofuel is unprofitable, the
RINs can be separated from the fuel and used as a commodity on the open
market (Weihrauch, 2007; Weisner, 2009). During those years in which
118

Menetrez / Biofuel Research Journal 4 (2014) 110-122
Please cite this article as: Menetrez M.Y. Meeting the U.S. renewable fuel standard: a comparison of biofuel pathways. Biofuel Research Journal 4 (2014)
110-122.
.
more ethanol is produced than is set by the RFS, RINs can accumulate for up
to one year, as noted by the expiration dates. Blenders with excess RINs can
sell them to other blenders to be used as the market dictates (Weihrauch, 2007; Weisner, 2009; Wall Street Journal, 2013).
From manufacturing to blending and consumption, a RIN documents the
compliance of the biofuel blenders with the RFS mandates of 2005 (Thompson et al., 2010). The buying, selling, and trading (swapping) of RINs
in the marketplace is a complex undertaking, because it is influenced by
market trends, agricultural fluctuations and regional needs (Weihrauch, 2007; Weisner, 2009). An example of the volatility of this system is seen in the
three month variation in the corn grain RIN (D6), changing from $1.44 on
July 16, 2013 to $0.675 on August 9, 2013, a 76.5 cent decrease (Platts McGraw Hill Financial, 2013). As described above, the economic position
held by the biofuel industry is one of marginal profitability. The RIN system
could lend a degree of flexibility to survive unfavorable economic periods, but market influences have demonstrated the vulnerability of the present
system (Emery, 2012). A more complete discussion of the RIN system is
beyond the scope of this paper.
11. Land requirement
The efficiency of algae to produce ethanol and biodiesel listed in Tables 6
and 7 were used to calculate the area of land required per billion gallons of
biofuel (see Table 9). Depending on the efficiency of the process and overall yield, each billion gallons of ethanol would require a commitment of 175
miles2 (453 km2) to produce. Similarly, each billion gallons of biodiesel
would require from 107 to 741 miles2 (277 to 1,919 km2) to produce (a wide range of variation). This range represents the collective area which would be
dedicated to algae cultivation for the primary purpose of biofuel production.
Although the dedication of this much land area to algae cultivation is significant, it is less than any other feedstock by at least an order of
magnitude.
Actual sites may vary in size, efficiency, capacity and purpose. An
example of a dual purpose algae production facility might have a primary purpose of using algae to reduce CO2 emissions produced by coal-fired power
plants. In addition to emissions from the combustion of coal, natural gas, and petroleum products, carbon capture to removal CO2 with algae cultivation can
be applied to many additional commercial sources such cement
manufacturing and biological fermentation. In these examples reducing CO2 emissions is the primary purpose, while the production of biofuels is integral
but secondary.
12. Conclusion
Currently, biofuel production in the U.S. is limited to approximately 15 Bgal/yr (56.8 x10⁶ m3/yr) of corn, based ethanol and 1 Bgal/yr (3.8 x10⁶
m3/yr) of biodiesel (derived mainly from recycled vegetable oil). Feedstock
limitations, i.e., sources of oil, are expected to limit the expansion of biodiesel production. Efforts are being made to quickly develop a cellulosic ethanol
industry in the U.S. However, the development of this new (and largely
unproven) industry with high investment requirements ($200 to $250 million for a plant that produces 20-25 Mgal/yr [75.7 x10³ -94.6 x10³ m3]) and large
resource needs is not likely to occur rapidly. As of early 2014, the industrial
cellulosic ethanol plants in operation have a combined capacity of 19.75
Mgal/yr (74.8 x10³ m3/yr) (listed in Table 2), more than triple the 2013
capacity of 6.25 Mgal/yr (23.7 x10³ m3/yr), but far below the 2014 RFS of 1.75 Bgal/yr (6.6 x10⁶ m3/yr). Additionally, if 2014 is as successful as
anticipated, the Abengoa Bioenergy plant (25 Mgal/yr [94.6 x10³ m3]), Poet-
DSM plant (20 Mgal/yr [75,708 m3]) and Dupont Danesco plant (30 Mgal/yr [113.6 x10³ m3]) will start production. With the addition of these three
cellulosic ethanol plants the total capacity will exceed 100 Mgal/yr (378.5
x103 m3), approximately five times the 2014 capacity, another major increase which falls far short of the RFS.
Many efforts are being made in the U.S. to develop cellulosic ethanol as an
integral contributor to biofuels. Although numerous cellulosic ethanol plants are anticipated to initiate operation, the actual gap between available
commercial supply and the RFS demand is widening. The 2022 RFS of 36
Bgal (136 x106 m3) of total biofuel is a difficult goal to achieve, specifically due to the timeline necessary for the development of the cellulosic ethanol
industry. It is for this reason that additional advantages should be created
which promote other sources of transportation fuels, among them, algae biofuel which are highly flexible in process requirements and versatile in
product output. Examples of advantages to promote algae biofuel production
are: (1) Incentives to carbon capture processes by algae cultivation through the use of increased RIN values; and (2) Similarly, increased RIN values to
algae derived biofuels produced through wastewater reclamation.
Potential pathways for producing biofuels from algae were evaluated for their feedstock and footprint demands. The present focus of the existing algae
industries is on producing low volumes of high-value products for
pharmaceuticals or nutritional supplements. There also are many developmental efforts backed by significant financial resources that are
focused on the production of large volumes of biofuel products. However,
little information regarding the present status of these process operations has been made available.
The RFS is a guidance tool for the commercial production of a new
generation of renewable biofuels (biodiesel, bioethanol, and petroleum). These sustainable energy sources contribute to our energy needs much like
other established technologies such as solar, wind, and geothermal sources. Currently, the development of cellulosic and algae feedstocks for biofuel
production has great potential to help diminish our dependence on petroleum-
based fuels. The versatility of algae to produce multiple products in multiple markets is unique. The established focus of the algae industry to produce low
volumes of high-value products (for pharmaceuticals or nutritional
supplements) is evolving. There are many efforts backed by significant financial resources that are focused on the production of large volumes of
biofuel products. The biofuel industry is young and growing quickly, it is
hoped that this paper can provide a basis for the development of guidance that will assist this industry in growing in an environmentally friendly manner.
References
AAA Daily Fuel Gauge Report, 2014. Available at
http://fuelgaugereport.aaa.com. (accessed on 28 November 2014). Adachi, D., Hama, S., Numata, T., Nakashima, K., Ogino, C., Fukuda, H.,
Kondo, A., 2011. Development of an Aspergillus oryzae whole-cell
Table 9.
Microalgae Ethanol/Biodiesel production footprint, acres/Bgal (km2/m
3) from Tables 6 and 7.
Acres/ton (m2/kg) Acres/Bgal (km
2/m
3)
Ethanol Ethanol
Microalgae (30% yield DW by PBR, byproduct) a 0.0* 0.0*
Microalgae (7,000gal/acre, or 6,547 L/km2 by PBR)
b 0.044(48.4) 142,800 (152.8)
Biodiesel Biodiesel
Microalgae (70% yield DW by PBR, 14,636 gal/acre, or 13,588 L/km2)
a 0.024 (26.4) 68,570 (73.4)
Microalgae (30% yield DW by PBR, 6,276 gal/acre, or 5,869 L/km2)
a 0.056 (61.6) 160,000 (171.2)
Microalgae (25% yield DW by PBR, 2,100 gal/acre, or 1,964 L/km2)
c 0.166(182.6) 474,286 (507.5)
Microalgae (45% yield DW by PRP, 12-15 ton/acre oil, or 2,724-3,405 km/m2)
c 0.1 (11.0) 285,714 (305.7)
* Recycled Byproduct
a Chisti, 2007
b Algenol Biofuel, 2011
c Chisti, 2013
119

Menetrez / Biofuel Research Journal 4 (2014) 110-122
Please cite this article as: Menetrez M.Y. Meeting the U.S. renewable fuel standard: a comparison of biofuel pathways. Biofuel Research Journal 4 (2014)
110-122.
.
biocatalyst coexpressing triglyceride and partial glyceride lipases for
biodiesel production. Bioresour. Technol. 102, 6723-6729.
Adams, J.M., Gallagher, J.A., Donnison, I.S., 2009. Fermentation study on Saccharina latissima for bioethanol production considering variable pre-
treatments. J. Appl. Phycol. 21, 569-574.
Algenol Biofuels, 2011. Available at http://www.algenolbiofuels.com. (accessed on 28 November 2014).
Amorim, H.V., Basso, L.C., and Lopes, M.L. 2009. Sugar cane juice and
molasses, beet molasses and sweet sorghum: Composition and usage, in: Ingledew, W.M., The Alcohol Textbook: A reference for the beverage,
fuel, and industrial alcohol industries. Lallemand Ethanol Technology. 1,
39-46. American Heritage, 2005. Science Dictionary, copyright by Houghton Mifflin
Company, Published by Houghton Mifflin Company. pp. 217.
Andersen, T., Andersen, F.O., 2006. Effects of CO2 concentration on growth of filamentous algae and Littorella uniflora in a Danish softwater lake.
Aquat. Bot. 84, 267-271.
ASTM D6751 – 12, 2013. Standard Specification for Biodiesel Fuel Blend Stock (B100) for Middle Distillate Fuels. Available at
http://www.astm.org/Standards/D6751.htm. (accessed on 28 November
2014). Badger, P.C., 2002. Ethanol from cellulose: A general review, in: Trends in
New Crops and New Uses, ed. J. Janick and A. Whipkey, ASHS Press,
Alexandria, VA, 17–21. Badger, P.C., 2002. Ethanol from cellulose: A general review. Trends in new
crops and new uses. 17-21.
Becker, E.W., 2007. Micro-algae as a source of protein. Biotechnol. Adv. 25, 207–210.
Benemann, J., Pedroni, P.M., Davison, J., Beckert, H., Bergman, P., 2003.
Technology Roadmap for Biofixation of CO2 and Greenhouse Gas Abatement with Microalgae, Second National Conference on Carbon
Sequestration. Available at http://www.netl.doe.gov/publications/
proceedings/03/carbon-seq/PDFs/017.pdf. (accessed on 28 November 2014).
Bhatnagar, A., Bhatnagar, M., 2001. Strategies to employ algae and
cyanobacteria for wastewater remediation, in: Maheshwari, D.K., Dubey, R.C. (Eds.), Innovative Approaches in Microbiology. Bishen Singh
Mahendra Pal Singh, Dehra Dun, India, 379-403.
Bhatnagar, A., Bhatnagar, M., Chinnasamy, S., Das, K.C., 2010. Chlorella minutissima - a promising fuel alga for cultivation in municipal
wastewaters. Appl. Biochem. Biotechnol. 161, 523-536.
Biodiesel Industry Directory, 2013. Available at http://store.bbiinternational.com/2012-Biodiesel-Industry-Directory-
P9.aspx. (accessed on 28 November 2014).
Biodiesel Magazine, 2013. Twenty-five poet plants extract enough corn oil for 68 Mgal/yr of biodiesel, Poet, Available at
http://www.biodieselmagazine.com/articles/8912/25-poet-plants-extract-
enough-corn-oil-for-68-mmgy-of-biodiesel. (accessed on 28 November 2014).
Biomass Magazine, 2014. The Year is Here, visited 2014. Available at
http://www.biomassmagazine.com/articles/10086/the-year-is-here. (accessed on 28 November 2014).
Briggs, M., 2004. Widescale Biodiesel Production from Algae. University of New Hampshire.
Broderick, S., 2013. DDGS export demand driving prices for now. Ethanol
Producers Magazine. Burkholder, J.M., 1998. Implications of harmful microalgae and heterotrophic
dinoflagellates in management of sustainable marine fisheries. Ecol. Appl.
8(sp1), S37-S62. Chisti, Y., 2006. Microalgae as sustainable cell factories. Environ. Eng.
Manage. J. 5, 261-274.
Chisti, Y., 2007. Biodiesel from microalgae. Biotechnol. Adv. 25, 294-306. Chisti, Y., 2013. Raceways-based production of algal crude oil. Green. 3(3-4),
195-216.
Consumer Energy Report, 2013. Available at http://www.energytrendsinsider.com/2006/03/28/biodiesel-king-of-
alternative-fuels. (accessed on 28 November 2014).
Coppola, F., Simoncini, E., Pulselli, R.M., Brebbia, C.A., Tiezzi, E., 2009. Bioethanol potentials from marine residual biomass: an Emergy evaluation.
Ecosyst. Sustain. Dev. VII. 379-387.
Crickmore, N., 1998. Revision of the nomenclature for the Bacillus
thuringiensis pesticidal crystal proteins. Microbiol. Mol. Biol. Rev. 62,
807-813. De Maagd, R.A., Bravo, A. and Crickmore, N., 2001. How Bacillus
Thuringiensis Has Evolved Specific Toxins to Colonize the Insect World.
Trends Genet. 17, 193-199. Demain, L.D., Newcomb, M., and Wu, J.H., 2005. Cellulase, Clostridia and
Ethanol. Microbiol.Mol. Biol. Rev. 69(1), 124-154.
Deng, M.D., Coleman, J.R., 1999. Ethanol synthesis by genetic engineering in cyanobacteria, Appl. Environ. Microbiol., 65(2), 523-528.
Dien, B.S., Bothast, R.J., 2009. A primer for lignocellulose biochemical
conversion to fuel ethanol, in: Ingledew, W.M. (Eds.), The Alcohol Textbook. Nottingham University Press, Nottingham, U.K. Available at
http://www1.eere.energy.gov/biomass/feedstock_databases.html. (accessed
on 28 November 2014). Dien, B.S., Jungb, H-J.G., Vogelc, K.P., Caslerd, M.D., Lamb, J.F.S., Itena,
L., Mitchellc, R.B., and Sarathc, G., 2006. Chemical composition and
response to dilute-acid pretreatment and enzymatic saccharification of alfalfa, reed canarygrass, and switchgrass. Biomass Bioenergy. 30, 880-
891.
Donner, S.D., and Kucharik, C.J., 2008. Corn-based ethanol production compromises goal of reducing nitrogen export by the Mississippi River.
Proc. Natl. Acad. Sci. U.S.A. 105(11), 4513-4518.
Emberland, P., 2013. Corn oil adds significant profitability to ethanol. Ethanol Producers Magazine, Benchmarking Business Analyst,
Christianson and Associates.
Emery, T., 2012. Fraud Case Shows Holes in Exchange of Fuel Credits. The New York Times. Available at
http://www.nytimes.com/2012/07/05/us/biofuel-fraud-case-shows-weak-
spots-in-energy-credit-program.html. (accessed on 28 November 2014). Environmental News Service, 2011. Cellulosic Ethanol Production Far
Behind Renewable Fuel Standard, Washington, DC, (ENS) - The United
States is not likely to reach cellulosic ethanol production mandates. Available at www.ens-newswire.com/ens/oct2011/2011-10-11-093.html.
(accessed on 28 November 2014).
Ethanol Producers Digest, 2013. Ethanol Producers Magazine. BBI International, Grand Forks, North Dakota. Available at
www.ethanolroducer.com. (accessed on 28 November 2014).
Evangelista, V., Barsanti, L., Frassanito, A.M., Passarelli, V., Gualieri, P., 2008. Algal Toxins: Nature, Occurrence, Effect and Detection Proceedings
of the NATO Advanced Study Institute on Sensor Systems for Biological
Threats: The Algal Toxins Case. Pisa, Italy, ISBN: 978-1-4020-8479-9.
Farrell, J., and Morris, D., 2008. Rural Power, Community-Scaled Renewable
Energy and Rural Economic Development, New Rules Project.
Minneapolis, MN. Available at
http://www.newrules.org/de/ruralpower.pdf. (accessed on 28 November
2014).
Fiametti, K.G., Sychoski, M.M., De Cesaro, A., Furigo, A., Bretanha, L.C., Pereira, C.M.P., Treichel, H., de Oliveira, D., Oliveira, J.V., 2011.
Ultrasound irradiation promoted efficient solvent-free lipase-catalyzed
production of mono- and diacylglycerols from olive oil. Ultrason. Sonochem. 18(5), 981-987.
Foley, P.M., Beach, E.S., Zimmerman, J.B., 2011. Algae as a source of renewable chemicals: opportunities and challenges. Green Chem. 13(6),
1399-1405.
Gao, C., Zhai, Y., Ding, Y., Wu, Q., 2010. Application of sweet sorghum for biodiesel production by heterotrophic microalga Chlorella protothecoides.
Appl. Energy. 87, 756-761.
Gaub, A., 2013. Ethanol company slashes staff, production comes to halt, Casa Grande Dispatch. Available at
http://www.trivalleycentral.com/news_premium/ethanol-co-slashes-staff-
production-comes-to-halt/article_ee5f041e-6edd-11e2-b0ed-001a4bcf887a.html. (accessed on 28 November 2014).
Gladue, R.M., Maxey, J.E., 1994. Microalgal feeds for aquaculture. J. Appl.
Phycol. 6(2), 131-141.
González-Fernández, C., Molinuevo-Salces, B., García-González, M.C.,
2011. Nitrogen transformations under different conditions in open ponds
by means of microalgae–bacteria consortium treating pig slurry. Bioresour. Technol. 102(2), 960-966.
120

Menetrez / Biofuel Research Journal 4 (2014) 110-122
Please cite this article as: Menetrez M.Y. Meeting the U.S. renewable fuel standard: a comparison of biofuel pathways. Biofuel Research Journal 4 (2014)
110-122.
.
Gouveia, L., Marques, A.E., da Silva, T.L., Reis, A., 2009. Neochloris
oleabundans UTEX #1185: a suitable renewable lipid source for biofuel
production. J. Ind. Microbiol. Biotechnol. 36(6), 821-826. Graham, L.E., Graham, J.E., Wilcox, L.W., 2008. Algae, Benjamin-
Cummings Publishing, Menlo Park, CA, 2nd ed., ISBN: 0321559657.
Haefele, D.M., and Ross, A.J., 2009. Corn: Genetics, composition and quality, in: Ingledew W.M., The Alcohol Textbook. Lallemand Ethanol
Technology.
Herndon, A., 2012. Cellulosic Biofuel to Surge in 2013 as First Plants Open, Bloomberg. Available at http://www.bloomberg.com/news/print/2012-12-
11/cellulosic-biofuel-to-surge-in-2013-as-first-plants-open.html. (accessed
on 28 November 2014). High, S.M., Cohen, M.B., Shu, Q.Y. and Altosaar, I., 2004. Achieving
successful deployment of Bt rice. Trends Plant Sci. 9(6), 286-292.
Hu, Q., Sommerfeld, M., Jarvis, E., Ghirardi, M.. Posewitz, M., Seibert, M., Darzins, A., 2008. Microalgal triacylglycerols as feedstocks for biofuel
production: perspectives and advances. Plant J. 54(4), 621-639.
Hu, Q., Zhang, C., Sommerfeld, M., 2006. Biodiesel from algae: lessons learned over the past 60 years and future perspectives. Annual Meeting of
the Phycological Society of America, Juneau, AK, July 7-12, pp. 40-41.
Iogen Technology, 2005. Makes it Possible (Process Overview), Iogen. Available at http://www.iogen.ca/cellulose_ethanol/what_is_ethanol/
process.htm. (accessed on 28 November 2014).
Jatrophia for Biofuel, 2012. Figures, Look at the financial costs of commercial Jatrophia growing for Biodiesel. Available on
http://www.reuk.co.uk/Jatropha-for-Biodiesel-Figures.htm. (accessed on
28 November 2014). Kansas Wheat Harvest Reports, 2012. Kansas Wheat.
Kim, N.J., Li, H., Jung, K., Chang, H.N., Lee, P.C., 2011. Ethanol production
from marine algal hydrolysates using Escherichia coli KO11. Bioresour. Technol. 102(16), 7466-7469.
Kuiper, H.A., Kleter, G.A., Noteborn, H.P., Kok, E.J., 2001. Assessment of
the food safety issues related to genetically modified foods. Plant J. 27(6), 503-528.
Lam, M.K., Lee, K.T., 2011. Mixed methanol–ethanol technology to produce
greener biodiesel from waste cooking oil: a breakthrough for SO42−/SnO2–
SiO2 catalyst. Fuel Process. Technol. 92(8). 1639-1645.
Lee, S., Oh, Y., Kim, D., Kwon, D., Lee, C., Lee, J., 2011. Converting
Carbohydrates Extracted from Marine Algae into Ethanol Using Various Ethanolic Escherichia coli Strains. Appl. Biochem. Biotechnol. 164(6),
878-888.
Letourneau, D.K., Robinson, G.S. and Hagen, J.A., 2003. Bt crops: predicting effects of escaped transgenes on the fitness of wild plants and their
herbivores. Environ. Biosaf. Res. 2(04), 219-246.
Li, X, Xu, H., Wu, Q., 2007. Large-scale biodiesel production from microalga Chlorella protothecoides through heterotrophic cultivation in
bioreactors. Biotechnol. Bioeng. 98(4), 764-771.
Lundquist, T.J., Woertz, L.C., Quinn, N.W.T., and Benemann, J.R., 2010. A Realistic Technology and Engineering Assessment of Algae Biofuel
Production. Energy Biosci. Inst. 1.
Mabee, W.E., McFarlane, P.N., and Saddler, J.N., 2011. Biomass availability for lignocellulosic ethanol production. Biomass Bioenergy. 35(11), 4519-
4529. Marketwatch, 2014. Available at http://www.marketwatch.com/story/oil-
rebounds-on-positive-china-manufacturing-data-2014-09-23-1103542.
(accessed on 28 November 2014). McAloon, A., Taylor, F., Yee, W., Ibsen, K., Wooley, R., 2000. Determining
the cost of producing ethanol from corn starch and lignocellulosic
feedstocks. National Renew. Energy Lab. Rep. Menetrez, M.Y., 2010. The Potential Environmental Impact of Waste from
Ethanol Production. J. Air Waste Manage. Assoc. 60(2), 245-250.
Menetrez, M.Y., 2012. An Overview of Algae Biofuel Production and Potential Environmental Impact. Environ. Sci. Technol.46 (13), 7073-
7085.
Meng, X., Yang, J., Xu, X., Zhang, L., Nie, Q., Xian, M., 2009. Biodiesel production from oleaginous microorganisms. Renewable Energy. 34(1), 1-
5.
Milledge, J., 2011. Commercial application of microalgae other than as biofuels: a brief review. Rev. Environ. Sci. Biotechnol. 10(1), 31-41.
Monceaux, D.A., 2009. Alternative Feedstocks for fuel ethanol production,
in: Ingledew W.M., The Alcohol Textbook. Lallemand Ethanol
Technology. Mononoa, E.M., Nyrenb, P.E., Berti, M.T., Pryora, S.W., 2012. Variability in
biomass yield, chemical composition, and ethanol potential of individual
and mixed herbaceous biomass species grown in North Dakota. Ind. Crops Prod. 41, 331-339.
National Research Council, 2008. Water Implications of Biofuels Production
in the United States. National Academy Press, Washington, DC. NC State University A&T State University, Cooperative Extension, 2012.
Oilseed Crops for Biodiesel Production, Available at
http://www.extension.org/pages/28006/oilseed-crops-for-biodiesel-production. (accessed on 28 November 2014).
Olsson, L., and Hahn-Hägerdal, B., 1996. Fermentation of lignocellulosic
hydrolysates for ethanol fermentation. Enzyme Microb. Technol. 18(5), 312-331.
Palmqvist, E., Hahn-Hägerdal, B., 2000. Fermentation of lignocellulosic
hydrolysates. I : Inhibition and detoxification. Bioresour. Technol. 74(1), 17-24.
Parker, M., 2012a. Ethanol Rebounds from One-Week Low as Heat Threatens
Corn Crop. Bloomberg News. Available at http://www.businessweek.com/news/2012-05-23/ethanol-rebounds-from-
one-week-low-as-heat-threatens-corn-crop(accessed on 28 November
2014). Parker, M., 2012b. Ethanol Output in U.S. Rose to Three-Month High, Report
Shows. Bloomberg News. Available at
http://www.businessweek.com/news/2012-05-23/ethanol-output-in-u-dot-s-dot-rose-to-three-month-high-report-shows . (accessed on 28 November
2014).
Parker, M., 2012c. Ethanol Caps Biggest Monthly Gain Since 2008 on Higher Corn. Bloomberg News. Available at
http://www.businessweek.com/news/2012-07-31/ethanol-caps-biggest-
monthly-gain-since-2008-on-higher-corn. (accessed on 28 November 2014).
Parker, M., 2012d. Ethanol Falls Against Gasoline on Concern Margins to
Spur Output. Bloomberg News. Available at http://www.businessweek.com/news/2013-05-14/ethanol-falls-against-
gasoline-on-concern-margins-to-spur-output. (accessed on 28 November
2014). Parker, M., 2013a. Ethanol Stronger Against Gasoline as Shutdowns Curtail.
Bloomberg News. Available at http://www.businessweek.com/news/2013-
02-04/ethanol-stronger-against-gasoline-as-shutdowns-curtail. (accessed on 28 November 2014).
Parker, M., 2013b. Cellulosic biofuel RINs generated in June. Bloomberg
News. Available at http://www.ethanolproducer.com/articles/10095/cellulosic-biofuel-rins-
generated-in-june. (accessed on 28 November 2014).
Parker, M., 2013c. Ethanol Weakens Against Gasoline on Higher Inventory and Imports. Bloomberg News. Available at
http://www.businessweek.com/news/2013-01-22/ethanol-weakens-against-
gasoline-on-higher-inventory-and-imports. (accessed on 28 November 2014).
Parker, M., 2013d. Ethanol Weakens as Dry Midwestern Weather Boosts Corn Planting. Bloomberg News. Available at
http://www.bloomberg.com/news/2013-05-06/ethanol-weakens-as-dry-
midwestern-weather-boosts-corn-planting.html. (accessed on 28 November 2014).
Parker, M., 2013e. Ethanol‟s Discount to Gasoline Tightens on Lower
Stockpiles. Available at http://www.bloomberg.com/news/2013-08-05/ethanol-s-discount-to-gasoline-tightens-on-lower-stockpiles.html.
(accessed on 28 November 2014).
Pedroso, G.M., De Ben, C., Hutmacher, R.B., Orloff, S., Putnam, D., Six, J., van Kessel, C., Wright, S.D., Linquist, B.A., 2011. Switchgrass is a
promising, high-yielding crop for California biofuel. California Agric.
65(3):168-173. Perlack, R.D., Erbach, D.C.,Graham, R.L., Stokes, B.J., Turhollow, A.F.,
Wright, L.L., 2005. Biomass as Feedstock for a Bioenergy and Bioproducts
Industry: the Technical Feasibility of a Billion-Ton Annual Supply. Environmental Science Division, Oak Ridge National Laboratory.
121
Menetrez / Biofuel Research Journal 4 (2014) 110-122
Please cite this article as: Menetrez M.Y. Meeting the U.S. renewable fuel standard: a comparison of biofuel pathways. Biofuel Research Journal 4 (2014)
110-122.
.
Piedmont Biofuels, 2013. Enzymatic Biodiesel. Available at
http://www.biofuels.coop/wp-content/uploads/2011/01/2012-FAeSTER-
Letter1.pdf. (accessed on 28 November 2014). Platts McGraw Hill Financial, 2013. US RINs prices fall amid selloff, ending
six-session ascent. Available at http://www.platts.com/latest-
news/agriculture/houston/us-rins-prices-fall-amid-selloff-ending-six-session-21447191. (accessed on 28 November 2014).
Public Law 110-140-Dec. 19, 2007, 121 STAT. 1492, Energy Independence
and Security Act of 2007. Available at http://www.gpo.gov/fdsys/pkg/PLAW-110publ140/content-detail.html.
(accessed on 28 November 2014).
RFS Renewable Fuels Association, 2012. Renewable Fuels Standard. Available at http://www.ethanolrfa.org/pages/renewable-fuels-standard
(accessed on 28 November 2014).
Rosenberg J.N., Oyler GA, Wilkinson L., Betenbaugh M.J., 2008. A green light for engineered algae: Redirecting metabolism to fuel a biotechnology
revolution. Curr. Opin. Biotechnol. 19(5), 430-436.
Schroeder, J.W., 2003. Distillers Grains as a Protein and Energy Supplement for Dairy Cattle. NDSU Extension Service, AS-1241, North Dakota State
University, Fargo, North Dakota.
Shaffer, D., 2012. Poet breaks ground on cellulosic ethanol plant in Iowa, Star Tribune Updated. Available at
http://www.startribune.com/business/142515155.html. (accessed on 28
November 2014). Shen, Y., Pei, Z., Yuan, W., Mao, E., 2009. Effect of nitrogen and extraction
method on algae lipid yield. Int. J. Agric. Biol. Eng. 2(1), 51-57.
Snow, A.A., Smith, V.S., 2012. Genetically Engineered Algae for Biofuels: A Key Role for Ecologists. BioScience. 62(8), 765-768.
Sukenik, A., Levy, R.S., Levy, Y., Falkowski, P.G., Dubinsky, Z., 1991.
Optimizing algal biomass production in an outdoor pond: a simulation model. J. Appl. Phycol. 3(3), 191-201.
Talukder, M.R., Das, P., Shu Fang, T., Wu, J.C., 2011. Enhanced enzymatic
transesterification of palm oil to biodiesel. Biochem. Eng. J. 55(2), 119-122.
Tannura, M., Irwin, S., and Good, D., 2008. Are corn trend yields increasing
at a faster rate? Marketing and Outlook Briefs, Department of Agriculture and Consumer Economics, University of Illinois at Urbana-Champaign.
MOBR 08-02.
The Wall Street Journal, 2013. January 28, 2013, 7:06 P.M. ET Zero Dark Ethanol, Available at
http://online.wsj.com/article/SB1000142412788732432920457827004396
7301294.html?KEYWORDS=biofuel&mod=dist_smartbrief#printMode. (accessed on 28 November 2014).
Thompson, W., Meyer, S., Westhoff, P., 2010. The New Markets for
Renewable Identification Numbers. Appl. Econ. Perspect. Policy. 32(4), 588-603.
Unkefer P.J., Knight T.J., Martinez R.A., 2004. Use of prolines for improving
growth and other properties of plants and algae. U.S. Patent No. 6,831,040. USA Biodiesel Prices.com , 2012. Biodiesel Stations and Prices for the entire
US. Available on http://www.usabiodieselprices.com/. (accessed on 28
November 2014). U.S. Biodiesels Digest, 2011. US biodiesel production sets all-time record.
Available at http://www.biofuelsdigest.com/bdigest/2011/11/29/2011-us-biodiesel-production-sets-all-time-record/. (accessed on 28 November
2014).
U.S. Department of Agriculture, 2011. Principal Crops Area Planted and Harvested – States and United States: 2009-2011. Available at
http://usda01.library.cornell.edu/usda/current/CropProdSu/CropProdSu-01-
12-2012.pdf. (accessed on 28 November 2014). U.S. Department of Agriculture, 2012. Press Release, National Agricultural
Statistics Service, United States Department of Agriculture. Washington,
DC, Available at http://www.nass.usda.gov/Statistics_by_State/ Washington/Publications/Current_News_Release/wwhtaug.pdf. (accessed
on 28 November 2014).
U.S. Department of Agriculture, 2006. Rural Development. Section 9006, Renewable Energy Systems and Energy Efficiency Improvements
Program. (Available at http://www.farmenergy.org/ )
U.S. Department of Energy. Biomass Program Multi-Year Technical Plan. (Available at http://www1.eere.energy.gov/biomass/pdfs/mytp.pdf).
(accessed on 28 November 2014).
U.S. Department of Agriculture, 2013. Statement on the Detection of
Genetically Engineered Wheat in Oregon. Available at
http://www.usda.gov/wps/portal/usda/usdahome?contentid=2013/06/0127.xml. (accessed on 28 November 2014).
U.S. Department of Energy, 2004. Assumptions for the Annual Energy
Outlook, with Projections to 2025, Energy Information Administration, DOE/EIA-0554.
U.S. Department of Energy, 2007a. National Renewable Energy Laboratory
(NREL), Research Advances Cellulosic Ethanol, NREL/BR-510-40742. U.S. Department of Energy, 2007b. DOE Selects Six Cellulosic Ethanol
Plants for Up to $385 Million in Federal Funding, DOE Office of Public
Affairs, Washington, D.C. U.S. Department of Energy (DOE), 2008. Office of Science, Genomics: GTL
Systems Biology for Energy and Environment, Cellulosic Ethanol: Fuel
Ethanol Production. Available at http://genomicsgtl.energy.gov. (accessed on 28 November 2014).
U.S. Energy Information Administration, 2012a. Biodiesel Performance,
Costs, and Use. Available at http://www.eia.gov/oiaf/analysispaper/biodiesel/. (accessed on 28
November 2014).
U.S. Energy Information Administration, 2012b. Biodiesel demand estimates now provided in petroleum supply and demand balances. Available at
http://www.eia.gov/biofuels/biodiesel/production/table1.pdf. (accessed on
28 November 2014). U.S. Energy Information Administration, 2012c. Petroleum & Other Liquids,
Gasoline and Diesel Fuel Update, Sept. 17, 2012. Available at
http://www.eia.gov/petroleum/gasdiesel/. (accessed on 28 November 2014).
U.S. Environmental Protection Agency, 2008. Fact Sheet: Final Changes for
Certain Ethanol Production Facilities Under Three Clean Air Act Permitting Programs, EPA-HQ-OAR-2006-0089. Available at
http://www.epa.gov/nsr/fs20070412.html. (accessed on 28 November
2014). Venkata Mohan, S., Bhaskar, Y.B., Krishna, T.M., Chandrasekhara Rao, N.,
Lalit Babu, V., Sarma, P.N., 2007a. Biohydrogen production from
chemical wastewater as substrate by selectively enriched anaerobic mixed consortia: Influence of fermentation pH and substrate composition. Int. J.
Hydrogen Energy. 32(13), 2286-2295.
Venkata Mohan, S., Mohanakrishna, G., Raghuvulu, S.V., Sarma, P.N., 2007b. Enhancing biohydrogen production from chemical wastewater
treatment in anaerobic sequencing batch biofilm reactor (AnSBBR) by
bioaugmenting with selectively enriched kanamycin resistant anaerobic mixed consortia. Int. J. Hydrogen Energy. 32(15), 3284-3292.
Wageningen University, 2011. Research on microalgae within Wageningen
UR. Available at http://www.algae.wur.nl/UK/technologies/production/heterotrophic_organi
sms/. (accessed on 28 November 2014).
Wallace, R., Ibsen, K., McAloon, A., Yee, W., 2005. Feasibility Study for Co-Locating and Integrating Ethanol Production Plants from Corn Starch
and Lignocellulosic Feedstocks (Revised) (No. NREL/TP-510-37092).
National Renew. Energy Lab., Golden, CO (US). Weihrauch, J., 2007. Registration, Recordkeeping, and Reporting
Requirements [for RINs], U.S. EPA Office of Transportation and Air Quality. Presentation at a Renewable Fuels Standard Workshop, May 10,
2007.
Weissman, J.C., Benemann, J.R., 2003. Comparison of Marine Microalgae Culture Systems, Second National Conference on Carbon Sequestration.
Available at http://www.netl.doe.gov/publications/proceedings/03/carbon-
seq/PDFs/217.pdf. (accessed on 28 November 2014). Wisner, R., 2009. Renewable Identification Numbers (RINs) and Government
Biofuels Blending Mandates. AgMRC Renewable Energy Newsletter.
Woertz, I., Feffer, A., Lundquist, T., Nelson, Y., 2009. Algae grown on dairy and municipal wastewater for simultaneous nutrient removal and lipid
production for biofuel feedstock. J. Environ. Eng. 135(11), 1115-1122.
Zfacts, 2013. Available at http://zfacts.com/p/436.html. (accessed on 28 November 2014).
122