Embed Size (px)
Citation preview

Mechanisms of excitability in the central and peripheral nervous systems
Implications for epilepsy and chronic pain
JENNY TIGERHOLM
Akademisk avhandling som med tillstånd av Kungliga Tekniska högskolan framlägges
till offentlig granskning för avläggande av teknologie doktorsexamen i datalogi tisdag den 8 Maj 2012 klockan 10.00 i F3, Lindstedtsvägen 26,
Kungliga Tekniska högskolan, Stockholm.
ISRN KTH/CSC/A–12/01-SE TRITA-CSC-A 2012:02
ISSN-1653-5723 ISBN 978-91-7501-307-7
© Jenny Tigerholm, Maj 2012


iii
Abstract
The work in this thesis concerns mechanisms of excitability of neurons. Specif-ically, it deals with how neurons respond to input, and how their response iscontrolled by ion channels and other active components of the neuron. I havestudied excitability in two systems of the nervous system, the hippocampuswhich is responsible for memory and spatial navigation, and the peripheralC–fiber which is responsible for sensing and conducting sensory informationto the spinal cord.
Within the work, I have studied the role of excitability mechanisms in normalfunction and in pathological conditions. For hippocampus the normal functionincludes changes in excitability linked to learning and memory. However, italso is intimately linked to pathological increases in excitability observed inepilepsy. In C–fibers, excitability controls sensitivity to responses to stimuli.When this response becomes enhanced, this can lead to pain.
I have used computational modelling as a tool for studying hyperexcitabilityin neurons in the central nervous system in order to address mechanisms ofepileptogenesis. Epilepsy is a brain disorder in which a subject has repeatedseizures (convulsions) over time. Seizures are characterized by increased andhighly synchronized neural activity. Therefore, mechanisms that regulate syn-chronized neural activity are crucial for the understanding of epileptogenesis.Such mechanisms must differentiate between synchronized and semi synchro-nized synaptic input. The candidate I propose for such a mechanism is thefast outward current generated by the A-type potassium channel (KA).
Additionally, I have studied the propagation of action potentials in peripheralaxons, denoted C–fibres. These C–fibres mediate information about harmfulperipheral stimuli from limbs and organs to the central nervous system andare thereby linked to pathological pain. If a C–fibre is activated repeatedly,the excitability is altered and the mechanisms for this alteration are unknown.By computational modelling, I have proposed mechanisms which can explainthis alteration in excitability.
In summary, in my work I have studied roles of particular ion channels inexcitability related to functions in the nervous system. Using computationalmodelling, I have been able to relate specific properties of ion channels tofunctions of the nervous system such as sensing and learning, and in particularstudied the implications of mechanisms of excitability changes in diseases.
Keywords: Dendritic excitability, synchronized synaptic input, multicompart-ment model, epilepsy, axonal excitability, silent C–fibres, Hodgkin–Huxleydynamics, conduction velocity, KA


v
Acknowledgements
I consider myself privileged to have the opportunity to work with such intriguingprojects. I thank Erik Fransén (Supervisor) for his time, guidance, and encourage-ment. Our long meetings have been fruitful and enjoyable. I thank Anders Lansner(co–supervisor) for helping me see the wider picture and for constructive criticism.
I am grateful that Gilad Silberberg and Henrike Planert believed in my work andtested my modelling prediction. Their work gave my project a new dimension.
I want to thank Otilia Obreja, Angelika Lampert, Richard Carr, Martin Schmelzfor their constructive criticism which has been invaluable for my work.
Pradeep Krishnamurthy always put a smile on my face, which I am very gratefulfor. Our long discussions during lunches have helped me keeping my focus andperspective. The road to a PhD is bumpy and Malin Sandström has helped meavoid some of them.
I have received valuable comments on my thesis from Örjan Ekeberg, Svante An-dreen, Pradeep Krishnamurthy, Erik Tigerholm.
I would like to thank Sara I Börjesson, Linnea Lundberg, Fredrik Elinder andMichele Migliore for contributing and improving my work.
Many thanks to all the present members and old members of the ComputationalBiology Group for creating a rich environment for me to work in.
Without my family and friends this thesis had not been written. Their endless loveand support I will always be thankful for.
Finally thanks to Joel, Jakob and Dante.


Contents
Contents vii
List of Figures ix
Glossary xi
1 Scope of the thesis 11.1 Objectives . . . . . . . . . . . . . . . . . . . . . . . . . . . . . . . . . 11.2 List of papers included in thesis . . . . . . . . . . . . . . . . . . . . . 3
2 Basics of neuroscience 52.1 Neurons – the building blocks of the brain . . . . . . . . . . . . . . . 52.2 Ion channels . . . . . . . . . . . . . . . . . . . . . . . . . . . . . . . . 6
3 Basics of computational neuroscience 93.1 Hodgkin and Huxley models of rectification in cell membranes . . . . 93.2 Compartment models . . . . . . . . . . . . . . . . . . . . . . . . . . 103.3 Hodgkin–Huxley and multistate models of ion channels . . . . . . . 113.4 Error sources in ion channel models . . . . . . . . . . . . . . . . . . 12
4 Introduction 134.1 Dendritic integration of synchronized synaptic input . . . . . . . . . 134.2 Sensory processing and peripheral pain . . . . . . . . . . . . . . . . . 21
5 Review of computational models in epilepsy research 275.1 Seizure prediction algorithms using probabilistic state models . . . . 275.2 Modelling of remission in epilepsy using probabilistic models . . . . 285.3 EEG modelling using lumped or mean field deterministic models . . 295.4 Detailed multicompartment models . . . . . . . . . . . . . . . . . . . 29
6 Review of models of C–fibre and peripheral nerve cells 31
7 Models used in this thesis 33
vii

viii CONTENTS
7.1 Computational models for studying dendritic integration of synchro-nized synaptic input . . . . . . . . . . . . . . . . . . . . . . . . . . . 33
7.2 Computational models for studying action potential velocity changesin C–fibres . . . . . . . . . . . . . . . . . . . . . . . . . . . . . . . . . 37
7.3 Optimization algorithms used in this thesis . . . . . . . . . . . . . . 407.4 Programs used in this thesis . . . . . . . . . . . . . . . . . . . . . . . 417.5 In vitro recordings in pyramidal cells . . . . . . . . . . . . . . . . . . 41
8 Results and discussions 438.1 KA and synchronized synaptic input . . . . . . . . . . . . . . . . . . 438.2 In vitro recordings support the suppression of synchronized input . . 518.3 Ability of KA to suppress synchronized input and the implication for
cognitive functions . . . . . . . . . . . . . . . . . . . . . . . . . . . . 538.4 Ability of KA to suppress synchronized input and the implications
for pathological activity . . . . . . . . . . . . . . . . . . . . . . . . . 588.5 Modulation of ion channels to functionally reverse models of epilepsy 628.6 Modelling of action potential conduction in peripheral nerve cells . . 698.7 Parameter search in detailed multicompartment models . . . . . . . 758.8 Sensitivity and robustness analysis . . . . . . . . . . . . . . . . . . . 82
9 Future work 85
10 Appendix–experimental procedures 87
Bibliography 89
Papers 100
List of Figures
3.1 Hodgkin and Huxley model of cell membrane . . . . . . . . . . . . . . . 103.2 Multicompartment model . . . . . . . . . . . . . . . . . . . . . . . . . . 11
4.1 Synchronized and desynchronized input has different characteristics. . . 154.2 Frequency components of sharp wave–ripples in vitro. . . . . . . . . . . 164.3 Microneurography in humans. . . . . . . . . . . . . . . . . . . . . . . . . 224.4 Activity dependent slowing in different classes of C–fibres. . . . . . . . . 234.5 Recovery cycles in C–fibres . . . . . . . . . . . . . . . . . . . . . . . . . 25
5.1 Three–state remission model . . . . . . . . . . . . . . . . . . . . . . . . 29
7.1 The different models of the temporal distribution of the synchronizedinput. . . . . . . . . . . . . . . . . . . . . . . . . . . . . . . . . . . . . . 34
7.2 Time–window for synaptic input summation . . . . . . . . . . . . . . . . 357.3 Model 1: Spontaneous synchronized burst-type discharges . . . . . . . . 377.4 Model 2: Fast ripple model from synchronized ripples . . . . . . . . . . 387.5 Morphology of the C–fibre. . . . . . . . . . . . . . . . . . . . . . . . . . 39
8.1 The spatial and temporal distribution of the synaptic input. . . . . . . . 448.2 Spike response diagram for input at different synchronicity levels. . . . . 458.3 Activation of KA by synchronized versus semi–synchronized input . . . 468.4 Sensitivity to voltage slope. . . . . . . . . . . . . . . . . . . . . . . . . . 478.5 More suppression of high synchronicity levels for distal than for proximal
locations on the dendrites. . . . . . . . . . . . . . . . . . . . . . . . . . . 498.6 Current and voltage traces from in vitro recordings . . . . . . . . . . . . 528.7 A schematic figure of the pyramidal cell and the placement of the synap-
tic input. . . . . . . . . . . . . . . . . . . . . . . . . . . . . . . . . . . . 538.8 Generation of dendritic spikes . . . . . . . . . . . . . . . . . . . . . . . . 558.9 Excitatory input placed on the tuft modulates the dendritic suppression
of synchronized input. . . . . . . . . . . . . . . . . . . . . . . . . . . . . 568.10 Model 1: KA reduces response to fast ripple input . . . . . . . . . . . . 598.11 Model 2: KA reduces response to fast ripple input . . . . . . . . . . . . 608.12 Increased excitability induced by pathological channel changes. . . . . . 63
ix

x List of Figures
8.13 Effects of PUFAs on the decreased KAcurrent pathology model. . . . . . 658.14 Effects of PUFAs on the increased Na current pathology model. . . . . . 668.15 Effects of PUFAs when the steady–state activation and inactivation of
KAis equally modulated. . . . . . . . . . . . . . . . . . . . . . . . . . . . 678.16 Activity–dependent slowing the during high–frequency protocol . . . . . 708.17 Activity–dependent slowing is induced by accumulation of intracellular
sodium . . . . . . . . . . . . . . . . . . . . . . . . . . . . . . . . . . . . 718.18 The slowing/speeding for different interspike intervals . . . . . . . . . . 728.19 Induced super normal phase due to accumulation of intracellular sodium. 738.20 The procedure to functionally correct a pathological model. . . . . . . . 768.21 Presentation of the optimization cycle. . . . . . . . . . . . . . . . . . . . 788.22 Local minimum . . . . . . . . . . . . . . . . . . . . . . . . . . . . . . . . 798.23 Improved activity–dependent slowing by optimization. . . . . . . . . . . 798.24 Sensitivity analysis. . . . . . . . . . . . . . . . . . . . . . . . . . . . . . 828.25 Robustness analysis. . . . . . . . . . . . . . . . . . . . . . . . . . . . . . 83

Glossary
Soma The cell body of a neuron
Dendritic tree The large tree–like structure connected tothe cell body of a neuron
Apical trunk dendrite The main dendrite, which originates fromthe soma of a pyramidal neuron
Oblique dendrite The dendrite that branches from the apicaltrunk dendrite
Tuft dendrites Distal dendrites at the end of the apicaltrunk dendrite
Membrane potential The voltage across the cell membrane of aneuron
Action potential (spike) A large transient depolarisation of the membranepotential generated in the soma when the cell isactivated
Back–propagating action potential The spread of the action potential fromthe soma throughout the dendritic tree
Spike threshold Critical membrane potential threshold. Passthis threshold an action potential is generated
xi

xii List of Figures
Excitatory postsynaptic potential A temporary depolarisation of the membranepotential caused by the flow of positively charged ionsinto the cell
Ion channel Pore–forming proteins that help establishand control the voltage gradient across themembrane by allowing the flow of ions downtheir electrochemical gradient
Gating variable A variable that describes the opening stateof an ion channel
Steady state parameters Parameters that describe the openingstate of an ion channel in steady state
Synapse Functional connections between neurons by which the cellscan activate each other
KA A–type potassium channel
KChIP1 K+ channel–interacting protein 1, which is an auxiliarysubunit of KA
DPP6 Dipeptidyl aminopeptidase–like protein 6,which is an auxiliary subunit of KA
PUFA Polyunsaturated fatty acids
PKC Protein kinase C
CaMKII Ca2+/calmodulin–dependent protein kinase II
AA Arachidonic acid
Ketogenic diet Diet consisting of high fat, adequate proteinand low carbohydrate intakes

List of Figures xiii
AMPA–receptor An exitatory iontropic receptor that givesrise to a depolarisation of the cell membranepotential
GABA–receptor An hyperpolarising iontropic receptor thatgives rise to hyperpolarisation of thecell membrane potential
Hippocampus An important brain structure locatedin the temporal lobe
CA1 An area in the hippocampus
CA3 An area in the hippocampus
Temporal lobe epilepsy A form of epilepsy in which the seizuresare generated in the temporal lobe
EEG Electroencephalography.
LFP Local field potentials.
ADS Activity–dependent slowing


Chapter 1
Scope of the thesis
One of the most fascinating features of neurons is their elaborate dendritic arbours.The vast majority of the synaptic input projects on the dendrites rather than onthe soma. One important function of dendrites is therefore to integrate synaptic in-put, which is influenced by numerous ion channels embedded in the cell membrane.Certain pathological conditions, such as epilepsy and chronic pain conditions, canoriginate from dysregulations of ion channels mutations in ion channel genes (re-viewed in Köhling, 2002; Drenth et al., 2007). The main purpose of this thesis is toexplain how certain ion channels influence functional behaviours observed duringepileptogenesis and to suggest candidates for modulatory substances that reduceepileptic activity. In the following part of this section, I will describe the mainobjectives of this thesis.
1.1 Objectives
• Objective 1: To study the ability of A–type potassium channels toselectively reduce synchronized synaptic inputEpilepsy is a brain disorder in which a subject has repeated seizures (con-vulsions) over time. Seizures are characterized by increased and highly syn-chronized neural activity (McNamara et al., 1999; Chiu et al., 2006; Braginet al., 1999; Ochi et al., 2007; Urrestarazu et al., 2006; Worrell et al., 2008).Therefore, mechanisms that regulate synchronized neural activity are crucialfor an understanding of epileptogenesis. Such mechanisms must differentiatebetween synchronized and semi–synchronized synaptic input. The candidateI propose for such a mechanism is the fast outward positive current generatedby the A–type potassium channel (KA). KA which reduces the excitabilityof the cell. A large KA current may prevent the neuron from becoming ac-tivated by synchronized synaptic input. The first objective of my thesis is
1

2 CHAPTER 1. SCOPE OF THE THESIS
to investigate whether KA can suppress the cellular response to synchronizedsynaptic input while minimally affecting desynchronized input.
• Objective 2: To investigate whether KA can suppress fast rippleactivityFast ripples, high–frequency oscillations (200–1000Hz), have been identifiedas possible signature markers of epileptogenic activity and may be involvedin generating seizures (Chiu et al., 2006; Bragin et al., 1999; Ochi et al.,2007; Urrestarazu et al., 2006; Worrell et al., 2008). Importantly, fast ripplesare characterized by abnormally synchronized population activity. Therefore,reducing cellular response to fast ripple input should help reduce epilepticactivity. The second objective is accordingly to investigate whether KA cansuppress fast ripple activity.
• Objective 3: Reversing nerve cell pathology by optimizing the con-centration of modulatory substances targeting the KA channelIn diseases of the brain, the distribution and properties of ion channels de-viate from those of healthy control subjects. I studied three cases of ionchannel alteration related to epileptogenesis and derived three pathologicalmodels of epilepsy. The third objective is to apply computational modellingand optimization to reverse pathological models and thereby restoring normalneural function. The input parameters for the optimizer were the relative con-centrations of the modulatory substances KChIP1, DPP6, PKC and CaMKII.
• Objective 4: To reverse pathological models of epilepsy by ion chan-nel alterations related to the ketogenic dietA ketogenic diet is an alternative treatment of epilepsy in children (Kossoffet al., 2011). The diet, rich in fat and low in carbohydrates, elevates the levelof polyunsaturated fatty acids (PUFAs) in plasma (reviewed in Bough andRho, 2007). These substances have therefore been suggested to contributeto the anticonvulsive effect of the diet . PUFAs modulate the properties ofa range of ion channels, including K and Na channels. These changes havebeen hypothesized to be part of a mechanistic explanation of the ketogenicdiet. The fourth objective is to study how ion channel alterations, due to theketogenic diet, can reverse pathological models of epilepsy.
• Objective 5: To study the influence of the Perforant pathway onthe suppression of synchronized synaptic input via the Shaffer col-lateralHighly synchronized neural firing, for instance sharp–wave activity in the hip-pocampus, has also been discussed in relation to normal neural activity, such

1.2. LIST OF PAPERS INCLUDED IN THESIS 3
as memory consolidation (Buzsaki, 1998; Siapas and Wilson, 1998). Duringsharp–wave activity, highly synchronized input is mainly mediated by theSchaffer collateral pathway. Recent studies have shown interaction betweendifferent input pathways (Doiron et al., 2011; Pissadaki et al., 2010; Dudmanet al., 2007), such as the Perforant and Shaffer collateral pathways. The Per-forant pathway, projecting to the tuft, has relatively low direct influence onspike activity. It has therefore been assumed to have a modulatory function(Otani et al., 1995; Dudman et al., 2007). The fifth objective is to study theinfluence of the Perforant pathway on the cellular suppression of synchronizedsynaptic input via the Shaffer collateral.
• Objective 6: To describe the alteration in excitability in C–fibresdue to repetitive stimulationUp to this point, I have studied the integration of synchronized input in thecentral nervous system. In this project, I have also studied the propagationof action potential in the peripheral axons, denoted C–fibres. These C–fibresmediate information about harmful peripheral stimuli from limbs and organsto the central nervous system and are therefore linked to pathological pain.If a C–fibre is activated repeatedly, their excitability is altered (Hallin et al.,1970; Serra et al., 1999; Weidner et al., 1999). The mechanisms of this al-teration are unknown. However, in pathological conditions, such as chronicpain, this alteration in excitability displays deviate from that of healthy con-trol subjects (Ørstavik et al., 2003; Krishnan and Kiernan, 2005) and maycontribute to the pathology. The sixth objective is to study the mechanismsthat generate the alteration in excitability in C–fibres due to repetitive stim-ulations.
1.2 List of papers included in thesis
• Paper IErik Fransén, Jenny TigerholmRole of A–type potassium currents in excitability, network syn-chronicity and epilepsy,Hippocampus, 20:877–887, 2010My contribution to this work was to improve the model, construct the fastripple input, run the simulations, and conduct the analysis.
• Paper IIJenny Tigerholm, Erik Fransén,Reversing nerve cell pathology by optimizing modulatory action ontarget ion channels.Biophys J., 101:1871–1879, 2011

4 CHAPTER 1. SCOPE OF THE THESIS
My contribution to this work was to construct the models of epilepsy, syn-chronized input, and modulatory substances. I implemented the optimizationmethod and ran all simulations. I contributed to writing the paper.
• Paper IIIJenny Tigerholm, Sara I Börjesson, Linnea Lundberg, Fredrik Elin-der, Erik Fransén,Dampening of hyper–excitability in CA1 pyramidal neurons bypolyunsaturated fatty acids acting on voltage–gated ion channelsSubmitted, 2012I contributed to the design of the project. I constructed the models of epilepsy,the models of synchronized input, and contributed to the models of modu-latory substances. I ran all simulations and performed the analysis of theresults. I contributed to writing the paper.
• Paper IVJenny Tigerholm, Michele Migliore, Erik FransénIntegration of synchronous synaptic input in CA1 pyramidal neurondepends on spatial and temporal distributions of the input.Submitted, 2012I contributed to the design of the project and to writing the paper. I ran allsimulations and analysed the results.
• Paper VModelling activity–dependent changes of AP conduction of primaryafferent C–nociceptorsJenny Tigerholm*, Marcus Petersson*, Otilia Obreja, Angelika Lam-pert, Richard Carr, Schmelz Martin, Erik Fransén*contributed equallyI contributed to the design of the project and to writing the paper. I ransome of the simulations and analysed the results.

Chapter 2
Basics of neuroscience
Computational neuroscience is the application of computer modelling to elucidatebiological phenomena in the nervous system. Hence, relevant biological conceptsand computational modelling techniques must be understood to properly compre-hend this interdisciplinary field. This chapter provides an overview of the basicunderlying biological concepts relevant to this thesis and of the relevant biologicalassumptions. In the following chapter, a short introduction to the basic terminologyand computational models used in this thesis will be provided. The knowledgeablereader can go directly to chapter 4.
The nervous system has been divided into two classes, central and peripheral. Thecentral nervous system consists of the brain and spinal cord, while the remainingnerves and ganglia constitute the peripheral nervous system. The main function ofthe peripheral nervous system is to provide information from the limbs and organsto the central nervous system where it is processed
2.1 Neurons – the building blocks of the brain
The morphology of neurons in the brain can vary significantly. However, all neu-rons have a cell body (soma) and many have a tree–like structure called a dendritictree. Many neurons have a large dendritic tree, primarily divided into apical andbasal dendrites. The ion concentrations inside and outside the membrane of aneuron differ, generating a voltage across the cell membrane called the membranepotential. One way to activate a neuron is by activating receptors sensitive to α-amino-3-hydroxyl-5-methyl-4-isoxazole-propionate (AMPA). The AMPA receptorsare primarily located at the synapses, which are locations where neurons are con-nected with each other. When the AMPA receptor is activated, it opens and letsions pass through the membrane. The flux of ions depolarizes the neuron, in what isknown as an excitatory postsynaptic potential (EPSP). This depolarization travels
5

6 CHAPTER 2. BASICS OF NEUROSCIENCE
to the soma, where an “all or nothing” mechanism determines whether the neuronbecomes activated. If the membrane potential is higher than a certain spike thresh-old, the neuron becomes activated. When a neuron becomes activated, sodiumchannels open in the soma. This generates a large transient depolarization (i.e.,action potential or spike) that is typical of an activated neuron. Not only can acell become activated by synapses, but it can also be inhibited. The typical centralneurotransmitter that mediates the signal is gamma-aminobutyric acid (GABA).When GABA receptors are activated, the cell becomes hyperpolarized and therebyless excitable.
2.2 Ion channels
Innumerable ion channels are embedded in the cell membrane, enabling ions to passthrough. The ion concentrations inside and outside the neuron differ. This inducesa chemical gradient and electrical voltage across the membrane that drives the ionsthrough the ion channels. When a neuron is resting, the inflow and outflow of ionsare in equilibrium, but when the neuron is activated, the balance is disturbed by theopening of ion channels. Ion pumps can restore the balance by pumping back theions that have been flowing through the channels. The next section will describethe characteristics of ion channels relevant to this thesis.
A–type potassium channelThe A–type potassium channel (KA) is a channel that is permeable to potassiumions, which cause the neuron’s excitability to decrease (Hoffman et al., 1997; Caiet al., 2004; Makara et al., 2009). KA is composed of four subunits that can eitherbe identical or different. The KA current belongs to a group of threshold currentsactivated near the spike threshold and it produces the well–known action poten-tial delay (Melnick, 2011). KA has a rapid activation (within milliseconds) and asemi–slow inactivation (within 30ms) (Hoffman et al., 1997). The dynamics of KA
differ between the distal and proximal dendrites of CA1 pyramidal neurons in thehippocampus (Hoffman et al., 1997). Not only do the dynamics of KA differ inthe dendritic tree, but the density of KA increases farther out on the dendritic tree(Hoffman et al., 1997). The auxiliary subunit DPP6 may contribute to the conduc-tance gradient of the KA current, since dendritic recordings from mice lacking theDPP6 gene did not display increased KA conductance (Sun et al., 2011).
Other potassium channelsOther vital channels are permeable to potassium ions, for example, the KDR channel(KDR). Hodgkin and Huxley first demonstrated the importance of KDR in gener-ating an action potential in 1952 (Hodgkin and Huxley, 1952). KDR is a semi–fastpotassium channel, activated during depolarized potential, and its main function isto repolarize the membrane after an action potential (Hodgkin and Huxley, 1952).

2.2. ION CHANNELS 7
Other channels, such as the hyperpolarization–activated cyclic nucleotide–gatedchannel and the h–channel (also referred to as If , IQ and HCN), are permeable toboth sodium and potassium ions. The h–current belongs to a group of thresholdcurrents that are activated near the spike threshold. The h–channel is sometimesreferred to as the “pacemaker channel” because it helps generate rhythmic activitywithin groups of heart and brain cells (Luthi and McCormick, 1998).
Sodium channelsSodium channels are ion channels that are permeable to sodium ions. The majorfunction of sodium channels is to generate action potentials. In central neurons,such as the CA1 pyramidal neurons, TTX–sensitive sodium currents are dominant.Peripheral C–fibres have three sodium channels that are relevant to this thesis:NaV 1.7, NaV 1.8, and NaV 1.9. Their characteristics in the peripheral system willbe further described in this section. Both the NaV 1.7 and NaV 1.8 channels arefast–activating sodium channels contributing to spike initiation (Blair and Bean,2002). These channels differ, since the NaV 1.8 channels generate the action poten-tial while the NaV 1.7 channels only help initiate the action potential (Blair andBean, 2002). One reason why the NaV 1.7 channels do not contribute to generatingthe action potential is that they are almost inactivated when the cells are resting.Furthermore, the NaV 1.9 channels are slow sodium channels and are therefore alsocalled persistent sodium channels. The NaV 1.9 channels mainly influence the rest-ing potential, since they are too slow to affect the action potential (Herzog et al.,2001).
Sodium channels, due to their vital function, are implicated in numerous pathologi-cal conditions, such as chronic pain and epilepsy (reviewed in Wada, 2006; Köhling,2002). All three sodium channels, NaV 1.7, NaV 1.8, and NaV 1.9, have been impli-cated in chronic pain (reviewed in Wada, 2006). In chronic pain disorders, sodiumchannels can be both upregulated and downregulated (reviewed in Wada, 2006).The interplay between sodium channels likely generates the hyperexcitability as-sociated with chronic pain. Mutations in the NaV 1.7 channel gene can generate again as well as a loss of function. A gain–of–function mutation has been found togenerate peripheral pain disorders (reviewed in Fischer and Waxman, 2010), while aloss–of–function mutation has been found to generate a rare disorder that stronglyreduces the patent’s ability to feel physical pain (reviewed in Fischer and Waxman,2010)
Ion pumpsEmbedded in the membrane are proteins, called ion pumps, that transport ionsacross the membrane. Ion pumps differ from ion channels, since they transportions against the concentration gradient. The ion pumps transport the ions backafter the neuron has been activated, thereby preparing the neuron for reactivation.

8 CHAPTER 2. BASICS OF NEUROSCIENCE
In thin axons, where ion accumulation can occur easily due to the small volume,ion pumps may play an important role in excitability (De Col et al., 2008).

Chapter 3
Basics of computationalneuroscience
Computational neuroscience combines two of the most intriguing disciplines, com-putational modelling and neuroscience. One pioneer in the field was Lapicque, whodescribed the excitability of axons in 1907 (reviewed inBrunel and Van Rossum,2007). These observations were later developed into the integrate–and–fire modelof a neuron (Brunel and Van Rossum, 2007), which is among the simplest models,describing a neuron with one equation. Despite this, it is still frequently used inlarge–scale network models, since it is not computationally demanding and stillcaptures many of the integration properties of a neuron (Brunel and Van Rossum,2007) In 1952, Hodgkin and Huxley introduced a model describing the generationof action potential in an axon (Hodgkin and Huxley, 1952) by mathematical com-ponents. The models used in this thesis are derived from the original Hodgkin andHuxley model. The purpose of this chapter is to introduce the basic terminologyand computational models used in this thesis.
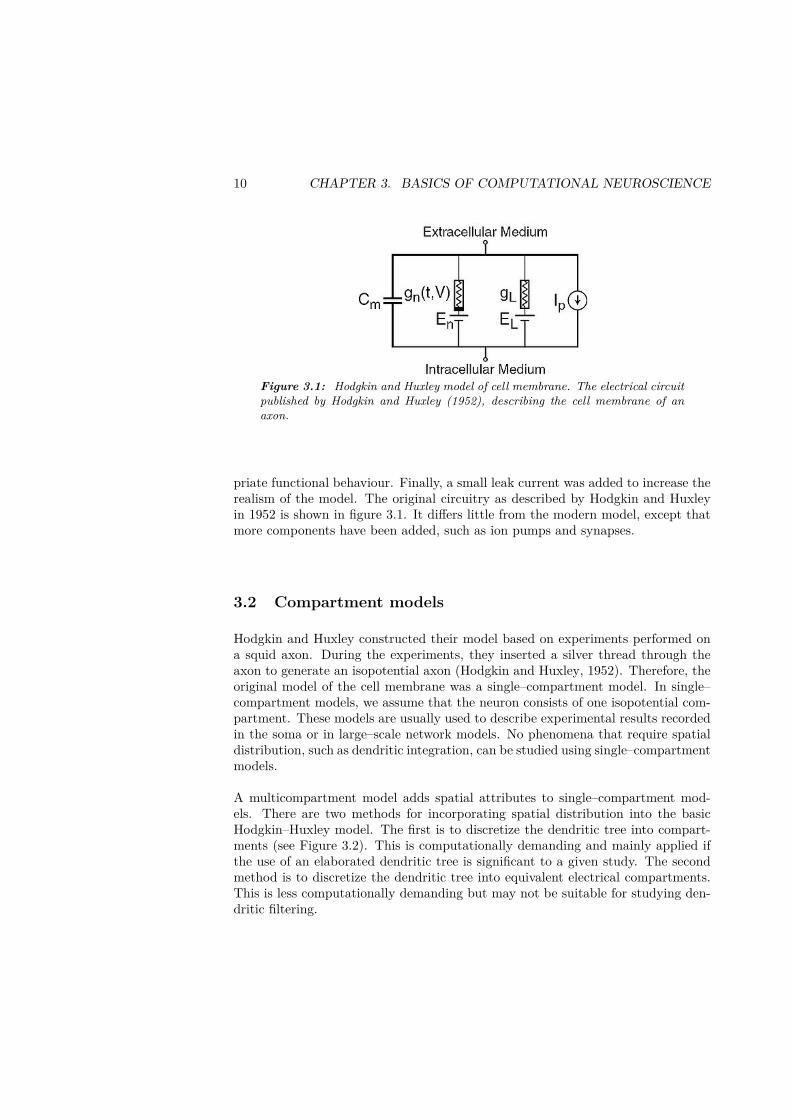
3.1 Hodgkin and Huxley models of rectification in cellmembranes
Hodgkin and Huxley described the electrical current across the membrane usinga gate model (Hodgkin and Huxley, 1952). They identified two ionic currents,a potassium and a sodium current, which they described as a voltage–dependentconductance and a potential driving force. Each ion has a particular direction andamplitude of flux through the membrane, which is called the reversal potential andmodelled as a voltage source.
The membrane is a lipid bilayer and has electrical properties similar to those of acapacitor. Therefore, a capacitor was added to the circuitry to generate the appro-
9
10 CHAPTER 3. BASICS OF COMPUTATIONAL NEUROSCIENCE
Figure 3.1: Hodgkin and Huxley model of cell membrane. The electrical circuitpublished by Hodgkin and Huxley (1952), describing the cell membrane of anaxon.
priate functional behaviour. Finally, a small leak current was added to increase therealism of the model. The original circuitry as described by Hodgkin and Huxleyin 1952 is shown in figure 3.1. It differs little from the modern model, except thatmore components have been added, such as ion pumps and synapses.
3.2 Compartment models
Hodgkin and Huxley constructed their model based on experiments performed ona squid axon. During the experiments, they inserted a silver thread through theaxon to generate an isopotential axon (Hodgkin and Huxley, 1952). Therefore, theoriginal model of the cell membrane was a single–compartment model. In single–compartment models, we assume that the neuron consists of one isopotential com-partment. These models are usually used to describe experimental results recordedin the soma or in large–scale network models. No phenomena that require spatialdistribution, such as dendritic integration, can be studied using single–compartmentmodels.
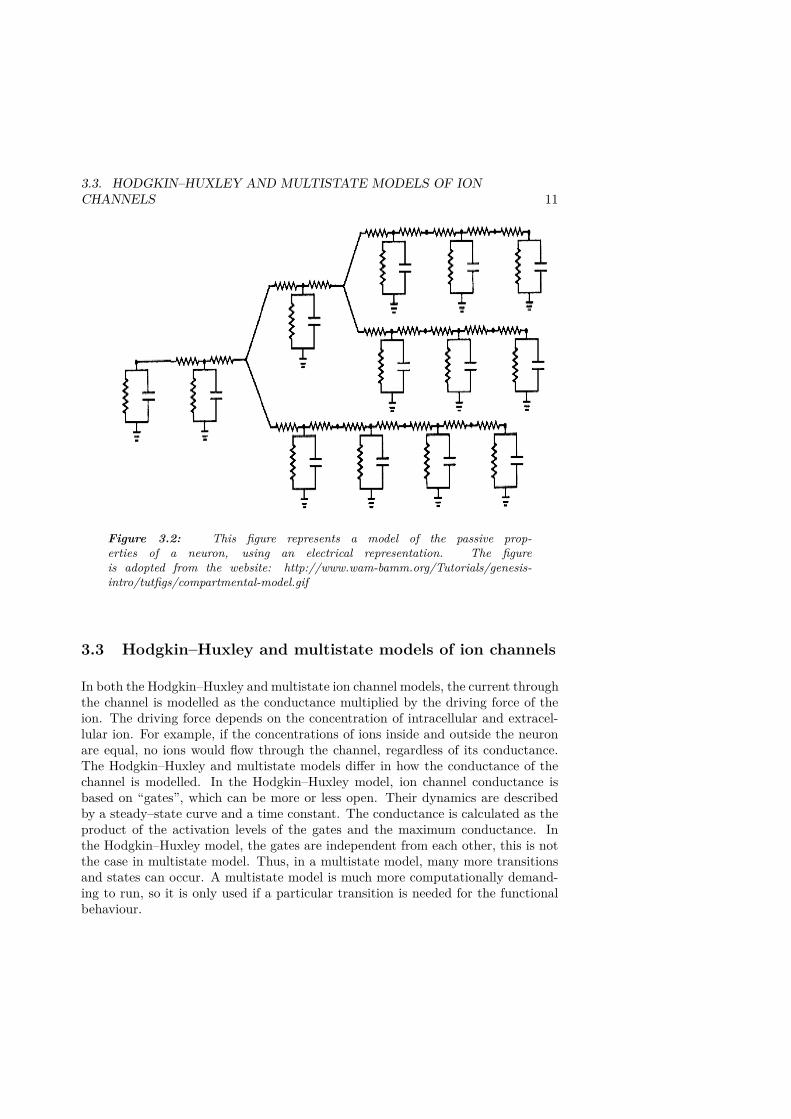
A multicompartment model adds spatial attributes to single–compartment mod-els. There are two methods for incorporating spatial distribution into the basicHodgkin–Huxley model. The first is to discretize the dendritic tree into compart-ments (see Figure 3.2). This is computationally demanding and mainly applied ifthe use of an elaborated dendritic tree is significant to a given study. The secondmethod is to discretize the dendritic tree into equivalent electrical compartments.This is less computationally demanding but may not be suitable for studying den-dritic filtering.
3.3. HODGKIN–HUXLEY AND MULTISTATE MODELS OF IONCHANNELS 11
Figure 3.2: This figure represents a model of the passive prop-erties of a neuron, using an electrical representation. The figureis adopted from the website: http://www.wam-bamm.org/Tutorials/genesis-intro/tutfigs/compartmental-model.gif
3.3 Hodgkin–Huxley and multistate models of ion channels
In both the Hodgkin–Huxley and multistate ion channel models, the current throughthe channel is modelled as the conductance multiplied by the driving force of theion. The driving force depends on the concentration of intracellular and extracel-lular ion. For example, if the concentrations of ions inside and outside the neuronare equal, no ions would flow through the channel, regardless of its conductance.The Hodgkin–Huxley and multistate models differ in how the conductance of thechannel is modelled. In the Hodgkin–Huxley model, ion channel conductance isbased on “gates”, which can be more or less open. Their dynamics are describedby a steady–state curve and a time constant. The conductance is calculated as theproduct of the activation levels of the gates and the maximum conductance. Inthe Hodgkin–Huxley model, the gates are independent from each other, this is notthe case in multistate model. Thus, in a multistate model, many more transitionsand states can occur. A multistate model is much more computationally demand-ing to run, so it is only used if a particular transition is needed for the functionalbehaviour.

12 CHAPTER 3. BASICS OF COMPUTATIONAL NEUROSCIENCE
3.4 Error sources in ion channel models
Ion channel models are critical elements for describing membrane dynamics. Inthis thesis, I have used Hodgkin and Huxley’s ion channel model. The parametersneeded to construct the model are generated from an electrophysiological experi-ment. Therefore, to understand the limitations of ion channel models, one mustunderstand the limitations of electrophysiological experiments. Two important lim-itations of electrophysiological experiments are temperature and lack of modulatorysubstances. Some experiments are performed at room temperature, so the kineticsof the channel differ significantly from those at body temperature. This differencecan be compensated for by a temperature coefficient (Q10), translating ion channelkinetics between different temperatures. Q10 represents the factor by which thetime constant of the steady state curves changes by a change in temperature of tendegrees. However, Q10values vary significantly between systems and experiments.For example, for the KA channel the range in Q10 value can be as great as 3–7.2(Huguenard et al., 1991; Nobile et al., 1997). To compensate for the temperaturedifference will therefore reduce the precision of the model. Another error source isthat several modulatory substances may be missing from the in vitro preparation;modulatory substances can alter the steady–state activation and inactivation aswell as their kinetics.
The two most commonly used systems for studying ion channel dynamics are ex-pression systems and brain slices. An expression system is an artificial or naturalcell that has the ability to transcribe and translate a genetic sequence. If the genecoding for an ion channel is added to an expression system, the cell will express theion channel on the cell surface. In an expression system, the ion channel can bestudied without interference from other ion channels. Native ion channels can beconstructed by different subunits, coded by different genes. In expression systems,however, a single gene is usually expressed, so the channels may not be equivalentto the native channels studied in brain slices. In brain slice experiments, an animalbrain is used to create a thin slice of brain tissue. Recordings of brain slices usuallyprovide no information about what specific subunits constitute the channels.

Chapter 4
Introduction
In this thesis, I describe how nerve cells in the central and peripheral nervoussystems can process inputs. The main focus in the CA1 pyramidal neuron is on theintegration of synaptic input from the dendritic input site to the soma, where spikeinitiation occurs. Along this spatial path, through the dendritic tree, ion channelsplay a key role in shaping the EPSP. It is technically difficult to experimentallymeasure this integration, since the distal dendrites are very thin. I therefore studieddendritic integration using a detailed multicompartment model with a wide rangeof ion channels.
The main focuses in my thesis have been on dendritic integration of synchronizedinput in pyramidal cells. However, in paper V, I have also studied the propagationof action potential in the peripheral axons, denoted C–fibres. These C–fibres me-diate information about harmful peripheral stimuli from limbs and organs to thecentral nervous system and are therefore linked to pathological pain. If a C–fibreis activated repeatedly, their excitability is altered (Hallin et al., 1970; Serra et al.,1999; Weidner et al., 1999). The mechanisms for this alteration are unknown andin this thesis, I have studied then influence of ion channels on this alteration.
In the next two sections I will give an introduction to the two main objectives inthis thesis: integration of synchronized input and sensory processing.
4.1 Dendritic integration of synchronized synaptic input
In this thesis, I have focused on the dendritic integration, within a couple of fewmilliseconds, of highly synchronized input. Some researchers criticize the use ofhighly synchronized input, because they claim that it is physiologically impossiblefor the brain to generate input with such high temporal precision. Studies of highlysynchronized input are accordingly claimed to be irrelevant, since such input does
13

14 CHAPTER 4. INTRODUCTION
not occur during normal brain activity. Several lines of evidence contradict thisclaim. The most convincing evidence is that cell activity within milliseconds havebeen recorded from many cortical and sub–cortical areas in a variety of species(Takahashi and Sakurai, 2009; Ylinen et al., 1995; Azouz and Gray, 2003; Gray,1994). Even though it may be difficult to understand how such high precisioncan occur, one cannot deny that it does in fact occur. Notably, in this thesis, Idisregarded the mechanism by which the brain generates the synchronized activityand only focused only on the integration of the input.
Synchronicity is commonly viewed as a network phenomenon. However, eventhough synchronicity manifests itself as simultaneous spikes throughout the net-work, the single neuron (or part of a dendrite) constitutes the point of convergence.Synchronized neural activity is associated with several vital cognitive processes (re-viewed in Uhlhaas and Singer, 2006). However, changes in synchronicity is are alsoassociated with cognitive disorders, for example, schizophrenia, epilepsy, autism,Alzheimer’s disease, and Parkinson’s (reviewed in Uhlhaas and Singer, 2006). Forthis reason, mechanisms that regulate synchronized neural activity are crucial foran understanding of the brain and neurological diseases. In epilepsy, synchronicityis elevated (McNamara et al., 1999; Chiu et al., 2006; Bragin et al., 1999; Ochiet al., 2007; Urrestarazu et al., 2006), so I hypothesized that reducing the cellularresponse to synchronized input would help in reducing network synchronicity. Suchmechanisms must differentiate between synchronized and semi–synchronized input,as these two different types of neural input depolarize the cell differently. Synchro-nized input generates a large and rapid depolarization, whereas semi–synchronizedinput generates a smaller and slower depolarization (see Figure 4.1).
The candidate mechanism I propose is the A–type potassium channel (KA). TheKA current is a fast outward positive current that reduces cell excitability (Hoff-man et al., 1997). A large KA current could therefore prevent a neuron from beingactivated by synchronized synaptic input. One objective of my thesis is to inves-tigate whether KA can suppress the cellular response to synchronized input, whileminimally affecting desynchronized input.
In the next two sections, I will further describe the implications of synchronizedinput in epilepsy as well as memory and learning.
Synchronous brain activity and cognitive functionsExtracellular electrical recording is a widely used method for measuring synchro-nized brain activity. Electroencephalography (EEG) and local field potentials(LFP) measure the electrical activity induced by the activity of a mass of neu-rons. Both these methods record the combined activity of many neurons and can-not isolate the contributions of individual neurons. EEG and LFP, which measurepopulation activity, can only detect activity if the neuron population exhibits some

4.1. DENDRITIC INTEGRATION OF SYNCHRONIZED SYNAPTIC INPUT15
0 10 20 30 40−60
−40
−20
0
20
40
Time (ms)
Me
mb
ran
e p
ote
ntia
l (m
V)
Figure 4.1: Synchronized and desynchronized input has different character-istics. The red curve represents a cell subjected to synchronized input and theblack line represents desynchronized input. The synchronized activity is sup-pressed and no spike is generated.
degree of synchronicity. If the neural activity is uncorrelated, all the cells’ activity,in sum, is cancelled out and the population activity becomes zero. Synchronizedbrain activity, recorded by EEG or LFP, is classified by its frequency, i.e., alpha(8–12Hz), beta (13–30Hz), gamma (30–200Hz), delta (0–3Hz), and theta (4–7Hz)(reviewed in Uhlhaas and Singer, 2006).
Large depolarizations (sharp waves) have been recorded in the hippocampus duringslow–wave sleep and quiet waking (Buzsáki, 1986; Buzsaki, 1998; Maier et al., 2003;Siapas andWilson, 1998; Worrell et al., 2008). Superimposed on the sharp waves arehigh–frequency oscillations, called ripples (see Figure 4.2) (Maier et al., 2003). Thisactivity has been associated with memory consolidation (Buzsaki, 1998; Siapas andWilson, 1998), i.e., the transfer of memory from the hippocampus to the neocortex.During sharp waves, dendritic sodium spikes can be generated and presumably playa role in the dendritic integration and plasticity processes (Kamondi et al., 1998).Due to the high synchronicity of the input, a rapid and large enough depolarizationis generated to reach the spike threshold in the dendrites. The KA channel has beenproposed as a candidate for suppressing dendritic spikes, since pharmacologicallyblocking KA increases the probability of dendritic spike generation (Gasparini et al.,2004; Makara et al., 2009).
It is widely believed that learning and memory depend on the long–term alterationof synaptic conductance. During a phenomenon called long–term potentiation, thesynaptic conductance can be altered from an hour up to days, weeks, and evenmonths (reviewed in Sjöström et al., 2008). Synchronized input induces a large

16 CHAPTER 4. INTRODUCTION
Figure 4.2: Frequency components of sharp wave–ripples in vitro. A, rawdata from a recording in CA1 pyramidal cell layer. Lower traces show the samerecordings after application of a high–pass filter (B), band–pass filter (C) andlow pass–filter (D). Isolation of high–frequency components reveals unit activity.Note that units do not discharge on each cycle of the ripple oscillations (com-pare high–pass vs. band–pass filtered signal). Low pass filtered traces shows theunderlying sharp wave
depolarization that can remove the magnesium block of the NMDA channel andthereby allow long–term potentiation. Thus, dendritic sodium spikes are efficient atinducing long–term potentiation, since a dendritic spike generates a large depolar-ization. This could explain why KA is involved in learning and synaptic plasticity(Ramakers and Storm, 2002; Chen et al., 2006; Lockridge and Yuan, 2011).
Moreover, when an action potential is generated in the soma, it will propagate backthrough the dendritic tree. The back propagation of an action potential trans-mits the information regarding the effectiveness of the synaptic input back to thesynapses located in the dendrites. This creates an association between the synapticinput and its impact on action potential generation. Large back propagation hasbeen found to induce long–term potentiation (reviewed in Sjöström et al., 2008).
Moreover, synchronized input leads to an increase in synaptic conductance via long–term potentiation. This in turn generates more synchronized activity and thereby

4.1. DENDRITIC INTEGRATION OF SYNCHRONIZED SYNAPTIC INPUT17
a further increase in synaptic conductance. This process would be autogenerative ifit were not controlled by mechanisms other than long–term potentiation (reviewedin Sjöström et al., 2008). Due to this potential positive feedback, comparisons havebeen made between mechanisms of memory and those of epilepsy (Beenhakker andHuguenard, 2009) and chronic pain (Ji et al., 2003). In Papers I–III, I have studiedthe cellular integration of synchronized input implicated in epileptogensis. In thenext section, I will provide an introduction to these papers.
Synchronous brain activity and epilepsyEpilepsy is a major neurological disease with a prevalence rate of 5–10 per 1000individuals (Sander and Shorvon, 1987; Semah et al., 1998). The predominantsymptoms of epilepsy are recurrent spontaneous seizures. Patients can experienceseizures during conditions of stress and fatigue or when they are calm or at rest.The uncertainty regarding the triggering conditions of seizures is very stressfulfor the patient. Therefore, the period immediately preceding the seizure, i.e., thepreictal period, has been the subject of significant research seeking to construct al-gorithms that can help predict seizures. Epileptic seizures can be divided into twotypes: partial and general. Partial seizures affect only certain parts of the brain,while general seizures cause disturbances throughout the brain. Mesial temporallobe epilepsy is a common form of epilepsy caused by partial seizures located inthe olfactory cortex, amygdala, and hippocampus. Though the underlying mech-anisms of seizures are unknown, many studies have investigated preictal activityin an attempt to identify the triggering mechanisms of seizures. Fast ripples, i.e.,high–frequency oscillations (200–1000Hz), have been identified as possible signa-ture markers of epileptogenic activity and may be involved in generating seizures(Chiu et al., 2006; Bragin et al., 1999; Ochi et al., 2007; Urrestarazu et al., 2006). Infact, fast ripples have only been recorded in brain structures capable of generatingepileptic seizures (Engel et al., 2009).
The analysis of fast ripples versus normal brain ripple activity helps us understandthe pathological behaviour of fast ripples. The amplitude and frequency of ripplesand fast ripples indicate that the activity is initiated in CA3 pyramidal cells andbecomes prominent in CA1 cells (Lasztoczi et al., 2004; Dzhala and Staley, 2004;Ylinen et al., 1995). Fast ripples can reach frequencies up to 1000Hz, while indi-vidual neurons can fire at only a few hundred Hertz for an extended period (Staley,2007). This implies that fast ripples are the combined effect of a population of neu-rons. A hypothesis explaining the occurrence of fast ripples has been proposed byFoffani et al. (2007). The higher frequency arguably occurs when two populationsof neurons oscillating at lower frequencies are combined. For example, consider twopopulations of neurons oscillating at 200Hz; if one population is delayed by 2.5ms,the combined oscillating frequency of both populations would be 400Hz.
Another hypothesis of how fast ripples occur is that they are a pathological de-

18 CHAPTER 4. INTRODUCTION
viation of ripples. When fast ripple activity is generated, synchronicity increasesfollowed by an increase in frequency (Lasztoczi et al., 2004). These results suggestthat fast ripples may be generated from normal ripples subject to higher synchronic-ity (Engel et al., 2009; Foffani et al., 2007).
A third hypothesis of how fast ripples occur involves networks of pyramidal cellsconnected by gap junctions, where the cytoplasm of the cells is directly connected.This allows molecules and ions to pass between cells. The direct connections be-tween pairs of axons, caused by gap junctions, may generate high synchronicity.This would arise because activity in one axon leads to activity in the connectedaxon as well, generating a cascade of activity. Experimental evidence indicatesthat gap junctions do exist in pyramidal cells and interneurons in the hippocampus(Church and Baimbridge, 1991; Hamzei-Sichani et al., 2007; Bartos et al., 2001).In the case of pyramidal cells, gap junctions have been found between the axons(Schmitz et al., 2001). If the chemical synapses are blocked, it is still possible toobserve a population frequency as high as 200Hz (Draguhn et al., 1998). It ishypothesized that axo–axonal gap junctions in pyramidal cells can generate highpopulation frequencies when spontaneous action potentials are generated in the ax-ons (Traub and Bibbig, 2000). For this and other reasons, gap junctions may playa role in epileptogenesis.
Fast ripples are characterized by abnormally highly synchronized population ac-tivity. Therefore, reducing cellular response to highly synchronized synaptic inputwould be beneficial for reducing epileptic activity. In this thesis, I have thereforeinvestigated whether KA can suppress highly synchronized synaptic input. KA gen-erates a fast outward positive current that reduces the excitability of the cell. Alarge KA current could therefore prevent the neuron from becoming activated bysynchronized synaptic input. Based on pharmacological and genetic studies, KA
currents have been implicated in epileptogenesis. In this section some of these ex-perimental studies will be discussed.
A–type potassium channels and epilepsy
Singh et al. (2006) discovered a KA gene mutation in a patient with temporal lobeepilepsy. The mutation caused a frame shift that changed an amino acid codingcodon to a stop codon; as a result, the mutated gene lacked its last 44 amino acids.To investigate the dynamics of the mutated KA gene, the gene was injected intoan expression system. The mutated KA had the same steady–state curves as didthe wild type, but the current density was reduced. This study suggests that thisdownregulation of the KA current could be the cause of the patient’s temporal lobeepilepsy. Moreover, if KA was knocked out, instead of being downregulated, thisalso resulted in increased seizure susceptibility to convulsant stimulation (Barnwellet al., 2009). Interestingly, the Kv4.2 knockout was associated with 100% mortality

4.1. DENDRITIC INTEGRATION OF SYNCHRONIZED SYNAPTIC INPUT19
during status epilepticus, versus 25% in the control group. Barnwell et al., 2009conclude that KA does not contribute to initiating the seizure but instead regulatesthe seizure threshold. However, a general problem with the use of knockouts isdevelopmental complications, such as seizures, which preclude conclusions. A bettertechnique would be to use blockers to isolate the behaviour of a specific ion channel.When KA is blocked by a selective blocker, seizures were also induced (Juhng et al.,1999). These three experimental results all suggest that a deficiency in KA mayincrease seizure susceptibility.
As a consequence of seizures, neurons can be relocated to abnormal positions, be-coming what are called heterotopic cells. An animal model of this kind of corticalmalformation is provided by methylazoxymethanol (MAM), as heterotopic cells inMAM–exposed rats lack a functional KA current (Castro et al., 2001). This maycontribute to the spontaneous seizures found with cortical malformations (Castroet al., 2001). KA deficiency may be involved in inducing seizures and can also ag-gregate over time. Moreover, Kv 4.2 is downregulated after seizures (Francis et al.,1997; Tsaur et al., 1992), which might create a vicious circle: seizures caused bylow KA currents will further reduce the KA current, which will increase the sus-ceptibility to new seizures (Juhng et al., 1999). Seizures also cause stress reactionsthat initiate many processes that may contribute to downregulating KA. However,in an animal model that mimics a stress response, without triggering a seizure, Kv4.2 gene expression could be measured; the result indicated that downregulation ofKv 4.2 was not the result of stress reactions alone (Francis et al., 1997).
Lamotrigine is an antiepileptic drug that affects KA channels. Lamotrigine is notspecific and affects other channel types as well. Interestingly, Lamotrigine enhancesthe KA current in the neocortex (Zona et al., 2002), whereas it reduces it in thehippocampus (Huang et al., 2004). This might explain why some patients withepilepsy display improved status, whereas others find that Lamotrigine aggravatespre–existing seizures and triggers new seizure types (Guerrini et al., 1998). The ex-perimental data presented in this section indicate that KA downregulation may beinvolved in generating seizures. Since seizures themselves contribute to KA down-regulation, this increases the susceptibility to new seizures even more. Upregulationof KA could stop this progressive downregulation and prevent a patient from relaps-ing. To my knowledge, no currently existing antiepileptic drug selectively targetsthe KA channel. However, the drug industry has recently become interested in theKA channel and a Belgian company, Devgen, has published several patent applica-tions pertaining to the discovery and development of KA modulators. Interestingly,some of the patents are for possible use in the treatment of epilepsy (Castle, 2010).
Reducing hyperexcitability in models of epilepsy
In diseases of the brain, the distribution and properties of ion channels deviate fromthose of healthy control subjects. I have studied three cases of ion channel alteration

20 CHAPTER 4. INTRODUCTION
related to epileptogenesis and derived three pathological models of epilepsy. Inpapers II and III, I apply computational modelling and optimization to reverse thepathological models by restoring normal neural function. The input parametersto the optimizer were the relative concentrations of modulatory substances. Manysubstances can modulate the KA channel, such as auxiliary proteins (An et al.,2000; Maffie and Rudy, 2008), kinases (Hoffman and Johnston, 1998; Varga et al.,2004), and PUFAs (Xu et al., 2008). In this thesis, I have modelled substancesthat modulate the KA channel, so I will briefly describe the modulatory substancesrelevant to this thesis. Five important proteins that modulate KA channels will befurther described.
Kv channel–interacting proteins (KChIP) form complexes with KA and modulate itskinetic properties (An et al., 2000; Maffie et al., 2008). KChIPs also upregulate thecell surface expression of KA channels, thereby increasing the KA current (An et al.,2000; O’Callaghan et al., 2003). Another protein that modulates KA dynamics byforming complexes is the dipeptidyl aminopeptidase–like protein (DPPX). The timeconstants of activation and inactivation of KA are significantly reduced by all splicevariants of DPPX (Nadal et al., 2006). The activation curve of KA is also shiftedby all splice variants of DPPX (Nadal et al., 2006).
Several protein kinases also modulate KA, for example, the cAMP–dependent pro-tein kinase A (PKA) and protein kinase C (PKC) (Hoffman and Johnston, 1998).PKA and PKC reduce the KA current by altering the inactivation of the KA chan-nel.
In paper III, I have investigated the affect of polyunsaturated fatty acids (PUFA)influence of models of epilepsy. PUFAs are elevated during ketogenic diet (Boughand Rho, 2007), which is an alternative treatment of epilepsy. The ketogenic dietmimics the same condition as during fasting but it less extreme. It has been knownsince the early 1920s that patients with epilepsy could control their seizures byfasting (Kossoff et al., 2011). During fasting, the primary energy source is fat storedin the body, which metabolizes to ketone bodies. Ironically, this treatment did notbecome frequently used until the 1990s, after a Hollywood movie (“Do no harm”)increased patient awareness of it. The resistance from the pharmacological industryand research community has been significant, and several myths and misconceptionspersist regarding the diet (Kossoff et al., 2011). The treatment has today beenmodified from fasting to the ketogenic diet, which consists of high fat, adequateprotein, and low carbohydrate intakes. The ketogenic diet mimics the conditionsthat occur during fasting but is less extreme. It has mainly been used as the finalalternative when no medical treatment has been successful or if medical options arelimited due to low patient age. Between 10 and 15% of patients become completelyseizure free and 50% reduce their seizure incidence by 50% or more (Vining et al.,1998). The most astonishing fact about this treatment is that after a few yearson the diet, many remain seizure free even after discontinuing the diet (Vining

4.2. SENSORY PROCESSING AND PERIPHERAL PAIN 21
et al., 1998). The only treatment for epilepsy that can achieve similar results isbrain surgery, which is of course invasive and not suitable for most patients (Kossoffet al., 2011).
The mechanisms responsible for the anticonvulsant effect of the diet are still amystery, despite its long history. In the early 1920s, the hypothesis was that fastingcleansed the body of toxins responsible for the seizure. Today, no single mechanismhas been widely accepted as generating the anticonvulsant effect; instead, severalcontributing mechanisms of the diet may explain the success. Both ketone bodiesand fatty acids are elevated during the ketogenic diet (reviewed in Bough et al.,2007) and have been postulated to contribute to the reduction of seizures. PUFAshave been studied extensively due to their beneficial effects on the heart (reviewedin Boland et al., 2008). In my thesis, I have studied the effects of PUFAs on ionchannels to identify what alterations caused by the ketogenic diet are beneficial inreducing epileptic activity.
4.2 Sensory processing and peripheral pain
Nociceptors are sensory nerve endings that can be activated if the body tissue isexposed to any potentially harmful stimulus. They convey pain signals to the cen-tral nervous system via the axon, which is also called a nerve fibre. In this thesis,I have modelled a C–fibre, which is an unmyelinated fibre conducting a slow, dull,long–lasting pain. C–fibres average 0.2–1.5 µm in diameter, and are therefore toothin to allow recording of intracellular membrane potential. Therefore, most dataon C–fibres are obtained by velocity measurements or intracellular recordings inthe soma. C–fibres can be activated by one specific or several different types ofphysiological stimuli, such as cold, heat, and mechanical stimuli. However, someC–fibres cannot be activated by any physiological stimulus and are therefore calledsilent C–fibres. During experiments, silent C–fibres can be activated by very highelectrical stimuli, the injected current generating an action potential in the axonand not by activating receptors in the nerve ending. One of the first recordingsof a silent C–fibre was made in a study of the response behaviour of fine nervefibres innervating the knee joint capsule (reviewed in Michaelis et al., 1996). Thestudy demonstrated that if the knee joint is acutely inflamed, the silent C–fibres“awaken” and can be activated by physiological stimuli. The most interesting resultof the study was that the silent C–fibres can be activated in the absence of me-chanical stimulation, probably as a consequence of the inflammation. More recentstudies have confirmed that C–fibres can become activated by inflammatory agents(reviewed in Michaelis et al., 1996).
Moreover, various forms of hyperalgesia, which is characterized by increased sen-sitivity to pain, are caused by damage to nociceptors or peripheral nerves. Oneway of experimentally inducing hyperalgesia is by injecting capsaicin into the skin,

22 CHAPTER 4. INTRODUCTION
Conduction latency in C-fibre
Figure 4.3: Microneurography in humans. Stimulating distal C–fibres in thefoot by current injection. The generated action potential is propagation alongthe C–fibre and can be recorded extracellular at a more proximal location nearthe knee.
which leads to intense pain in the tissue surrounding the injection site (Simoneet al., 1989; LaMotte et al., 1991) studied the contribution of silent C–fibres tosensitization after capsaicin injections. The study found, consistent with the re-sults of Schaible and Schmidt (1988), that the silent C–fibres became sensitive tophysiological stimuli such as mechanical pressure or heat. The most interestingresult of the study was that silent C–fibres exhibited prolonged bursting dischargesfor several minutes after the injection, which could explain the pain experienced bythe subject.
When studying action potential conduction in C–fibres, the fibre is activated byelectrical or other physiological stimuli in the skin. The action potential is recodedextracellularly at a more distal part of the C–fibre and the latency is measured (seeFigure 4.3). One functional behaviour of a C–fibre is that after an action potentialhas propagated along it, the propagation of the next action potential will changedue to altered excitability (see Figure 4.4). Two changes in excitability have beenmeasured that are relevant to this thesis: one is more prominent in the 400–1000msinterval (Hallin et al., 1970; Obreja et al., 2010) and the other in the 20–200msinterval (Weidner et al., 1999; Serra et al., 2011) after the action potential.
The slower of the above mentioned excitability changes displays increased propaga-

4.2. SENSORY PROCESSING AND PERIPHERAL PAIN 23
Figure 4.4: Different patterns of activity–induced conduction slowing in themechano–unresponsive C–fibers, in pig. Repetitive electrical stimulation at as-cending frequencies increases conduction latencies in all three units: the coldnociceptor (cold noci, open star) slows marginally during the low–frequency pro-tocol (–Hz) and only slightly more, reaching a steady–state (plateau) duringthe higher–frequency (2Hz) stimulation. A sympathetic–likeefferent (symp–like,open circle) slows very little during both electrical protocols. Characteristic re-versal of conduction latency changes during stimulation at higher frequencies(2Hz) is shown. The silent nociceptor (silent, filled square) slowed the most inboth stimulation protocols. (Obreja et al., 2009)
tion latency with repetitive stimulation and is therefore called activity–dependentslowing (ADS). In Figure 4.4, different patterns of ADS are shown for differentclasses of C–fibres. Silent C–fibres, which are considered to play a role in inflam-matory pain (reviewed in Michaelis et al., 1996), display the greatest ADS of theC–fibre classes. The most convincing hypothesis suggests that slowing is due tothe slow inactivation of the NaV 1.8 sodium channel (De Col et al., 2008). Thedecreased velocity during ADS is viewed as an indirect indication of excitabilityand is altered in several chronic pain conditions (Serra et al., 2011; Ørstavik et al.,

24 CHAPTER 4. INTRODUCTION
2003). In patients with erythromelalgia, a rare condition characterized by painfulhot extremities, ADS is significantly increased in silent C–fibres. This may seem tobe a contradiction, since neuropathies are associated with hyperexcitability, whilean increase in ADS is associated with reduced excitability. However, C–fibre be-haviour is complex and all measurements of action potential propagation are in-direct measurements of excitability. In this thesis, we have therefore developed acomputational model to describe complex behaviours such as this in silent C–fibres.
A second functional behaviour indicates altered excitability in the 20–200ms in-terval after an action potential has propagated along the C–fibre fibre (Weidneret al., 1999; Serra et al., 2011) (see Figure 4.5). This interval is referred to as thesupernormal phase. During this phase, the excitability increases as does the actionpotential velocity. The magnitude and time course of the supernormal phase candiffer between fibre classes, also dependent on pre–existing ADS (Weidner et al.,2003; Bostock et al., 2003).
In several pain conditions, the supernormal phase is altered (Krishnan and Kier-nan, 2005). In some neuropathies, the supernormal phase decreases (Krishnan andKiernan, 2005), while in others it can increase (Park et al., 2009). In this thesis, Ihave tried to explain the mechanisms that generate the supernormal phase in orderto explain pathological behaviours such as those described above.

4.2. SENSORY PROCESSING AND PERIPHERAL PAIN 25
Figure 4.5: Recording latency recovery cycles from single C–fiber. (A) La-tencies of conditioned (filled circles) and unconditioned (open circles) test ac-tion potentials while conditioning–test delay was reduced from 400 to 2ms, asshown below. Impulse rate was increased from 0.25Hz first to 0.5Hz and then to1.0Hz. (B) Recovery cycle plotted as percentage change in latency as a functionof conditioning–test delay, showing prolonged phase of supernormality. (Serraet al., 2011)


Chapter 5
Review of computational models inepilepsy research
A large part of modelling consists of simplifying the problem. A given biologicalsystem must be understood if we are to know what parts of a particular problemcan be safely ignored. In many cases, the underlying mechanisms of the biologicalsystem are unknown and it is therefore difficult to construct a model. One approachto solving this problem is to generate several alternative models based on hypothesesas to the underlying mechanisms and to analyse their consistence with experimentaldata. This approach has been used to describe the transition from the normal tothe ictal states in epilepsy (Albert, 1991; Wong et al., 2007).
Epilepsy is characterized by spontaneous recurrent seizures. Therefore, a first ap-proach to modelling epilepsy would be to model a seizure. During a seizure, thebrain activity has a rich repertoire of characteristics that makes it difficult to model.Accordingly, many models focus instead on specific questions regarding the seizures.When do seizures occur? After being diagnosed with epilepsy, what is the proba-bility of remission after three years? How do certain antiepileptic drugs affect cellexcitability? The next chapters will describe some of the models that are currentlyused to study epilepsy.
5.1 Seizure prediction algorithms using probabilistic statemodels
The uncertainty of when a patient will have a seizure is stressful for the patient.Therefore, many studies have attempted to learn how to predict seizures. Oneof the first models for predicting seizures was based on a Poisson process (Miltonet al., 1987). This model could predict the number of seizures a patient wouldexperience over a given period, and for 50% of patients, seizure occurrence was
27

28CHAPTER 5. REVIEW OF COMPUTATIONAL MODELS IN EPILEPSY
RESEARCH
indistinguishable from the Poisson predictions. Certain patients experienced ex-tended periods without seizures followed by shorter periods with several seizures.In a second study, this kind of cyclical seizure behaviour was modelled using a two–state Markov mixture model (Albert, 1991) consisting of two states with transitionprobabilities. Each state had its own frequency distribution corresponding to aPoisson distribution. This Markov mixture model could predict seizures in some ofthe problematic patients for whom the Poisson process model failed (Albert, 1991).
The two models described above are all stochastic dynamic models that attemptto mimic a functional behaviour without considering the actual underlying mech-anisms. This approach can be effective in developing a model with a specific be-haviour but might not help us understand the underlying mechanisms of seizures.
5.2 Modelling of remission in epilepsy using probabilisticmodels
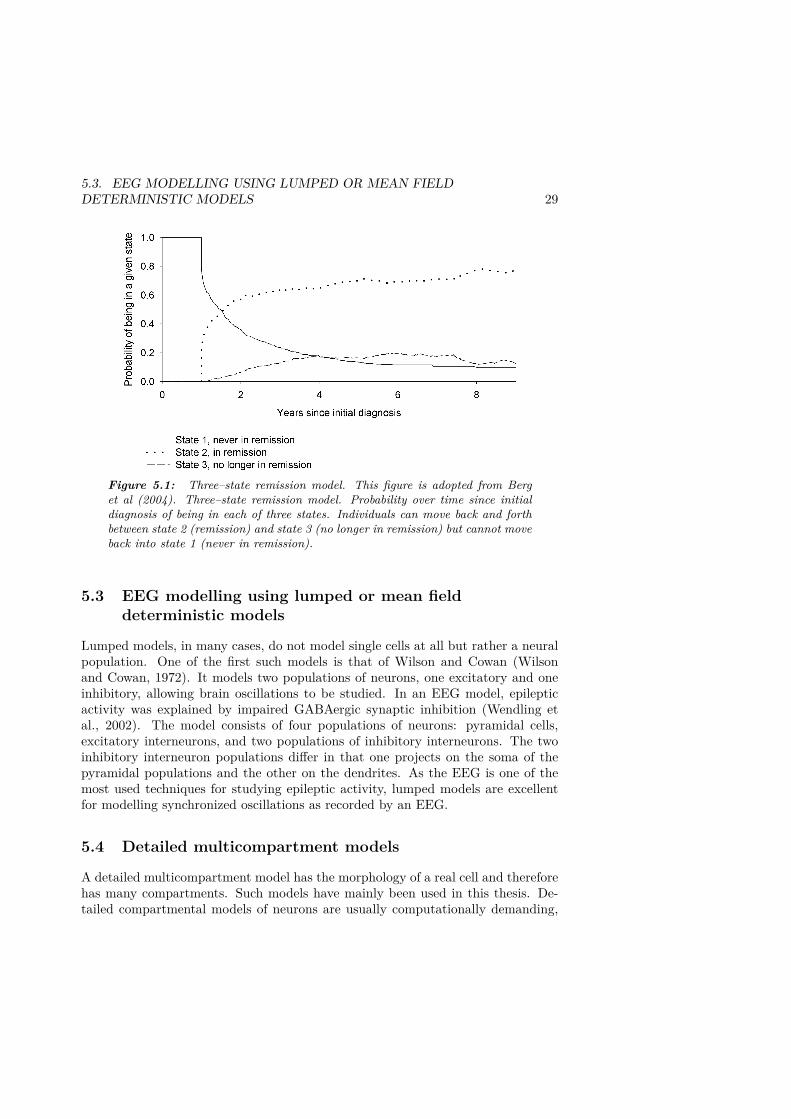
Following a medical epilepsy diagnosis, many patients experience remissions andrelapses. Berg et al. (2004) used a Markov process to describe the remissions andrelapses children experienced after being diagnosed with epilepsy. This model issimilar to the previously described Markov model, but instead of predicting seizureprobability, it predicts the probability of being in remission or relapse. Berg et al.(2004) used two models: one with three states and one with seven states. The threestates in the first model are initial (i.e., no remission), remission, and relapse. Inthe model, the patient can move between states two and three, but not back to theinitial state. In the seven–state model, the patient can never revisit a state, hencethe large number of states.
Figure 5.1, from Berg et al. (2004), shows the probability of being in remission or re-lapse. The probability of the patient never experiencing any remission is 10%. Afterdiagnosis, the patient’s probability of experiencing remission and relapse changesrapidly, and the system reaches steady state after five years.
This kind of modelling describes the clinical development after a patient is diag-nosed with epilepsy. The results of these models imply that the brain can enterinto various states, some of which are more likely to generate seizures. Describingepileptogenesis can help experimentalists identify what they are looking for in anexperiment; for patients, it can be comforting to have a description of the likelyclinical development.
5.3. EEG MODELLING USING LUMPED OR MEAN FIELDDETERMINISTIC MODELS 29
Figure 5.1: Three–state remission model. This figure is adopted from Berget al (2004). Three–state remission model. Probability over time since initialdiagnosis of being in each of three states. Individuals can move back and forthbetween state 2 (remission) and state 3 (no longer in remission) but cannot moveback into state 1 (never in remission).
5.3 EEG modelling using lumped or mean fielddeterministic models
Lumped models, in many cases, do not model single cells at all but rather a neuralpopulation. One of the first such models is that of Wilson and Cowan (Wilsonand Cowan, 1972). It models two populations of neurons, one excitatory and oneinhibitory, allowing brain oscillations to be studied. In an EEG model, epilepticactivity was explained by impaired GABAergic synaptic inhibition (Wendling etal., 2002). The model consists of four populations of neurons: pyramidal cells,excitatory interneurons, and two populations of inhibitory interneurons. The twoinhibitory interneuron populations differ in that one projects on the soma of thepyramidal populations and the other on the dendrites. As the EEG is one of themost used techniques for studying epileptic activity, lumped models are excellentfor modelling synchronized oscillations as recorded by an EEG.
5.4 Detailed multicompartment models
A detailed multicompartment model has the morphology of a real cell and thereforehas many compartments. Such models have mainly been used in this thesis. De-tailed compartmental models of neurons are usually computationally demanding,

30CHAPTER 5. REVIEW OF COMPUTATIONAL MODELS IN EPILEPSY
RESEARCH
and for this reason are rarely used for large neural networks. One exception tothis is the work of the Lansner group at KTH, where super–computers are usedto simulate millions of multicompartment neurons (Lundqvist et al., 2011). Mul-ticompartment models are usually used to study the behaviour of single cells orsmall networks. The study of dendritic integration is a large field in which detailedneural models are used.
An excellent example of a model used to explain experimental data is a compart-mental model of the effect of Lamotrigine (Poolos et al., 2002). An in vitro experi-ment demonstrated that Lamotrigine differentially affects excitability in dendritesand the soma. Since h–channel density differs between the dendrites and the soma,Poolos et al. (2002) set out to test whether this effect was due to Lamotrigine’smodulation of the h–channel. The study had demonstrated that Lamotrigine shiftsthe h–channel’s activation curve and thereby increases the current through thechannel. The model indicated that a 10mV shift in the h–channel activation curveis enough to produce the reduction of excitability measured in the experiment. Asimilar model was used in a study of mossy cell loss and mossy fibre sprouting(Santhakumar et al., 2005). Seizures can alter the brain structure by inducingmossy cell loss and mossy fibre sprouting. Mossy cells are specialized cells thatplay a role in regulating excitability in the hippocampus. Mossy fibre sproutingrefers to an increase in synapses in mossy cells. Loss of mossy cells reduces thenetwork excitability while mossy fibre sprouting increases network excitability. Us-ing experimental techniques, it is complicated to separate the effect of mossy cellloss from that of mossy fibre sprouting, but modelling allows the alterations tobe studied individually. The model indicated that even a low level of mossy fibresprouting would be sufficient to create a hyperexcitable network despite mossy cellloss (Santhakumar et al., 2005).

Chapter 6
Review of models of C–fibre andperipheral nerve cells
Modelling of ion channels and cell membranes started with research regarding ax-ons (Hodgkin and Huxley, 1952). Hodgkin and Huxley developed the first modeldescribing action potential generation due to the dynamics of sodium and potas-sium channels. Today, the most advanced cell models are those of central nervoussystem neurons, whereas models of the peripheral nervous system are less detailed.As far as I’m aware, there is no other detailed multicompartment model of C–fibresthan ours.
Some efforts have been made to model myelinated axons. For example, a modelof sensory neurons with spatial distribution has been developed (Amir and Devor,2003), including spatial components consisting of both an axon and a soma. Inthe model, the concentrations of sodium and potassium ions are kept as constants.This is a reasonable assumption for the myelinated axon, since the action potentialis generated only between the myelinated sections (i.e., in the internodes), so fewerpotassium and sodium ions accumulate. This is not the case in unmyelinated axons,in which the action potential propagates along the whole axon.
There are, however, a few models describing the soma of peripheral nerve cells(Sheets et al., 2007; Herzog et al., 2001; Maingret et al., 2008; Kovalsky et al.,2009). Ion channel dynamics, particularly of the sodium channels, have been mod-elled with high precision (Sheets et al., 2007; Herzog et al., 2001; Maingret et al.,2008), sometimes even using multistate techniques (Gurkiewicz et al., 2011). Asthese cell models have mainly been developed to describe the in vitro recoding mea-surements performed in the soma, they lack three properties with respect to in vivorecordings of action potential propagation. First, they obviously lack the spatialdistribution. Second, despite the fact that ion channel dynamics alter substantially
31

32CHAPTER 6. REVIEW OF MODELS OF C–FIBRE AND PERIPHERAL
NERVE CELLS
depending on temperature, these dynamics are modelled at room temperature.Third, during electrophysiological recordings of nerve cells, the holding potential isusually hyperpolarized (-80 to -70mV); accordingly, existing models of peripheralsomas are hyperpolarized, whereas in vivo, the cells are actually fairly depolarized(-63 to -41mV) (Fang et al., 2005). A different resting potential leads to alteredion channel activation. For example, the NaV 1.7 channel is almost completely inac-tivated at depolarized resting membrane potentials compared with hyperpolarizedresting membrane potentials (Blair and Bean, 2002).

Chapter 7
Models used in this thesis
In this thesis, I have studied the influence of ion channels on dendritic integration ofsynchronized synaptic input in pyramidal neurons as well as on axonal propagationof action potentials in C–fibres. Distal dendrites and C–fibres are both too thinto allow experimental measurement of intracellular membrane potentials. I havetherefore studied dendritic integration and axonal propagation of action potentialsin a detailed multicompartment model with a wide range of ion channels.
7.1 Computational models for studying dendriticintegration of synchronized synaptic input
In Papers I–V, I have studied dendritic integration of synchronized synaptic inputin CA1 pyramidal neurons, which represent the principal cells in the CA1 regionof the hippocampus. The CA1 pyramidal cells have been studied extensively dueto their implication in both memory and epileptogenesis, and synchronized brainactivity (see chapter 4).
Cell models of CA1 pyramidal neurons
In my thesis, I have used several models developed by Migliore et al. (Migliore et al.,1999; Poolos et al., 2002; Migliore et al., 2008) for studying a hippocampal CA1pyramidal neuron. All these cell models are detailed multicompartment models(200–600 compartments) with three ion channels, i.e., sodium, KDR, and KA; someversions of these models include an h–channel. All channels are modelled based onHodgkin–Huxley kinetics (see chapter 3). Four different morphologies have beenused in Papers I–IV. As a control model, I used a model developed by Poirazi’sgroup (Poirazi et al., 2003). Compared with Migliore’s models, Poirazi’s modelincludes calcium dynamics and a larger range of ion channels.
33

34 CHAPTER 7. MODELS USED IN THIS THESIS
0 50 100 150 200 250
0 50 100 150 200 250
0 50 100 150 200 250Time (ms)
0 50 100 150 200 250
0 50 100 150 200 250
0 50 100 150 200 250Time (ms)
0 50 100 150 200 250
0 50 100 150 200 250
0 50 100 150 200 250Time (ms)
A
C
B
Figure 7.1: The different models of the temporal distribution of the synchro-nized input. A. The temporal distribution for the Exponential distribution inputfor the synchronization levels 0%, 70% and 50%. B. The temporal distributionfor the Normal distribution input for the synchronization levels 0ms, 5ms and10ms. C. The temporal distribution for the Deterministic normal distributioninput for the synchronization levels 0ms, 5ms and 10ms.
Models of synchronous synaptic input
For all papers, I have used the built–in model of a synapse in NEURON, whichis a two state kinetic scheme synapse, described by a rise time and a decay timeconstant. For more information, please refer to the documentation of NEURON.
I have generated synaptic input with different levels of synchronization in the tem-poral distribution. Three different models for the generation of synchronized synap-tic input have been used. The different temporal features of the input are shownin Figure 7.1.
Exponential distribution model (Paper I)Ten synaptic inputs were included in the neuron model, representing the activatedsynapses at a particular period of time within a restricted part of the dendrite.For each synapse, I generated expontentially distributed synaptic events at a rateof 12Hz. The different levels of synchronization were modelled according to Char-cos Lloréns and Fransén (2004). Different inputs were separated with an exponentialdistribution within a time window, and the relative size of the window in relation tothe base frequency of 12Hz determines the degree of synchronization. For instance,if the frequency of the input is 12Hz, the time window between the cycles is onaverage 83ms (T0 in the Figure 7.2). If the synchronization level is 90% (TW /T0

7.1. COMPUTATIONAL MODELS FOR STUDYING DENDRITICINTEGRATION OF SYNCHRONIZED SYNAPTIC INPUT 35
0 50 100 150 200 250Time (ms)
T0
TW Synchronisation = (Tw/T0)*100 level
Figure 7.2: Time–window for synaptic input summation. Ten inputs, the fre-quency of which is synchronized at 70%. The time–window for the ten inputsis T0–TW. Note that both the occurrence of synaptic input at any time–windowand the intervals between windows are stochastic, reflecting the inherent unpre-dictability of neural firing.
in the Figure 7.2) the synaptic input should in average use 10% of 83ms. If thesynchronization level is 100%, all the synaptic inputs are simultaneous. Figure 7.2shows the temporal distribution of the input for the synchronization levels 100%,70% and 50%.
Normal distribution model (Papers II–IV)For this model of synaptic input, a normal distribution was used to generate thetemporal distribution instead of the exponential distribution previously described.The standard deviation of the normal distribution, expressed inms, was chosenas the measurement of the synchronization level. Figure 7.1 shows the temporaldistribution of the input for the synchronization levels 0ms, 5ms and 10ms. Boththis model and the previous model are stochastic models, which to some degreeserves as a test of the robustness of the models. Small alterations to the temporaldistribution of the input should not significantly alter the functional behaviour.
Deterministic normal distribution model (Papers III–IV)For this model, I used a temporal normal distribution and defined the temporaldistribution of the input to represent a normal distribution. The advantage withthis model, compared with the previous two, is that it is deterministic and thereforethe need for repeated simulations required in the former models is eliminated. Thismodel was mainly used during optimization, since it is less computationally de-manding than the previous two models. Figure 7.1 shows the temporal distributionof the input for the synchronization levels 0ms, 5ms and 10ms.

36 CHAPTER 7. MODELS USED IN THIS THESIS
Model of fast ripple input
During a fast ripple event, a neuron population is activated synchronously at highfrequency. In my work, I focus on the activity during a fast ripple event and noton the mechanisms underlying fast ripples. By simulating the input to a pyramidalcell during a fast ripple event, I can study the ability of KA to reduce the neuralresponse.
Fast ripple events have abnormally high frequencies. This implies that this is apopulation frequency rather than an individual neuron frequency, since CA1 pyra-midal cells cannot fire at the fast ripple frequency for an extended period. As far asI know, the activity of individual neurons during fast ripples has not been recorded.I therefore derived two fast ripple models from two hypotheses of how fast ripplesoccur, the first based on an in vitro study and the second on an in vivo study. Bothmodels are further described in the section below.
Fast ripple model: spontaneous synchronized burst–type dischargesThe CA3 neurons projects onto the CA1 neurons (Bragin et al., 2002), which arethe cells I study in this thesis. The CA3 neurons can activate CA1 synapses withburst–like behaviour; however, the mechanisms generating CA3 burst–type activityhave not been established. The burst of input generates a burst–type activity inthe CA1 cells. Fast ripple activity may occur when these burst–type dischargesare synchronized (Dzhala and Staley, 2004). The second fast ripple model is basedon data from Volodymyr et al. (2004), who recorded spontaneous burst–type neu-ral discharges from brain slices. The interspike interval (ISI) was measured usingcell–attached recordings of CA1 and CA3 pyramidal cells. To generate fast rippleoscillation, the extracellular potassium was increased. At times of high potassiumconcentration, the ISI decreased and the cell delay approached zero. The fast rip-ple input was generated by ten synapses that were activated according to the ISImeasured at times of high potassium concentration. The ten input time series wereevenly distributed with a time delay of 0.15ms. For the control case, the ISI wasfrom normal extracellular potassium and the delay was 2.5ms. Figure 7.3 showsthe temporal distribution of the synaptic input.
Fast ripple model: synchronized ripplesWhen fast ripples are generated, the neurons are first synchronized and then thefrequency increases (Lasztoczi et al., 2004). We therefore hypothesized that fastripples may be a synchronized variant of ripples (Engel et al., 2009). Conversely, ifthe increased synchronization is suppressed, this may reduce the fast ripple activity.As mentioned before, the activity of individual cells during fast ripples has not beenestablished, so we do not know how synchronized the cells are. However, rippleshave been studied more thoroughly, so I could construct a model of ripples. Byincreasing the synchronization of the input in the ripple model, I generated a fastripple model, featuring synchronized ripples. Only 11% of the neurons participate

7.2. COMPUTATIONAL MODELS FOR STUDYING ACTION POTENTIALVELOCITY CHANGES IN C–FIBRES 37
0 20 40 0 20 40
0 20 40Time (ms)
0 20 40Time (ms)
0 20 40 0 20 40
0 20 40 0 20 40
B
A
C
D
Figure 7.3: Model 1: Spontaneous synchronized burst-type discharges. The topthree graphs represent spontaneous burst–type discharges of individual neurons.The left column represents fast ripple activity and the right column is the control.The vertical marks represent time points of synaptic input. The bottom graphsrepresent the summation of all ten inputs.
in each ripple (Ylinen et al., 1995; Buzsaki et al., 1992). I focused on the neuronsconstituting the core of the ripple and therefore used a frequency of 50Hz, addingten synaptic input series were at this frequency. The ten input time series wereevenly distributed with a time delay of 0.3ms; the time delay of the control was1.1ms (Ylinen et al., 1995). Figure 7.4 shows the temporal distribution of thesynaptic input.
7.2 Computational models for studying action potentialvelocity changes in C–fibres
In clinical studies, the change in action potential conduction velocity can be mea-sured, but not explained by ion channel properties. Ion channel properties arehighly relevant for drug development. Therefore, computational models are neededto bridge the gap between the functional behaviour of action potential conductionvelocity and ion channel dynamics. For the result to be relevant for drug devel-opment, the models of ion channels must be detailed enough to enable differentpharmacological alterations in the model. For this purpose, we have developed adetailed model with nine specific ion channels and with cell morphology designedto enable measurement of the propagation of action potentials.

38 CHAPTER 7. MODELS USED IN THIS THESIS
0 20 40 60 0 20 40 60
0 20 40 60Time (ms)
0 20 40 60Time (ms)
0 20 40 60 0 20 40 60
0 20 40 60 0 20 40 60
A
B
C
D
Figure 7.4: Model 2: Fast ripple model from synchronized ripples. Input repre-senting synchronized ripples. The top three graphs represent ripple/synchronizedripples discharges of individual neurons. The left column represents fast rippleactivity and the right column is the ripple. The vertical marks represent timepoints of synaptic input. The bottom graphs represent the summation of all teninputs.
The C–fibre model has been developed in collaboration with Dr. Schmelz’s researchgroup in Mannheim, which comprises an electrophysiological, an animal, and a clin-ical laboratory. We have received valuable information and constructive criticismfrom this group, input that has been invaluable in constructing the model. In thissection, I will describe the C–fibre model and its underlying assumptions.
MorphologyThe C–fibre model consists of three sections: the branch (400 compartments), thecone (100 compartments), and the parent section (2000 compartments) (see Figure7.5). The branch section represents the distal superficial axon, and the cone andparent sections the proximal parts of the C–fibre axon. When an action potentialtravels from the branch axon directly to the parent axon, it propagates poorly dueto the large difference in axon diameters. The biology of the transition betweenthe branch and the parent has not been fully understood. The cone section hasbeen implemented in the model to facilitate the propagation from the branch to theparent section. Two known differences between the distal and proximal parts of theaxon are the diameter and the temperature. The branch axon is more superficialin the skin and is therefore lower in temperature than the parent, which is at body
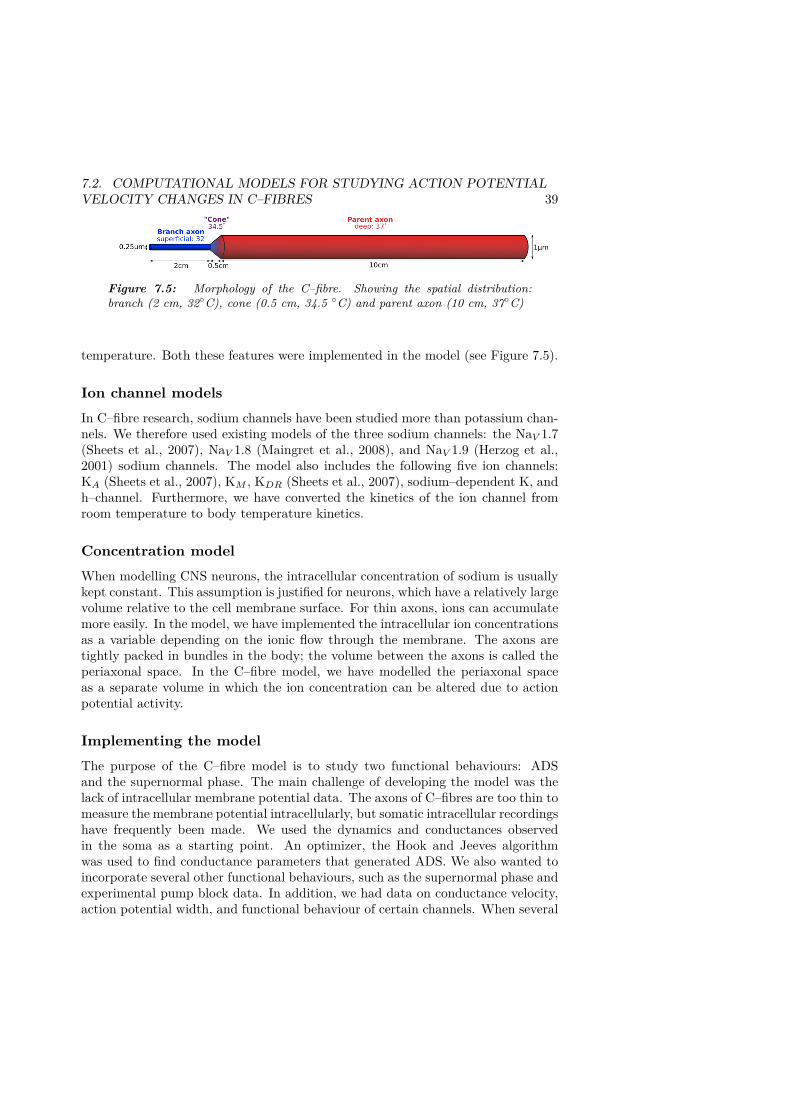
7.2. COMPUTATIONAL MODELS FOR STUDYING ACTION POTENTIALVELOCITY CHANGES IN C–FIBRES 39
Figure 7.5: Morphology of the C–fibre. Showing the spatial distribution:branch (2 cm, 32◦C), cone (0.5 cm, 34.5 ◦C) and parent axon (10 cm, 37◦C)
temperature. Both these features were implemented in the model (see Figure 7.5).
Ion channel modelsIn C–fibre research, sodium channels have been studied more than potassium chan-nels. We therefore used existing models of the three sodium channels: the NaV 1.7(Sheets et al., 2007), NaV 1.8 (Maingret et al., 2008), and NaV 1.9 (Herzog et al.,2001) sodium channels. The model also includes the following five ion channels:KA (Sheets et al., 2007), KM , KDR (Sheets et al., 2007), sodium–dependent K, andh–channel. Furthermore, we have converted the kinetics of the ion channel fromroom temperature to body temperature kinetics.
Concentration modelWhen modelling CNS neurons, the intracellular concentration of sodium is usuallykept constant. This assumption is justified for neurons, which have a relatively largevolume relative to the cell membrane surface. For thin axons, ions can accumulatemore easily. In the model, we have implemented the intracellular ion concentrationsas a variable depending on the ionic flow through the membrane. The axons aretightly packed in bundles in the body; the volume between the axons is called theperiaxonal space. In the C–fibre model, we have modelled the periaxonal spaceas a separate volume in which the ion concentration can be altered due to actionpotential activity.
Implementing the modelThe purpose of the C–fibre model is to study two functional behaviours: ADSand the supernormal phase. The main challenge of developing the model was thelack of intracellular membrane potential data. The axons of C–fibres are too thin tomeasure the membrane potential intracellularly, but somatic intracellular recordingshave frequently been made. We used the dynamics and conductances observedin the soma as a starting point. An optimizer, the Hook and Jeeves algorithmwas used to find conductance parameters that generated ADS. We also wanted toincorporate several other functional behaviours, such as the supernormal phase andexperimental pump block data. In addition, we had data on conductance velocity,action potential width, and functional behaviour of certain channels. When several

40 CHAPTER 7. MODELS USED IN THIS THESIS
constraints were incorporated in the cost function, the optimizer could not find asolution, because it would reach points where attempting to improve one constraintwould lead to another constraint suffering. Therefore, we mainly hand-tuned mostof the parameters in the C-fibre model.
The C–fibre model compared with existing models
In the C–fibre model, we included usually neglected details, for example, the accu-mulation of intracellular sodium. When modelling CNS neurons, the intracellularsodium concentration is usually kept constant.
Another feature that distinguishes the C–fibre model from most of the existingmodels of peripheral neurons is the temperature. Most ion channel experimentstreating the peripheral nervous system are performed at room temperature (Sheetset al., 2007; Herzog et al., 2001; Kovalsky et al., 2009). Therefore, most ion channelmodels use room–temperature kinetics, even though temperature significantly altersion channel kinetics. which can result in different functional behaviour. We havetherefore converted the kinetics of the ion channels and the pumps to be consistentwith body temperature. To translate the time constants of the ion channels, weused the temperature coefficient (Q10), which represents the factor by which thetime constant changes for every change in temperature by ten degrees. For instance,if the Q10 is 3 for a specific ion channel, the time constant in room temperature isapproximately 7 times larger than in body temperature.
7.3 Optimization algorithms used in this thesis
In diseases of the brain, the distribution and properties of ion channels displaydeviations from healthy control subjects. In Paper II, I studied three cases of ionchannel alteration related to epileptogenesis, and derived three pathological mod-els of epilepsy. The main objective of the research was to apply computationalmodelling and optimization to reverse the pathological models and restore normalneural functions. The input parameters to the optimizer were the relative con-centrations of the modulatory substances KChIP1, DPP6, PKC and CaMKII. Toidentify the relative concentrations of the modulatory substances, I used a patternsearch method developed by Hook and Jeeves. It is a simple direct search method,which only uses the output returned by the model to guide the search and belongsto the family of pattern search algorithms (Hooke and Jeeves, 1961). The algorithmsearches in various directions in the input parameter space. If a specific direction inthe parameter space reduces the cost function, the optimizer will continue takingsteps in that direction. When a direction is not successful in reducing the costfunction, the optimizer will search for a new alternative direction in the input pa-rameter space that does reduce the cost function. If no directions reduce the costfunction, the step will be reduced and new directions will be evaluated. The Hook

7.4. PROGRAMS USED IN THIS THESIS 41
and Jeeves algorithm has been used frequently in the thesis due to its simplicityand stable convergence (Kolda et al., 2003; Torczon et al., 1997).
7.4 Programs used in this thesis
The simulations were performed using the NEURON simulation environment (Hinesand Carnevale, 1997). NEURON is a simulator that is used for cell and networkmodels; the code is open source and is available at http://www.neuron.yale.edu/neuron.An advantage over other tools is NEURON’s adaptive time step. When the systemis changing slowly, the time step will be long, but when the system is changingrapidly, the time step is shortened. In our simulations, there are very small systemchanges for long periods of time, so the adaptive time step reduces the simula-tion time significantly. In NEURON, the cell morphology is separated from thecompartmental structure. The dendrites are divided into compartments, which inturn are divided into segments. This allows the user to increase the number ofsegments without changing the number of compartments. MATLAB was used tocreate model input and to analyse the output. MATLAB is a tool for manipulatingmatrixes; it is compact and its powerful notation is ideally suited for data analysis.
7.5 In vitro recordings in pyramidal cells
We have recently begun to experimentally investigate the potential suppression ofsynchronized input by KA (Silberberg, Planert, Tigerholm, Fransén). The ideabehind the experiment was to reproduce the simulation of differential suppressionof the synchronous input in vitro. For experimental convenience, the current in-jections were moved from the dendrites to the soma, since it is more difficult toperform membrane potential recordings and injections on thin dendrites than onthe relatively large soma.
Before the experiment, I modelled the input on the soma in order to investigatethe implications for the suppression of KA. If synaptic input with the same fastdynamics as recorded in the dendrites were used (reviewed in Magee et al., 2000)(as opposed to the slow kinetics in the soma), selective suppression was obtained. Icould therefore use the model to design the optimal parameters, which would lead toa successful experiment. There are three main reasons why the suppression of highlysynchronized input by KA is lower in the soma. The first is the lower conductanceof KA, the second is that the dynamics of KA is altered in the soma (Hoffmanet al., 1997) and the third that the integration through a large dendritic tree doesnot occur. The current through this synapse model was used as input in the invitro experiment. The in vitro experiment was performed by Gilad Silberberg andHenrike Planert and for a description of the experiment please refer to Appendix –Experimental procedures.

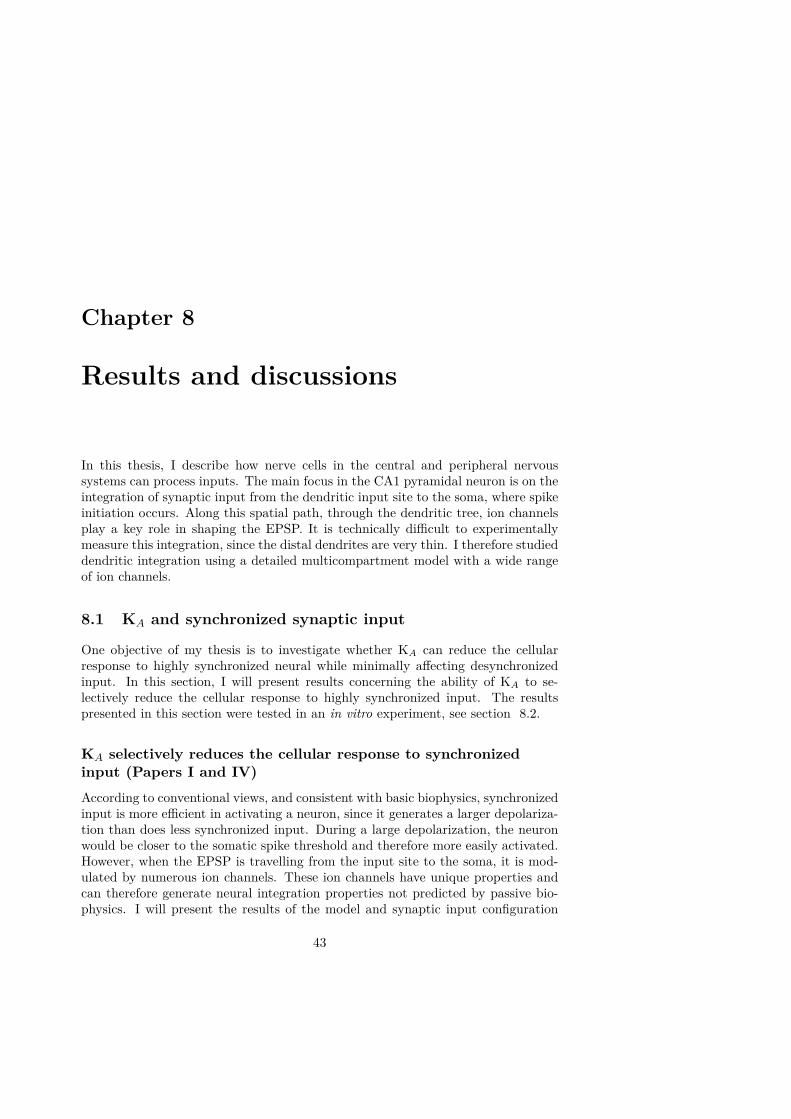
Chapter 8
Results and discussions
In this thesis, I describe how nerve cells in the central and peripheral nervoussystems can process inputs. The main focus in the CA1 pyramidal neuron is on theintegration of synaptic input from the dendritic input site to the soma, where spikeinitiation occurs. Along this spatial path, through the dendritic tree, ion channelsplay a key role in shaping the EPSP. It is technically difficult to experimentallymeasure this integration, since the distal dendrites are very thin. I therefore studieddendritic integration using a detailed multicompartment model with a wide rangeof ion channels.
8.1 KA and synchronized synaptic input
One objective of my thesis is to investigate whether KA can reduce the cellularresponse to highly synchronized neural while minimally affecting desynchronizedinput. In this section, I will present results concerning the ability of KA to se-lectively reduce the cellular response to highly synchronized input. The resultspresented in this section were tested in an in vitro experiment, see section 8.2.
KA selectively reduces the cellular response to synchronizedinput (Papers I and IV)According to conventional views, and consistent with basic biophysics, synchronizedinput is more efficient in activating a neuron, since it generates a larger depolariza-tion than does less synchronized input. During a large depolarization, the neuronwould be closer to the somatic spike threshold and therefore more easily activated.However, when the EPSP is travelling from the input site to the soma, it is mod-ulated by numerous ion channels. These ion channels have unique properties andcan therefore generate neural integration properties not predicted by passive bio-physics. I will present the results of the model and synaptic input configuration
43
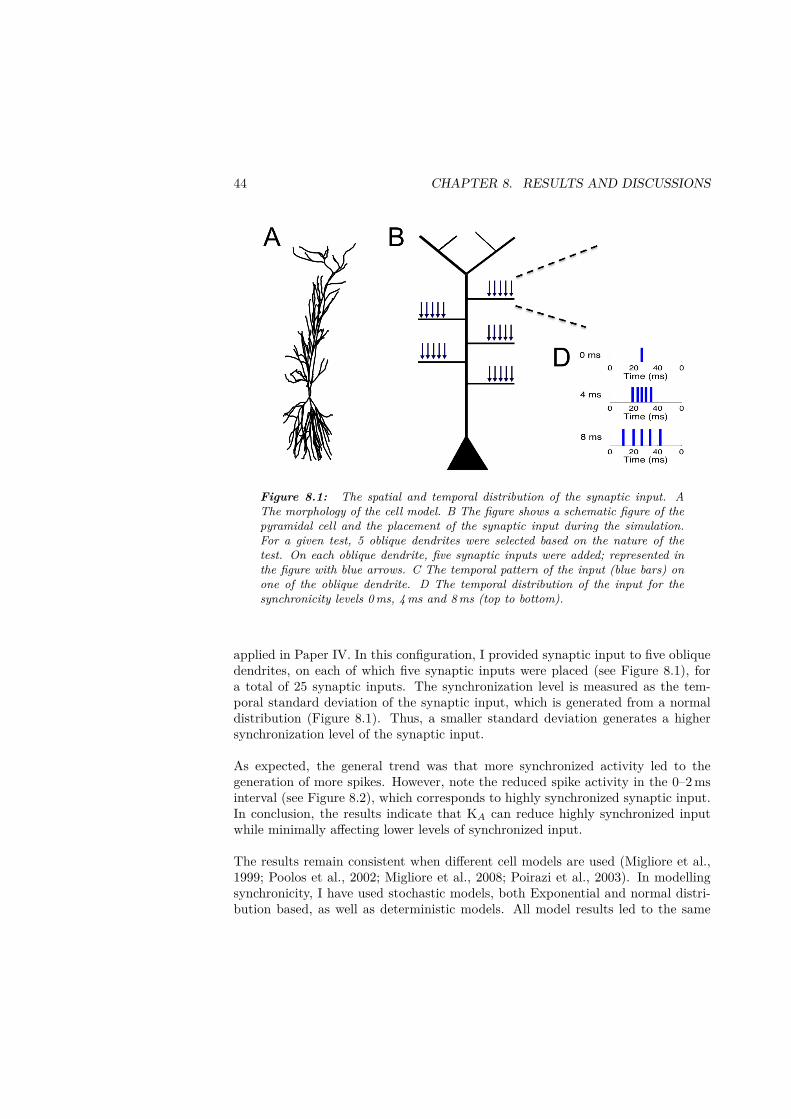
44 CHAPTER 8. RESULTS AND DISCUSSIONS
Figure 8.1: The spatial and temporal distribution of the synaptic input. AThe morphology of the cell model. B The figure shows a schematic figure of thepyramidal cell and the placement of the synaptic input during the simulation.For a given test, 5 oblique dendrites were selected based on the nature of thetest. On each oblique dendrite, five synaptic inputs were added; represented inthe figure with blue arrows. C The temporal pattern of the input (blue bars) onone of the oblique dendrite. D The temporal distribution of the input for thesynchronicity levels 0ms, 4ms and 8ms (top to bottom).
applied in Paper IV. In this configuration, I provided synaptic input to five obliquedendrites, on each of which five synaptic inputs were placed (see Figure 8.1), fora total of 25 synaptic inputs. The synchronization level is measured as the tem-poral standard deviation of the synaptic input, which is generated from a normaldistribution (Figure 8.1). Thus, a smaller standard deviation generates a highersynchronization level of the synaptic input.
As expected, the general trend was that more synchronized activity led to thegeneration of more spikes. However, note the reduced spike activity in the 0–2msinterval (see Figure 8.2), which corresponds to highly synchronized synaptic input.In conclusion, the results indicate that KA can reduce highly synchronized inputwhile minimally affecting lower levels of synchronized input.
The results remain consistent when different cell models are used (Migliore et al.,1999; Poolos et al., 2002; Migliore et al., 2008; Poirazi et al., 2003). In modellingsynchronicity, I have used stochastic models, both Exponential and normal distri-bution based, as well as deterministic models. All model results led to the same

8.1. KA AND SYNCHRONIZED SYNAPTIC INPUT 45
Figure 8.2: Spike response diagram for input at different synchronicity levels.(A-C) The left column shows simulation results with a synchronicity value of0ms, middle column of 4ms, and right column of 8ms. (A) Temporal distri-bution of synaptic inputs. Each bar corresponds to one synaptic input. The 5inputs are superimposed in the left panel. (B) The membrane potential (EPSP)at one of the input sites. (C) The membrane potential at the soma. (D)
conclusion, i.e., that KA could suppress the cellular response to highly synchronizedsynaptic input. Four cell morphologies were used in the various papers, as well asa control model developed by Poirazi et al., 2003. Compared with the cell modelsmainly used in this thesis, the Poirazi model includes calcium dynamics and a largerrange of ion channels.
The selectivity of KA originates from its combination of fastactivation and slow inactivation (Paper I)To understand how KA can selectively reduce synchronized input, two simulationsusing different levels of synchronized input were compared. Figure 8.3 shows theresults of these simulations. The KA current is significantly higher with the syn-chronized than the semi–synchronized input (see Figure 8.3, at 6ms). Since EPSPsfrom synchronized versus semi–synchronized input have different depolarizationshapes, KA can differentiate between them. When KA is not present, synchronized

46 CHAPTER 8. RESULTS AND DISCUSSIONS
0 5 10 15 20 25 30 35 40−50
0
50
Mem
bra
ne
pote
ntial (m
V)
0 20 40−50
0
50
0 5 10 15 20 25 30 35 400
0.05
Curr
ent
(m
A/c
m2)
0 5 10 15 20 25 30 35 400
0.05
0.1
Activation
0 5 10 15 20 25 30 35 400
0.5
Time (ms)
Inactivation
A
B
C
D
Figure 8.3: Activation of KA by synchronized versus semi–synchronized in-put. Synchronous input (100%), shown in red, activates KA more than semi–synchronous input (80%), shown in black. A: Membrane potential in the soma.Inset shows initial slope of EPSP more clearly. B: Current through KA at inputsite. C: Activation of KA at input site. D: Inactivation of KA at input site.
input generates a large and rapid depolarization, whereas semi–synchronized inputgenerates a smaller, slower depolarization. Larger depolarization, generated by syn-chronized input, activates the neuron more effectively than does semi–synchronizedinput. However, when KA is present this is not the case. When the membrane po-tential increases rapidly, the KA channel has time to activate but does not have timefor inactivation. This results in a large KA current, which is an outward positivecurrent making the cell less excitable and thereby preventing the cell from becom-ing activated. Semi–synchronized input generates a smaller, slower depolarizationthereby making it less effective in activating the KA channel. Semi–synchronizedinputs produce a slow increase in membrane potential giving KA time to inactivate,which results in a smaller KA current. This result indicates that the inactivationtime constant may play a crucial role in the ability of KA to suppress synchronizedinput.
One major difference between various synchronization levels is the slope (derivative)of the rising phase of the EPSP. To further analyse the influence of the derivative

8.1. KA AND SYNCHRONIZED SYNAPTIC INPUT 47
Figure 8.4: Sensitivity to voltage slope. The top graph shows voltage clampcommand of different initial slope but same area. The bottom graph shows thecorresponding current through the KA channel. Note the difference in the peakcurrent at 25ms. The legend indicates the integral of the current for each pro-tocol.
on the differential activation of KA, I conducted voltage–clamp simulations provid-ing triangular ramps as inputs to the location of the synapse (see Figure 8.4). Toenable comparisons of cases using different derivatives, I kept the area of the trian-gular voltages constant, as higher potentials and longer times always generate moreactivation and more current. As can be seen in Figure 8.4, higher rising derivativesgenerate higher KA activation. These differences can be seen in both the current’samplitude and integral. In general, inputs of higher synchronicity produce com-pound EPSPs with higher derivatives, which, as demonstrated, activate KA to agreater degree.
Higher levels of synchronized input are suppressed when theinput is placed on distal dendrites (Paper IV)Single cells can perform complex dendritic integrations due to their elaborate den-dritic tree structure with numerous ion channels. Since neurons have large den-dritic trees, I wanted to study whether the cellular suppression of synchonicizedinput depends on the spatial location of the input. CA1 pyramidal neurons havea large branched dendritic tree. Connected to the soma is a long thick dendrite,called the apical trunk dendrite. Several so–called oblique dendrites emerge fromthe main apical trunk dendrite. In Paper IV, I demonstrated that when the inputwas placed on distal oblique dendrites, higher levels of synchronized input could

48 CHAPTER 8. RESULTS AND DISCUSSIONS
be suppressed than when input was placed on proximal oblique dendrites (see Fig-ure 8.5). Interestingly, when the input was placed on the apical trunk dendrite,KA could not selectively suppress highly synchronized input at all (see Figure 8.5),which is consistent with experimental observations (Gasparini et al., 2004). I fur-ther demonstrated that the apical trunk possesses a longer time constant than dothe oblique dendrites, possibly due to the larger diameter of its trunk (Trommaldet al., 1995). The suppression by KA originates from its fast activation and itsslower inactivation. When input is located on the apical trunk dendrite, the mem-brane depolarizes more slowly and the KA channel has time to inactivate, therebygenerating a smaller KA current.
Since pyramidal cells have few synapses on the apical trunk dendrite (Andersenet al., 1980), this result may not be biologically relevant. However, it is still ofinterest, since most patch–clamp experiments on dendrites are performed on apicaltrunk dendrites, and my results indicate that apical trunk dendrites integrate inputsignificantly differently from oblique dendrites.
The suppression of synchronized input can be modulated(Papers I and IV)In Paper I, I varied the conductance of KA and thereby altered the dendritic inte-gration of the synchronized input. If the conductance of KA is reduced, its ability tosuppress highly synchronized input is reduced as well. In Paper IV, I confirmed thatfinding in a larger study, in which I examined whether the conclusions also appliedto different spatial locations of the input. Neuromodulators such as PKC (Hoffmanand Johnston, 1998), CaMKII (Varga et al., 2004), and acetylcholine (Nakajimaet al., 1991) modulated the KA current. Furthermore, activity–dependent mech-anisms of intrinsic excitability, depending on, for example, the back–propagatingaction potential, can open voltage–gated Ca–channels. The resulting calcium influxcan lead to KA channel internalization (Tsubokawa et al., 2000; Kim et al., 2007),thereby downregulating the KA current and the suppression of highly synchronizedinput. This suggests modulatory substances or intrinsic excitability mechanismscan regulate the cellular response to synchronized input via the KA channel.
DiscussionIn this section, I have described how the KA channel can selectively reduce syn-chronized input. As mentioned in Papers I and IV, lower efficacy of the mostsynchronized input was found in the study by Branco et al. (2010). Their data sup-ported the role of NMDA receptors for the lower efficacy of the most synchronizedinput, as did the data of González et al. (2011).
In Papers I and IV, KA channels are demonstrated to play the major role in sup-pressing highly synchronized input; however, the impact from the NMDA receptor

8.1. KA AND SYNCHRONIZED SYNAPTIC INPUT 49
A B
C
D
01
01
01
Num
ber o
f spi
kes
0 5 1001
0 10 2001
Synchronicity (ms)
00.5
Spik
e pr
obab
ility
0101I
II
III
01
01
01
Num
ber o
f spi
kes
0 5 1001
01
01
01
Spik
e pr
obab
ility
0 5 1001
Synchronicity (ms)
I
III
II
0
0.5
01
01
0
1
0
1
01
Spik
e pr
obab
ility
01
0
1
0
1
0 501
01
01
01
01
01
01
Num
ber o
f spi
kes
01
01
01
0 501
Synchronicity (ms)
III
II
I
0 20 40 60 80 10010 9 8 7 6 5 4 3 2 1
0
2
4
6
Distance from apical trunk
Oblique
Sync
hron
icity
(ms)
Figure 8.5: More suppression of high synchronicity levels for distal than forproximal locations on the dendrites. The figure illustrates the spike activityfor different synchronicity levels when the input was moved from proximal todistal locations on the dendrites. We show the spike probability when timing wasrandomly chosen from a normal distribution (black) and repeated 100 times.We also show the number of spikes generated when the inputs were sampledso to obtain a normal distribution (blue). Each arrow in the schematic figurecorresponds to five synaptic inputs. A. The input was placed on the five mostproximal obliques (black arrows) and then systematically moved out to moredistal oblique dendrites (blue and red arrows). The position of the input on theoblique dendrites was 10 µm from the apical trunk. The curves show from thebottom to the top the spike activity for proximal to distal oblique dendrites fordifferent synchronicity levels. B. The input was placed close to the apical trunkon five distal obliques (black arrows) and then systematically moved to the distalend of the obliques (blue and red arrows). The synapses were placed on the samefive obligues and moved out to the distal end of the obliques. The curves showfrom the bottom to the top the spike activity for proximal to distal position onthe oblique dendrite for different synchronicity levels. The distance from theapical trunk was 0 µm, 30 µm, 60 µm and 90 µm (from top to bottom). C. Onfive neighboring locations on the apical trunk, five synaptic inputs were placed.The synaptic input is moved out along the apical trunk. The figure shows spikesproduced when the input locations were moved from proximal (bottom) to distal(top) locations. D. Summary showing the highest synchronicity levels which theneuron can suppress for different spatial locations. The oblique dendrites arenumbered from 1 to 10 starting from the soma.

50 CHAPTER 8. RESULTS AND DISCUSSIONS
has not been studied. The differences between our findings and Gasparini et al.,(2004) may be explained by differences in resting membrane potential. In Paper IV,we demonstrated that selective suppression is strongest in the case of hyperpolar-ized membrane potential. In a study by Gasparini et al., (2004), on which Gonzálezet al. (2011) build, the membrane potential was depolarized by changing the ioniccomposition of the extracellular medium. Both the NMDA receptor and KA maycontribute to the reduction of synchronized input. The fast activation of KA will,as demonstrated in previously in the thesis, effectively reduce the amplitude of theEPSP, preventing the NMDA receptor from being released from its Mg block. KA
will therefore be associated with the fast AMPA component of the EPSP and maymodulate the effect of a subsequent slower NMDA component.

8.2. IN VITRO RECORDINGS SUPPORT THE SUPPRESSION OFSYNCHRONIZED INPUT 51
8.2 In vitro recordings support the suppression ofsynchronized input
In the previous chapter, computational simulation indicated that KA can selec-tively reduce the cellular response to highly synchronized synaptic input. I wantedto test the model prediction in an in vitro experiment. We therefore recently initi-ated collaboration with Silberberg and Planert in which we began experimentallyinvestigating the suppression of synchronized input by KA. In the experiment,we tried to mimic the simulation described in the previous section. In the modelsimulation, I placed a synchronous synaptic input on a distal dendrite. Experimen-tally, it is technically difficult to inject into or record from distal dendrites, so theexperiment was performed in the soma.
Table 8.1: in vitro experiment testing the cellular response to two levels ofsynchronized input, 100% and 98%. The experiment was preformed by Silberbergand Planert.
Input cell 1 cell 2 cell 3 cell 4Synchronized (#spikes) 10 21 13 26Semi–synchronized (#spikes) 15 29 15 29Reduction(%) 33 28 13 10
In the model, I recorded the current induced in the soma by the synaptic input ondendrites, and the current was used in the experiment. Two types of currents wereinjected, representing synchronized and semi–synchronized synaptic input. Themembrane potential was measured in the pyramidal cells during the experiment.The results are presented in Table 8.1. During synchronized input, cellular re-sponses decreased by 10–33% compared with semi–synchronized input. This resultsupports the simulation prediction.
Figure 8.6 shows traces of the injected current and the cellular response in termsof membrane potential. To avoid the effect of wash–out protein, which might alsomodulate KA, stimuli representing synchronized (100%) and semi–synchronized(98%) inputs were alternated. Despite the significantly higher amplitude of thecurrent in the synchronized case, the spike activity was lower. When the currentcorresponding to the semi–synchronized input was injected again, cellular activityreverted to the previous state. This indicates that cell excitability did not changeduring the experiment. The triggering of some spikes in the synchronized case wasdelayed compared with the semi–synchronized case; this is a well–known effect of

52 CHAPTER 8. RESULTS AND DISCUSSIONS
0 500 10000
1
2
3
4
Time (ms)
Cu
rre
nt
(pA
)
0 500 1000−80
−60
−40
−20
0
20
40
Time (ms)
Me
mb
ra
ne
po
ten
tia
l (m
v)
0 500 1000−80
−60
−40
−20
0
20
40
Time (ms)
0 500 10000
1
2
3
4
Time (ms)
Cu
rre
nt
(pA
)
0 500 1000−80
−60
−40
−20
0
20
40
Time (ms)
0 500 1000−80
−60
−40
−20
0
20
40
Time (ms)
Figure 8.6: Current and voltage traces from in vitro recordings. The tracesat the top show the current injected. On the left is the semi–synchronized caseand on the right is the synchronized case. The traces at the bottom show themembrane potential for various current injections into cell 2. From left to right:semi–synchronized, synchronized, semi–synchronized and synchronized. This isthe order the current was injected in the experiment. The experiment was pre-formed by Silberberg and Planert.
the KA current (Melnick, 2011). This supports our interpretation that the KA
current reduces the synchronized input.
In this section, I have tested the prediction that KA can suppress highly syn-chronized synaptic input. I am fortunate to have had the opportunity to test aprediction, derived from the results of a computational model, in an in vitro ex-periment. The outcome of the in vitro experiment showed that current injectionscorresponding to highly synchronized input generated fewer action potentials thandid semi–synchronized input, which supports the prediction. This result needs tobe complemented by additional recordings in more cells, since so far only four cellshave been recorded. I am still awaiting the control experiment in which blockingKA should lead to a loss of differential suppression.

8.3. ABILITY OF KA TO SUPPRESS SYNCHRONIZED INPUT AND THEIMPLICATION FOR COGNITIVE FUNCTIONS 53
8.3 Ability of KA to suppress synchronized input and theimplication for cognitive functions
CA1 pyramidal cells receive input from several pathways. Two of the major path-ways are the Schaffer collateral and the perforant pathways. The Schaffer collateralsproject from the CA3 to the oblique dendrites and the perforant pathway projectsfrom the entorhinal cortex to the most distal dendrites called tuft dendrites (seeFigure 8.7). Previously in the thesis, I have examined the integration of synchro-nized input placed on the oblique dendrites, representing input from the Schaffercollaterals. In this section, I will describe the implications for cognitive processingof the ability of KA to suppress synchronized input. Finally in this section, I willdiscuss how the perforant pathway can interact with Schaffer collateral input andthereby modulate the cell integration of synchronized synaptic input.
The perforant pathway
Schaffer collateral pathway
Figure 8.7: A schematic figure of the pyramidal cell and the placement ofthe synaptic input. For a given simulation, 5 oblique dendrites were selectedbased on the nature of the test. On each oblique dendrite, five synaptic inputswere added; represented in the figure with blue arrows. Additional input was alsoplaced on 11 distal tuft dendrites (green arrows).
KA suppression of dendritic sodium spikes (Paper IV)The dendritic integration properties of CA1 pyramidal neurons, related to dendriticsodium spike generation, have been discussed recently (Gasparini and Magee, 2006;González et al., 2011; Makara et al., 2009). Dendritic sodium spikes occur mainly

54 CHAPTER 8. RESULTS AND DISCUSSIONS
when the neuron receives highly synchronized synaptic input (Gasparini et al., 2004;Losonczy et al., 2008). Dendritic sodium spikes are common and more frequent thansomatic spikes especially during the sharp wave–ripple complex (Kamondi et al.,1998). These dendritic sodium spikes can generate a two–step integration process(Losonczy et al., 2008). The input is first integrated locally in the dendrite, where adendritic spike can be generated. Subsequently, a second integration step occurs inthe soma, where a somatic spike can be generated. In vivo, dendritic sodium spikesare strongly suppressed and do not always generate spikes in the soma (Kamondiet al., 1998), as is the case in vitro (Gasparini et al., 2004). I have examined thesuppression of dendritic sodium spikes in Paper IV. In that study, I investigated theinfluence of the spatial location of synaptic input on dendritic spike propagation.At distal input sites, dendritic sodium spikes were generated but did not invade theapical trunk dendrite (see Figure 8.8). Both my results and those of experimentalstudies (Gasparini et al., 2004; Makara et al., 2009) indicate that KA plays animportant role in suppression of dendritic sodium spikes.
Influence of input to tuft dendrites on dendritic integration(Paper IV)
Previously in the thesis, I examined highly synchronized input projecting via theSchaffer collateral pathway. In this section, I examine how the input, via the per-forant path, influences the CA1 pyramidal cell’s integration of synchronized synap-tic input via the Schaffer collateral pathway. The perforant pathway mediates notonly excitatory input, but also inhibition of the distal dendrites (Ang et al., 2005).Input from the entorhinal cortex interacts with the Schaffer collateral input andaffects the spike output in CA1 cells (Takahashi and Sakurai, 2009; Dudman et al.,2007; Ang et al., 2005). Since the perforant pathway has a relatively small directinfluence on spike activity, this pathway is postulated to have a modulatory func-tion (Otani et al., 1995; Dudman et al., 2007). I therefore placed either excitatoryor inhibitory input on the tuft dendrites to examine whether the suppression ofsynchronized synaptic input via the Schaffer collateral pathway was affected. Thedendritic integration of synchronized input was strongly influenced by the input onthe tuft (Figures 8.8 and 8.9). Both the suppression of dendritic sodium spikes (seeFigure 8.8) and the generation of somatic spikes (see Figure 8.9) were reduced whenexcitatory input was placed on the tuft dendrites, particularly at higher synchro-nization levels. Therefore, input on the tuft may regulate the CA1 cell’s dendriticintegration of synchronized input and the propagation of dendritic sodium spikes.The circuitry linking CA1, CA3, and the entorhinal cortex has led to the postulatethat CA1 neurons compare direct sensory information with memory traces from as-sociative hippocampal networks (Lisman, 1999). Our results indicate that if inputfrom the Schaffer collateral and perforant pathways coincides, this would reducethe suppression of both dendritic and somatic spikes.

8.3. ABILITY OF KA TO SUPPRESS SYNCHRONIZED INPUT AND THEIMPLICATION FOR COGNITIVE FUNCTIONS 55
Figure 8.8: Generation of dendritic spikes is influenced by the spatial locationof the input, conductance of KAand excitatory input to the tuft. Each figure inA, B, C and D show if a dendritic spike was generated in the apical trunk (50 mmfrom the soma) for different input configurations. Along top to bottom differenttraces correspond to distal to proximal input sites (A and C the radial axis andB and D the somato–dendritic axis). A and B show the spikes activity whenthe conductance of KAwas reduced by 25% (green curves) compared with control(blue curves). C and D show the spikes activity when the excitatory input wasadded to the tuft (black curves) compared with control (blue curves). Note thatdistal dendrites become more similar to proximal dendrites if the conductance ofKA is reduced or synaptic input was added to the tuft.
Discussion
In this section, I have mainly presented the results of Paper IV, which concernsthe dendritic integration of synchronized input. The main implication of Paper IVis that the ability of KA to modulate the cellular response to synchronized inputmay affect memory and learning. It is widely known that memory and learningare dependent on the strengthening of synapses (Sjöström et al., 2008). Long–term potentiation is one such mechanism that strengthens synapses and can beinduced by large EPSP and/or the back propagation of action potentials (Sjöströmet al., 2008). KA selectivity reduces large, rapid EPSP generated by synchronizedinput. The amplitude of the compound EPSP is reduced by KA, thereby activatingother voltage–dependent processes, such as calcium channels and NMDA receptors.
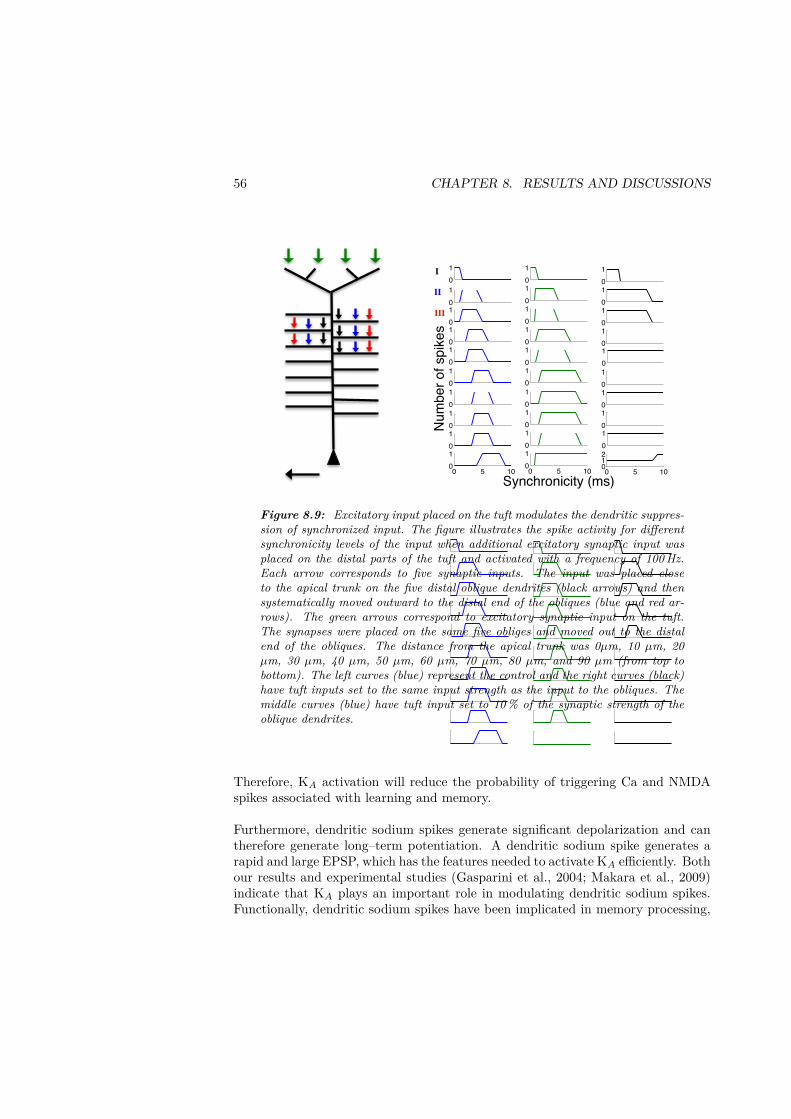
56 CHAPTER 8. RESULTS AND DISCUSSIONS
!"
#"
01
01
01
01
01
01
01
01
01
0 5 1001
Synchronicity (ms)0 5 10
0101010101
Num
ber o
f spi
kes
0101010101
01
01
01
01
01
01
01
01
01
0 5 1001
III
II
I
01
01
01
01
01
01
01
01
01
0 5 1001
Synchronicity (ms)
01
01
01
01
01
01
Num
ber o
f spi
kes
01
01
01
0 5 1001
01
01
01
01
01
01
01
01
01
0 5 10012
III
II
I
Figure 8.9: Excitatory input placed on the tuft modulates the dendritic suppres-sion of synchronized input. The figure illustrates the spike activity for differentsynchronicity levels of the input when additional excitatory synaptic input wasplaced on the distal parts of the tuft and activated with a frequency of 100Hz.Each arrow corresponds to five synaptic inputs. The input was placed closeto the apical trunk on the five distal oblique dendrites (black arrows) and thensystematically moved outward to the distal end of the obliques (blue and red ar-rows). The green arrows correspond to excitatory synaptic input on the tuft.The synapses were placed on the same five obliges and moved out to the distalend of the obliques. The distance from the apical trunk was 0µm, 10 µm, 20µm, 30 µm, 40 µm, 50 µm, 60 µm, 70 µm, 80 µm, and 90 µm (from top tobottom). The left curves (blue) represent the control and the right curves (black)have tuft inputs set to the same input strength as the input to the obliques. Themiddle curves (blue) have tuft input set to 10% of the synaptic strength of theoblique dendrites.
Therefore, KA activation will reduce the probability of triggering Ca and NMDAspikes associated with learning and memory.
Furthermore, dendritic sodium spikes generate significant depolarization and cantherefore generate long–term potentiation. A dendritic sodium spike generates arapid and large EPSP, which has the features needed to activate KA efficiently. Bothour results and experimental studies (Gasparini et al., 2004; Makara et al., 2009)indicate that KA plays an important role in modulating dendritic sodium spikes.Functionally, dendritic sodium spikes have been implicated in memory processing,

8.3. ABILITY OF KA TO SUPPRESS SYNCHRONIZED INPUT AND THEIMPLICATION FOR COGNITIVE FUNCTIONS 57
since they occur during sharp wave–ripple complex activity (Kamondi et al., 1998).This is supported by the fact that more dendritic sodium spikes are generated if arat is exposed to an enriched environment (Makara et al., 2009).
Furthermore, KA has been implicated in long–term potentiation (Ramakers andStorm, 2002; Chen et al., 2006) demonstrated that KA can reduce the back–propagating action potential and thereby prevent long–term potentiation. Our un-derstanding is somewhat different, in that we suggests that KA may also be involvedin affecting the amplitude of the forward–propagating dendritic EPSP/dendriticspike, and thereby potentially determine whether or not a somatic spike is gener-ated.
Limitations of the modelIn this section, I have examined the implications of the CA1 pyramidal cell den-dritic integration of synchronized input. Highly synchronized activity can occurduring the sharp wave–ripple complex. I have not developed synaptic input corre-sponds to the input during a sharp wave–ripple complex; instead, I have focusedon one specific important feature, i.e., highly synchronized input, during a sharpwave–ripple complex. A major reason for this is that the mechanisms that generateripples are not yet understood. It is debated whether sharp waves are generatedby excitatory input from CA3 (Ylinen et al., 1995) or whether gap junctions gen-erate high–frequency oscillation (Draguhn et al., 1998). Moreover, by focusing onsynchronized excitatory input, I have omitted the inhibitory input, which plays animportant role in generating a sharp wave–ripple complex.
Furthermore, calcium dynamics were not included in the CA1 cell model. Sincecalcium dynamics play an important role in generating long–term potentiation(Sjöström et al., 2008), it would be interesting to study the ability of KA to reducedendritic spikes in a cell model including calcium dynamics. Thus, the ability ofKA to suppress somatic spikes has been confirmed in a control model (Poirazi et al.,2003; Paper II) but not the suppression of dendritic spikes.

58 CHAPTER 8. RESULTS AND DISCUSSIONS
8.4 Ability of KA to suppress synchronized input and theimplications for pathological activity
Pathological hypersynchronous activity, i.e., fast ripples, has been identified as apossible signature marker of epileptogenic activity that may be involved in gener-ating seizures (Chiu et al., 2006; Bragin et al., 1999; Ochi et al., 2007; Urrestarazuet al., 2006). The ability to reduce hypersynchronous activity is therefore of greatimportance. Epilepsy has mainly been studied using network models (Soltesz andStaley, 2008), and seizures are ultimately a network phenomenon. In this study, Ihave taken a different approach by examining how network activity affects a singleneuron. I hypothesize that if the cellular response to hypersynchronous input isreduced, this would beneficially reduce epileptic activity.
Fast ripples modelled as spontaneous synchronized burst–typedischarges (Paper I)According to Dzhala and Staley (2004), spontaneous synchronization of burst pat-terns is the mechanism underlying fast ripple generation. In their study, theymeasured spontaneous bursts in hippocampal CA1 and CA3 pyramidal cells. Dur-ing fast ripple activity, the pyramidal cells reduced their ISI relative to controlconditions; in addition, the delay between the bursts approached zero.
Figure 8.10 shows a reduction in spike activity when KA is present in the fastripple model. Importantly, KA does not reduce activity in the event of normalspontaneous burst–type discharges, but suppresses fast ripple activity. When KA isnot present in the model, fast ripple input generates high spike activity. The currentthrough the KA channel is high at both the beginning and end of a fast ripple. Inthe middle, the current is low because the KA is not released from inactivationsince the membrane potential is depolarized between burst of inputs. Even thoughKA did not fully prevent the cell from becoming activated by fast ripple activity,reduced activity can be important in a recurrent network. In this type of network,KA could convert a positive to a negative feedback loop by reducing the number ofproduced spikes.
Fast Ripples Modelled as a Synchronous Ripple (Paper I)The model was based on data from an in vivo study by Ylinen et al. (1995), in whichthey measured several cells during ripple activity. Using their data, I constructed aripple input model, modelling the fast ripple as a ripple of enhanced synchronicity.However, as ripples have been studied fairly thoroughly, I was able to construct amodel of ripples. By increasing the synchronicity in the input to the ripple model,I generated a fast ripple model based on ripples with increase synchronization level.
During ripple activity, only 11% of the neurons participate in each ripple (Ylinen

8.4. ABILITY OF KA TO SUPPRESS SYNCHRONIZED INPUT AND THEIMPLICATIONS FOR PATHOLOGICAL ACTIVITY 59
0 50 100150
−50
0
50
Me
mb
ran
e
p
ote
ntia
l (m
V)
0 50 1001500
0.1
0.2C
urr
en
t
(m
A/c
m2)
0 50 100150
−50
0
50
Me
mb
ran
e
p
ote
ntia
l (m
V)
0 50 100 1500
0.1
0.2
Cu
rre
nt
(m
A/c
m2)
0 50 100 1500
0.5
1
Ga
tin
g
va
ria
ble
s
0 50 100150
−50
0
50
Time (ms)
Me
mb
ran
e
p
ote
ntia
l (m
V)
0 50 100 1500
0.1
0.2
Time (ms)
Cu
rre
nt
(m
A/c
m2)
0 50 100 1500
0.5
1
Time (ms)
Ga
tin
g v
aria
ble
s
A
B
C
Figure 8.10: Model 1: KA reduces response to fast ripple input. The firstcolumn represents the membrane potential measured in the soma. The secondcolumn represents the current through the KA channel measured at the locationwhere the synaptic input was added. The third column represents gating vari-ables of the KA channel measured at the location where the synaptic input wasadded. The black line represents activation and the red line inactivation. Atfive different distances from the soma ten synaptic input time series were added.The input time series for fast ripple model had the ISI: 3.8, 4.5, 4.9, 6.8, 7.2,8.6, 9, 10, 10, 10 and for control: 5, 7, 9, 10, 10, 10, 10, 10, 10, 10. In the fastripple case the ten synaptic time series were evenly distributed with the distance0.15ms and for control 2.5ms. A: Fast ripple with no KA present. B: Fastripple with KA present. C: Control. Note the reduction in spike activity in thefast ripple model when KA is present.
et al., 1995; Buzsaki et al., 1992). I focused on the neurons making up the core ofthe ripple and therefore used a frequency of 50Hz, adding ten synaptic input serieswith a frequency of 50Hz. The ten input time series were evenly distributed with atime delay of 0.3ms; the time delay of the control was 1.1ms (Ylinen et al., 1995).
Figure 8.11 shows that KA can prevent the cell from becoming activated by fast–ripple–generated input. The same figure shows the gating variable of KA. Slowinactivation is unable to keep up with the variation in the membrane potentialduring a fast ripple, resulting in increased current. As an extension, I increased theinput frequency to 100Hz, and KA still prevented the cell from becoming activatedby fast–ripple–generated input.

60 CHAPTER 8. RESULTS AND DISCUSSIONS
0 50 100 150
−50
0
50
Mem
bra
ne
pote
ntial (m
V)
0 50 100 1500
0.5
Curr
ent
(m
A/c
m2)
0 50 100 150
−50
0
50
Mem
bra
ne
pote
ntial (m
V)
0 50 100 1500
0.5
Curr
ent
(m
A/c
m2)
0 50 100 1500
0.5
1
Gating
variable
s
0 50 100 150
−50
0
50
Time (ms)
Mem
bra
ne
pote
ntial (m
V)
0 50 100 1500
0.5
Time (ms)
Curr
ent
(m
A/c
m2)
0 50 100 1500
0.5
1
Time (ms)
Gating
variable
s
0 50 100150
−50
0
50
Mem
bra
ne
pote
ntial (m
V)
0 50 100 150
−50
0
50
Mem
bra
ne
pote
ntial (m
V)
0 50 100 150
−50
0
50
Time (ms)
Mem
bra
ne
pote
ntial (m
V)
A
C
B
Figure 8.11: Model 2: KA reduces response to fast ripple input. At five dif-ferent distances from the soma ten synaptic input time series were added withvarious frequencies. The three first columns correspond to the simulation whenthe input frequency was 50Hz. The fourth column represents the membrane po-tential measured in the soma when the input frequency was 100Hz. The firstcolumn represents the membrane potential measured in the soma. The secondcolumn represents the current through the KA channel measured at the locationwhere the synaptic input was located. The third column represents gating vari-ables of the KA channel measured at the location were the synaptic input wasadded. The black line represents the activation and the red line represents in-activation. In the fast ripple model the ten synaptic time series were evenlydistributed with the distance 0.3ms and for control case (ripple) 1.1ms. A: Fastripple model with no KA present. B: Fast ripple model with KA present. C:Control. Note the reduction in spike activity in the fast ripple model when KA
is present.
Discussion
Both models, i.e., of spontaneous synchronized burst–type discharges and syn-chronous ripples, indicated that KA could reduce spike activity during fast rippleactivity. Fast ripples have been suggested to be involved in generating seizures(Engel et al., 2009). By suppressing fast ripples, KA could prevent the activityfrom spreading, possibly preventing a seizure. This mechanism is in contrast tothat of many antiepileptic drugs (Soltesz and Staley, 2008; Dichter and Brodie,1996), which downregulate cell excitability by targeting sodium channels or GABAreceptors. These antiepileptic drugs affect the cell during normal brain activity,thereby causing significant side effects. KA, on the other hand, mainly affects thecell when it is exposed to abnormally high synchronized input. In healthy indi-viduals, KA may serve to protect against fast ripple activity. In some patients

8.4. ABILITY OF KA TO SUPPRESS SYNCHRONIZED INPUT AND THEIMPLICATIONS FOR PATHOLOGICAL ACTIVITY 61
with epilepsy, this protection may be downregulated or dysfunctional, leading toincreased susceptibility to seizures. Other patients may have functional KA, butthe cell is exposed to abnormally high synchronized input due to other factors. Inboth these cases, upregulation of the KA current would be beneficial in reducingepileptogenic activity. Both the pharmacological treatment (Zona et al., 2002) andketogenic diet upregulate the KA current (Xu et al., 2008). Our results suggest thatthe beneficial effect is due to the reduced cellular response to highly synchronizedinput instead of a general downregulation of excitability.
A major limitation of the fast ripple model is that inhibitory synaptic input isomitted. If inhibitory synaptic input was added to the model, fast ripples might beeven more suppressed. In the model, between the fast ripples, the membrane doesnot return to the resting membrane potential, so the KA channel will be slightlymore inactivated for the next ripple. If inhibitory synaptic input were added to themodel, the membrane would more easily return to the resting membrane potentialor even lower, which could increase the KA current.
Another limitation of the model is that it does not include calcium dynamics, whichmay play a role when an input sequence is delivered and calcium can be accumulatedintracellularly.

62 CHAPTER 8. RESULTS AND DISCUSSIONS
8.5 Modulation of ion channels to functionally reversemodels of epilepsy
In the previous chapter, I demonstrated that KA can alter the neural integration ofsynchronized input by suppressing dendritic and somatic spikes. In normal condi-tions, the KA channel can reduce the cellular response to hypersynchronous synapticinput. However, in pathological conditions, the distribution and dynamic proper-ties of numerous ion channels will deviate from those of healthy control subjects,so the KA current may not be strong enough to suppress the cellular response tohypersynchronous synaptic input. I then asked whether the upregulation of KA, orany other channel, could alter the cellular response of a pathological cell such thatit resembled a healthy control cell. To study this, I derived models of epilepsy byimplementing alterations of ion channels linked with epileptogenesis (Papers II andIII).
Pathological models of epilepsy (Papers II and III)
The first pathological model involves an enhanced sodium current (Castro et al.,2001; Biervert et al., 1998), which was represented in the model by increasing thetransient sodium conductance. The second model of epilepsy addressed the down-regulation of the KA current (Vreugdenhil et al., 1996), represented by reducingthe KA conductance. The third case is related to the properties of KA in a patientwith temporal lobe epilepsy and was implemented using the measured biophysicalproperties of KA (Rüschenschmidt et al., 2004). All three pathological alterationsresulted in a hyperexcitable cell in general, particularly in the case of highly syn-chronized input (see Figure 8.12, 0–2ms).
Functional correction of pathological models (Papers II and III)
In Papers II and III, I focused on improving the functional behaviour of the neuronby modelling substances that target ion channels. Many substances modulate theKA channel, such as auxiliary proteins (An et al., 2000; Maffie and Rudy, 2008),kinases (Hoffman and Johnston, 1998; Varga et al., 2004), and PUFAs (Xu et al.,2008). In Papers II and III, I implemented several modulatory substances, alter-ing their relative concentrations until the pathological model’s cellular response tosynchronized input was consistent with that of the control model (no pathologicalalterations). To reverse pathological changes, in Paper II, I used a numerical opti-mizer to search for improved models. I chose the pattern search method developedby Hook and Jeeves (1961). The optimization method will be discussed in depth insection 8.7. In the next section, I will focus on the results and their implications.
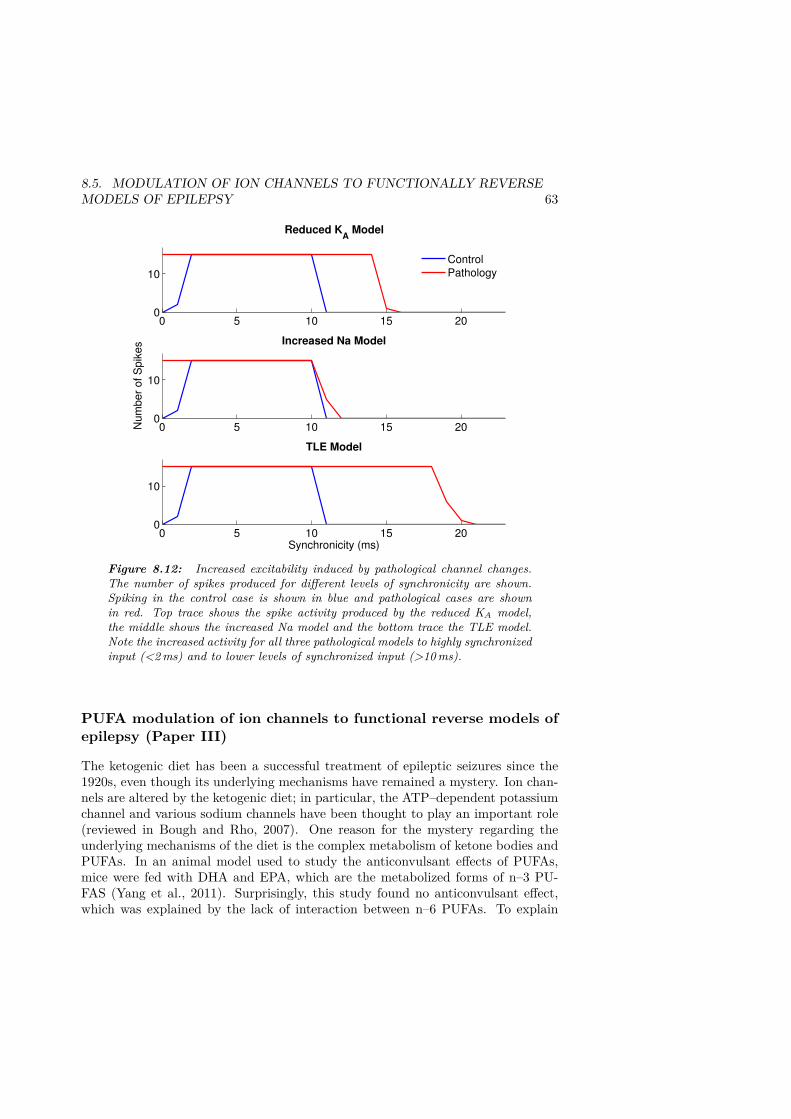
8.5. MODULATION OF ION CHANNELS TO FUNCTIONALLY REVERSEMODELS OF EPILEPSY 63
0 5 10 15 200
10
Num
ber
of S
pik
es Increased Na Model
0 5 10 15 200
10
TLE Model
Synchronicity (ms)
0 5 10 15 200
10
Reduced KA
Model
Control
Pathology
Figure 8.12: Increased excitability induced by pathological channel changes.The number of spikes produced for different levels of synchronicity are shown.Spiking in the control case is shown in blue and pathological cases are shownin red. Top trace shows the spike activity produced by the reduced KA model,the middle shows the increased Na model and the bottom trace the TLE model.Note the increased activity for all three pathological models to highly synchronizedinput (<2ms) and to lower levels of synchronized input (>10ms).
PUFA modulation of ion channels to functional reverse models ofepilepsy (Paper III)
The ketogenic diet has been a successful treatment of epileptic seizures since the1920s, even though its underlying mechanisms have remained a mystery. Ion chan-nels are altered by the ketogenic diet; in particular, the ATP–dependent potassiumchannel and various sodium channels have been thought to play an important role(reviewed in Bough and Rho, 2007). One reason for the mystery regarding theunderlying mechanisms of the diet is the complex metabolism of ketone bodies andPUFAs. In an animal model used to study the anticonvulsant effects of PUFAs,mice were fed with DHA and EPA, which are the metabolized forms of n–3 PU-FAS (Yang et al., 2011). Surprisingly, this study found no anticonvulsant effect,which was explained by the lack of interaction between n–6 PUFAs. To explain

64 CHAPTER 8. RESULTS AND DISCUSSIONS
the modulation of ion channels by the ketogenic diet, Xu et al. (2008) chose a dif-ferent approach. They used cerebral spinal fluid from children on a ketogenic dietas the extracellular solution in an expression system, investigating the alterationof potassium channels before and during the ketogenic diet. This was the startingpoint of the project resulting in Paper III. In collaboration with Fredrik Elinderand Sara Börjesson, we started a project to investigate how alteration related tothe ketogenic diet could reduce the hyperexcitability in cell models.
In the next part, I will discuss four ion channel alterations linked with the ketogenicdiets and their implications for hyperexcitability.
Sodium channelsPUFAs can modulate the Na channels by shifting the voltage dependence of chan-nel inactivation (Vreugdenhil et al., 1996). If the steady–state inactivation curveof the sodium channel could be shifted, the pathological cell models’ response tohighly synchronized input could be restored. However, the response to lower levelsof synchronized input was also suppressed (see Figures 8.13 and 8.14). If both thesteady–state activation and inactivation were instead shifted, the pathological mod-els became more hyperexcitable. Therefore, a more selective modulation of onlythe inactivation is preferable. Indeed, the general pattern of PUFA modulation ofNa channels is dominated by the effect on Na channel inactivation (Vreugdenhilet al., 1996).
Potassium channelsWhen PUFAs induced shifts in the KA channels’ voltage dependence (Xu et al.,2008) activation was implemented in the pathological model the cellular responseto highly synchronized input could be reduced without affecting lower levels of syn-chronized input (see Figures 8.13 and 8.14). Since KA activation and inactivationare strongly coupled, I also shifted both steady–state activation and inactivation.With a double shift, the pathological model could still be reversed such that thespike output resembled that of the control model (i.e., no pathological alterations)(see Figure 8.15). A shift in the KDR channel’s steady–state activation curve wasunable to reverse any of the pathological models.
Hyperpolarizing shift of the resting membrane potentialIn Paper III, I investigated whether a hyperpolarizing shift of the resting mem-brane potential would reduce the hyperexcitability to highly synchronized input(see Figures 8.13 and 8.146). This shift could be generated by several channels af-fecting the resting potential, such as the m–current, h–current, and KAT P current.KAT P alteration during the ketogenic diet has previously been discussed (Boughand Rho, 2007; Kim et al., 2007). I have demonstrated that the hyperpolariza-tion of the membrane potential, potentially caused by the KAT P channel, reducesthe cellular response to highly synchronized input while minimally affecting the
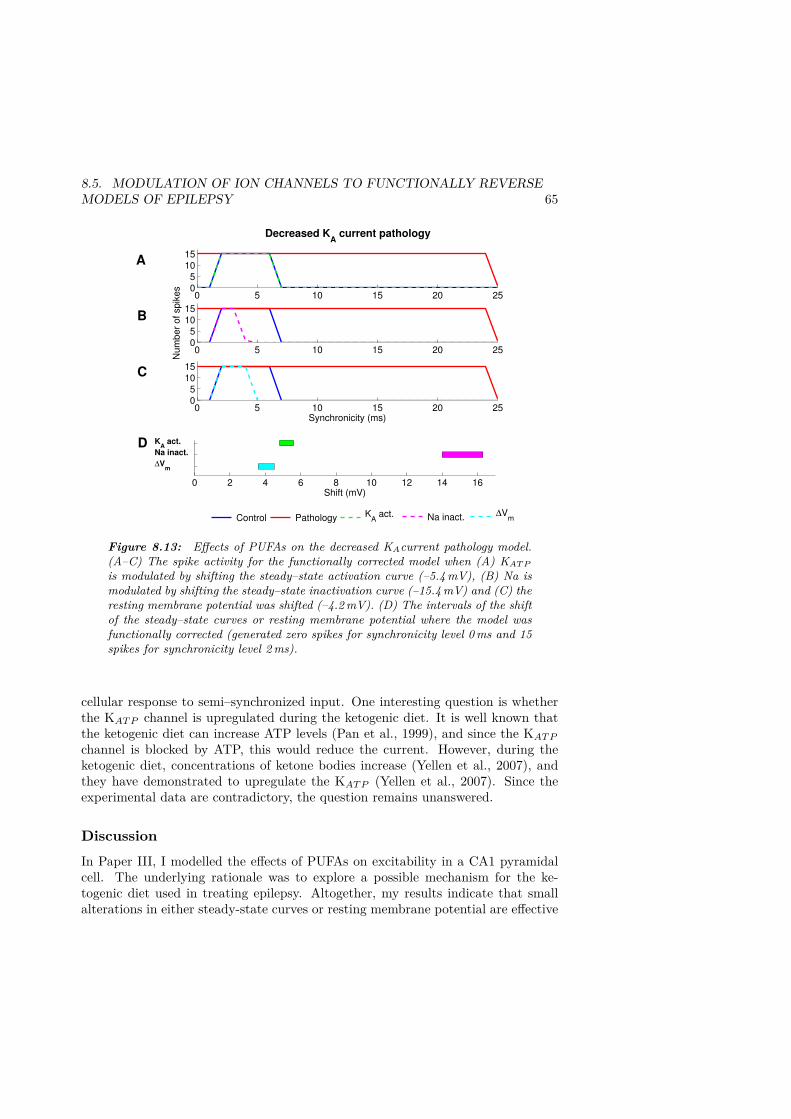
8.5. MODULATION OF ION CHANNELS TO FUNCTIONALLY REVERSEMODELS OF EPILEPSY 65
0 5 10 15 20 250
5
10
15
Decreased KA current pathology
0 5 10 15 20 250
5
10
15
Nu
mb
er
of
sp
ike
s
0 5 10 15 20 250
5
10
15
Synchronicity (ms)
data1 data2 ∆Vmdata1 data2 Na inact. Control Pathology K
A act.
0 2 4 6 8 10 12 14 16Shift (mV)
D
A
B
C
KA act.
Na inact.
∆Vm
Figure 8.13: Effects of PUFAs on the decreased KAcurrent pathology model.(A–C) The spike activity for the functionally corrected model when (A) KAT P
is modulated by shifting the steady–state activation curve (–5.4mV), (B) Na ismodulated by shifting the steady–state inactivation curve (–15.4mV) and (C) theresting membrane potential was shifted (–4.2mV). (D) The intervals of the shiftof the steady–state curves or resting membrane potential where the model wasfunctionally corrected (generated zero spikes for synchronicity level 0ms and 15spikes for synchronicity level 2ms).
cellular response to semi–synchronized input. One interesting question is whetherthe KAT P channel is upregulated during the ketogenic diet. It is well known thatthe ketogenic diet can increase ATP levels (Pan et al., 1999), and since the KAT P
channel is blocked by ATP, this would reduce the current. However, during theketogenic diet, concentrations of ketone bodies increase (Yellen et al., 2007), andthey have demonstrated to upregulate the KAT P (Yellen et al., 2007). Since theexperimental data are contradictory, the question remains unanswered.
DiscussionIn Paper III, I modelled the effects of PUFAs on excitability in a CA1 pyramidalcell. The underlying rationale was to explore a possible mechanism for the ke-togenic diet used in treating epilepsy. Altogether, my results indicate that smallalterations in either steady-state curves or resting membrane potential are effective

66 CHAPTER 8. RESULTS AND DISCUSSIONS
0 2 4 6 8 1005
1015
Increased Na current pathology
0 2 4 6 8 1005
1015
Num
ber
of spik
es
0 2 4 6 8 1005
1015
Synchronicity (ms)
control pathologt ∆Vmdata1 data2 Na inact. Control Pathology K
A act.
0 1 2 3 4 5 6 7 8Shift (mV)
A
B
C
D KA act.
Na inact.
∆Vm
Figure 8.14: Effects of PUFAs on the increased Na current pathology model.(A–C) The spike activity for the functionally corrected model when (A) KAT P
is modulated by shifting the steady–state activation curve (–1.6mV), (B) Na ismodulated by shifting the steady–state inactivation curve (–6.7mV) and (C) theresting membrane potential was shifted (–1.1mV). (D) The interval of the shiftof the steady–state curves or resting membrane potential where the model wasfunctionally corrected (generated zero spikes for synchronicity level 0ms and 15spikes for synchronicity level 2ms).
in reducing hyperexcitability, particularly with highly synchronized input. It wasan unexpected finding that a shift in the resting potential reduced the patholog-ical excitability without leading to a decrease in general excitability. In epilepsyresearch, the term “hyperexcitable” is used as a synonym for “pathological”. Theterm “hyperexcitable” is a general term not specific to the particular input providedto the cell. I have instead studied hyperexcitability to highly synchronized input,which is more relevant to epileptic activity. The results presented in Paper III, con-cerning the modulation of the KDR channel, exemplify the difference. Shifting thesteady–state activation of KDR could reduce the excitability for all synchronizationlevels, but no selective reduction of high synchronicity levels could be obtained.If the KDR channel were upregulated to reduce epileptic activity, it would gener-ate severe side effects, since it not only reduces the pathological hypersynchronousinput, but also lowers levels that are important for numerous functions in the body.
The combined effects on several ion channels imply that beneficial effects can be
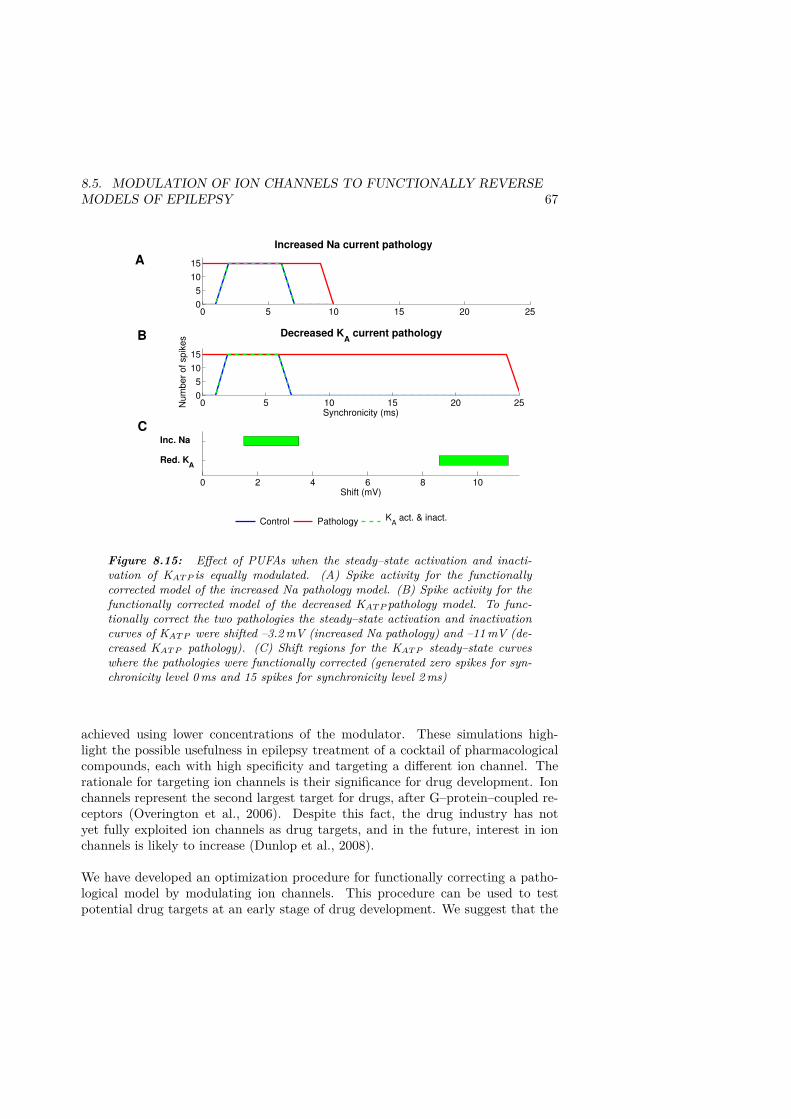
8.5. MODULATION OF ION CHANNELS TO FUNCTIONALLY REVERSEMODELS OF EPILEPSY 67
0 5 10 15 20 250
5
10
15
Increased Na current pathology
0 5 10 15 20 250
5
10
15
Synchronicity (ms)
Num
ber
of spik
es
Decreased KA current pathology
Control Pathology KA act. & inact.
0 2 4 6 8 10Shift (mV)
A
B
CInc. Na
Red. KA
Figure 8.15: Effect of PUFAs when the steady–state activation and inacti-vation of KAT P is equally modulated. (A) Spike activity for the functionallycorrected model of the increased Na pathology model. (B) Spike activity for thefunctionally corrected model of the decreased KAT P pathology model. To func-tionally correct the two pathologies the steady–state activation and inactivationcurves of KAT P were shifted –3.2mV (increased Na pathology) and –11mV (de-creased KAT P pathology). (C) Shift regions for the KAT P steady–state curveswhere the pathologies were functionally corrected (generated zero spikes for syn-chronicity level 0ms and 15 spikes for synchronicity level 2ms)
achieved using lower concentrations of the modulator. These simulations high-light the possible usefulness in epilepsy treatment of a cocktail of pharmacologicalcompounds, each with high specificity and targeting a different ion channel. Therationale for targeting ion channels is their significance for drug development. Ionchannels represent the second largest target for drugs, after G–protein–coupled re-ceptors (Overington et al., 2006). Despite this fact, the drug industry has notyet fully exploited ion channels as drug targets, and in the future, interest in ionchannels is likely to increase (Dunlop et al., 2008).
We have developed an optimization procedure for functionally correcting a patho-logical model by modulating ion channels. This procedure can be used to testpotential drug targets at an early stage of drug development. We suggest that the

68 CHAPTER 8. RESULTS AND DISCUSSIONS
optimization procedure be applied not only to neurons, but also to other organswith excitable cells, such as the heart and pancreas, where channelopathies arefound (Li et al., 2009).

8.6. MODELLING OF ACTION POTENTIAL CONDUCTION INPERIPHERAL NERVE CELLS 69
8.6 Modelling of action potential conduction in peripheralnerve cells
The main reason why the model of a silent C–fibre was developed was to studyvarious pain conditions due to peripheral axon hyperexcitability. Pain is a verysubjective concept that is difficult to measure. We therefore focused on modellingaction potential conduction, which is altered in several pain conditions (Serra et al.,2011; Ørstavik et al., 2003; Kiernan et al., 2005; Kanai et al., 2006). To experimen-tally determine the processes underlying changes in action potential conduction,measurements of membrane potential would be ideal. Unfortunately, intracellu-lar recordings are difficult since these fibres are thin and hard to locate in thetissue they innervate. Therefore, we set out to identify the processes underlyingactivity-dependent changes in single unmyelinated nerve fibres using computationalmodelling. In paper V, we have mainly focused on ADS and recovery cycles. Inthe next part of this section I will describe the result from the C-fibre modellingproject.
Activity–dependent slowing during repetitive stimulation (PaperV)In the model, action potential propagation along the C-fibre and latency changeswere measured (see figure 8.16. During repeated stimulation (2Hz), the propagationlatency increased from 212 ms to 289 ms generating a 36% reduction in propagationlatency (see figure 8.16). This can be compared to the experimentally obtainedvalue for ADS in humans, 36.7% (Obreja et al., 2010), and in pigs, 30.1% (Obrejaet al., 2010).
We also conducted a simulation with a lower frequency protocol, figure 8.16. Theresulting ADS magnitude after 0.125Hz, 0.25Hz and 0.5Hz (max ADS 8%) corre-sponds well to experimental results (Obreja et al., 2010).
Accumulation of sodium contributes to activity–dependent slowingThe simulations performed show that the concentration of intracellular sodium islikely to play a central role in ADS. In Figure 8.17, the concentration of intracel-lular sodium and extracellular potassium is illustrated during the ADS protocol.Intracellular sodium accumulation is considerable because the diameter and thusvolume of the axon is small and this results in a substantial reduction in the re-versal potential for sodium during the ADS protocol 8.17. To examine the extentto which this change in reversal potential of sodium contributes to ADS, the con-centrations of both intracellular sodium and extracellular potassium were clampedto their initial values. As can be seen in Figure 8.17, clamping the ionic concen-trations more or less abrogates ADS and the response latency stays constant. Tofurther examine the contribution of each sodium channel to the supernormal phase,the sodium reversal potential was held constant separately for the individual Na

70 CHAPTER 8. RESULTS AND DISCUSSIONS
1000 1100 1200 13000
125
Time (ms)Dis
tanc
e fro
m in
put s
ite1.805 1.806 1.807 1.808
x 105
0
125
Time (ms)Dis
tanc
e fro
m in
put s
ite
0 100 200 300 400200
250
300
Number of input
Late
ncy
(ms)
0 100 200 300 4000
20
40
Number of inputR
elat
ive
late
ncy
(%)
0 50 100210
220
230
0 50 1000
5
10
D
B
C
A
Figure 8.16: Activity–dependent slowing during the high–frequency protocol.(A) the membrane potential at the beginning of the repetitive stimulation and(C) and the end. (B) latency during repetitive stimulation (2Hz). (D) The la-tency during repetitive stimulation normalized with the initial latency.) Relativelatency changes for both the high–frequency (top: 360 pulses at 2Hz, 60 pulses at0.25Hz) and low–frequency (bottom: 20 pulses at 0.125Hz, 20 pulses at 0.25Hz,30 pulses at 0.5Hz, 20 pulses at 0.25Hz).
subtypes 1.7 and 1.8. The results are illustrated in Figure 8.17 and suggest that theincrease in intracellular sodium is largely attributable to NaV 1.8 Na current. Withthe reversal potential for NaV 1.8 held constant the amount of slowing is drasticallyreduced, while clamping reversal potential for NaV 1.8 results in an approximate30% reduction in ADS.
DiscussionThere are several hypotheses regarding the generation of ADS. One of the mostaccepted hypothesis is based upon slow inactivation of sodium channels, particu-larly NaV 1.8 since it is the largest sodium current (De Col et al., 2008; Blair andBean, 2002) and is responsible for generating the action potential. Our hypothesisbuilds upon accumulation of intracellular sodium, which would reduce the reversalpotential of sodium channels and thereby affect the propagation velocity.
Based on two experiments, slow inactivation of NaV 1.8 has been the most acceptedhypothesis. The first experiment showed that activity-dependent decrease of the
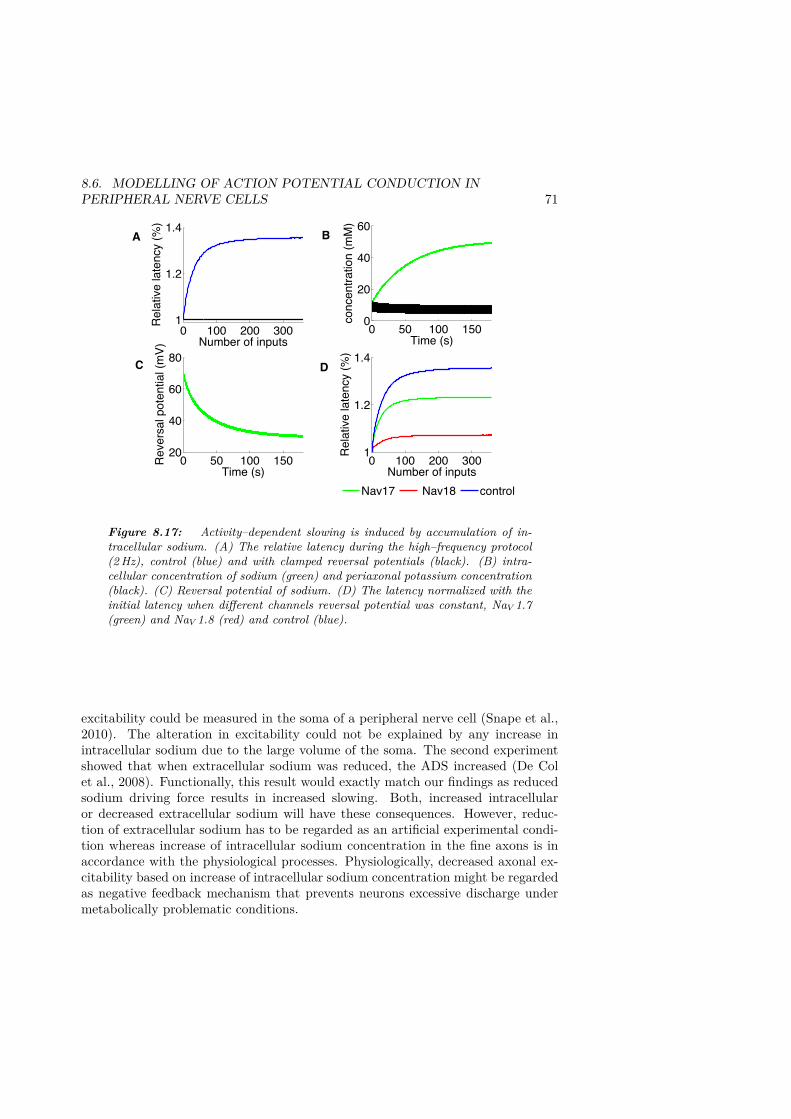
8.6. MODELLING OF ACTION POTENTIAL CONDUCTION INPERIPHERAL NERVE CELLS 71
0 100 200 3001
1.2
1.4
Number of inputs
Rel
ativ
e la
tenc
y (%
)
0 50 100 1500
20
40
60
Time (s)co
ncen
tratio
n (m
M)
0 50 100 15020
40
60
80
Time (s)
Rev
ersa
l pot
entia
l (m
V)
0 100 200 3001
1.2
1.4
Number of inputs
Rel
ativ
e la
tenc
y (%
)
Nav17 Nav18 control
A
C
B
D
Figure 8.17: Activity–dependent slowing is induced by accumulation of in-tracellular sodium. (A) The relative latency during the high–frequency protocol(2Hz), control (blue) and with clamped reversal potentials (black). (B) intra-cellular concentration of sodium (green) and periaxonal potassium concentration(black). (C) Reversal potential of sodium. (D) The latency normalized with theinitial latency when different channels reversal potential was constant, NaV 1.7(green) and NaV 1.8 (red) and control (blue).
excitability could be measured in the soma of a peripheral nerve cell (Snape et al.,2010). The alteration in excitability could not be explained by any increase inintracellular sodium due to the large volume of the soma. The second experimentshowed that when extracellular sodium was reduced, the ADS increased (De Colet al., 2008). Functionally, this result would exactly match our findings as reducedsodium driving force results in increased slowing. Both, increased intracellularor decreased extracellular sodium will have these consequences. However, reduc-tion of extracellular sodium has to be regarded as an artificial experimental condi-tion whereas increase of intracellular sodium concentration in the fine axons is inaccordance with the physiological processes. Physiologically, decreased axonal ex-citability based on increase of intracellular sodium concentration might be regardedas negative feedback mechanism that prevents neurons excessive discharge undermetabolically problematic conditions.

72 CHAPTER 8. RESULTS AND DISCUSSIONS
0 50 100 150100
50
0
50
Mem
. pot
. (m
V)0 50 100 150
100
50
0
50
0 50 100 150100
50
0
50
300 350 400100
50
0
50
Time (ms)
Mem
. pot
. (m
V)
300 350 400100
50
0
50
Time (ms)300 350 400
100
50
0
50
Time (ms)
0 50 100 150 200 2505
0
5
10
15
Interspike interval (ms)
Slow
ing/
spee
ding
(ms)
2 Hz1 Hz0.5 Hz
end ofparent
beginningof branch
10 ms50 ms100 msA
B
Figure 8.18: The slowing/speeding for different interspike intervals. The fig-ure shows the slowing/speeding during the recovery cycle protocol RC1. Thefrequency is 2Hz and the inter spike interval vary between 10–250ms. (A) Themembrane potential for different inter spike intervals. The upper graphs repre-sent the membrane potential in the beginning of the branch axon and the lowerat the end of parent axon. (B) The slowing/speeding for different inter spikeintervals.
Recovery cycles (Paper V)
Simulations were performed using stimulus pulses at variable inter-stimulus inter-vals and at different base frequencies (Figure 8.18). Changes in membrane potentialat the stimulation site (top) and at the end of the parent axon (bottom) are shownin Figure 8.18. In Figure 8.18 the effect of repetition frequency on the recovery cy-cle is shown. The overall trend of the change in latency of the second pulse relativeto the first pulse corresponds well to experimental findings (Weidner et al., 2002;Bostock et al., 2003). In particular, subnormality (decreased conduction velocity) isobserved at small ISI values followed by a supernormal phase for intermediate ISIs(peak around 40ms; experimental range of peak 20-200ms) and a second phase ofsubnormality for large ISI values. An increase in the magnitude of the supernormalphase was also observed with increasing repetition frequency
The ion channels generating the supernormal phaseTo elucidate the mechanisms behind generating the supernormal phase, relative

8.6. MODELLING OF ACTION POTENTIAL CONDUCTION INPERIPHERAL NERVE CELLS 73
0 20 40 60 80
5
0
5
Number of inputs
Slo
win
g/s
peedin
g (
ms)
0 20 40 60 80
10
5
0
5
10
15
Number of inputs
Slo
win
g/s
peedin
g (
ms)
20 40 60 80
10
5
0
5
Intracellular sodium (mM)
Slo
win
g/s
peedin
g (
ms)
70 65 60 555
0
5
10
Resting potential (mV)
Slo
win
g/s
peedin
g (
ms)
control
Nav1.7
Nav1.8
Vrest
Currrentinjection.
A B
C D
Figure 8.19:Induced super normal phase due to accumulation of intracellular sodium. Thefigure shows the supernormal phase during the RC2. The frequency is 2Hz andthe inter spike interval 50ms for A and B. (A) the supernormal and when theconcentrations of sodium and potassium was clamped to the initial value (blackcurve). (B) Supernormal phase when clamping the reversal potential for theNaV 1.7 (green) or NaV 1.8 channel (red). (C) Supernormal phase for one dou-ble pulse when the initial value of the intraaxonal sodium concentration wasvaried. (D) Supernormal phase for one double pulse when the resting potentialwas altered with a current injection (blue) and by altering the leak conductance(blue).

74 CHAPTER 8. RESULTS AND DISCUSSIONS
changes in the conduction velocity of 2 action potentials initiated at a 50ms inter-val was examined (8.19). The involvement of ionic concentrations was confirmed byclamping both sodium and potassium concentrations to their initial values and thisabrogated and relative changes in conduction speed (Figure 8.19). To further studythe role of intracellular sodium, simulations were performed using different intracel-lular sodium concentrations with the result that values of intracellular Na greaterthan ca.15mM were linked with reduced conductance velocity (Figure 8.19). Basedon this results we propose that increased intracellular sodium concentration con-stitutes a necessary condition for the appearance of a supernormal phase. Changesin intracellular sodium concentration lead to a change in the reversal potential ofsodium and to subsequent reductions in the magnitude of sodium currents. Tofurther study the role of specific NaV subtypes, the sodium reversal potential wasclamped for NaV 1.7 or NaV 1.8 individually (Figure 8.19). A complex relation-ship then manifests between Na channel subtypes and the supernormal phase withclamped NaV 1.8 leading to a pronounced supernormal phase and clamped NaV 1.7tending toward a reduction in conductance velocity.
DiscussionThe most accepted hypothesis today proposes that passive properties of the mem-brane potential generate the after–depolarisation (Bostock et al., 2003). After–depolarisation has been measured in hyperpolarized myelinated axons (Barrett andBarrett, 1982) and is the foundation on which this hypothesis is built upon. Moreconvincing evidence was presented in a study by Bowe et al. (1987), where theafter–depolarisation was correlated with reduction in excitability with very similardynamics as measured during recovery cycle protocol. Our model results are con-sistent with the interpretation that the after-depolarization is correlated with ADSduring the repetitive stimulations. However, the main contribution to supernor-mal phase originates from reduced reversal potential of potassium after an actionpotential (see Paper V).
Furthermore, in the study of Moalem-Taylor et al. (2007), current injections wereused to depolarize the membrane and study the effect on the supernormal phase.Their findings that supernormal phase increases with depolarization was interpretedas a support for the hypothesis of the ADP as the mechanism of the supernormalphase. However, our study shows that shifting the membrane potential also leadsto a change in intracellular ion concentration, and we further show that this changeis the determining factor. Finally, as both ADS and supernormal phase depends onchanges of intracellular sodium, a possible mechanism explaining the relationshipbetween the supernormal phase and ADS may have been identified.

8.7. PARAMETER SEARCH IN DETAILED MULTICOMPARTMENTMODELS 75
8.7 Parameter search in detailed multicompartment models
Parameter search methods have been used frequently in this thesis to identify pa-rameters in detailed compartmental. Parameter search is a tool for identifying“unknown” and “free” parameters. An unknown parameter, such as the conduc-tance of a specific ion channel, is actually known to have a specific value, though thisspecific value is in fact unknown. Therefore, the specific model value of an unknownparameter cannot be defined arbitrarily. Free parameters are parameters that canhave a range of values, such as the concentrations of modulatory substances. Suchparameters may therefore be assigned parameter values more freely. Identifying thecorrect value of an unknown parameter is much more time consuming than simplyassigning a free parameter a plausible value that satisfies a functional behaviour.
When developing detailed compartmental models, the number of unknown param-eters is large and the constraints are few. This is especially true for multicompart-ment models of neurons, incorporating multiple ion channels (Migliore et al., 2008;Poirazi et al., 2003; Larkum et al., 2009). Until recently, the traditional approachhas been to tune the model parameter manually (Van Geit et al., 2007). There aretwo drawbacks to this approach: first, it requires considerable effort and, second,the researcher has a natural tendency to tune the model subjectively. The mostcommonly used parameter search methods for identifying parameters in detailedmulticompartment models are evolutionary and genetic algorithms (Hendricksonet al., 2011; Van Geit et al., 2007; Vanier and Bower, 1999). One disadvantage ofboth these methods is that they require a large number of iterations to reach con-vergence. A comparison of various parameter search methods (Vanier and Bower,1999) identified the genetic algorithm as the most effective algorithm for multicom-partment models. However, approximately 6000 iterations were required to reachconvergence. For the problems presented in this thesis, neither genetic nor evolu-tionary search algorithms could be applied, due to the excessive simulation timerequired. In the following section, I will describe the results of the parameter searchprojects forming part of this thesis.
Functionally reverse models of epilepsy by parameter searchmethods (Paper IIMy second project as a PhD student was to identify a parameter search methodsuitable for detailed compartmental models. The goal of the project was to iden-tify parameters that generated a specific spike output. In Paper II, I developedpathological models of epilepsy with the main objective of correcting the pathol-ogy by reducing the excess spiking, particularly at high synchronization levels (seeFigure 8.20, red curve). In the control model (no pathological alteration), thecellular response to highly synchronized input (0–2ms) is suppressed (see Figure8.20, blue curve). If the spike activity in the pathological model is excessivelysuppressed, it will not generate spikes for any input, regardless of synchronization

76 CHAPTER 8. RESULTS AND DISCUSSIONS
0 5 10 150
5
10
15
Synchronicity (ms)N
umbe
r of s
pike
s
controlpathology
Pathological PathologicalGenerate no spikesfor any synchronicity level of the input
Functionallycorrectedmodel
A
BGenerate excess spiking for high synchroncity levelsof the input
Relative effect of PUFA
Figure 8.20: Schematic figure showing the procedure to functionally correcta pathological model. The pathological models generate excess spiking for bothhigh and low levels of synchronicity. To functionally correct the pathologicalmodel the spike generation for different synchronicity levels should be similarthe control model, for high synchronicity levels in particularly. If the activity inthe pathological model is suppressed too much the cell will not respond to anysynchronicity level of the input and therefore be classified as pathological. A showthe spike activity for different synchronicity levels of the input for the control(blue) and pathological model (red). B Schematic figure defining the interval ofPUFA within which the pathological model is functionally corrected.
level. Therefore, there may be an interval within which the pathological model sup-presses highly synchronized input, while still generating spikes for less synchronizedinput (see Figure 8.20). We decided to examine whether the modulatory featuresfound in various subtypes of the auxiliary proteins KChIPs and DPPs (An et al.,2000; Maffie and Rudy, 2008) would reverse the pathological models. Not only doesthe current of the KAchannel depend on the subtype composition of its auxiliaryproteins, but also its kinetic properties are altered following, for example, phos-phorylation. I therefore extended my analysis to include modulatory alterations ofPKC (Hoffman and Johnston, 1998) and CaMKII (Varga et al., 2004) and the lipidmodulator arachidonic acid (AA) (Angelova and Müller, 2006). Thus, the relativeconcentrations of these modulator substances, i.e., KCHIP1, DPP6, PKC, AA, andCaMKII, were controlled by a numerical optimizer, which compared model outputwith a predefined neural output representing a normal physiological response.
The next step was to construct the cost function, which as a starting point was
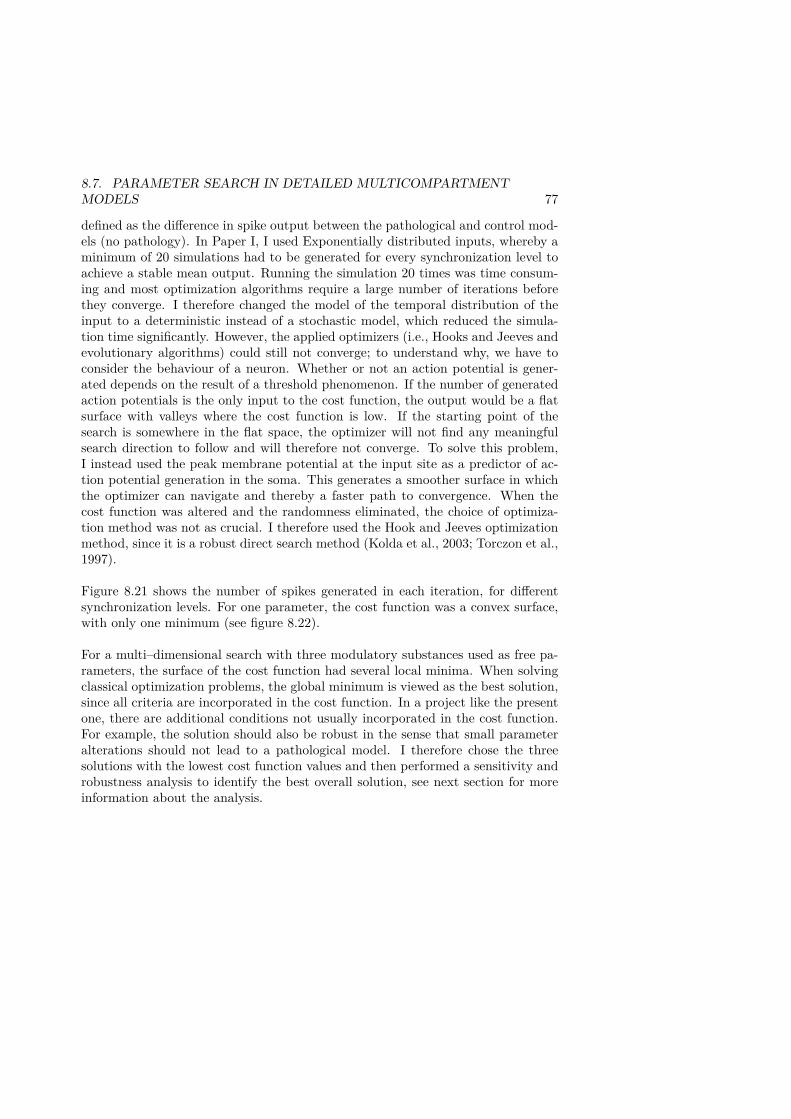
8.7. PARAMETER SEARCH IN DETAILED MULTICOMPARTMENTMODELS 77
defined as the difference in spike output between the pathological and control mod-els (no pathology). In Paper I, I used Exponentially distributed inputs, whereby aminimum of 20 simulations had to be generated for every synchronization level toachieve a stable mean output. Running the simulation 20 times was time consum-ing and most optimization algorithms require a large number of iterations beforethey converge. I therefore changed the model of the temporal distribution of theinput to a deterministic instead of a stochastic model, which reduced the simula-tion time significantly. However, the applied optimizers (i.e., Hooks and Jeeves andevolutionary algorithms) could still not converge; to understand why, we have toconsider the behaviour of a neuron. Whether or not an action potential is gener-ated depends on the result of a threshold phenomenon. If the number of generatedaction potentials is the only input to the cost function, the output would be a flatsurface with valleys where the cost function is low. If the starting point of thesearch is somewhere in the flat space, the optimizer will not find any meaningfulsearch direction to follow and will therefore not converge. To solve this problem,I instead used the peak membrane potential at the input site as a predictor of ac-tion potential generation in the soma. This generates a smoother surface in whichthe optimizer can navigate and thereby a faster path to convergence. When thecost function was altered and the randomness eliminated, the choice of optimiza-tion method was not as crucial. I therefore used the Hook and Jeeves optimizationmethod, since it is a robust direct search method (Kolda et al., 2003; Torczon et al.,1997).
Figure 8.21 shows the number of spikes generated in each iteration, for differentsynchronization levels. For one parameter, the cost function was a convex surface,with only one minimum (see figure 8.22).
For a multi–dimensional search with three modulatory substances used as free pa-rameters, the surface of the cost function had several local minima. When solvingclassical optimization problems, the global minimum is viewed as the best solution,since all criteria are incorporated in the cost function. In a project like the presentone, there are additional conditions not usually incorporated in the cost function.For example, the solution should also be robust in the sense that small parameteralterations should not lead to a pathological model. I therefore chose the threesolutions with the lowest cost function values and then performed a sensitivity androbustness analysis to identify the best overall solution, see next section for moreinformation about the analysis.

78 CHAPTER 8. RESULTS AND DISCUSSIONS
0 1 2 3 40
20
40
60
80
100
120
Iteration
Cos
t fun
ctio
n
0.2 0.4 0.6 0.8 10
20
40
60
80
100
120
Relative concentration of DPP6
Cos
t fun
ctio
n
0 5 10 150
5
10
15
Synchroncity (ms)N
umbe
r of s
pike
s285 290 295 300
60
40
20
0
Time (ms)
Mem
bran
e
po
tent
ial (
mV
)
Costfunc. =sumi((D)2)i : differentsynchronicitylevels
} D!"
#"
$
%
Figure 8.21: Presentation of the optimization procedure. A. Result of theoptimization procedure. The starting point of the optimization is the pathologicalmodel (red) and the goal is the control model (blue). For illustration, spikeactivity for each iteration during the optimization is also shown (dashed lines).Actual solution found is indicated in green. Each colour in A, C, D correspondsto the same iteration cycle. B–D illustrates the optimization cycle. B. Dendritemembrane potential produced in a control case (blue) and a pathological case(red). The difference in peak EPSP amplitude at the input site for the firstand second input cycles were used to calculate the cost function value. C. Thecost function value for each iteration during the optimization. D. The relativeconcentration of DPP6 for each iteration of the optimization.
Parameter search methods used in the C–fibre model (Paper IV)
In the C–fibre model, we developed a spatial implementation of a C–fibre as adetailed compartmental model. In tuning this compartmental model, the membranepotential obtained from intracellular recordings was an important model constraint.However, as the C–fibre is too thin to preform intracellular recordings, intracellularrecordings of the membrane potential have instead frequently been made in thesoma of the C–fibre. As a starting point, we therefore assumed that the channelconductance and channel dynamics were the same as in the soma. We used theHook and Jeeves optimization method to find the conductance levels that wouldgenerate ADS (see Figure 8.23).

8.7. PARAMETER SEARCH IN DETAILED MULTICOMPARTMENTMODELS 79
0 0.5 1 1.5 20
500
1000
1500
2000
2500
3000
The relative concentration of KChIPI
Cos
t fun
ctio
n va
lue
Figure 8.22: Local minimum. The cost function for different values of therelative concentration of KChIP1. The allowed interval for KChIP1 is form 0–2a.u. Observe that it only exists one minima for the allowed interval
Figure 8.23: Improved activity–dependent slowing by optimization. The con-ductances of the three ion channel: NaV 1.9, NaV 1.8, NaV 1.7 and membraneresting potential was chosen as input parameter to the optimizer.

80 CHAPTER 8. RESULTS AND DISCUSSIONS
Considerable effort was made to reduce the model complexity and simulation time.The simulation running time of the full ADS protocol is approximately 3 min,which is extremely long for a detailed compartmental model. Therefore, both themorphology and the input protocols were simplified. However, most of the simplifiedmodels did not make correct predictions compared with those of the original model.The output of the most successful simplified model is shown in Figure 8.23. Thismodel version used a slightly simplified morphology, reducing simulation time bya factor of seven. The ADS curve was just one criterion of the model, but theother constraints could not be fully incorporated into the cost function. Therefore,manual tuning was used in parallel with parameter search methods.
How do we know we have found the right parameters? (Paper II)Vanier et al. (1999) compared the effectiveness of various parameter search meth-ods. Interestingly, different parameter search methods arrived at different solutions,leading to the question of how we are able to know whether we have identified theright parameters. The correct identification of an unknown parameter is the valuerepresenting the global minimum of the cost function. For many models, this is toocomputationally demanding to establish. In Paper II, I addressed this problem byfirst identifying the three solutions with the lowest cost function and subsequentlyselecting one manually, by means of additional constraint and robustness analyses(see section 8.8). To generate multiple solutions, I ran the optimizer several timesusing starting points far from previously identified solutions, repeating this exerciseuntil the optimizer found only previously identified solutions. In my experience,this is an effective approach if the parameter interval is well defined and relativelysmall.
A third approach is to generate predictions from the model and then test themexperimentally. No matter what the outcome of the experiment, this will in someway improve or strengthen the model. During my research work, we have alsotried to establish close collaborations with experimentalists, since I believe this tobe the only way to generate valid and relevant models. In this thesis, one modelprediction has been tested and confirmed experimentally. In Paper I, my modelpredicted that the A–type potassium channel could suppress highly synchronizedinput. This prediction was tested in an electrophysiological experiment in a layerof five pyramidal cells. The model applied in Paper I–IV further predicted that theKA channel would reduce highly synchronized input without reducing lower levelsof synchronized input. This prediction was supported in an in vitro experiment,constructed in collaboration with Silberberg and Planert.
DiscussionIn conclusion, I used parameter search methods to identify ion channel conductancelevels and channel kinetics. Parameter search methods have been used frequently

8.7. PARAMETER SEARCH IN DETAILED MULTICOMPARTMENTMODELS 81
in recent years in identifying conductance parameters, whereas it is unusual to alterthe ion channel kinetics. The experimental recordings of ion channel characteristicshave several sources of error (see section 3.4). Therefore, ion channel characteristicscan be altered consistently with experimental data to improve the model.

82 CHAPTER 8. RESULTS AND DISCUSSIONS
0 2 4 6 8 10 12 14 16 180
5
10
15
Synchronicity (ms)
Num
ber o
f spi
kes
0 1 2 3 4 5 6 7 80
1
2
3
4
Firs
t ord
er
sens
itivi
ty in
dex
0 1 2 3 4 5 6 7 80
50
100
150
Varia
nce
(num
ber o
f spi
kes)
inactivation time constant steady state activation steady state inactivation
control pathology steady state inact. inact. time const. steady state act.
A
B
C
Figure 8.24: Sensitivity analysis. (A) Variance–based sensitivity analysisof the corrected increased Na model corrected by DPP6. Interval of variationwas +-10% of the parameter interval. (B) Variance of spike activity (non–normalized sensitivity index) when the effects from DPP6 on the KA channelwere varied one at a time. (C) Spike activity is shown when one modulationproperty at a time (out of the three included) was omitted in the functionallycorrected model of reduced Na pathology corrected by DPP6. Spike activity inthe pathological model with increased Na (red), and the control model (blue) areshown. The dotted curves represents cases where one modulation was omitted,showing inactivation time constant (green), steady–state activation (black) andsteady–state inactivation (purple).
8.8 Sensitivity and robustness analysis
When a model has been derived, the uncertainty in the parameter values can beanalysed by means of sensitivity analysis. In the next sections, I will discuss theconclusions drawn from the use of sensitivity analysis.
Variance–based sensitivity analysis (Saltelli, 2004) illustrates the relative influenceof various parameters on a specific behaviour of the model. In Paper II, I usedvariance–based sensitivity analysis to examine the influence of the modulatory sub-stances on spike generation at different synchronization levels. The modulatorysubstance, DPP6, shifted both the steady–state activation and inactivation as wellas altered the inactivation time constant. Using variance–based sensitivity analysis,I could identify that the shift in steady–state activation was contributing the mostto reversing the pathological model (see Figure 8.24).
Variance–based sensitivity analysis is a useful method, but measures the influence
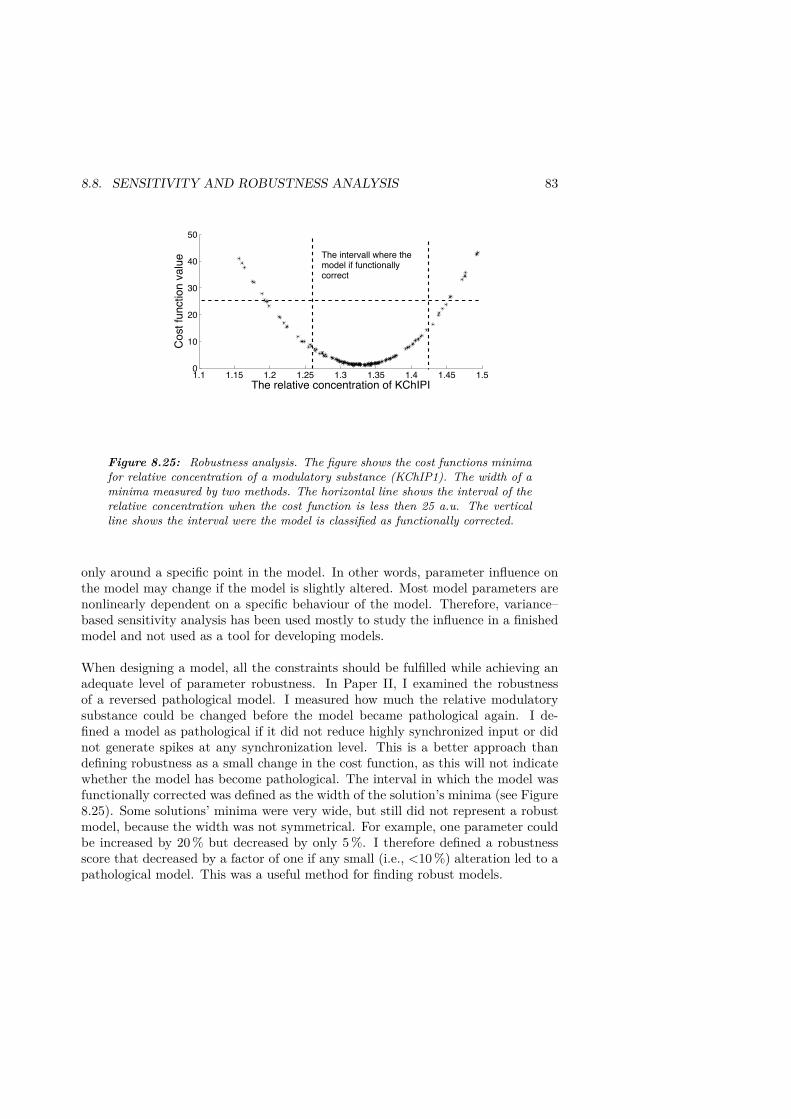
8.8. SENSITIVITY AND ROBUSTNESS ANALYSIS 83
The relative concentration of KChIPI
Cos
t fun
ctio
n va
lue
1.1 1.15 1.2 1.25 1.3 1.35 1.4 1.45 1.50
10
20
30
40
50
The intervall where the model if functionally correct
Figure 8.25: Robustness analysis. The figure shows the cost functions minimafor relative concentration of a modulatory substance (KChIP1). The width of aminima measured by two methods. The horizontal line shows the interval of therelative concentration when the cost function is less then 25 a.u. The verticalline shows the interval were the model is classified as functionally corrected.
only around a specific point in the model. In other words, parameter influence onthe model may change if the model is slightly altered. Most model parameters arenonlinearly dependent on a specific behaviour of the model. Therefore, variance–based sensitivity analysis has been used mostly to study the influence in a finishedmodel and not used as a tool for developing models.
When designing a model, all the constraints should be fulfilled while achieving anadequate level of parameter robustness. In Paper II, I examined the robustnessof a reversed pathological model. I measured how much the relative modulatorysubstance could be changed before the model became pathological again. I de-fined a model as pathological if it did not reduce highly synchronized input or didnot generate spikes at any synchronization level. This is a better approach thandefining robustness as a small change in the cost function, as this will not indicatewhether the model has become pathological. The interval in which the model wasfunctionally corrected was defined as the width of the solution’s minima (see Figure8.25). Some solutions’ minima were very wide, but still did not represent a robustmodel, because the width was not symmetrical. For example, one parameter couldbe increased by 20% but decreased by only 5%. I therefore defined a robustnessscore that decreased by a factor of one if any small (i.e., <10%) alteration led to apathological model. This was a useful method for finding robust models.


Chapter 9
Future work
In this thesis, I have studied the effects of ion channels on excitability linked withpathological conditions. A major reason why I examined ion channels is that theyare the targets of numerous medical drugs. In my projects, I have been able tolink ion channels with pathological conditions. In some of my projects, I haveeven modelled substances that alter ion channels, and considered their effect ona pathological condition. Targeting the proper combination of such modulatorysubstances would be of interest in drug development.
I have provided a mechanism, the KA channel, that may reduce the synchronizedinput implicated in epileptic activity. In an in vitro experiment, we demonstratedthat highly synchronized input is suppressed compared with semi–synchronized in-put. We are planning another in vitro experiment in which KA is blocked. Theoutcome of this experiment could demonstrate whether KA is responsible for re-ducing synchronized input.
In the future, I would like to test whether KA can reduce both the highly syn-chronized and fast–ripple inputs to a network model. The network should includepyramidal cells and inhibitory interneurons. In a recurrent network, small effectsat the single cell level can be significant for overall network activity.
In Paper IV, I examined the dendritic integration of highly synchronized input.The study predicts that KA can selectively reduce the cellular response to highlysynchronized input and thereby possibly modulate long–term potentiation. As anext step, I would like to test this prediction in a network model incorporatingsynaptic plasticity. One important feature of the network is that the cell modelsneed to be relatively detailed, since the ability of KA to reduce highly synchronizedinput is more prominent in distal dendrites. In simplified models, the suppressionof highly synchronized input by KA would be reduced or non–existent.
85

86 CHAPTER 9. FUTURE WORK
The purpose of developing the C–fibre model was to study functional behaviourslinked with chronic pain. Studying pathological conditions using a computationalmodel calls for a control model. The control model contributed to my research byproposing the mechanisms underlying two functional behaviours, ADS and the su-pernormal phase. As a next step, I would like to implement a pathological versionof the C–fibre model in a fashion similar to the way I implemented the epilepsymodels. In the pathological model of hyperexcitable C–fibre, I would like to im-plement the modulatory substances that can make the pathological model outputresemble that of the healthy control model.

Chapter 10
Appendix–experimentalprocedures
Parasaggital slices (300 µ m thick) were obtained from young rats (PN 14–18) inaccordance with the guidelines of the Stockholm municipal committee for animal ex-periments. Slices were cut in an ice–cold extracellular solution, kept in 35 ◦C for 30minutes, and then moved to room temperature before recordings. Whole–cell patchrecordings were obtained from neocortical and striatal neurons at a temperature of35 +- 0.5 ◦C. Recorded neurons were selected visually using IR–DIC microscopy(Zeiss Axioskop, Oberkochen, Germany). The extracellular solution (both for cut-ting and recording) contained (in mM) 125 NaCl, 25 glucose, 25 NaHCO3, 2.5 KCl,2 CaCl2, 1.25 NaH2PO4, 1 MgCl2. Recordings were amplified using multiclamp700B amplifiers (Molecular Devices, CA, USA), filtered at 2 KHz, digitized (5–20KHz) using ITC–18 (Instrutech, NY,USA), and acquired using Igor Pro (Wavemet-rics, OR, USA). Patch pipettes were pulled with a Flamming/Brown micropipettepuller P?97 (Sutter Instruments Co, Novato, CA) and had an initial resistance of5–10M, containing (in mM) 110 K-gluconate, 10 KCl, 10 HEPES, 4 ATP, 0.3 GTP,10 phosphocreatine, and 0.4–0.5% biocytin. Liquid junction potential (10mV) wasnot corrected in any of the recordings. Recordings were performed in current–clampmode, with pipette capacitance and access resistance compensated for throughoutthe experiments. Data was discarded when access resistance increased beyond 35M. Various current traces representing currents invoked by synaptic input wereinjected in order to test neuronal responses to input with varying degrees of syn-chrony. The recorded voltage response was then analyzed in terms of dischargeresponses (produced number of action potentials) as well as in terms of membranepotential pattern.
87


Bibliography
Albert P (1991) A two-state markov mixture model for a time series of epilepticseizure counts. Biometrics., 47:1371–1381.
Amir R and Devor M (2003) Electrical excitability of the soma of sensory neu-rons is required for spike invasion of the soma, but not for through-conduction.Biophysical journal, 84(4):2181–2191.
An W, Bowlby M, Betty M, Cao J, Ling H, Mendoza G, Hinson J, Mattsson K,Strassle B, Trimmer J, et al. (2000) Modulation of A-type potassium channelsby a family of calcium sensors. Nature, 403:553–556.
Ang C, Carlson G, and Coulter D (2005) Hippocampal ca1 circuitry dynamicallygates direct cortical inputs preferentially at theta frequencies. The Journal ofneuroscience, 25(42):9567–9580.
Angelova P and Müller W (2006) Oxidative modulation of the transient potas-sium current ia by intracellular arachidonic acid in rat ca1 pyramidal neurons.European Journal of Neuroscience, 23(9):2375–2384.
Azouz R and Gray C (2003) Adaptive coincidence detection and dynamic gaincontrol in visual cortical neurons in vivo. Neuron, 37(3):513–523.
Barnwell L, Lugo J, Lee W, Willis S, Gertz S, Hrachovy R, and Anderson A (2009)Kv4. 2 knockout mice demonstrate increased susceptibility to convulsant stimu-lation. Epilepsia, 50(7):1741–1751.
Barrett E and Barrett J (1982) Intracellular recording from vertebrate myelinatedaxons: mechanism of the depolarizing afterpotential. The Journal of physiology,323(1):117–144.
Bartos M, Vida I, Frotscher M, Geiger J, and Jonas P (2001) Rapid signaling atinhibitory synapses in a dentate gyrus interneuron network. Journal of Neuro-science, 21:2687–2689.
89

90 BIBLIOGRAPHY
Beenhakker M and Huguenard J (2009) Neurons that fire together also conspiretogether: is normal sleep circuitry hijacked to generate epilepsy? Neuron, 62(5):612–632.
Biervert C, Schroeder B, Kubisch C, Berkovic S, Propping P, Jentsch T, and Stein-lein O (1998) A potassium channel mutation in neonatal human epilepsy. Science,279(5349):403–406.
Blair N and Bean B (2002) Roles of tetrodotoxin (ttx)-sensitive na+ current, ttx-resistant na+ current, and ca2+ current in the action potentials of nociceptivesensory neurons. The Journal of neuroscience, 22(23):10277–10290.
Bostock H, Campero M, Serra J, and Ochoa J (2003) Velocity recovery cycles of cfibres innervating human skin. The Journal of physiology, 553(2):649–663.
Bough K and Rho J (2007) Anticonvulsant mechanisms of the ketogenic diet.Epilepsia, 48(1):43–58.
Bowe C, Kocsis J, and Waxman S (1987) The association of the supernormal pe-riod and the depolarizing afterpotential in myelinated frog and rat sciatic nerve.Neuroscience, 21(2):585–593.
Bragin A, Engel Jr J, Wilson C, Fried I, and Buzsaki G (1999) High-frequencyoscillations in human brain. Hippocampus, 9.
Bragin A, Mody I, Wilson C, and Engel Jr J (2002) Local generation of fast ripplesin epileptic brain. Journal of Neuroscience, 22:2012–2021.
Branco T, Clark B, and Hausser M (2010) Dendritic discrimination of temporalinput sequences in cortical neurons. Science’s STKE, 329(5999):1671.
Brunel N and Van RossumM (2007) Lapicque?s 1907 paper: from frogs to integrate-and-fire. Biological cybernetics, 97(5):337–339.
Buzsáki G (1986) Hippocampal sharp waves: their origin and significance. Brainresearch, 398(2):242–252.
Buzsaki G (1998) Memory consolidation during sleep: a neurophysiological per-spective. J. Sleep Res, 7:17–23.
Buzsaki G, Horvath Z, Urioste R, Hetke J, and Wise K (1992) High-frequencynetwork oscillation in the hippocampus. Science, 256:1025–1027.
Cai X, Liang C, Muralidharan S, Kao J, Tang C, and Thompson S (2004) Uniqueroles of sk and kv4. 2 potassium channels in dendritic integration. Neuron, 44(2):351–364.

BIBLIOGRAPHY 91
Castle N (2010) Pharmacological modulation of voltage-gated potassium channelsas a therapeutic strategy. Expert Opinion on Therapeutic Patents, 20(11):1471–1503.
Castro P, Cooper E, Lowenstein D, and Baraban S (2001) Hippocampal heterotopialack functional Kv4. 2 potassium channels in the methylazoxymethanol model ofcortical malformations and epilepsy. Journal of Neuroscience, 21:6626–6634.
Charcos Lloréns V and Fransén E (2004) Intrinsic desynchronization properties ofneurons containing dendritic rapidly activating k-currents. Neurocomputing, 58:137–143.
Chen X, Yuan L, Zhao C, Birnbaum S, Frick A, Jung W, Schwarz T, Sweatt J, andJohnston D (2006) Deletion of kv4. 2 gene eliminates dendritic a-type k+ currentand enhances induction of long-term potentiation in hippocampal ca1 pyramidalneurons. The Journal of neuroscience, 26(47):12143–12151.
Chiu A, Jahromi S, Khosravani H, Carlen P, and Bardakjian B (2006) The effectsof high-frequency oscillations in hippocampal electrical activities on the classifi-cation of epileptiform events using artificial neural networks. Journal of NeuralEngineering, 3:9–20.
Church J and Baimbridge K (1991) Exposure to high-ph medium increases theincidence and extent of dye coupling between rat hippocampal ca1 pyramidalneurons in vitro. The Journal of neuroscience, 11(10):3289–3295.
De Col R, Messlinger K, and Carr R (2008) Conduction velocity is regulated bysodium channel inactivation in unmyelinated axons innervating the rat cranialmeninges. The Journal of physiology, 586(4):1089–1103.
Dichter M and Brodie M (1996) New antiepileptic drugs. New England Journal ofMedicine, 334:1583–1590.
Doiron B, Zhao Y, and Tzounopoulos T (2011) Combined ltp and ltd of modulatoryinputs controls neuronal processing of primary sensory inputs. The Journal ofNeuroscience, 31(29):10579–10592.
Draguhn A, Traub R, Schmitz D, and Jefferys J (1998) Electrical coupling underlieshigh-frequency oscillations in the hippocampus in vitro. Nature, 394:189–192.
Drenth J, Waxman S, et al. (2007) Mutations in sodium-channel gene scn9a causea spectrum of human genetic pain disorders. Journal of Clinical Investigation,117(12):3603.
Dudman J, Tsay D, and Siegelbaum S (2007) A role for synaptic inputs at distaldendrites: instructive signals for hippocampal long-term plasticity. Neuron, 56(5):866–879.

92 BIBLIOGRAPHY
Dunlop J, Bowlby M, Peri R, Vasilyev D, and Arias R (2008) High-throughput elec-trophysiology: an emerging paradigm for ion-channel screening and physiology.Nature Reviews Drug Discovery, 7(4):358–368.
Dzhala V and Staley K (2004) Mechanisms of fast ripples in the hippocampus.Journal of Neuroscience, 24:8896–8906.
Engel J, Bragin A, Staba R, and Mody I (2009) High-frequency oscillations: Whatis normal and what is not? Epilepsia, 50:598–604.
Fang X, McMullan S, Lawson S, and Djouhri L (2005) Electrophysiological differ-ences between nociceptive and non-nociceptive dorsal root ganglion neurones inthe rat in vivo. The Journal of physiology, 565(3):927–943.
Fischer T and Waxman S (2010) Familial pain syndromes from mutations of thenav1. 7 sodium channel. Annals of the New York Academy of Sciences, 1184(1):196–207.
Foffani G, Uzcategui Y, Gal B, and Menendez de la Prida L (2007) Reduced spike-timing reliability correlates with the emergence of fast ripples in the rat epileptichippocampus. Neuron, 55:930–941.
Francis J, Jugloff D, Mingo N, Wallace M, Jones O, McIntyre Burnham W, andEubanks J (1997) Kainic acid-induced generalized seizures alter the regional hip-pocampal expression of the rat Kv4. 2 potassium channel gene. Neuroscienceletters, 232:91–94.
Gasparini S and Magee J (2006) State-dependent dendritic computation in hip-pocampal ca1 pyramidal neurons. The Journal of neuroscience, 26(7):2088–2100.
Gasparini S, Migliore M, and Magee J (2004) On the initiation and propagation ofdendritic spikes in ca1 pyramidal neurons. The Journal of neuroscience, 24(49):11046–11056.
González J, Mel B, and Poirazi P (2011) Distinguishing linear vs. non-linear integra-tion in ca1 radial oblique dendrites: it’s about time. Frontiers in ComputationalNeuroscience, 5.
Gray C (1994) Synchronous oscillations in neuronal systems: mechanisms and func-tions. Journal of computational neuroscience, 1(1):11–38.
Guerrini R, Belmonte A, and Genton P (1998) Antiepileptic drug-induced worseningof seizures in children. Epilepsia, 39:S2–S10.
Gurkiewicz M, Korngreen A, Waxman S, and Lampert A (2011) Kinetic modeling ofnav1. 7 provides insight into erythromelalgia-associated f1449v mutation. Journalof Neurophysiology, 105(4):1546–1557.
BIBLIOGRAPHY 93
Hallin R, Hongell A, Hagbarth K, et al. (1970) Single unit potentials with complexwaveform seen in microelectrode recordings from the human median nerve. BrainResearch, 24(3):443–450.
Hamzei-Sichani F, Kamasawa N, Janssen W, Yasumura T, Davidson K, Hof P,Wearne S, Stewart M, Young S, Whittington M, et al. (2007) Gap junctions onhippocampal mossy fiber axons demonstrated by thin-section electron microscopyand freeze–fracture replica immunogold labeling. Proceedings of the NationalAcademy of Sciences, 104:12548–12548.
Hendrickson E, Edgerton J, and Jaeger D (2011) The use of automated param-eter searches to improve ion channel kinetics for neural modeling. Journal ofcomputational neuroscience, 31(2):329–346.
Herzog R, Cummins T, and Waxman S (2001) Persistent ttx-resistant na+ cur-rent affects resting potential and response to depolarization in simulated spinalsensory neurons. Journal of neurophysiology, 86(3):1351–1364.
Hines M and Carnevale N (1997) The neuron simulation environment. Neuralcomputation, 9(6):1179–1209.
Hodgkin and Huxley (1952) A quantitative description of membrane current andits application to conduction and excitation in nerve. The Journal of physiology,117(4):500.
Hoffman D and Johnston D (1998) Downregulation of transient K+ channels indendrites of hippocampal CA1 pyramidal neurons by activation of PKA andPKC. Journal of Neuroscience, 18:3521–3528.
Hoffman D, Magee J, Colbert C, and Johnston D (1997) K channel regulation ofsignal propagation in dendrites of hippocampal pyramidal neurons. Nature, 387:869–875.
Hooke R and Jeeves T (1961) “direct search”solution of numerical and statisticalproblems. Journal of the ACM (JACM), 8(2):212–229.
Huang C, Huang C, Liu Y, and Wu S (2004) Inhibitory effect of lamotrigine onA-type potassium current in hippocampal neuron-derived H19-7 cells. Epilepsia,45:729–736.
Huguenard J, Coulter D, and Prince D (1991) A fast transient potassium currentin thalamic relay neurons: kinetics of activation and inactivation. Journal ofneurophysiology, 66(4):1304–1315.
Ji R, Kohno T, Moore K, and Woolf C (2003) Central sensitization and ltp: dopain and memory share similar mechanisms? Trends in neurosciences, 26(12):696–705.

94 BIBLIOGRAPHY
Juhng K, Kokate T, Yamaguchi S, Kim B, Rogowski R, Blaustein M, and Ro-gawski M (1999) Induction of seizures by the potent K+ channel-blocking scor-pion venom peptide toxins tityustoxin-K (alpha) and pandinustoxin-K (alpha).Epilepsy research, 34:177–186.
Kamondi A, Acsády L, and Buzsáki G (1998) Dendritic spikes are enhanced bycooperative network activity in the intact hippocampus. The Journal of neuro-science, 18(10):3919–3928.
Kanai K, Kuwabara S, Misawa S, Tamura N, Ogawara K, Nakata M, Sawai S,Hattori T, and Bostock H (2006) Altered axonal excitability properties in amy-otrophic lateral sclerosis: impaired potassium channel function related to diseasestage. Brain, 129(4):953–962.
Kiernan M, Isbister G, Lin C, Burke D, and Bostock H (2005) Acute tetrodotoxin-induced neurotoxicity after ingestion of puffer fish. Annals of neurology, 57(3):339–348.
Kim J, Jung S, Clemens A, Petralia R, and Hoffman D (2007) Regulation of den-dritic excitability by activity-dependent trafficking of the a-type k+ channel sub-unit kv4. 2 in hippocampal neurons. Neuron, 54(6):933–947.
Köhling R (2002) Voltage-gated sodium channels in epilepsy. Epilepsia, 43(11):1278–1295.
Kolda T, Lewis R, and Torczon V (2003) Optimization by direct search: Newperspectives on some classical and modern methods. SIAM review, pages 385–482.
Kossoff E, Kossof E, Freeman J, Freeman J, Turner Z, and Rubenstein J (2011)Ketogenic Diets: Treatments for Epilepsy and Other Disorders. Demos MedicalPub.
Kovalsky Y, Amir R, and Devor M (2009) Simulation in sensory neurons revealsa key role for delayed na+ current in subthreshold oscillations and ectopic dis-charge: implications for neuropathic pain. Journal of neurophysiology, 102(3):1430–1442.
Krishnan A and Kiernan M (2005) Altered nerve excitability properties in estab-lished diabetic neuropathy. Brain, 128(5):1178–1187.
LaMotte R, Shain C, Simone D, and Tsai E (1991) Neurogenic hyperalgesia: psy-chophysical studies of underlying mechanisms. Journal of Neurophysiology, 66(1):190–211.
Larkum M, Nevian T, Sandler M, Polsky A, and Schiller J (2009) Synaptic inte-gration in tuft dendrites of layer 5 pyramidal neurons: a new unifying principle.Science’s STKE, 325(5941):756.
BIBLIOGRAPHY 95
Lasztoczi B, Antal K, Nyikos L, Emri Z, and Kardos J (2004) High-frequency synap-tic input contributes to seizure initiation in the low-[Mg2+] model of epilepsy.European Journal of Neuroscience, 19:1361–1372.
Li Q, Huang H, Liu G, Lam K, Rutberg J, Green M, Birnie D, Lemery R,Chahine M, and Gollob M (2009) Gain-of-function mutation of nav1. 5 in atrialfibrillation enhances cellular excitability and lowers the threshold for action po-tential firing. Biochemical and biophysical research communications, 380(1):132–137.
Lisman J (1999) Relating hippocampal circuitry viewpoint to function: Recall ofmemory sequences by reciprocal dentate–ca3 interactions. Neuron, 22:233–242.
Lockridge A and Yuan L (2011) Spatial learning deficits in mice lacking a-type k+channel subunits. Hippocampus, 21(11):1152–1156.
Losonczy A, Makara J, and Magee J (2008) Compartmentalized dendritic plasticityand input feature storage in neurons. Nature, 452(7186):436–441.
Lundqvist M, Herman P, and Lansner A (2011) Theta and gamma power increasesand alpha/beta power decreases with memory load in an attractor network model.Journal of Cognitive Neuroscience, 23(10):3008–3020.
Luthi A and McCormick D (1998) H-current: properties of a neuronal and networkpacemaker. Neuron, 21(1):9–12.
Maffie J and Rudy B (2008) Weighing the evidence for a ternary protein complexmediating a-type k+ currents in neurons. The Journal of physiology, 586(23):5609–5623.
Maier N, Nimmrich V, and Draguhn A (2003) Cellular and network mechanisms un-derlying spontaneous sharp wave-ripple complexes in mouse hippocampal slices.The Journal of Physiology, 550:873–887.
Maingret F, Coste B, Padilla F, Clerc N, Crest M, Korogod S, and Delmas P (2008)Inflammatory mediators increase nav1. 9 current and excitability in nociceptorsthrough a coincident detection mechanism. The Journal of general physiology,131(3):211–225.
Makara J, Losonczy A, Wen Q, and Magee J (2009) Experience-dependent com-partmentalized dendritic plasticity in rat hippocampal ca1 pyramidal neurons.Nature neuroscience, 12(12):1485–1487.
McNamara J et al. (1999) Emerging insights into the genesis of epilepsy. NATURE-LONDON-, pages 15–22.
Melnick I (2011) A-type k+ current dominates somatic excitability of delayed firingneurons in rat substantia gelatinosa. Synapse, 65(7):601–607.

96 BIBLIOGRAPHY
Michaelis M, Häbler H, and Jaenig W (1996) Silent afferents: a separate class ofprimary afferents? Clinical and experimental pharmacology and physiology, 23(2):99–105.
Migliore M, Hoffman D, Magee J, and Johnston D (1999) Role of an A-type K+conductance in the back-propagation of action potentials in the dendrites of hip-pocampal pyramidal neurons. Journal of computational neuroscience, 7:5–15.
Migliore M, Novara G, and Tegolo D (2008) Single neuron binding properties andthe magical number 7. Hippocampus, 18(11):1122–1130.
Milton J, Gotman J, Remillard G, and Andermann F (1987) Timing of seizurerecurrence in adult epileptic patients: a statistical analysis. Epilepsia, 28:471–478.
Moalem-Taylor G, Lang P, Tracey D, and Grafe P (2007) Post-spike excitabilityindicates changes in membrane potential of isolated c-fibers. Muscle & nerve, 36(2):172–182.
Nadal M, Amarillo Y, de Miera E, and Rudy B (2006) Differential characterizationof three alternative spliced isoforms of DPPX. Brain research, 1094:1–12.
Nakajima S, Franck J, Bilkey D, and Schwartzkroin P (1991) Local circuit synap-tic interactions between CA1 pyramidal cells and interneurons in the kainate-lesioned hyperexcitable hippocampus. Hippocampus, 1.
Nobile M, Olcese R, Toro L, and Stefani E (1997) Fast inactivation of shaker k+channels is highly temperature dependent. Experimental brain research, 114(1):138–142.
Obreja O, Ringkamp M, Namer B, Forsch E, Klusch A, Rukwied R, Petersen M,and Schmelz M (2010) Patterns of activity-dependent conduction velocity changesdifferentiate classes of unmyelinated mechano-insensitive afferents including coldnociceptors, in pig and in human. Pain, 148(1):59–69.
O’Callaghan D, Hasdemir B, Leighton M, and Burgoyne R (2003) Residues withinthe myristoylation motif determine intracellular targeting of the neuronal Ca2+sensor protein KChIP1 to post-ER transport vesicles and traffic of Kv4 K+ chan-nels. Journal of Cell Science, 116:4833–4845.
Ochi A, Otsubo H, Donner E, Elliott I, Iwata R, Funaki T, Akizuki Y, Akiyama T,Imai K, Rutka J, et al. (2007) Dynamic changes of ictal high-frequency oscilla-tions in neocortical epilepsy: using multiple band frequency analysis. Epilepsia,48:286–296.
Ørstavik K, Weidner C, Schmidt R, Schmelz M, Hilliges M, Jørum E, Handw-erker H, and Torebjörk E (2003) Pathological c-fibres in patients with a chronicpainful condition. Brain, 126(3):567–578.
BIBLIOGRAPHY 97
Otani S, Connor J, and Levy W (1995) Long-term potentiation and evidence fornovel synaptic association in ca1 stratum oriens of rat hippocampus. Learning& Memory, 2(2):101–106.
Overington J, Al-Lazikani B, and Hopkins A (2006) How many drug targets arethere? Nature reviews Drug discovery, 5(12):993–996.
Pan J, Bebin E, Chu W, and Hetherington H (1999) Ketosis and epilepsy: 31pspectroscopic imaging at 4.1 t. Epilepsia, 40(6):703–707.
Park S, Lin C, Krishnan A, Goldstein D, Friedlander M, and Kiernan M (2009)Oxaliplatin-induced neurotoxicity: changes in axonal excitability precede devel-opment of neuropathy. Brain, 132(10):2712–2723.
Pissadaki E, Sidiropoulou K, Reczko M, and Poirazi P (2010) Encoding of spatio-temporal input characteristics by a ca1 pyramidal neuron model. PLoS compu-tational biology, 6(12):e1001038.
Poirazi P, Brannon T, and Mel B (2003) Arithmetic of subthreshold synaptic sum-mation in a model ca1 pyramidal cell. Neuron, 37(6):977–987.
Poolos N, Migliore M, and Johnston D (2002) Pharmacological upregulation ofh-channels reduces the excitability of pyramidal neuron dendrites. nature neuro-science, 5:767–774.
Ramakers G and Storm J (2002) A postsynaptic transient k+ current modulated byarachidonic acid regulates synaptic integration and threshold for ltp induction inhippocampal pyramidal cells. Proceedings of the National Academy of Sciences,99(15):10144.
Rüschenschmidt C, Köhling R, Schwarz M, Straub H, Gorji A, Siep E, Ebner A,Pannek H, Tuxhorn I, Wolf P, et al. (2004) Characterization of a fast transientoutward current in neocortical neurons from epilepsy patients. Journal of neuro-science research, 75(6):807–816.
Saltelli A (2004) Sensitivity analysis in practice: a guide to assessing scientificmodels. John Wiley & Sons Inc.
Sander J and Shorvon S (1987) Incidence and prevalence studies in epilepsy andtheir methodological problems: a review. British Medical Journal, 50:829–839.
Santhakumar V, Aradi I, and Soltesz I (2005) Role of mossy fiber sprouting andmossy cell loss in hyperexcitability: a network model of the dentate gyrus in-corporating cell types and axonal topography. Journal of neurophysiology, 93:437–453.
Schaible H and Schmidt R (1988) Time course of mechanosensitivity changes inarticular afferents during a developing experimental arthritis. Journal of neuro-physiology, 60(6):2180–2195.

98 BIBLIOGRAPHY
Semah F, Picot M, Adam C, Broglin D, Arzimanoglou A, Bazin B, Cavalcanti D,and Baulac M (1998) Is the underlying cause of epilepsy a major prognostic factorfor recurrence? Neurology, 51:1256–1262.
Serra J, Campero M, Ochoa J, and Bostock H (1999) Activity-dependent slowing ofconduction differentiates functional subtypes of c fibres innervating human skin.The Journal of physiology, 515(3):799–811.
Serra J, Bostock H, Solà R, Aleu J, García E, Cokic B, Navarro X, and Quiles C(2011) Microneurographic identification of spontaneous activity in c-nociceptorsin neuropathic pain states in humans and rats. Pain.
Sheets P, Jackson II J, Waxman S, Dib-Hajj S, and Cummins T (2007) A nav1.7 channel mutation associated with hereditary erythromelalgia contributes toneuronal hyperexcitability and displays reduced lidocaine sensitivity. The Journalof physiology, 581(3):1019–1031.
Siapas A and Wilson M (1998) Coordinated interactions between hippocampalripples and cortical spindles during slow-wave sleep. NEURON-CAMBRIDGEMA-, 21:1123–1128.
Simone D, Baumann T, and LaMotte R (1989) Dose-dependent pain and mechanicalhyperalgesia in humans after intradermal injection of capsaicin. Pain, 38(1):99–107.
Sjöström P, Rancz E, Roth A, and Häusser M (2008) Dendritic excitability andsynaptic plasticity. Physiological reviews, 88(2):769–840.
Snape A, Pittaway J, and Baker M (2010) Excitability parameters and sensitivityto anemone toxin atx-ii in rat small diameter primary sensory neurones discrim-inated by griffonia simplicifolia isolectin ib4. The Journal of Physiology, 588(1):125–137.
Soltesz I and Staley K (2008) Computational Neuroscience in Epilepsy. AcademicPress.
Staley K (2007) Neurons Skip a Beat during Fast Ripples. Neuron, (6):828–830.
Sun W, Maffie J, Lin L, Petralia R, Rudy B, and Hoffman D (2011) Dpp6 estab-lishes the a-type k< sup>+</sup> current gradient critical for the regulationof dendritic excitability in ca1 hippocampal neurons. Neuron, 71(6):1102–1115.
Takahashi S and Sakurai Y (2009) Sub-millisecond firing synchrony of closelyneighboring pyramidal neurons in hippocampal ca1 of rats during delayed non-matching to sample task. Frontiers in neural circuits, 3.
Torczon V et al. (1997) On the convergence of pattern search algorithms. SIAMJournal on optimization, 7(1):1–25.

BIBLIOGRAPHY 99
Traub R and Bibbig A (2000) A model of high-frequency ripples in the hippocampusbased on synaptic coupling plus axon-axon gap junctions between pyramidalneurons. Journal of Neuroscience, 20:2086–2093.
Trommald M, Jensen V, and Andersen P (1995) Analysis of dendritic spines in ratca1 pyramidal cells intracellularly filled with a fluorescent dye. The Journal ofcomparative neurology, 353(2):260–274.
Tsaur M, Sheng M, Lowenstein D, Jan Y, and Jan L (1992) Differential expressionof K+ channel mRNAs in the rat brain and down-regulation in the hippocampusfollowing seizures. Neuron, 8:1055–1067.
Tsubokawa H, Offermanns S, Simon M, and Kano M (2000) Calcium-dependentpersistent facilitation of spike backpropagation in the ca1 pyramidal neurons.The Journal of Neuroscience, 20(13):4878–4884.
Uhlhaas P and Singer W (2006) Neural synchrony in brain disorders: relevance forcognitive dysfunctions and pathophysiology. Neuron, 52(1):155–168.
Urrestarazu E, Jirsch J, LeVan P, and Hall J (2006) High-frequency intracerebralEEG activity (100-500 Hz) following interictal spikes. Epilepsia, 47:1465–1476.
Van Geit W, Achard P, and De Schutter E (2007) Neurofitter: a parameter tuningpackage for a wide range of electrophysiological neuron models. BMC Neuro-science, 8(Suppl 2):P5.
Vanier M and Bower J (1999) A comparative survey of automated parameter-search methods for compartmental neural models. Journal of ComputationalNeuroscience, 7(2):149–171.
Varga A, Yuan L, Anderson A, Schrader L, Wu G, Gatchel J, Johnston D, andSweatt J (2004) Calcium–calmodulin-dependent kinase ii modulates kv4. 2 chan-nel expression and upregulates neuronal a-type potassium currents. The Journalof neuroscience, 24(14):3643–3654.
Vining E, Freeman J, Ballaban-Gil K, Camfield C, Camfield P, Holmes G, Shin-nar S, Shuman R, Trevathan E, Wheless J, et al. (1998) A multicenter study ofthe efficacy of the ketogenic diet. Archives of neurology, 55(11):1433.
Vreugdenhil M, Bruehl C, Voskuyl R, Kang J, Leaf A, and Wadman W (1996)Polyunsaturated fatty acids modulate sodium and calcium currents in ca1 neu-rons. Proceedings of the National Academy of Sciences, 93(22):12559.
Wada A (2006) Roles of voltage-dependent sodium channels in neuronal develop-ment, pain, and neurodegeneration. Journal of pharmacological sciences, 102(3):253–268.

100 BIBLIOGRAPHY
Weidner C, Schmelz M, Schmidt R, Hansson B, Handwerker H, and Torebjörk H(1999) Functional attributes discriminating mechano-insensitive and mechano-responsive c nociceptors in human skin. The Journal of neuroscience, 19(22):10184–10190.
Weidner C, Schmidt R, Schmelz M, Torebjörk H, and Handwerker H (2003) Actionpotential conduction in the terminal arborisation of nociceptive c-fibre afferents.The Journal of Physiology, 547(3):931–940.
Wilson H and Cowan J (1972) Excitatory and inhibitory interactions in localizedpopulations of model neurons. Biophysical Journal, 12:1–24.
Wong S, Gardner A, Krieger A, and Litt B (2007) A stochastic framework forevaluating seizure prediction algorithms using hidden Markov models. Journalof neurophysiology, 97:2525–2532.
Worrell G, Gardner A, Stead S, Hu S, Goerss S, Cascino G, Meyer F, Marsh R, andLitt B (2008) High-frequency oscillations in human temporal lobe: simultaneousmicrowire and clinical macroelectrode recordings. Brain, 131(4):928–937.
Xu X, Erichsen D, Börjesson S, Dahlin M, Åmark P, and Elinder F (2008) Polyun-saturated fatty acids and cerebrospinal fluid from children on the ketogenic dietopen a voltage-gated k channel: a putative mechanism of antiseizure action.Epilepsy research, 80(1):57–66.
Yang X, Sheng W, Sun G, and Lee J (2011) Effects of fatty acid unsaturation num-bers on membrane fluidity and α-secretase-dependent amyloid precursor proteinprocessing. Neurochemistry international, 58(3):321–329.
Ylinen A, Bragin A, Nadasdy Z, Jando G, Szabo I, Sik A, and Buzsaki G (1995)Sharp wave-associated high-frequency oscillation (200 Hz) in the intact hip-pocampus: network and intracellular mechanisms. Journal of Neuroscience, 15:30–46.
Zona C, Tancredi V, Longone P, D’Arcangelo G, D’Antuono M, Manfredi M, andAvoli M (2002) Neocortical potassium currents are enhanced by the antiepilepticdrug lamotrigine. Epilepsia, 43:685–690.