Embed Size (px)
Citation preview

AASRI Procedia 4 ( 2013 ) 223 – 229
2212-6716 © 2013 The Authors. Published by Elsevier B.V.Selection and/or peer review under responsibility of American Applied Science Research Institutedoi: 10.1016/j.aasri.2013.10.034
ScienceDirect
2013 AASRI Conference on Intelligent Systems and Control
Mechanical Fault Recognition for WTG based on Aligning Vibration Signal’s Energy Spectrum
Haining Pana,*, Ming Qinb, Jun Zhangb, Lei Pana aGuodian United Power Technology Company Ltd., State Key Laboratory of Wind Power Equipment and Control, Haidian Dist., Beijing
100039, China bGuodian New Energy Technology Research Institute, XiCheng Dist., Beijing 100034, China
Abstract
Fault recognition for Wind Turbine Generator’s (WTG) mechanical system is a fundamental task of Condition Monitoring System and depends on the time-frequency feature of the monitored signals. A recognition method by matching the Hilbert-Huang Spectrum (HHS) of the vibration signal is proposed. Fault recognition is formulated as an aligning process that shifts the vibration’s HHS to match the pre-defined fault pattern using ICP. Given that the duration and initial frequency feature of the HHS may lead to different aligning results, iteration parameters with multiple time-scales and positions are set. In simulations, a mechanical fault is identified and the effectiveness is compared. © 2013. Published by Elsevier B.V. Selection and/or peer review under responsibility of American Applied Science Research Institute Keywords: WTG; Fault Recognition; ICP; Hilbert-Huang Spectrum.
1. Introduction
With the expansion of wind farms, the maintenance has become one of the major issues due to the premature failures of many wind turbines. Vibration signals of the drive chain are generally the main sources
* Corresponding author. Tel.: +86 01057657457; fax: +86 01057659200. E-mail address: [email protected]
Available online at www.sciencedirect.com
© 2013 The Authors. Published by Elsevier B.V.Selection and/or peer review under responsibility of American Applied Science Research Institute

224 Haining Pan et al. / AASRI Procedia 4 ( 2013 ) 223 – 229
that we used to diagnose the mechanical faults. All the potential damages caused by heavy load, wind gust and dust corrosion are generally reflected in vibration’s frequency characteristics and could lead to catastrophic failure of the entire wind turbine. Therefore, the recognition and evaluation of mechanical vibrations are important topics for wind turbine’s reliability assessment, where the time-frequency analysis is now widely used.
Since the measured vibrations are normally non-stationary in time-frequency domain, the well-established wavelet transform approach [1], the Empirical Mode Decomposition and the Hilbert-Huang Transform (HHT) [2], have been employed to detect the defects of gears and other mechanical components of rotating machinery. Fault recognition, the subsequent procedure of time-frequency analysis, is a crucial connection that maps the vibrational characteristics to the fault pattern. The Support Vector Machine is employed to classify the faults of shafts and gears in the drive chain system [3]. C.C. Wang uses the neural network to classify the faults of gear systems concerning time series analysis [4]. A weighted nearest neighbor classification algorithm is performed by Lei and Zuo to evaluate the gearbox damage levels, and a two-stage feature selection and weighting technique is adopted to select sensitive features [5]. Iterative Closest Point is popular in aligning the sampled data cloud in applied vision technology, including data selection, distance iteration and feature matching [6]. ICP matching is introduced in this paper combining the HHT analysis, as a successive fault recognition approach in the reliability assessment besides in the machine vision field.
The aim of the study is to study the effect of applying the ICP process to mechanical fault recognition. The intrinsic components of vibration signals are first decomposed and then normalized using HHT technique to get the amplitude and instantaneous frequency, which are calculated and integrated to plot the Hilbert-Huang Spectrum (HHS). Given that methods of component decomposition and frequency calculation may lead to different HHS, several different transform parameters are set. The principle of this new method is described in the following sections.
2. Mechanical Vibration’s Decomposition and its Hilbert-Huang Spectrum
Vibration signals of the mechanical system involve abundant information related to the dynamical characteristics of frequency meshing process, such as the inherent system natural frequencies as well as the malfunctions of gear system due to gear defects or deterioration. EMD suffers from a major drawback of mode mixing, which is often caused by intermittencies in signals. So EEMD, a noise-assisted method, is adopted to overcome this drawback. For any IMF ( )c t yielded by EEMD, all the local maxima of the absolute values of the data are first identified and then all these maxima points are connected with a cubic spline curve. This spline curve is designated as the empirical envelope ( )e t of the IMF. By using the absolute value fitting, the normalized data will be symmetric with respect to the zero axis. Once the empirical envelope is obtained through spline fitting, we can normalize the IMF by repeating the following step,
1( ) ( ) ( )i i iy t y t e t (1)
If all the values of ( )ny t are less or equal to unity. Then the empirical frequency modulation, ( )F t , and amplitude modulation, ( )A t , of the IMF are:
( ) ( )nF t y t , 1 2( ) ( ) ( ) ( )nA t e t e t e t (2)
Then the IMF ( )f t presented by ( )A t and ( )F t is
( ) ( ) ( ) ( ) cos ( )f t A t F t A t t (3)

225 Haining Pan et al. / AASRI Procedia 4 ( 2013 ) 223 – 229
In practice, the instantaneous frequency cannot be derived from the real-time signal because the phase is nonlinear and noisy. Direct quadrature is a novel way to calculate ( )t , which is:
2
( )( ) arctan1 ( )
F ttF t
(4)
The instantaneous frequency is thus the differential of the phase ( )t . That is:
( ) ( )t d t dt (5)
The time-frequency-energy distribution of the vibration signal, named as time-frequency Hilbert spectrum, can be finally expressed as:
1( , ) ( ) cos ( )
m
k kk
H t A t t dt (6)
3. ICP Program of HHS Matching for Fault Recognition
Most of the assessment methods pre-define several fault patterns characterized by frequencies and time information, and then figure out which fault pattern the measured conditions belong to, so the key is the way that how we evaluate the similarity of the current operating conditions of the gearbox and the pre-defined fault pattern. The ICP-based pattern matching is introduced here to assess this similarity. Since the energy level could be treated as the 3rd dimension, the 2D HHS can be presented as an enhanced 3-dimensional data cloud, which is more helpful to align the HHS’s features and find out their similarities.
The process takes two HHS as inputs. One is the real HHS that calculated from the measured gearbox’s vibration using EEMD method, the other is the referenced HHS pattern that we build using experience. Of course the signals’ ranges of time and frequency, and the corresponding signal energy are also included. Outputs are the rotation and transportation displacement of the two HHS.
The modified ICP has the following form:
[ , , , ] ( , , )m dR T p e ICP HHS HHS iter (7)
where mHHS is the HHS from measured vibration signal, dHHS is the pre-defined fault pattern , R and T are the rotation and transportation between mHHS and dHHS respectively, p is the percentage of good points in each HHS that match fairly well, e is the residual error when iteration completes, iter is the iteration number of ICP process.
Assume that the given two HHS to be matched can be described as point sets of Eq.8,
1 2, ,m nHHS p p p , 1 2, ,d nHHS q q q (8)
where n is the point number of HHS and is the same to both HHS. The ICP algorithm begins with an initial estimate of the registration parameters, and then the algorithm forms a sequence of estimates which progressively reduce the error. Repeat the following minimizing problem (Eq.9) and update the HHS with respect to the reference ones.

226 Haining Pan et al. / AASRI Procedia 4 ( 2013 ) 223 – 229
arg min ,i i dq q Rp T q HHS (9)
Obviously R , T , p and e decide the similarity of mHHS and dHHS . In the stereo vision field, R andT are very important because they response to the motion between the adjacent sampling time. But here R is almost useless because these two HHS’s relative position has no relative rotation. p and e represent how many data in both HHSs are matched, and how well. So we choose p and e as the index for assessing the operating condition of the mechanical system. If we get a large p together with a small e , the two HHS match each other, that to say, the measured condition that represented by mHHS belongs to the pre-defined fault pattern that represented by dHHS .
4. Mechanical Fault Assessment by Aligning Signal’s HHSs with Multiple Time Scales
A HHS matching process between the vibration signal’s HHS of referenced fault pattern is performed and calculated using the ICP in the Matlab environment. The hardware is a PC with a CPU working at 2.6GHz and a 2G RAM. The original signal is shown on the top of Fig.1. To calculate the HHS of the original measured vibration signal, white noise with finite amplitude is added to the signal, provides a uniform reference frame in the time-frequency space, and perturbs the signal in the neighborhood of its true solutions. This enables the signal components of different scales to collate in proper IMFs. In the ensemble mean of enough trials, the noise will be averaged out since it is different in separate trials. For the detailed EEMD, please refer to [7].
The vibration signal is decomposed into several IMFs shown in Fig.2. The simulation takes as input a real HHS, a data structure of signal energy level in 2- dimensional space that calculated from the measured vibration using EEMD method. The energy is color-coded based on its intensity at the corresponding time and frequency (on the left of Fig.2). Energy of red color is high, and that of magenta is low.
0 1000 2000 3000 4000 5000 6000 7000 8000 9000 10000-10
0
10
0 2000 4000 6000 8000 10000-10
0
10
0 2000 4000 6000 8000 10000-5
0
5
0 2000 4000 6000 8000 10000-2
0
2
0 2000 4000 6000 8000 10000-1
0
1
acce
lera
tion(
m/s
2 )
0 2000 4000 6000 8000 10000-0.5
0
0.5
0 2000 4000 6000 8000 10000-0.2
0
0.2
0 2000 4000 6000 8000 10000-0.2
0
0.2
0 2000 4000 6000 8000 10000-0.1
0
0.1
0 2000 4000 6000 8000 10000-0.1
0
0.1
0 2000 4000 6000 8000 10000-0.1
0
0.1
0 2000 4000 6000 8000 10000-0.05
0
0.05
sample points0 2000 4000 6000 8000 10000
-0.02
0
0.02
Fig.1 The measured vibration signal and its decomposed IMFs
227 Haining Pan et al. / AASRI Procedia 4 ( 2013 ) 223 – 229
Time(sec)
Freq
(hz)
0 0.2 0.4 0.6 0.8 1 1.2 1.4 1.6
500
1000
1500
2000
2500
3000
twt0
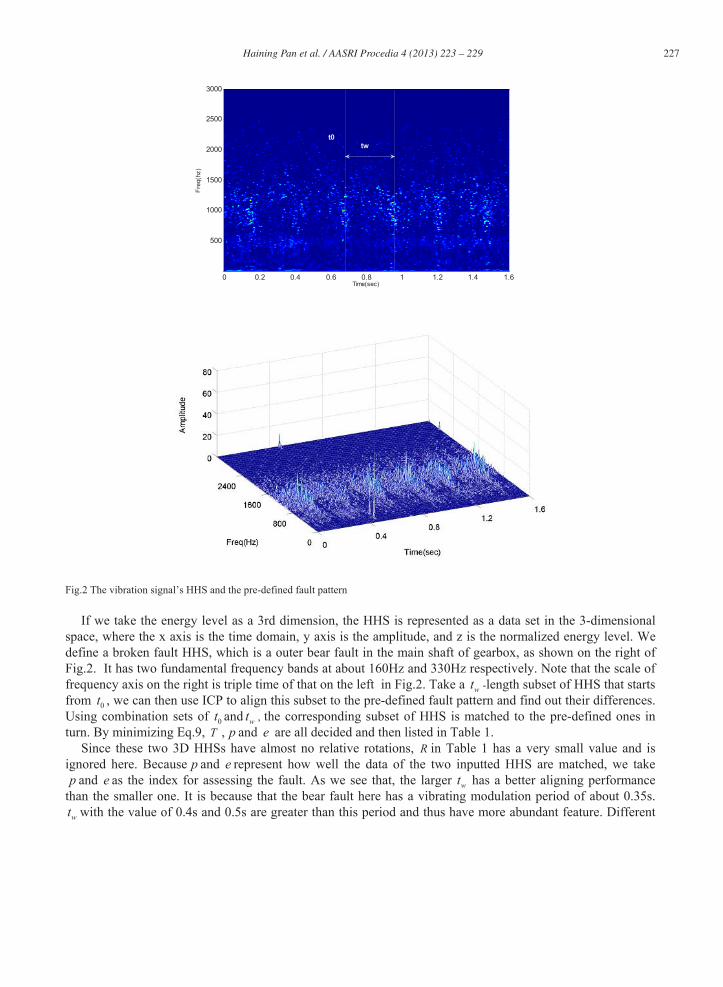
Fig.2 The vibration signal’s HHS and the pre-defined fault pattern
If we take the energy level as a 3rd dimension, the HHS is represented as a data set in the 3-dimensional space, where the x axis is the time domain, y axis is the amplitude, and z is the normalized energy level. We define a broken fault HHS, which is a outer bear fault in the main shaft of gearbox, as shown on the right of Fig.2. It has two fundamental frequency bands at about 160Hz and 330Hz respectively. Note that the scale of frequency axis on the right is triple time of that on the left in Fig.2. Take a wt -length subset of HHS that starts from 0t , we can then use ICP to align this subset to the pre-defined fault pattern and find out their differences. Using combination sets of 0t and wt , the corresponding subset of HHS is matched to the pre-defined ones in turn. By minimizing Eq.9, T , p and e are all decided and then listed in Table 1.
Since these two 3D HHSs have almost no relative rotations, R in Table 1 has a very small value and is ignored here. Because p and e represent how well the data of the two inputted HHS are matched, we take p and e as the index for assessing the fault. As we see that, the larger wt has a better aligning performance
than the smaller one. It is because that the bear fault here has a vibrating modulation period of about 0.35s. wt with the value of 0.4s and 0.5s are greater than this period and thus have more abundant feature. Different

228 Haining Pan et al. / AASRI Procedia 4 ( 2013 ) 223 – 229
0t may affect the translational vector T . Taking 0.4=wt for example, the translation in the x axis is 0.1129 when 0 0.6=t , 0.0231 when 0 0.2=t and 0.0225 when 0 1.0=t . This relies on the way that the fault pattern is defined. Since the pattern here contains peak energy at 0.3s, it seems like a subset of the measured signal’s HHS that starts around 0 0.2=t , so it could be aligned to the fault pattern within a small translation at this time.
Table 1. Results of HHS matching process with different time scales
wt 0t R T p (%) e (RMS)
0.3 0.2 -- [0.0342; 3.36; 0.12] 80.57 0.5494
0.3 0.6 -- [0.1021; 4.19; 0.09] 84.28 0.4653
0.3 1.0 -- [0.0261; 4.16; 0.08] 82.10 0.5002
0.4 0.2 -- [0.0231; 4.32; 0.02] 90.87 0.3319
0.4 0.6 -- [0.1129; 4.09; 0.06] 91.32 0.3648
0.4 1.0 -- [0.0225; 3.14; 0.06] 91.06 0.3363
0.5 0.2 -- [0.0315; 3.36; 0.02] 91.08 0.3319
0.5 0.6 -- [0.1048; 3.56; 0.06] 90.48 0.3648
0.5 1.0 -- [0.0223; 3.61; 0.06] 91.23 0.3363
5. Conclusions
Focusing on the WTG’s mechanical fault diagnosis and classification, we developed a condition assessment method by matching the HHS of vibration. We conclude that, for the specific vibration signal in the simulation, by implementing a gradient descent ICP process, the HHS of the original vibration signal matches the defined pattern well. Results show that the ICP-based mechanical assessment is applicable when there is a clear disparity of vibration energy distribution, which is an advantageous situation for ICP to find the HHS characters. The measured vibration signal had better has a period longer than its vibrating modulation period. If the signal is complex or has a mixed bandwidth, additional rules should be introduced to classify the fault pattern.
6. Acknowledgements
This work was financially supported by National Key Basic Research Program of China (973 Program) 2012CB215205.
References
[1] Tsai CS, Hsieh CT, Huang SJ. Enhancement of damage detection of wind turbine blades via cwt-based approaches. IEEE Transactions on Energy Conversion 2006; 21:776-782 [2] Wu TY, Chen JC, Wang CC. Characterization of gear faults in variable rotating speed using Hilbert-Huang Transform and instantaneous dimensionless frequency normalization. Mechanical Systems and Signal Processing 2012; 30: 103-122 [3] Hua Q, He ZJ, Zhang ZS. Fault diagnosis of rotating machinery based on improved wavelet package transform and svms ensemble. Mechanical Systems and Signal Processing 2007; 688-694 [4] Wang CC, Kang Y and Shen PC. Applications of fault diagnosis in rotating machinery by using time series analysis with neural networks. Expert System Application 2010; 37:1696-1701

229 Haining Pan et al. / AASRI Procedia 4 ( 2013 ) 223 – 229
[5] Lei Y, Zuo MJ. Gear Crack Level Identification Based on Weighted K Nearest Neighbor Classification Algorithm. Mech. Syst. Signal Process 2009; 23:1535-1541 [6] Rusinkiewicz S, Levoy, M. Efficient variants of the ICP algorithm. Third International Conference on 3D Digital Imaging and Modeling 2001: 21-27 [7] Penga ZK, Tsea PW, Chu FL. A comparison study of improved Hilbert–Huang transform and wavelet transform:Application to fault diagnosis for rolling bearing. Mechanical Systems and Signal Processing 2005; 19: 974-988