Embed Size (px)
Citation preview

C O R P O R A T I O N
Measuring the Resilience of Energy Distribution Systems
Henry H. Willis and Kathleen Loa

Limited Print and Electronic Distribution Rights
This document and trademark(s) contained herein are protected by law. This representation of RAND intellectual property is provided for noncommercial use only. Unauthorized posting of this publication online is prohibited. Permission is given to duplicate this document for personal use only, as long as it is unaltered and complete. Permission is required from RAND to reproduce, or reuse in another form, any of its research documents for commercial use. For information on reprint and linking permissions, please visit www.rand.org/pubs/permissions.html.
The RAND Corporation is a research organization that develops solutions to public policy challenges to help make communities throughout the world safer and more secure, healthier and more prosperous. RAND is nonprofit, nonpartisan, and committed to the public interest.
RAND’s publications do not necessarily reflect the opinions of its research clients and sponsors.
Support RANDMake a tax-deductible charitable contribution at
www.rand.org/giving/contribute
www.rand.org
For more information on this publication, visit www.rand.org/t/RR883
Published by the RAND Corporation, Santa Monica, Calif.
© Copyright 2015 RAND Corporation
R® is a registered trademark.

iii
Preface
As policymakers continue to consider the complex risks from natural disasters, terrorism, aging infrastructure, and climate change, resilience is a topic that is likely to receive increasing atten-tion. If energy infrastructure’s resilience is to improve, better use of metrics will be crucial to guiding planning and evaluating progress. This report reviews literature on metrics for energy system resilience to help the U.S. Department of Energy develop a framework for evaluating and improving the resilience of energy systems for use in its ongoing efforts to draft the first Quadrennial Energy Review.
The report was sponsored by the U.S. Department of Energy, Office of Energy Policy and Systems Analysis. It should be of interest to policymakers, energy industry professionals, and researchers interested in understanding how to manage resilience of infrastructure systems.
The RAND Environment, Energy, and Economic Development Program
The research reported here was conducted in the RAND Environment, Energy, and Economic Development Program, which addresses topics relating to environmental quality and regula-tion, water and energy resources and systems, climate, natural hazards and disasters, and eco-nomic development, both domestically and internationally. Program research is supported by government agencies, foundations, and the private sector.
This program is part of RAND Justice, Infrastructure, and Environment, a division of the RAND Corporation dedicated to improving policy and decisionmaking in a wide range of policy domains, including civil and criminal justice, infrastructure protection and homeland security, transportation and energy policy, and environmental and natural resource policy.
Questions or comments about this report should be sent to the project leader, Henry H. Willis ([email protected]). For more information about the Environment, Energy, and Economic Development Program, see http://www.rand.org/energy or contact the director at [email protected].


v
Acknowledgments
The authors wish to thank Debra Knopman (RAND Corporation), Keith Crane (RAND Cor-poration), Eric Vugrin (Sandia National Laboratory), and Ross Guttromson (Sandia National Laboratory) for the discussions and suggestions they provided while this work was completed.

vii
Contents
Preface . . . . . . . . . . . . . . . . . . . . . . . . . . . . . . . . . . . . . . . . . . . . . . . . . . . . . . . . . . . . . . . . . . . . . . . . . . . . . . . . . . . . . . . . . . . . . . . . . . . . . . . . . . . iiiAcknowledgments . . . . . . . . . . . . . . . . . . . . . . . . . . . . . . . . . . . . . . . . . . . . . . . . . . . . . . . . . . . . . . . . . . . . . . . . . . . . . . . . . . . . . . . . . . . . . . vFigures and Tables . . . . . . . . . . . . . . . . . . . . . . . . . . . . . . . . . . . . . . . . . . . . . . . . . . . . . . . . . . . . . . . . . . . . . . . . . . . . . . . . . . . . . . . . . . . . . ix
CHAPTER ONE
Measuring the Resilience of Energy Distribution Systems . . . . . . . . . . . . . . . . . . . . . . . . . . . . . . . . . . . . . . . . . . . . . 1
CHAPTER TWO
Defining Resilience for Infrastructure Systems . . . . . . . . . . . . . . . . . . . . . . . . . . . . . . . . . . . . . . . . . . . . . . . . . . . . . . . . . . . 3
CHAPTER THREE
A Framework for Organizing Resilience Metrics . . . . . . . . . . . . . . . . . . . . . . . . . . . . . . . . . . . . . . . . . . . . . . . . . . . . . . . . . 7
CHAPTER FOUR
Existing Metrics for Resilience of Electricity, Refined Oil, and Natural Gas Systems . . . . . . . . . . . . 9
CHAPTER FIVE
Developing Metrics for Energy Resilience . . . . . . . . . . . . . . . . . . . . . . . . . . . . . . . . . . . . . . . . . . . . . . . . . . . . . . . . . . . . . . . 23Improve Collection and Management of Data on Inputs and Capacities at the Facility and
System Levels . . . . . . . . . . . . . . . . . . . . . . . . . . . . . . . . . . . . . . . . . . . . . . . . . . . . . . . . . . . . . . . . . . . . . . . . . . . . . . . . . . . . . . . . . . . . . . 23Develop Better Measures of Capabilities at the System and Regional Levels . . . . . . . . . . . . . . . . . . . . . . . . . . . 23Improve Understanding of How Capabilities and Performance Translate to Outcomes at
the Regional and National Levels . . . . . . . . . . . . . . . . . . . . . . . . . . . . . . . . . . . . . . . . . . . . . . . . . . . . . . . . . . . . . . . . . . . . . . . 24
Bibliography . . . . . . . . . . . . . . . . . . . . . . . . . . . . . . . . . . . . . . . . . . . . . . . . . . . . . . . . . . . . . . . . . . . . . . . . . . . . . . . . . . . . . . . . . . . . . . . . . . . . 25


ix
Figures and Tables
Figures 2.1. Resilience Describes the State of Service from a System in Response to a Disruption . . . . . 4 2.2. Different Systems Will Have Different Resilience to the Same Disruption . . . . . . . . . . . . . . . . . 5 2.3. Different Responses Will Lead to Different Resilience at Different Costs . . . . . . . . . . . . . . . . . . . 5 2.4. Resilience of a System Also Depends on the Timescale Considered . . . . . . . . . . . . . . . . . . . . . . . . . 6 3.1. Metrics Can Serve Both Operational and Strategic Decisionmaking . . . . . . . . . . . . . . . . . . . . . . . . 8 4.1. Summary of Reviewed Literature on Energy Resilience Metrics, by Sector . . . . . . . . . . . . . . . 10 4.2. Summary of Metrics Identified, by Resolution . . . . . . . . . . . . . . . . . . . . . . . . . . . . . . . . . . . . . . . . . . . . . . . . 12 4.3. Summary of Facility/System Metrics Identified, by Type . . . . . . . . . . . . . . . . . . . . . . . . . . . . . . . . . . . . . 12 4.4. Summary of System/Region/Nation Metrics Identified, by Type . . . . . . . . . . . . . . . . . . . . . . . . . . . 13
Tables 4.1. Overview of Literature Review . . . . . . . . . . . . . . . . . . . . . . . . . . . . . . . . . . . . . . . . . . . . . . . . . . . . . . . . . . . . . . . . . . . . 9 4.2. Energy Resilience Metrics for Electricity Systems at the Facility/System Level . . . . . . . . . . . . 14 4.3. Energy Resilience Metrics for Electricity Systems at the System/Region Level . . . . . . . . . . . . 17 4.4. Energy Resilience Metrics for Electricity Systems at the Region/Nation Level . . . . . . . . . . . . 19 4.5. Energy Resilience Metrics for Oil and Natural Gas Systems at the Facility/System
Level . . . . . . . . . . . . . . . . . . . . . . . . . . . . . . . . . . . . . . . . . . . . . . . . . . . . . . . . . . . . . . . . . . . . . . . . . . . . . . . . . . . . . . . . . . . . . . . . 20 4.6. Energy Resilience Metrics for Oil and Natural Gas Systems at the System/
Region Level . . . . . . . . . . . . . . . . . . . . . . . . . . . . . . . . . . . . . . . . . . . . . . . . . . . . . . . . . . . . . . . . . . . . . . . . . . . . . . . . . . . . . . . . 21 4.7. Energy Resilience Metrics for Oil and Natural Gas Systems at the Region/Nation
Level . . . . . . . . . . . . . . . . . . . . . . . . . . . . . . . . . . . . . . . . . . . . . . . . . . . . . . . . . . . . . . . . . . . . . . . . . . . . . . . . . . . . . . . . . . . . . . . . 22


1
CHAPTER ONE
Measuring the Resilience of Energy Distribution Systems
The U.S. economy depends on reliable and affordable distribution of energy. However, energy distribution systems are vulnerable to a diverse and dynamic set of disruptions. Sev-eral events over the past few years highlight the range of challenges that energy distribution systems need to address and how those challenges are evolving due to climate change and new technologies.
In 2012, Superstorm Sandy left more than 8.5 million customers without power, with out-ages persisting more than one week (U.S. Department of Energy, 2012a). While communities recovered, residents faced shortages of gasoline that persisted during the same period (National Association of Convenience Stores, 2013). Extreme cold spells in the Northeast during the winter of 2014 sharply increased demand for natural gas, leading the prices of gas and elec-tricity to rise (U.S. Energy Information Association, 2014). Furthermore, in 2013, Pacific Gas and Electric Company’s Metcalf transmission substation in San Jose, California, suffered a complex attack involving the physical damage of transformers and the systematic disabling of both emergency response communications and supervisory control and data acquisition systems, highlighting the vulnerability of the power grid to both physical and cyber sabotage ( Memmott, 2014).
Events like these have motivated the federal government to develop a coordinated strat-egy to improve infrastructure performance, security, and resilience. Specifically, President Barack Obama has called upon the federal government to (1) advance a national unity of effort to strengthen and maintain secure, functioning, and resilient critical infrastructure (White House, 2013) and (2) strengthen U.S. energy policy by addressing challenges faced by the nation’s energy infrastructure (White House, 2014).
As part of the response to these mandates and as part of the 2014 Quadrennial Energy Review, the Department of Energy asked the RAND Corporation to develop a framework for measuring the resilience of energy distribution systems and to summarize the state of metrics for resilience of the electric power, refined oil, and natural gas distribution systems.
This report summarizes the concepts addressed by measures of resilience (Chapter Two), describes a framework for organizing alternative metrics used to measure resilience of energy distribution systems (Chapter Three), and reviews the state of metrics for resilience of such systems (Chapter Four).

3
CHAPTER TWO
Defining Resilience for Infrastructure Systems
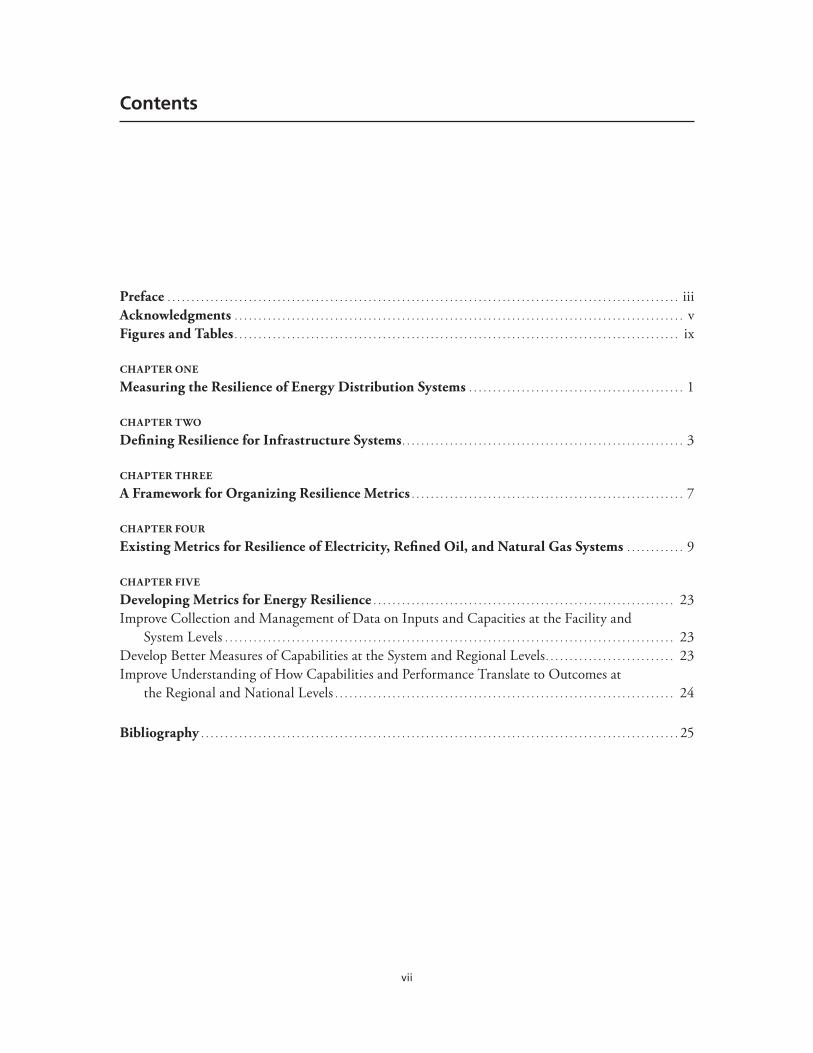
Resilience has been defined many ways. Consider, for example, the following definitions from engineering literature, policy directives, and the academic community:
Resilience is the ability of the system to withstand a major disruption within acceptable degradation parameters and to recover within an acceptable time and composite costs and risks. (Haimes, 2009)
Resilience is the ability to prepare for and adapt to changing conditions and withstand and recover rapidly from disruptions. . . . [It] includes the ability to withstand and recover from deliberate attacks, accidents, or naturally occurring threats or incidents. (White House, 2013)
Resilience is the ability to prepare and plan for, absorb, recover from, and more success-fully adapt to adverse events. (Committee on Increasing National Resilience to Hazards and Disasters; Committee on Science, Engineering, and Public Policy; and The National Academies, 2012)
While distinctions exist among definitions, comparing them reveals four aspects of the system being addressed.
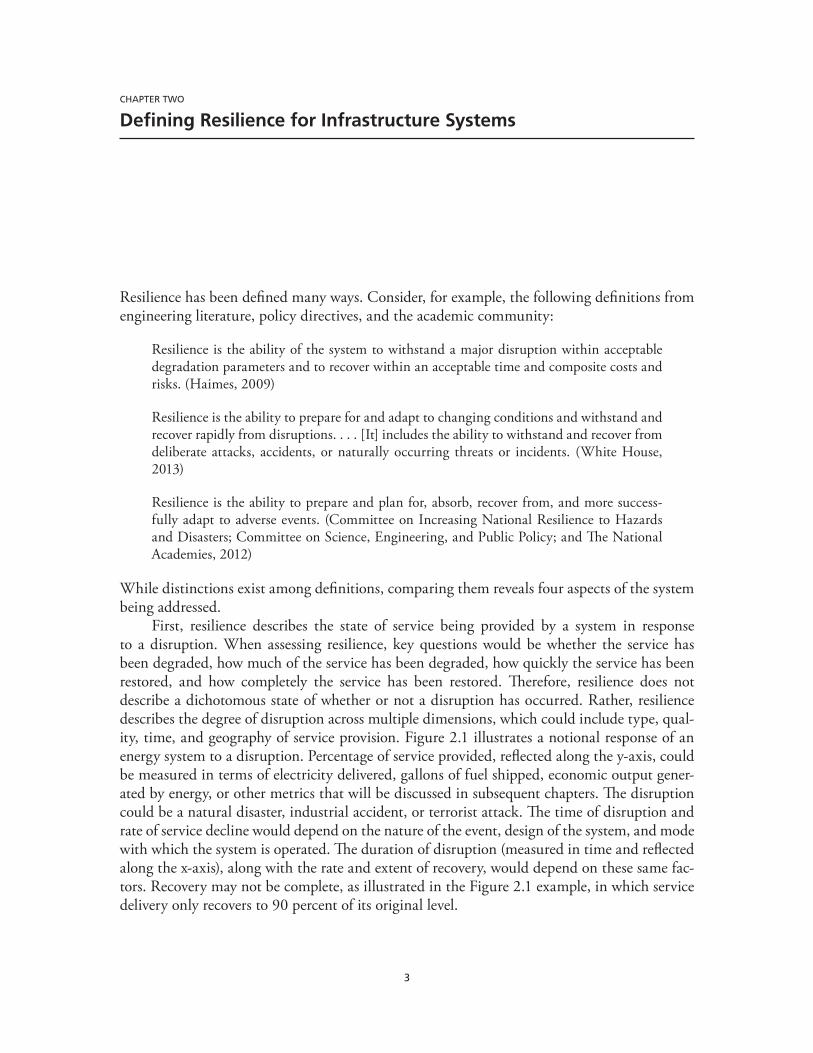
First, resilience describes the state of service being provided by a system in response to a disruption. When assessing resilience, key questions would be whether the service has been degraded, how much of the service has been degraded, how quickly the service has been restored, and how completely the service has been restored. Therefore, resilience does not describe a dichotomous state of whether or not a disruption has occurred. Rather, resilience describes the degree of disruption across multiple dimensions, which could include type, qual-ity, time, and geography of service provision. Figure 2.1 illustrates a notional response of an energy system to a disruption. Percentage of service provided, reflected along the y-axis, could be measured in terms of electricity delivered, gallons of fuel shipped, economic output gener-ated by energy, or other metrics that will be discussed in subsequent chapters. The disruption could be a natural disaster, industrial accident, or terrorist attack. The time of disruption and rate of service decline would depend on the nature of the event, design of the system, and mode with which the system is operated. The duration of disruption (measured in time and reflected along the x-axis), along with the rate and extent of recovery, would depend on these same fac-tors. Recovery may not be complete, as illustrated in the Figure 2.1 example, in which service delivery only recovers to 90 percent of its original level.
4 Measuring the Resilience of Energy Distribution Systems
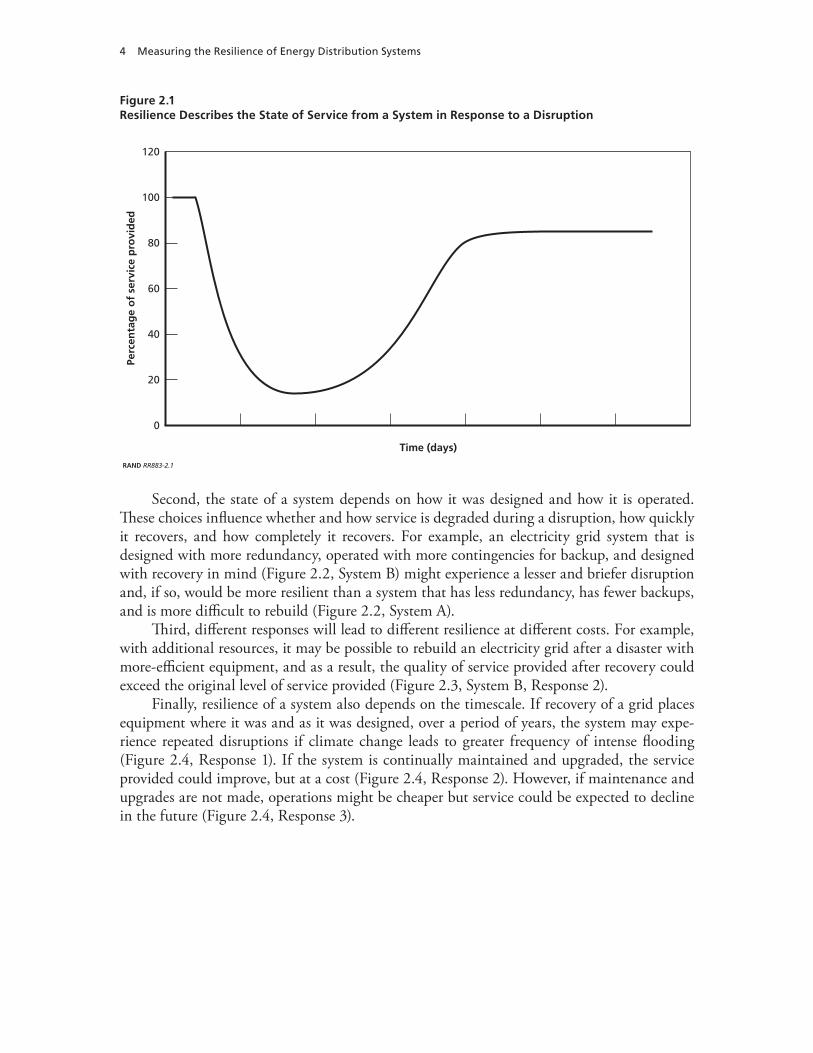
Second, the state of a system depends on how it was designed and how it is operated. These choices influence whether and how service is degraded during a disruption, how quickly it recovers, and how completely it recovers. For example, an electricity grid system that is designed with more redundancy, operated with more contingencies for backup, and designed with recovery in mind (Figure 2.2, System B) might experience a lesser and briefer disruption and, if so, would be more resilient than a system that has less redundancy, has fewer backups, and is more difficult to rebuild (Figure 2.2, System A).
Third, different responses will lead to different resilience at different costs. For example, with additional resources, it may be possible to rebuild an electricity grid after a disaster with more-efficient equipment, and as a result, the quality of service provided after recovery could exceed the original level of service provided (Figure 2.3, System B, Response 2).
Finally, resilience of a system also depends on the timescale. If recovery of a grid places equipment where it was and as it was designed, over a period of years, the system may expe-rience repeated disruptions if climate change leads to greater frequency of intense flooding (Figure 2.4, Response 1). If the system is continually maintained and upgraded, the service provided could improve, but at a cost (Figure 2.4, Response 2). However, if maintenance and upgrades are not made, operations might be cheaper but service could be expected to decline in the future (Figure 2.4, Response 3).
Figure 2.1Resilience Describes the State of Service from a System in Response to a Disruption
RAND RR883-2.1
0
20
40
60
80
100
120
Time (days)
Perc
enta
ge
of
serv
ice
pro
vid
ed

Defining Resilience for Infrastructure Systems 5
Figure 2.2Different Systems Will Have Different Resilience to the Same Disruption
RAND RR883-2.2
0
20
40
60
80
100
120
Time (days)
Perc
enta
ge
of
serv
ice
pro
vid
ed System A
System B
Figure 2.3Different Responses Will Lead to Different Resilience at Different Costs
RAND RR883-2.3
0
20
40
60
80
100
120
Time (days)
Perc
enta
ge
of
serv
ice
pro
vid
ed System A, Response 1
System B, Response 1
System B, Response 2

6 Measuring the Resilience of Energy Distribution Systems
Our review of definitions finds additional concepts that are sometimes included in definitions of resilience. Some of these are redundant; others distinguish important system characteristics. Examples are reliability, robustness, recoverability, sustainability, hardness, vulnerability, fault tolerance, and redundancy. While relevant, these additional terms are not used consistently. Reconciling the competing definitions of resilience in the literature is a dif-ficult and not terribly productive task. Instead, when attempting to define metrics of resilience in the context of the Quadrennial Energy Review, it is more important to capture the relevant aspects of service delivery, system design, system operations, disruptions, costs, and timescale.
Figure 2.4Resilience of a System Also Depends on the Timescale Considered
RAND RR883-2.4
0
20
40
60
80
100
120
Time (years)
Perc
enta
ge
of
serv
ice
pro
vid
ed System A, Response 1
System A, Response 3
System A, Response 2

7
CHAPTER THREE
A Framework for Organizing Resilience Metrics
We track metrics to be able to keep score, to tell whether goals have been met or whether success has been achieved. We track metrics to improve quality, to tell where improvements are possible and whether progress is being made. We also track metrics simply to account for resources, to tell whether budgets are being met and to know where assets reside.
Metrics of resilience are used for many purposes and at many levels. Some of the reasons for metrics are more relevant to a federal perspective and others to a local or facility perspec-tive. For example, at a national or regional level, it may be important to know how resilience affects economic output or economic damage stemming from disasters. For a refinery operator, it may be more important to know how many spare parts are in stock and what options exist for backup power generation.
There is no single set of metrics that supports all decisionmaking needs; rather, each purpose may need a unique set of metrics. But across levels of decisionmaking, the metrics ought to be organized within a consistent measurement framework. Logic models provide a consistent framework for organizing metrics in the fields of program evaluation and qual-ity improvement (Rogers et al., 2000; Greenfield, Williams, and Eiseman, 2006). From an operational perspective, a logic model explains how activities, budgets, and people (i.e., inputs) ultimately contribute to desired outcomes. From a strategic perspective, a logic model explains which inputs are needed to support strategy. From either perspective, a hierarchy of metrics exists to connect inputs to outcomes and improve understanding about how to achieve out-comes more effectively and efficiently (Figure 3.1).
The building blocks of resilience are inputs, which define what is available to support resil-ience. In the context of energy systems, examples of inputs include budgets, equipment, spare parts, and personnel to support recovery operations. On their own, these inputs do not provide resilience unless they are organized to support functions or tasks.
In a logic model framework, the ways in which inputs are organized to support resil-ience are called capacities. Examples of capacities for energy systems include response teams capable of repairing equipment, recovery plans that can be implemented following a disaster, or advanced technologies that can be used to reroute power and reconstitute portions of a grid during disruptions. Having these capacities in place is not the same thing as being able to use them, however.
Capability metrics reflect how well capacities can serve a system when they are needed. Ultimately, capability metrics describe how proficiently tasks can be performed. Examples include the ability to detect leaks or outages, to repair damaged power lines or pipelines, or to restore power outages.

8 Measuring the Resilience of Energy Distribution Systems
Capabilities are ultimately desired because they improve system performance. Performance metrics describe what is produced by an engineered system. In the context of energy systems, examples of metrics include the amount of energy delivered or operating characteristics of the system, such as efficiency, reliability, fault tolerance, sustainability, or robustness.
In the end, the performance of energy systems depends on how the systems generate the outcomes that society is seeking to achieve. Resilience of energy systems can be measured by many outcomes, such as reduced damage from disasters, increased economic activity, or reduced deaths and injuries from disasters.
The literature on measuring resilience contains examples of metrics from each of these categories: inputs, capacities, capabilities, performance, and outcomes. When selecting metrics for resilience, it is useful to understand the availability and maturity of metrics that exist across these categories.
Figure 3.1Metrics Can Serve Both Operational and Strategic Decisionmaking
RAND RR883-3.1
Operational Perspective
Strategic Perspective
PerformanceCapabilitiesCapacitiesInputs Outcomes
What is produced?
What tasks can be performed?
How are inputs organized?
What is available?
What is achieved?
Examples• Energy delivery• Efficiency• Reliability• Hardness• Robustness• Sustainability
Examples• Outage
detection• Line repair• Backup delivery• Outage
restoration
Examples• Response teams• Plans• Aid agreements• Smat-grid tech
Examples• Budgets• Equipment• Number of
spare parts• Number of
generators• Number of
workers
Examples• Increased
economicactivity
• Reduced costsand damage
• Improvedhuman welfare

9
CHAPTER FOUR
Existing Metrics for Resilience of Electricity, Refined Oil, and Natural Gas Systems
To better understand how industry, governments, and communities assess the resilience of energy systems, we reviewed published reports and peer-reviewed journal articles to find exam-ples of metrics that are being discussed and used. We analyzed studies from 1997 to 2014, identified by searching several commonly used databases for terms related to measurement, resilience, and energy (see Table 4.1).
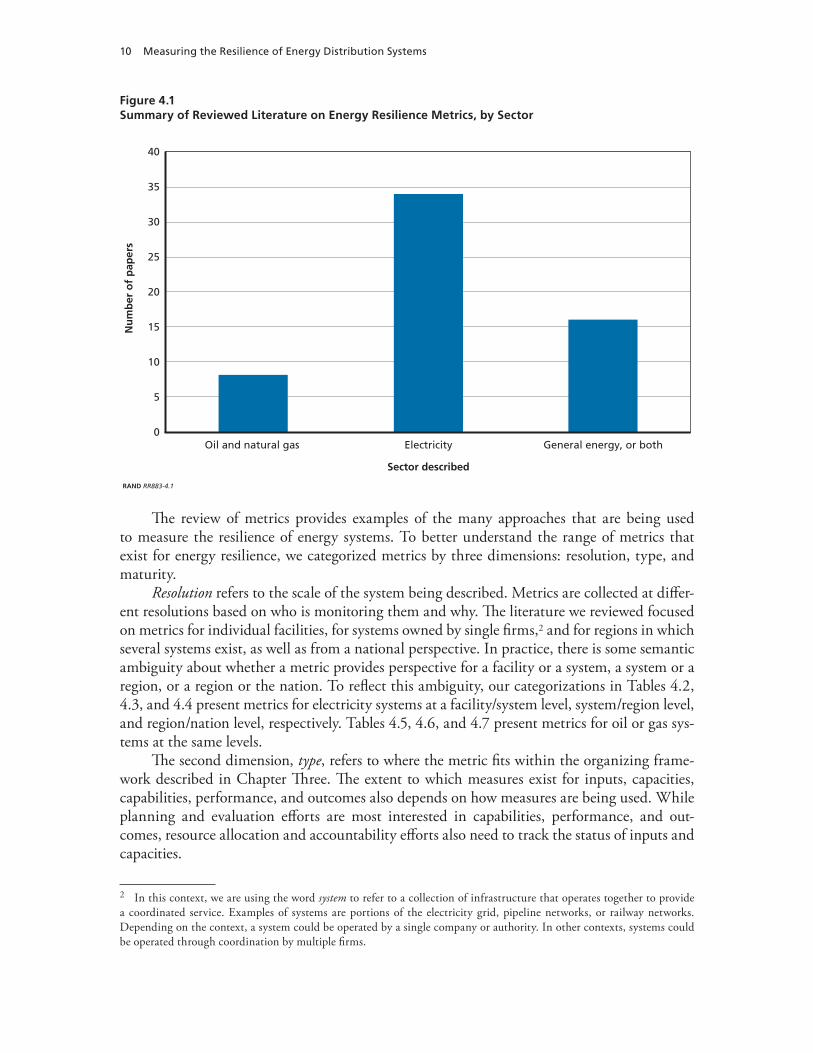
The literature search identified 58 papers and reports related to measuring energy system resilience (see Figure 4.1), and we reviewed each paper to identify resilience metrics. Tables 4.2, 4.3, and 4.4 list examples of metrics that were discussed in these papers.1 The 154 metrics that we identified illustrate the types of resilience metrics that are used across the energy industry. The units used and concepts tracked by metrics vary at each level of the hierarchy. At the input level, metrics tend to describe the amount of energy produced, transmitted, or stored or the number of people, facilities, or equipment available to support these activities. At the capacity level, metrics describe the existence and extent of systems, policies, and organizations in place to support energy capabilities. At the capability level, metrics describe the potential for energy systems to provide sources or factors that determine that capability. At the performance level, metrics describe the quality, amount, and efficiency of the services being provided by energy systems. Finally, the outcome level describes how energy influences aspects of societal welfare through health, safety, and the economy. Examples and descriptions of specific metrics can be found in the literature cited for each exemplary metric.
1 The citations listed in Tables 4.2, 4.3, and 4.4 are instances where the metric can be found in the literature. In some cases, the same metric was listed in several papers. We did not attempt to catalog all citations for each metric. As a result, we have also not cited in these tables every paper that was reviewed as part of this study. The full list of papers reviewed is included in the bibliography.
Table 4.1Overview of Literature Review
Criteria Details of Literature Review
Databases searched Web of Science, GreenFile, Science.gov, Google, Google Scholar
Years included 1997–2014
Search terms used distribution, electrical power, electricity, energy, fuel, gasoline, generation, grid, indicator, index, measure, metric, natural gas, nuclear, petrochemical, petroleum, pipelines, power, production, redundancy, reliability, resilience, transmission, vulnerability
10 Measuring the Resilience of Energy Distribution Systems
The review of metrics provides examples of the many approaches that are being used to measure the resilience of energy systems. To better understand the range of metrics that exist for energy resilience, we categorized metrics by three dimensions: resolution, type, and maturity.
Resolution refers to the scale of the system being described. Metrics are collected at differ-ent resolutions based on who is monitoring them and why. The literature we reviewed focused on metrics for individual facilities, for systems owned by single firms,2 and for regions in which several systems exist, as well as from a national perspective. In practice, there is some semantic ambiguity about whether a metric provides perspective for a facility or a system, a system or a region, or a region or the nation. To reflect this ambiguity, our categorizations in Tables 4.2, 4.3, and 4.4 present metrics for electricity systems at a facility/system level, system/region level, and region/nation level, respectively. Tables 4.5, 4.6, and 4.7 present metrics for oil or gas sys-tems at the same levels.
The second dimension, type, refers to where the metric fits within the organizing frame-work described in Chapter Three. The extent to which measures exist for inputs, capacities, capabilities, performance, and outcomes also depends on how measures are being used. While planning and evaluation efforts are most interested in capabilities, performance, and out-comes, resource allocation and accountability efforts also need to track the status of inputs and capacities.
2 In this context, we are using the word system to refer to a collection of infrastructure that operates together to provide a coordinated service. Examples of systems are portions of the electricity grid, pipeline networks, or railway networks. Depending on the context, a system could be operated by a single company or authority. In other contexts, systems could be operated through coordination by multiple firms.
Figure 4.1Summary of Reviewed Literature on Energy Resilience Metrics, by Sector
RAND RR883-4.1
0
5
10
15
30
35
40
Sector described
Oil and natural gas Electricity General energy, or both
Nu
mb
er o
f p
aper
s
25
20

Existing Metrics for Resilience of Electricity, Refined Oil, and Natural Gas Systems 11
Maturity refers to how well defined the metrics are, how systematically they are collected, and how well they are organized. Our assessment of maturity reflects the practical challenges that extend beyond defining metrics and that can arise when collecting and managing data. We categorized metrics into three levels of maturity:
• Low—Metrics are mentioned in the literature but not consistently defined, and, if col-lected, only sporadically or inconsistently.
• Medium—Metrics are collected using well-defined methods but collected sporadically.• High—Metrics are collected using well-defined methods and collected at the appropriate
timescale.
By categorizing the metrics in this way, we drew three observations about the state of measur-ing resilience of energy systems.
First, there are more metrics for electricity systems (105 in the reviewed literature) than for systems for oil or natural gas (67 metrics).3 The difference in numbers of metrics is a result of two factors. First, as Figure 4.1 illustrates, we identified fewer papers about oil and gas systems than about electricity systems. Second, the papers about electricity systems covered more aspects of resilience than the papers about oil and gas systems. Greater attention to the resilience of electricity systems is not surprising, given that the electricity grid infrastructure (e.g., transmission and distribution lines) is more exposed and vulnerable to disruptions than oil and gas infrastructure (e.g., pipelines and storage tanks).
Second, the literature pays more attention to metrics for the more detailed levels of facili-ties and systems. Almost half of the metrics identified (70 of 154) describe aspects of systems at the facility and system levels (see Figure 4.2). Many more types of inputs and capacities are measured as part of inventory and accounting processes across the energy industry than were identified in the literature.
While there is greater attention to metrics at the facility/system level, these metrics pre-dominantly described inputs, capabilities, and performance (63 of 70 shown in Figure 4.3). Only one outcome metric was identified for the facility/system level, a component of a loss damage index describing damage caused by fire. Furthermore, most of these metrics (53 of 70) were judged to be of low or medium maturity. One possible explanation for this is that metrics at the facility and system levels are collected and managed by different entities that are more directly responsible for managing resources to improve performance than for support-ing broader societal outcomes. In addition, each entity may have its own reasons for collecting metrics and may have crafted definitions of metrics that most suit its own needs. Therefore, there may be opportunities to standardize definitions of metrics collected at the facility and system levels and potentially create a systematic means of collecting and aggregating data across facilities and systems if efficient means of doing so can be implemented.
3 Although only 154 metrics were identified, some metrics are relevant to more than one sector. Thus, the total mentioned here is 172.

12 Measuring the Resilience of Energy Distribution Systems
Figure 4.2Summary of Metrics Identified, by Resolution
RAND RR883-4.2
0
10
20
30
60
70
80
Resolution of metrics
Facility/system System/region Region/nation
Res
olu
tio
n
50
40
Figure 4.3Summary of Facility/System Metrics Identified, by Type
RAND RR883-4.3
0
5
10
15
30
35
40
Type of metric
Typ
e
25
20
PerformanceCapabilitiesCapacitiesInputs Outcomes

Existing Metrics for Resilience of Electricity, Refined Oil, and Natural Gas Systems 13
Third—and in contrast to the facility/system level—regional and national metrics focus more on aspects of performance and outcomes. We identified 50 performance and outcome metrics at these levels, and 22 of the 23 outcome metrics were at the system/region/nation level (see Figure 4.4). Generally, performance measures existed at the system/region level and were of medium to high maturity. In comparison, outcome measures were identified at both the system/region and region/nation levels, but they were judged to be of low or medium maturity. Furthermore, the literature did not clearly describe how the performance of systems contributed to changes in outcomes. This raises questions about whether it is possible to effec-tively manage energy systems to achieve desired outcomes by tracking performance metrics. As a result, understanding how infrastructure performance contributes to societal outcomes remains an active area of research. This suggests that opportunities may exist to improve track-ing and use of outcome data.
In summary, the metrics from our literature review, presented in Tables 4.2 through 4.7, present a complex picture of how resilience is managed and measured in energy systems. While many metrics exist, there is no single metric or set of metrics for each purpose. Different met-rics are needed to understand resilience at different levels of energy systems, and opportunities exist to improve metrics for each purpose.
Figure 4.4Summary of System/Region/Nation Metrics Identified, by Type
RAND RR883-4.4
0
5
10
15
25
30
Type of metric
Typ
e
20
PerformanceCapabilitiesCapacitiesInputs Outcomes

14 Measu
ring
the R
esilience o
f Energ
y Distrib
utio
n System
s
Table 4.2Energy Resilience Metrics for Electricity Systems at the Facility/System Level
Inputs Capacities Capabilities Performance Outcomes
Energy feedstock (H) (McCarthy, Ogden, and Sperling, 2007)
Energy not supplied (L) (Brancucci Martínez-Anido et al., 2012)
Energy storage (L) (Bhatnagar et al., 2013)
Generators available (#) (H) (Roe and Schulman, 2012)
Hydrophobic coating on equipment (L) (Keogh and Cody, 2013)
Key replacement equipment stockpile (L) (Keogh and Cody, 2013)
Redundant power lines (L) (Keogh and Cody, 2013)
Reinforced concrete versus wooden distribution poles (L) (Keogh and Cody, 2013)
Siting infrastructure (L) (Keogh and Cody, 2013)
Underground, overhead, undersea distribution/cable lines (M) (Doukas et al., 2011; Rouse and Kelly, 2011)
Unique encrypted passwords for utility “smart” distribution (L) (Keogh and Cody, 2013)
Workers employed (#) (H) (McCarthy, Ogden, and Sperling, 2007; Keogh and Cody, 2013)
Communication/control systems/control centers (L) (Ward, 2013)
Electrical protection and metering (L) (Ward, 2013)
Equipment positioning (L) (Keogh and Cody, 2013)
Flow paths, line flow limits (L) (Bompard, Napoli, and Xue, 2010)
Gen/load bus distribution (L) (Bompard, Napoli, and Xue, 2010)
Reserve/spare capacity (M) (Willis and Garrod, 1997; Molyneaux et al., 2012)
Substations (switchyards)—overhead lines and underground cables are interconnected (L) (Ward, 2013)
Ancillary service (L) (Bhatnagar et al., 2013)
Hazard rate relating function—altered hazard rate of component after a certain maintenance (M) (Wang and Guo, 2013)
Line mitigation—reroute electrical flows due to line overloading or “congestion” (L) (Roe and Schulman, 2012)
Load biasing—major adjustments in automated dispatching software (L) (Roe and Schulman, 2012)
Net-ability—measures the aptitude of the grid in transmitting power from generation to load buses efficiently (L) (Bompard, Napoli, and Xue, 2010)
Path redundancy—assesses the available redundancy in terms of paths in transmitting power from a generation to a load bus based on entropy (L) (Bompard, Napoli, and Xue, 2010)
Protective and switching devices—mean time to repair (M) (Yeddanapudi, 2012)
Protective and switching devices—switching reliability (M) (Yeddanapudi, 2012)
Protective and switching devices—mean time to switch (M) (Yeddanapudi, 2012)
Viability of investments (L) (McCarthy, Ogden, and Sperling, 2007)
Coefficient of variation of the frequency index of sags (M) (Shun et al., 2012)
Control Performance Standard 2 violations—one of the California Independent System Operator CIISO principal reliability standards (H) (Roe and Schulman, 2012)
Bulk electric system reliability performance indices (M) (Billinton and Wangdee, 2006)
Derated power—rated power multiple with the reliability of the plant (M) (Voorspools and D’Haeseleer, 2004)
Dropped/lost phase—power quality metric (M) (Rouse and Kelly, 2011)
Edge resilience trajectory—relationship between reliability and resilience tracking a moving range of R2 for the Control Performance Standard 2 (H) (Roe and Schulman, 2012)
Energy efficiency/intensity (H) (Gnansounou, 2008; Molyneaux et al., 2012; Wang et al., 2012)
Failure rate (M) (Wang and Guo, 2013)
Flicker—power quality metric (M) (Rouse and Kelly, 2011)
Harmonic distortions—power quality metric (M) (Rouse and Kelly, 2011)
Overhead and underground line segments—mean time to repair (L) (Yeddanapudi, 2012)
Overhead and underground line segments—permanent failure rate (L) (Yeddanapudi, 2012)
Load loss damage index—damage caused by fire to the electrical system (M) (Lucia, 2012; Bagchi, Sprintson, and Singh, 2013)

Existing
Metrics fo
r Resilien
ce of Electricity, R
efin
ed O
il, and
Natu
ral Gas System
s 15
Inputs Capacities Capabilities Performance Outcomes
Overhead and underground line segments—temporary failure rate (L) (Yeddanapudi, 2012)
Peak-to-peak voltage—power quality metric (M) (Rouse and Kelly, 2011)
Phase imbalance—power quality metric (M) (Rouse and Kelly, 2011)
Protective and switching devices—probability of failure (M) (Yeddanapudi, 2012)
Protective and switching devices—protection reliability (M) (Yeddanapudi, 2012)
Protective and switching devices—Reclose reliability (M) (Yeddanapudi, 2012)
Rapid voltage changes—power quality metric (M) (Rouse and Kelly, 2011)
Resilience index (1)—parameter that quantifies the potential probability for the malfunction of the system (M) (Afgan and Cvetinovic, 2010)
Resilience index (2)—derived from robustness, resourcefulness, and recovery; range from 0 (low resilience) to 100 (high resilience) (M) (Fisher et al., 2010; Carlson et al., 2012; Afgan and Cvetinovic, 2013)
Survivability—evaluate the aptitude of the network in assuring the possibility to match generation and demand in case of failures or attacks (L) (Bompard, Napoli, and Xue, 2010)
System average interruption duration index—sustained outage metric; measures annual systemwide outage duration for sustained outages (H) (Layton, 2004; Eto and LaCommare, 2008; Rouse and Kelly, 2011)
Table 4.2—Continued

16 Measu
ring
the R
esilience o
f Energ
y Distrib
utio
n System
s
Inputs Capacities Capabilities Performance Outcomes
System average interruption frequency index—sustained outage metric; measures systemwide outage frequency for sustained outages (H) (Layton, 2004; Eto and LaCommare, 2008; Rouse and Kelly, 2011)
Unscheduled generator outages (L) (Roe and Schulman, 2012)
Voltage dips—power quality metric (M) (Rouse and Kelly, 2011)
Voltage level/supply voltage variations—power quality metric (M) (Rouse and Kelly, 2011)
Voltage sags/swells—power quality metric (M) (Rouse and Kelly, 2011)
Voltage unbalance—power quality metric (M) (Rouse and Kelly, 2011)
NOTE: Metric appears in bold. Maturity level appears in parentheses: H = high; M = medium; and L = low. The citations included in this table are instances where the metric can be found in the literature, but they are not necessarily exhaustive.
Table 4.2—Continued

Existing
Metrics fo
r Resilien
ce of Electricity, R
efin
ed O
il, and
Natu
ral Gas System
s 17
Table 4.3Energy Resilience Metrics for Electricity Systems at the System/Region Level
Inputs Capacities Capabilities Performance Outcomes
Transmission lines available (#) (M) (Roe and Schulman, 2012)
Functional zones—generation, transmission, and distribution (H) (McCarthy, Ogden, and Sperling, 2007)
Hierarchical levels (HLI, HLII, HLIII)—HLI considers only generating facilities, HLII adds transmission facilities, and HLIII includes all three functional zones (H) (McCarthy, Ogden, and Sperling, 2007)
Operator training (L) (Keogh and Cody, 2013)
Mutual assistant agreements (L) (Keogh and Cody, 2013)
Transformers—connecting parts of the network operating at different voltages (L) (Ward, 2013)
Tree trimming metrics (L) (Keogh and Cody, 2013)
Adequacy—the ability of the system to supply customer requirements under normal operating conditions (H) (McCarthy, Ogden, and Sperling, 2007)
Congestion control (L) (Carvalho et al., 2014)
Average Service Availability Index (ANSI) (H) (Layton, 2004)
Average Service Interruption Duration Index (H) (Yeddanapudi, 2012)
Customer Average Interruption Duration Index—sustained outage metric; measures average duration of sustained outage per customer (H) (Layton, 2004; Eto and LaCommare, 2008; Rouse and Kelly, 2011)
Customer Total Average Interruption Duration Index (H) (Yeddanapudi, 2012)
Customer Average Interruption Frequency Index—measures customer average interruption frequency (H) (Layton, 2004; Rouse and Kelly, 2011)
Customers experiencing longest interruption durations (CELID-X; CELID-8)—sustained outage metric; measures the percentage of customers experiencing extended outages lasting more than X hours (H) (Rouse and Kelly, 2011)
Customers experiencing multiple interruptions (CEMI-X)—sustained outage metric; measures the percentage of customers with multiple outages. This metric helps to measure reliability at a customer level and can identify problems not made apparent by systemwide averages (H) (Rouse and Kelly, 2011)
Customers experiencing multiple momentary interruptions (CEMMI-X; CEMMI-4)—measures the percentage of customers who experienced X momentary interruptions (H) (Rouse and Kelly, 2011)
Customers interrupted per interruption index (H) (Layton, 2004)
Annual price cap (H) (Billinton and Wangdee, 2006)
Annual allowed revenue (H) (Billinton and Wangdee, 2006)
Cost of interruption—social, commercial, industrial, etc. (L) (Doukas et al., 2011)
Impact factor on the population—share of the population affected by the power loss (M) (Poljansek, Bono, and Gutierrez, 2012)
Long-distance transmission costs (M) (Doukas et al., 2011)
Noise (L) (Doukas et al., 2011)
Performance-based regulation reward/penalty structure (L) (Billinton and Wangdee, 2006)
Price of electricity (M) (Doukas et al., 2011)
Value of lost load—value of unserved energy; customers’ value of the opportunity cost of outages or benefits forgone through interruptions in electricity supply (L) (Willis and Garrod, 1997; Lucia, 2012)

18 Measu
ring
the R
esilience o
f Energ
y Distrib
utio
n System
s
Inputs Capacities Capabilities Performance Outcomes
Economy—achieve the best profits by adjusting the power system operation mode to minimize line losses, making full use of equipment, ensuring the security of the power system, and meeting utility users’ demand (M) (Wang, 2012)
Fairness—consists of the fulfillment rate of contract and standard deviation indexes (L) (Wang, 2012)
Interrupted energy assessment rate (M) (Billinton and Wangdee, 2006)
Load point indices per customer—number of outages per year; duration of outages per year; unavailable/available service (M) (Yeddanapudi, 2012)
Loss of offsite power (M) (International Atomic Energy Agency, 2012)
Minimum level of service/targets (M) (Rouse and Kelly, 2011)
Momentary average interruption frequency index—momentary outage metric; measures frequency of momentary outages. Momentary outages and the power surges associated with them can damage consumer products and hurt certain business sectors (M) (Layton, 2004; Rouse and Kelly, 2011)
Security—dynamic response of the system to unexpected interruptions; relates the system’s ability to endure them (H) (McCarthy, Ogden, and Sperling, 2007)
Transmission losses (M) (Doukas et al., 2011)
NOTE: Metric appears in bold. Maturity level appears in parentheses: H = high; M = medium; and L = low. The citations included in this table are instances where the metric can be found in the literature, but they are not necessarily exhaustive.
Table 4.3—Continued

Existing
Metrics fo
r Resilien
ce of Electricity, R
efin
ed O
il, and
Natu
ral Gas System
s 19
Table 4.4Energy Resilience Metrics for Electricity Systems at the Region/Nation Level
Inputs Capacities Capabilities Performance Outcomes
Storm reserve funds (L) (Keogh and Cody, 2013)
Concentration of market suppliers (M) (Blyth and Lefevre, 2004)
Herfindahl-Herschmann index—used to measure market concentration risk; square of each participant’s market share added together across all participants with the largest shares (M) (Blyth and Lefevre, 2004; Reymond, 2007)
Geopolitical market concentration risk (M) (Blyth and Lefevre, 2004)
CO2 emissions (M) (Doukas et al., 2011)
Deregulated electricity markets—allocation of losses (L) (Doukas et al., 2011)
Public deaths/injuries (due to power interruptions) (M) (Australian Electrical Regulatory Authorities Council, 2005–2006; Rouse and Kelly, 2011)
Public deaths/injuries (due to interactions with the distribution system) (M) (Australian Electrical Regulatory Authorities Council, 2005–2006; Rouse and Kelly, 2011)
20 Measu
ring
the R
esilience o
f Energ
y Distrib
utio
n System
s
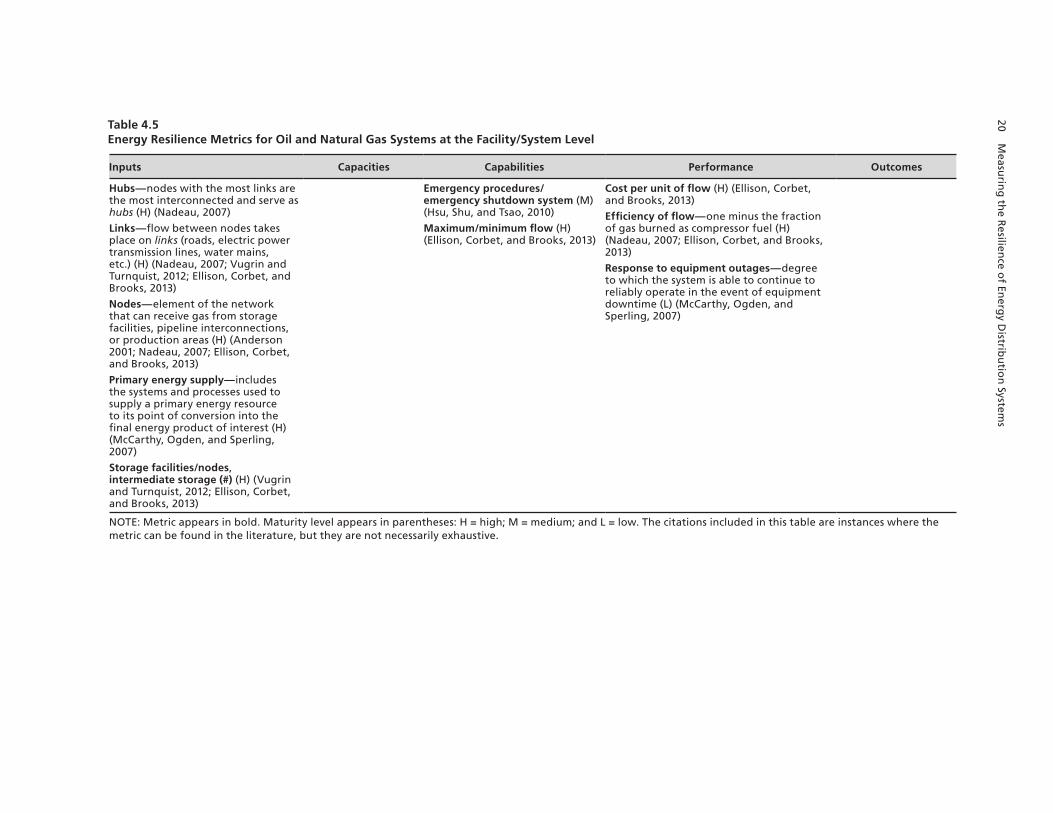
Table 4.5Energy Resilience Metrics for Oil and Natural Gas Systems at the Facility/System Level
Inputs Capacities Capabilities Performance Outcomes
Hubs—nodes with the most links are the most interconnected and serve as hubs (H) (Nadeau, 2007)
Links—flow between nodes takes place on links (roads, electric power transmission lines, water mains, etc.) (H) (Nadeau, 2007; Vugrin and Turnquist, 2012; Ellison, Corbet, and Brooks, 2013)
Nodes—element of the network that can receive gas from storage facilities, pipeline interconnections, or production areas (H) (Anderson 2001; Nadeau, 2007; Ellison, Corbet, and Brooks, 2013)
Primary energy supply—includes the systems and processes used to supply a primary energy resource to its point of conversion into the final energy product of interest (H) (McCarthy, Ogden, and Sperling, 2007)
Storage facilities/nodes, intermediate storage (#) (H) (Vugrin and Turnquist, 2012; Ellison, Corbet, and Brooks, 2013)
Emergency procedures/emergency shutdown system (M) (Hsu, Shu, and Tsao, 2010)
Maximum/minimum flow (H) (Ellison, Corbet, and Brooks, 2013)
Cost per unit of flow (H) (Ellison, Corbet, and Brooks, 2013)
Efficiency of flow—one minus the fraction of gas burned as compressor fuel (H) (Nadeau, 2007; Ellison, Corbet, and Brooks, 2013)
Response to equipment outages—degree to which the system is able to continue to reliably operate in the event of equipment downtime (L) (McCarthy, Ogden, and Sperling, 2007)
NOTE: Metric appears in bold. Maturity level appears in parentheses: H = high; M = medium; and L = low. The citations included in this table are instances where the metric can be found in the literature, but they are not necessarily exhaustive.

Existing
Metrics fo
r Resilien
ce of Electricity, R
efin
ed O
il, and
Natu
ral Gas System
s 21
Table 4.6Energy Resilience Metrics for Oil and Natural Gas Systems at the System/Region Level
Inputs Capacities Capabilities Performance Outcomes
Functional zones—primary energy supply, energy processing, and conversion and transport (M) (McCarthy, Ogden, and Sperling, 2007)
Adaptive capacity—degree to which the system is capable of self-organization for recovery of system performance levels (L) (Vugrin, Warren, and Ehlen, 2011)
Capacity—ability of the system to provide sufficient throughput to supply final demand (M) (McCarthy, Ogden, and Sperling, 2007)
Information security—the degree to which information assets in the system are secure against threats (L) (McCarthy, Ogden, and Sperling, 2007)
Interdependencies—the degree to which the system relies on other infrastructure for its reliable operation and is vulnerable to that infrastructure’s disruption (L) (McCarthy, Ogden, and Sperling, 2007)
Physical security—the degree to which physical assets in the system are security against threats (L) (McCarthy, Ogden, and Sperling, 2007)
Absorptive capacity—degree to which a system can automatically absorb the impacts of a system’s perturbations and minimize consequences with little effort (L) (Vugrin, Warren, and Ehlen, 2011)
Connectivity loss—the average reduction in the ability of sinks to receive flow from sources (M) (Poljansek, Bono, and Gutierrez, 2012)
Energy processing and conversion—relates to production of the final energy product (H) (McCarthy, Ogden, and Sperling, 2007)
Flexibility—the degree to which the system can adapt to changing conditions (L) (McCarthy, Ogden, and Sperling, 2007)
History—the degree to which the system has been prone to disruption in the past (M) (McCarthy, Ogden, and Sperling, 2007)
Intermittency—the degree to which the system lacks constant levels of productivity (M) (McCarthy, Ogden, and Sperling, 2007)
Network resiliency—measured by its ability to keep supplying and distributing natural gas in spite of damage to pipelines, liquefied natural gas import terminals, storage, and other gas sources (M) (Nadeau, 2007)
Response to demand fluctuations—the extent to which the system is able to adapt to changes in the quantity of energy demanded or location of demand (L) (McCarthy, Ogden, and Sperling, 2007)
Systemic impact—impact that a disruption has on system productivity; measured by evaluating the difference between a targeting system performance level and the actual system performance (L) (Vugrin, Warren, and Ehlen, 2011; Vugrin and Turnquist, 2012)
Demand satisfied (%) (H) (Nadeau, 2007)
Impacts on interdependent systems—the degree to which a disruption in the system might feasibly cause damage to interdependent systems (L) (McCarthy, Ogden, and Sperling, 2007)
Optimal resilience costs—resilience costs for a system when the optimal recovery strategy—minimizing the combined system impact and total recovery effort costs—is employed (L) (Vugrin, Warren, and Ehlen, 2011)
Recovery-dependent resilience costs—resilience costs of a system under a particular recovery strategy (L) (Vugrin, Warren, and Ehlen, 2011)
NOTE: Metric appears in bold. Maturity level appears in parentheses: H = high; M = medium; and L = low. The citations included in this table are instances where the metric can be found in the literature, but they are not necessarily exhaustive.

22 Measu
ring
the R
esilience o
f Energ
y Distrib
utio
n System
s
Table 4.7Energy Resilience Metrics for Oil and Natural Gas Systems at the Region/Nation Level
Inputs Capacities Capabilities Performance Outcomes
Diversity of import fuels (H) (Gnansounou, 2009)
Natural gas strategic reserve (M) (Ellison, Kelic, and Corbet, 2006)
Herfindahl-Herschmann index—used to measure market concentration risk; square of each participant’s market share added together across all participants with the largest shares (M) (Blyth and Lefevre, 2004; Reymond, 2007)
Import levels—the degree to which primary energy supply relies on resources originating outside of the country (H) (McCarthy, Ogden, and Sperling, 2007)
Import concentration—the degree to which imports are concentrated among a small group of supplying countries (H) (McCarthy, Ogden, and Sperling, 2007)
Import dependency—divided into source dependence, transit dependence, and facility dependence (M) (Reymond, 2007)
Industrial aspects—vulnerability indicator (M) (Reymond, 2007)
Rate of dependency—measured by the net energy imports/total primary energy consumption ratio (M) (Reymond, 2007)
Vulnerability—proportional to the reliance on imported gas from countries in geopolitical conflict (M) (Reymond, 2007)
Ability to expand facilities—the degree to which the system can be easily and cost-effectively expanded (L) (McCarthy, Ogden, and Sperling, 2007)
Import capacity (M) (Ellison, Corbet, and Brooks, 2013)
Pipeline capacity used (%) (H) (Nadeau, 2007)
Resiliency—ability to supply gas to customers willing to pay the clearing price, even in the face of supply constraints (L) (Ellison, Kelic, and Corbet,2006)
Restorative capacity—ability of a system to be repaired easily; these repairs are considered to be dynamic (L) (Vugrin, Warren, and Ehlen, 2011)
Total recovery effort— efficiency with which the system recovers from a disruption, measured by analyzing the amount of resources expended during the recovery process (L) (Vugrin, Warren, and Ehlen, 2011)
Sector coordination—the degree to which coordination between stakeholders within the sector results in an effective exchange of information alerting stakeholders of emerging threats and mitigation strategies (L) (McCarthy, Ogden, and Sperling, 2007)
Transportation—encompasses the transmission and distribution of the final energy product to its point of end use (H) (McCarthy, Ogden, and Sperling, 2007)
Economic impact—the degree to which a disruption in the system might feasibly cause economic damage to industry stakeholders, the government, or the public (L) (McCarthy, Ogden, and Sperling, 2007)
Environmental impact—the degree to which a disruption in the system might feasibly cause environmental damage (M) (McCarthy, Ogden, and Sperling, 2007)
Human health impact—the degree to which a disruption in the system might feasibly harm the health of employees or the public (M) (McCarthy, Ogden, and Sperling, 2007)
Physical shortage (M) (Ellison, Kelic, and Corbet, 2006)
Price/price volatility (H) (Ellison, Kelic, and Corbet, 2006; McCarthy, Ogden, and Sperling, 2007)
NOTE: Metric appears in bold. Maturity level appears in parentheses: H = high; M = medium; and L = low. The citations included in this table are instances where the metric can be found in the literature, but they are not necessarily exhaustive.

23
CHAPTER FIVE
Developing Metrics for Energy Resilience
Resilience is a topic of interest for policymakers as they consider the complex risks from natu-ral disasters, terrorism, aging infrastructure, and climate change faced by the transmission, storage, and distribution systems for U.S. energy. If energy infrastructure is to become more resilient, better use of metrics will be crucial to guiding planning and evaluating progress. The literature review presented in this report suggests three recommendations that could improve the metrics available to support energy policy.
Improve Collection and Management of Data on Inputs and Capacities at the Facility and System Levels
The literature on energy resilience includes many metrics that describe the state of inputs and capacities for energy facilities or localized energy systems. Because these metrics are col-lected by different organizations and entities for specific purposes, they are frequently not standardized and are rarely collected and managed in a manner that facilitates analysis to support policy. Doing so could provide an evidence base upon which cost-effective strate-gies to improve energy resilience could be developed. Examples of alternative standardization approaches vary, from mandatory regulatory reporting requirements to voluntary adoption of consensus-based management best practices. However, these types of knowledge management alternatives could also be costly. Thus, it is prudent to consider alternative approaches to imple-menting data collection and management, how much they might cost, and how they might serve the interests of different stakeholder groups.
Develop Better Measures of Capabilities at the System and Regional Levels
Improvements in capability are the principal levers through which energy system owners and operators can improve performance to achieve desired societal outcomes. However, this litera-ture review suggests that at the system and regional levels, metrics have not been well defined and performance data on capabilities are not regularly collected.
Measuring capabilities to respond to and recover from extreme events is difficult. For complex energy systems, there is not yet a consensus about what the core required capabili-ties for a system or region should be. Without opportunities to observe performance of capa-bilities regularly, because extreme events are rare, it is difficult to demonstrate proficiency in capabilities. Approaches used to measure and improve quality of services in other contexts—

24 Measuring the Resilience of Energy Distribution Systems
such as health care quality, community resilience, and public health preparedness—illustrate approaches that may be useful. Examples from these fields include extracting insights from exercises and after-action reviews, developing drills that test components of a system, and developing community recommendations through consensus processes that collect experience across communities or sectors.
Defining and measuring capabilities are useful steps in developing a framework for improving the resilience of energy systems. Developing a stronger understanding of what are key capabilities and how to measure a system or region’s proficiency requires public- and private-sector cooperation to identify which capabilities to measure, practical and valid exer-cises or tests of proficiency in those capabilities, and efficient means of collecting and manag-ing data on capability metrics.
Improve Understanding of How Capabilities and Performance Translate to Outcomes at the Regional and National Levels
The goal of improving energy system resilience is to make communities safer and more pro-ductive. The literature on outcomes of energy system resilience reflects these goals and includes many potential outcome metrics. The literature does not, however, provide clarity about how to adjust capabilities and system performance to most effectively achieve desired outcomes. Building this understanding requires a coordinated effort to establish an evidence base in terms of metrics for inputs, capacities, capabilities, and performance described earlier in this chapter. This empirical foundation can then serve as a basis for modeling and understanding the complex technical and social interactions through which energy systems support societal goals for safety and prosperity.

25
Bibliography
Afgan, N., & Cvetinovic, D. (2010). Wind power plant resilience. Thermal Science, 14(2), 533–540. doi: 10.2298/tsci1002533a
———. (2013). Resilience evaluation of the South East European Natural Gas Routes system catastrophe. International Journal of Engineering and Innovative Technology (IJEIT), 3(5), 175–180.
Akhavein, A., & Fotuhi Firuzabad, M. (2011). A heuristic-based approach for reliability importance assessment of energy producers. Energy Policy, 39(3), 1562–1568. doi: 10.1016/j.enpol.2010.12.030
Amirat, A., Mohamed-Chateauneuf, A., & Chaoui, K. (2006). Reliability assessment of underground pipelines under the combined effect of active corrosion and residual stress. International Journal of Pressure Vessels and Piping, 83(2), 107–117.
Anderson, R. J. (2001, November). Natural gas infrastructure reliability (presentation). National Energy Technology Laboratory. Retrieved June 16, 2015, from http://wpweb2.tepper.cmu.edu/ceic/presentations/Anderson.pdf
Anghel, M., Werley, K. A., & Motter, A. E. (2007, January). Stochastic model for power grid dynamics. Paper presented at the 40th Annual Hawaii International Conference on System Sciences.
Australian Electrical Regulatory Authorities Council. (2005–2006). Electrical incident data: Australia and New Zealand. Retrieved June 16, 2015, from http://www.erac.gov.au/downloads/Erac%202005-2006.pdf
Bagchi, A., Sprintson, A., & Singh, C. (2013). Modeling the impact of fire spread on an electrical distribution network. Electric Power Systems Research, 100, 15–24. doi: 10.1016/j.epsr.2013.01.009
Bhatnagar, D., Currier, A. B., Hernandez, J., Ma, O., & Kirby, B. (2013). Market and policy barriers to energy storage deployment: A study for the energy storage systems program. Albuquerque, NM: Sandia National Laboratories.
Bhattacharyya, S. C. (2009). Fossil-fuel dependence and vulnerability of electricity generation: Case of selected European countries. Energy Policy, 37(6), 2411–2420. doi: 10.1016/j.enpol.2009.02.031
Billinton, R., & Wangdee, W. (2006, June 11–15). Utilizing bulk electric system reliability performance index probability distributions in a performance based regulation framework. Paper presented at the 9th International Conference on Probabilistic Methods Applied to Power Systems, Stockholm, Sweden.
Blyth, W., & Lefevre, N. (2004). Energy security and climate change policy interactions: An assessment framework. Paris: International Energy Agency.
Bompard, E., Napoli, R., & Xue, F. (2010). Extended topological approach for the assessment of structural vulnerability in transmission networks. Generation, Transmission & Distribution, IET, 4(6), 716–724. doi: 10.1049/iet-gtd.2009.0452
Brancucci Martínez-Anido, C., Bolado, R., De Vries, L., Fulli, G., Vandenbergh, M., & Masera, M. (2012). European power grid reliability indicators, what do they really tell? Electric Power Systems Research, 90, 79–84.
Carlson, L., Bassett, G., Buehring, W., Collins, M., Folga, S., Haffenden, B., Petit, F., Phillips, J., Verner, D., & Whitfield, R. (2012). Resilience: Theory and application. Argonne, IL: Argonne National Laboratory.

26 Measuring the Resilience of Energy Distribution Systems
Carvalho, R., Buzna, L., Bono, F., Masera, M., Arrowsmith, D. K., & Helbing, D. (2014). Resilience of natural gas networks during conflicts, crises and disruptions. PLoS ONE, 9(3), e90265. doi: 10.1371/journal.pone.0090265
Committee on Increasing National Resilience to Hazards and Disasters; Committee on Science, Engineering, and Public Policy; and The National Academies. (2012). Disaster resilience: A national imperative. Washington, DC: National Academies Press.
D’Amico, G., Petroni, F., & Prattico, F. (2013). Wind speed modeled as an indexed semi‐Markov process. Environmetrics, 24(6), 367–376.
Doukas, H., Karakosta, C., Flamos, A., & Psarras, J. (2011). Electric power transmission: An overview of associated burdens. International Journal of Energy Research, 35(11), 979–988. doi: 10.1002/er.1745
Ellison, J., Kelic, A., & Corbet, T. (2006). Is a natural gas strategic reserve for the US necessary? A system dynamics approach. Paper presented at the 25th International Conference of the System Dynamics Society, Boston, MA. Retrieved March 1, 2013, from http://www.systemdynamics.org/conferences/2007/proceed/papers/ELLIS216.pdf
Ellison, J. F., Corbet, T. F., & Brooks, R. E. (2013). Natural gas network resiliency to a “shakeout scenario” earthquake. Albuquerque, NM: Sandia National Laboratories.
El-Salmawy, H., Youssef, K., Abdulla, S., Gamea, M., & Hamdy, K. (2010). Tracking the reliability indicators in the Egyptian electric power system. Paper presented at the 14th International Middle East Power Systems Conference, Cairo University, Egypt.
Eto, J. H., & LaCommare, K. H. (2008). Tracking the reliability of the U.S. electric power system: An assessment of publicly available information reported to state public utility commissions. Berkeley, CA: Ernest Orlando Lawrence Berkeley National Laboratory.
Fisher, R. E., Bassett, G. W., Buehring, W. A., Collins, M. J., Dickinson, D. C., Eaton, L. K., Haffenden, R. A., Hussar, N. E., Klett, M. S., Lawlor, M. A., Miller, D. J., Petit, F. D., Peyton, S. M., Wallace, K. E., Whitfield, R. G., & Peerenboom, J. P. (2010, August). Constructing a resilience index for the Enhanced Critical Infrastructure Protection Program. Argonne, IL: Argonne National Laboratory.
Gnansounou, E. (2008). Assessing the energy vulnerability: Case of industrialised countries. Energy Policy, 36(10), 3734-3744.
———. (2009, November 18–20). Indicators of energy vulnerability (presentation). World Energy Council.
Greenfield, V. A., Williams, V. L., & Eiseman, E. (2006). Using logic models for strategic planning and evaluation: Application to the National Center for Injury Prevention and Control. Santa Monica, CA: RAND Corporation, TR-370-NCIPC. Retrieved May 21, 2014, from http://www.rand.org/pubs/technical_reports/TR370.html
Haimes, Y. Y. (2009). On the definition of resilience in systems, Risk Analysis, 29(4), 498–501.
Harto, C. B., Yan, Y. E., Demissie, Y. K., Elcock, D., Tidwell, V. C., Hallett, K., Macknick, J., Wigmosta, M. S., & Tesfa, T. K. (2012). Analysis of drought impacts on electricity production in the Western and Texas interconnections of the United States. Argonne, IL: Argonne National Laboratory.
Hines, P., Blumsack, S., Cotilla Sanchez, E., & Barrows, C. (2010, January 5–8). The topological and electrical structure of power grids. Paper presented at the 43rd Hawaii International Conference on System Sciences.
Holmgren, Å. (2007). A framework for vulnerability assessment of electric power systems. In A. Murray & T. Grubesic (Eds.), Critical Infrastructure (pp. 31–55): Springer Berlin Heidelberg.
Hsu, B., Shu, M., & Tsao, M. (2010). Reliability measures for liquefied natural gas receiving terminal based on the failure information of emergency shutdown system. Shanghai: InTech China.
International Atomic Energy Agency. (2012). Electric grid reliability and interface with nuclear power plants. Nuclear Energy Series No. NG-T-3.8. Vienna: IAEA. Retrieved May 21, 2015, from http://www-pub.iaea.org/MTCD/publications/PDF/Pub1542_web.pdf
Keogh, M., & Cody, C. (2013, November). Resilience in regulated utilities. The National Association of Regulatory Utility Commissioners.

Bibliography 27
Layton, L. (2004). Electric system reliability indices. Retrieved May 11, 2015, from http://www.l2eng.com/Reliability_Indices_for_Utilities.pdf
Linkov, I., Bridges, T., Creutzig, F., Decker, J., Fox-Lent, C., Kröger, W., Lambert, J., Levermann, A., Montreuil, B., Nathwani, J., Nyer, R., Renn, O., Scharte, B., Scheffler, A., Schreurs, M., & Thiel-Clemen, T. (2014). Changing the resilience paradigm. Nature Climate Change, 4(6), 407–409.
Lucia, L. (2012). Review of the value of lost load (VoLL). Energy Market Company, Paper No. EMC/RCP/60/2012/ CP38.
Makarov, Y. V., & Moharari, N. S. (1999). A generalized power system reliability and security index. Paper presented at the IEEE Power Tech Conference, Budapest.
McCarthy, R. W., Ogden, J. M., & Sperling, D. (2007). Assessing reliability in energy supply systems. Energy Policy, 35(4), 2151–2162. doi: 10.1016/j.enpol.2006.06.016
Memmott, M. (2014, February 5). Sniper attack on Calif. power station raises terrorism fears. National Public Radio. Retrieved July 18, 2014, from http://www.npr.org/blogs/thetwo-way/2014/02/05/272015606/sniper-attack-on-calif-power-station-raises-terrorism-fears
Molyneaux, L., Wagner, L., Froome, C., & Foster, J. (2012). Resilience and electricity systems: A comparative analysis. Energy Policy, 47, 188–201.
Murkowski, L. (2014). Powering the future: Ensuring that federal policy fully supports electric reliability—An Energy 20/20 White Paper. Washington, DC: U.S. Senate Committee on Energy.
Nadeau, J. (2007). Improving the resiliency of the natural gas supply and distribution network (thesis). Naval Postgraduate School.
National Association of Convenience Stores. (2013). 2013 NACS retail fuels report: How Hurricane Sandy affected the fuels industry. Retrieved July 18, 2014, from http://www.nacsonline.com/YourBusiness/FuelsReports/GasPrices_2013/Pages/default.aspx
North American Electric Reliability Corporation. (2013, December). 2013 long-term reliability assessment. Atlanta, GA.
Northeastern University. (2013, December 3). After Hurricane Sandy: Lessons learned for bolstering energy resilience (conference). Hosted by Kostas Research Institute for Homeland Security, Northeastern University & Columbia University’s National Center for Disaster Preparedness. Retrieved from http://www.northeastern.edu/kostas/wp-content/uploads/2013/ 08/Health-Systems-and-Services-Resilience.pdf
Petit, F. D., Bassett, G. W., Black, R., Buehring, W. A., Collins, M. J., Dickinson, D. C., Fisher, R. E., Haffenden, R. A., Huttenga, A. A., Klett, M. S., Phillips, J. A., Thomas, M., Veselka, S. N., Wallace, K. E., Whitfield, R. G., & Peerenboom, J. P. (2013). Resilience measurement index: An indicator of critical infrastructure resilience. Argonne, IL: Argonne National Laboratory.
Poljansek, K., Bono, F., & Gutierrez, E. (2012). Seismic risk assessment of interdependent critical infrastructure systems: The case of European gas and electricity networks. Earthquake Engineering & Structural Dynamics, 41(1), 61–79. doi: 10.1002/eqe.1118
Reymond, M. (2007). European key issues concerning natural gas: Dependence and vulnerability. Energy Policy, 35(8), 4169–4176. doi: 10.1016/j.enpol.2007.02.030
Roe, E., & Schulman, P. R. (2012). Toward a comparative framework for measuring resilience in critical infrastructure systems. Journal of Comparative Policy Analysis, 14(2), 114–125. doi: 10.1080/13876988.2012.664687
Rogers, P. J., Petrosino, A., Huebner, T. A., & Hacsi, T. A. (2000). Program theory evaluation: Practice, promise, and problems. New Directions for Evaluation, 87(Fall), 5–13.
Rouse, G., & Kelly, J. (2011). Electricity reliability: Problems, progress and policy solutions. Galvin Electricity Initiative.

28 Measuring the Resilience of Energy Distribution Systems
Shun, T., Hadjsaid, N., Xiangning, X., & Kieny, C. (2012, June 17–20). Power quality & reliability assessment of distribution system considering voltage interruptions and sags. Paper presented at the 15th International Conference on Harmonics and Quality of Power.
Song, H., & Kezunovic, M. (2006). Static analysis of vulnerability and security margin of the power system. Paper presented at the Transmission and Distribution Conference and Exhibition, 2005/2006 IEEE PES.
Sumper, A., Sudrià, A., & Ferrer, F. (2004). International reliability analysis in distribution networks. Paper presented at the International Conference on Renewable Energies and Power Quality.
U.S. Department of Energy (2012a). Hurricane Sandy situation report #19. Office of Electricity Delivery & Energy Reliability.
———. (2012b). Reliability improvements from the application of distribution automation technologies—Initial results. Washington, DC.
U.S. Energy Information Association (2014). Northeast and Mid-Atlantic power prices react to winter freeze and natural gas constraints. Retrieved July 18, 2014, from http://www.eia.gov/todayinenergy/detail.cfm?id=14671
Van der Vleuten, E., & Lagendijk, V. (2010). Interpreting transnational infrastructure vulnerability: European blackout and the historical dynamics of transnational electricity governance. Energy Policy, 38(4), 2053–2062. doi: 10.1016/j.enpol.2009.11.030
Voorspools, K. R., & D’Haeseleer, W. D. (2004). Reliability of power stations: Stochastic versus derated power approach. International Journal of Energy Research, 28(2), 117–129. doi: 10.1002/er.954
Vugrin, E. D., Brown, N. J. K., & Turnquist, M. A. (2010). Optimal recovery sequencing for critical infrastructure resilience assessment. Albuquerque, NM: Sandia National Laboratories.
Vugrin, E. D., & Turnquist, M. A. (2012). Design for resilience in infrastructure distribution networks. Environment, Systems, and Decisions, 33, 104–120.
Vugrin, E. D, Warren, D. E, & Ehlen, M. A. (2011). A resilience assessment framework for infrastructure and economic systems: Quantitative and qualitative resilience analysis of petrochemical supply chains to a hurricane. Process Safety Progress, 30(3), 280–290.
Wang, H., Lin, Z., Wen, F., & Huang, J. (2012, September 8–9). A comprehensive evaluation index system for power system operation. Paper presented at the International Conference on Sustainable Power Generation and Supply.
Wang, Y., & Guo, C. (2013). The study on effect of random maintenance quality of components on composite power system reliability. Paper presented at the Power and Energy Engineering Conference. doi: 10.1109/APPEEC.2013.6837263
Ward, D. (2013). The effect of weather on grid systems and the reliability of electricity supply. Climatic Change, 121(1), 103–113. doi: 10.1007/s10584-013-0916-z
White House. (2013, February 12). Presidential policy directive 21: Critical infrastructure security and resilience.
———. (2014, January 9). Presidential memorandum: Establishing a Quadrennial Energy Review.
Willis, K. G., & Garrod, G. D. (1997). Electricity supply reliability—Estimating the value of lost load. Energy Policy, 25(1), 97–103. doi: 10.1016/S0301-4215(96)00123-1
Yeddanapudi, S. R. K. (2012). Distribution system reliability evaluation (presentation). Iowa State University. Retrieved June 16, 2015, from http://www.slideserve.com/oshin/distribution-system-reliability-evaluation