Embed Size (px)
Citation preview
41
Defi ning and Measuring Economic Resilience to Earthquakes
by Adam Rose
SponsorsSponsorsNational Science Foundation; Earthquake Engineering
Research Centers Program
Research TeamResearch TeamAdam Rose, Professor,
Department of Geography, Bo Yang, Graduate Student, Program in Energy, Environmental, and Mineral Economics, Dan Wei, Graduate Student, Department of Geography, Pennsylvania State University, and Shu Yi Liao, Assistant Professor, National Chung Hsing University, Taiwan
Other MCEER Team Members
Other MCEER Team Members
Stephanie Chang, School of Community and Regional Planning, University of British Columbia
Masanobu Shinozuka, Department of Civil and Environmental Engineering, University of California, Irvine
Kathleen Tierney, Natural Hazards Research and Applications Information Center, University of Colorado, Boulder
Research Objectives
This research provides an in-depth analysis of economic resilience to earthquakes. It fi ne-tunes the defi nition to distinguish inherent and adaptive considerations, and it distinguishes the various levels at which resilience is operative. It explicitly links resilience to the behavior of individuals, markets, and the regional macroeconomy, including disequilibrium aspects of each. Finally, it examines the complementarities and tradeoffs between resilience and mitigation. The research is intended to reduce losses from earthquakes by helping to capitalize on and enhance the resilience of busi-ness and market operations.
The past decade has witnessed a number of devastating earthquakes in the U.S. and throughout the world. As large as the economic
losses from them have been, the outcomes could have been worse had steps not been taken before, during, and after the events. Increasingly the emphasis has shifted to mitigation, or preventative actions taken be-fore an earthquake to reduce loss (see, e.g., Mileti, 1999). Mitigation can reduce the probability and magnitude of the stimulus. It can also reduce our vulnerability. However, even in the absence of mitigation, we have the ability to cushion or reduce loss through resilience.
Economic resilience, as defi ned in this paper, refers to the inherent and adaptive responses to hazards that enable individuals and communi-ties to avoid some potential losses. It can take place at the level of the fi rm, household, market, or macroeconomy. In contrast to the pre-event character of mitigation, economic resilience emphasizes ingenuity and resourcefulness applied during and after the event. Also, while mitigation often emphasizes new technology (e.g., seismic warning) or institutions (e.g., insurance markets), resilience has greater behavioral emphasis.1 It focuses on the fact that individuals and organizations do not simply react passively or in a “business as usual manner” in the face of a disaster.
Three diffi culties confront researchers in the resilience arena. At the conceptual level, there is the need to identify resilient actions, including those that may seem to violate established norms, such as rational behav-ior. At the operational level, it may be diffi cult to model individual, group, and community behavior in a single framework. At the empirical level, it
42 Overarching Center-wide Cross Program Research Activities
Previous Summaries
Previous Summaries
2001-2003: Rose and Liao, http://mceer.buffalo.edu/publications/resaccom/0103/11rose.pdf
1999-2000:Chang et al.,http://mceer.buffalo.edu/publications/resaccom/9900/Chapter1.pdf
1997-1999:Tierney et al.,http://mceer.buffalo.edu/publications/resaccom/9799/Ch2tiern.pdf
The operational defi nitions and models produced by this research should be of broad usefulness. Business managers will be better able to assess the inherent role and potential to improve economic resil-ience to earthquakes. Utility managers will be better able to estimate losses from service disruptions. Emergency planners will be better able to exploit the costless ability of market forces to reallocate scarce resources so as to minimize economic losses from earthquakes.
is especially diffi cult to gather data on resilience to specify models.
The purpose of this paper is to summarize progress on all three planes. First, we defi ne several important dimensions of econom-ic resilience. Second, we show how computable general equilib-rium (CGE) modeling represents a useful framework for analyzing the behavior of individuals, busi-nesses, and markets. Third, we summarize recent progress in the conceptual and empirical model-ing of resilience, including the incorporation of disequilibria and the recalibration of key behavioral parameters on the basis of empiri-cal data. Fourth, we use the results of a case study to illustrate some important issues relating to the subject.
Defi ning Resilience and its Scope
Basic Defi nition
We begin by defining static economic resilience as the ability or capacity of a system to absorb or cushion against damage or loss (see, e.g., Holling, 1973; Perrings, 2001). A more general defi nition that incorporates dynamic consid-erations, including stability, is the
ability of a system to recover from a severe shock.
We distinguish two types of resilience:• Inherent – ability under normal
circumstances (e.g., the ability to substitute other inputs for those curtailed by an external shock, or the ability of markets to reallocate resources in re-sponse to price signals).
• Adaptive – ability in crisis situations due to ingenuity or extra effort (e.g., increasing in-put substitution possibilities in individual business operations, or strengthening the market by providing information to match suppliers without customers to customers without suppliers).
Resilience emanates both from internal motivation and the stimu-lus of private or public policy decisions (Mileti, 1999). Also, re-silience, as defi ned in this paper, refers to post-disaster conditions and response, which are distin-guished from pre-disaster activities to reduce potential losses through mitigation. The consequences of these two approaches are not mutually exclusive, and below we shed some light on the infl u-ence of mitigation on resilience and visa versa.
The concept of resilience ema-nates from several sources. For
Defi ning and Measuring Economic Resilience to Earthquakes 43
Links to CurrentResearch
Links to CurrentResearch
This research is part of MCEER’s mission of enhancing community resilience to earthquakes. It focuses on how private and public sector decisions infl uence important dimensions of this issue. It will be tested in an application to the Los Angeles Demonstration Project.
example, Holling (1973) and oth-er ecologists, as well as Perrings (2001) and other ecological econo-mists, have defi ned it in terms of the broader concept of sustainabil-ity as the capacity to absorb stress and shocks. Tinch (1998) has enu-merated several similar measures including: stability, persistence, resistance, non-vulnerability, sto-chastic return time and resilience. However, Perrings (2001; p. 323) notes: “The property that most closely connects with the idea of sustainability as conservation of opportunity is resilience.”
In disaster research, resilience has been emphasized most by Tier-ney (1997) in terms of business coping behavior and community response, by Comfort (1999) in terms of nonlinear adaptive re-sponse of organizations (broadly defi ned to include both the public and private sectors), and by Petak (2002) in terms of system perfor-mance. Recently, Bruneau et al. (2003; p. 3) have defi ned com-munity earthquake resilience as “the ability of social units (e.g., organizations, communities) to mitigate hazards, contain the ef-fects of disasters when they occur, and carry out recovery activities in ways that minimize social dis-ruption and mitigate the effectors of further earthquakes.” Further, they divide resilience into three aspects, which correspond to the concepts defi ned above in an eco-nomic context. First is reduced failure probability, which we view as equivalent to mitigation in this paper. Second is reduced consequences from failure, which corresponds to our basic static defi nition of resilience. Third is reduced time to recovery, which adds a temporal dimension to our
basic defi nition.2 Note that in the infancy of conceptual and especial-ly empirical analysis of economic resilience, we believe it is prudent to pin down fundamental consid-erations fi rst. Dynamic aspects of resilience, including intertempo-ral tradeoffs, system “flipping,” irreversibilities, and extreme non-linearities, are beyond the scope of this paper. In sum, Bruneau et al. (2003) have offered a very broad defi nition of resilience to cover all actions that reduce losses from hazards, including mitigation and more rapid recovery. These refer to how a community reduces the probability of structural or system failure, in the case of the former, and how quickly it returns to nor-mal in the case of the latter. We have focused on the essence of resilience—the innate aspects of the economic system at all levels to cushion itself against losses in a given period.
Scope
There are several categories of loss from disasters (see, e.g., Rose, 2004). Although property damage has traditionally received the most attention, direct and indirect busi-ness interruption losses can be just as prominent (see Tierney, 1997; Webb et al., 2000; Rose and Liao, 2004). Unlike property damage, which refers to structures (build-ings, bridges, highways), business interruption refers to human operation of businesses, organiza-tions and institutions. Moreover, unlike the stock measure of prop-erty, which incurs its damage during the relatively short period of the disaster stimulus, the fl ow measure of business interruption takes place for the relatively long

44 Overarching Center-wide Cross Program Research Activities
period of recovery. Our analysis will focus on these fl ow measures, which will also be more useful for dynamic extensions.
Resilience can take place at three levels: • Microeconomic – individual
behavior of fi rms, households, or organizations.
• Mesoeconomic – economic sector, individual market, or cooperative group.
• Macroeconomic – all individual units and markets combined, though the whole is not simply the sum of its parts, due to inter-active effects of an economy.
Examples of individual resil-ience are well documented in the literature, as are examples of the operation of businesses and organizations (Tierney, 1997; Comfort, 1999). What is often less appreciated by disaster research-ers outside economics and closely related disciplines is the inherent resilience of markets. Prices act as the “invisible hand” that can guide resources to their best allocation even in the aftermath of a disaster. Some pricing mechanisms have been established expressly to deal with such a situation, as in the case of non-interruptible service premia that enable customers to estimate the value of a continuous supply of electricity and to pay in advance for receiving priority service dur-ing an outage (Rose and Benavides, 1999).
The price mechanism is a rela-tively costless way of redirecting goods and services. Price in-creases, though often viewed as “gouging,” serve a useful purpose of reflecting highest value use, even in the broader social setting. Moreover, if the allocation does violate principles of equity (fair-
ness), the market allocations can be adjusted by income or material transfers to the needy.
Of course, markets are likely to be shocked by disasters, in an analogous manner to buildings and humans. In this case, we have two alternatives for some or all of the economy: • substitute centralized decree
or planning, though at a signifi -cantly higher cost of administra-tion;
• bolster the market, such as in improving information flows (e.g., the creation of an infor-mation clearing house to match customers without suppliers to suppliers without customers).
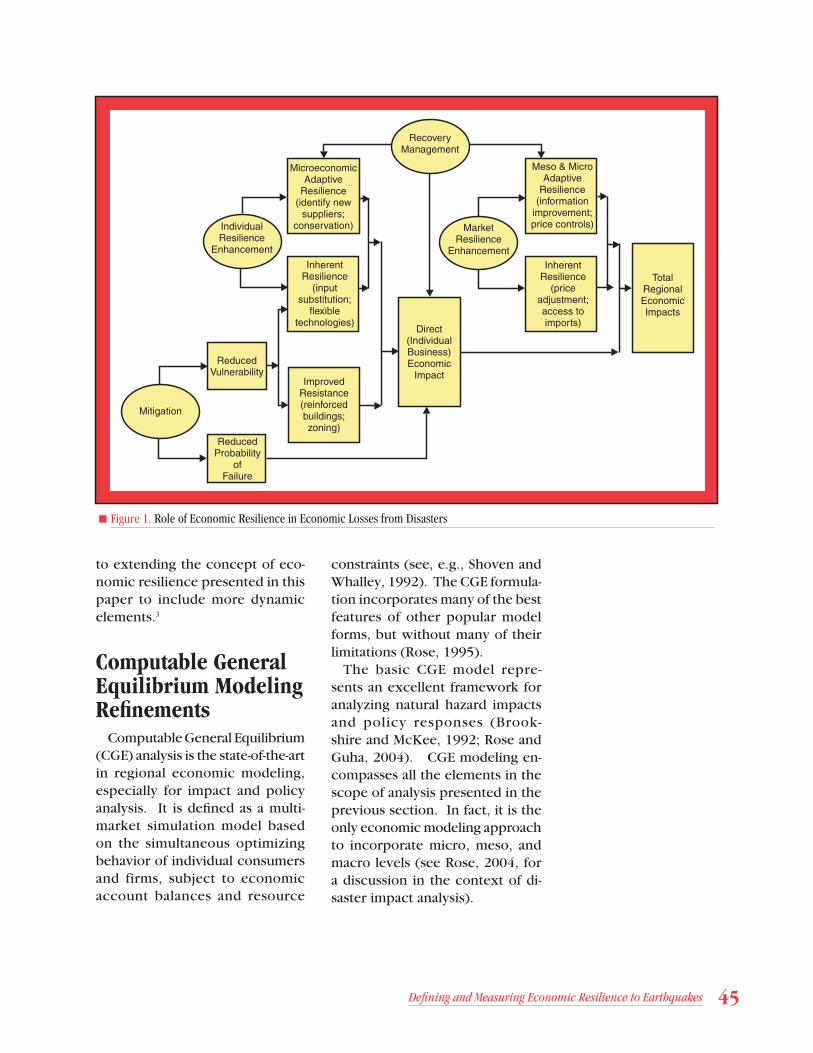
The role of economic resilience in the extent of economic losses from disasters is summarized in Figure 1, in relation to other major loss reduction strategies—mitiga-tion and recovery management. Both of these strategies can en-hance innate economic resilience as defi ned in this paper, though to date this has not been a major emphasis of either. Mitigation is typically oriented toward reducing the probability of failure and also reducing vulnerability through improved resistance (resistance is defi ned here as a fi xed measure, in contrast to the “bounce-back,” or fl exible, nature of resilience). Recovery management is usually oriented toward providing out-side assistance to businesses and households affected by disaster, and to reducing recovery time. The former aspect of recovery is not consistent with resilience because resilience emphasizes the self-reliance of communities in terms of the broader concept of sustainability (Mileti, 1999). The latter, however, will be a key
Defi ning and Measuring Economic Resilience to Earthquakes 45
to extending the concept of eco-nomic resilience presented in this paper to include more dynamic elements.3
Computable General Equilibrium Modeling Refi nements
Computable General Equilibrium (CGE) analysis is the state-of-the-art in regional economic modeling, especially for impact and policy analysis. It is defi ned as a multi-market simulation model based on the simultaneous optimizing behavior of individual consumers and firms, subject to economic account balances and resource
constraints (see, e.g., Shoven and Whalley, 1992). The CGE formula-tion incorporates many of the best features of other popular model forms, but without many of their limitations (Rose, 1995).
The basic CGE model repre-sents an excellent framework for analyzing natural hazard impacts and policy responses (Brook-shire and McKee, 1992; Rose and Guha, 2004). CGE modeling en-compasses all the elements in the scope of analysis presented in the previous section. In fact, it is the only economic modeling approach to incorporate micro, meso, and macro levels (see Rose, 2004, for a discussion in the context of di-saster impact analysis).
MicroeconomicAdaptive
Resilience(identify new
suppliers;conservation)
Meso & MicroAdaptive
Resilience(information
improvement;price controls)
InherentResilience
(inputsubstitution;
flexibletechnologies)
IndividualResilience
Enhancement
ReducedProbability
ofFailure
Direct(IndividualBusiness)Economic
Impact
InherentResilience
(priceadjustment;access toimports)
Mitigation
ImprovedResistance(reinforcedbuildings;zoning)
RecoveryManagement
MarketResilience
Enhancement
TotalRegionalEconomicImpacts
ReducedVulnerability
■ Figure 1. Role of Economic Resilience in Economic Losses from Disasters
46 Overarching Center-wide Cross Program Research Activities
Business Responses to Hazards in a CGE Context
The production side of the CGE model developed by the author and his research team is com-posed of a standard, multi-layered, or multi-tiered, constant elasticity of substitution (CES) production function for each sector. The production function is normally applied to aggregate categories of major inputs of capital, labor, energy, and materials, with sub-ag-gregates possible for each (e.g., the energy aggregate is often decom-posed by fuel type—electricity, oil, gas, and coal). In most prior CGE models, water has been omitted or incorporated as one of the materi-als (intermediate goods produc-ing) sectors. In our illustration, we explicitly separate water as a major aggregate in the top tier of the production function so that we can analyze the impacts of a water service disruption.
This production function rep-resents a type of hierarchical, or sequential, decision-making pro-cess. For a given level of output, the fi rm’s manager fi rst chooses the optimal combination of capi-tal and energy. He/she next jux-taposes that combination to labor to determine the optimal choice of inputs in the third tier, etc. In the top tier, input decisions are made regarding water in terms of the various ways it can be provided (the reader is referred to last year’s Research Accomplishments report for the mathematical specifi cation of the production function).
Inherent resiliency is embodied in the basic production function for individual businesses and in the combination of producers, consumers, and markets (includ-
ing interaction effects) for the economy as a whole. Adaptive resilience is captured by changes in the parameters. For example, an increase in the productivity term for water
would refl ect con-
servation, while an increase in the substitution elasticity would refl ect increased substitution pos-sibilities between utility water service and other inputs (such as bottled water). In the aftermath of a disaster, people behave in a more urgent manner and are more likely to call forth ingenu-ity. For example, for short peri-ods, maintenance can be skipped, water fountains can be turned off, water can be reused, etc. Also, in general, ineffi cient practices can come to light and new opportuni-ties can be initiated. There is an extensive literature suggesting that managers can become more clever in emergency situations. There is additional literature, now very prominent in the energy and environmental fi elds, indicating a much greater range of conserva-tion opportunities when one looks at the production process from a holistic standpoint (see, e.g., Por-ter and van der Linde, 1995).
Economy-Wide Responses and Disequilibria
As noted above, the market system is inherently resilient to shocks and can be bolstered by various policies. All of this can best be modeled in a CGE framework. However, an inher-ent shortcoming of CGE is its equilibrium emphasis. Follow-ing a major disaster, a sustained period of disequilibrium is likely to ensue. Fortunately, several re-fi nements of CGE modeling by the
“In the aftermath of a disaster, people behave in a more urgent manner and are more likely to call forth ingenuity.”
Defi ning and Measuring Economic Resilience to Earthquakes 47
author and others have moved to overcome this limitation. These disequilibria are typically related to closure rules, or account balance conditions.
It is now possible to operate a CGE model in situations where demand need not always equal supply in the following cases:1. The labor market, which allows
for unemployment 2. The government budget, which
allows for defi cit spending 3. Trade, which allows for import/
export imbalances4. Goods and services, which al-
lows for explicit shortages The last of these advances bears
some elaboration. Ordinarily, any gap between supply and demand is resolved by a change in price. However, it is possible in CGE modeling to fix the price of a commodity and have the supply constrained, so that potential demand exceeds actual demand. This refi nement is facilitated by the development of new software that uses a complementarity program-ming approach, thereby allowing for some “slack” in the system, and hence disequilibrium. For exam-ple, in the study to be discussed below, we were able to limit the supply of water to each sector. Ordinarily this would increase the price of water, but this is un-realistic given the fact that water is not priced in an ordinary market but rather under the administra-tive authority of a public service agency. We therefore fi xed the price of water as well, essentially modeling it as a disequilibrium market. The slack is taken up by a reduction in the profi t margin in the water sector.
Closely related are the many ad hoc adjustments and tempo-
rary equilibria that ensue after a disaster, many of which can be incorporated through further refinement of the CGE model. Examples identifi ed by West and Lenze (1994) include additions to the labor market in the form of outside government and NGO volunteers, by Cochrane (1997) include households dipping deep into savings or increasing their borrowing to fund repairs, and by Rose and Lim (2002) include busi-nesses recapturing lost production through overtime work at a later date.
Empirical Specifi cation
CGE models used for hazard analysis are likely to yield estimates of business disruptions for some if not all sectors of an economy that differ signifi cantly from the direct loss estimates provided by empirical studies. This is because production function parameters are not typically based on solid data, or, even where they are, the data stem from ordinary operating experience (inherent resilience only) rather than from emergency situations. Hence, it is necessary to explicitly incorporate adap-tive resilience responses into the analysis.
Rose and Liao (2004) have re-cently developed a methodology for altering the behavioral param-eters in the sectoral production functions of the CGE model based on an optimizing routine and solu-tions utilizing both analytical and numerical methods. Empirical or simulation model estimates of direct output changes, emanating from an input supply disruption, are used to recalibrate productivity and substitution elasticity param-
48 Overarching Center-wide Cross Program Research Activities
eters of the CES production func-tion. When the initial parameters are accurate for business as usual contexts, we say they embody “inherent” resilience. The differ-ence between these original and the recalibrated parameters would then refl ect “adaptive” resilience. Unfortunately, accurate initial parameters are rarely available, so that in such cases, while the reca-libration encompasses both types of resilience, the overall effect can-not yet be accurately decomposed into its two components. Still, the method is suffi ciently general to be able to do so when better param-eter data become available.
Illustration
Portland Water System and Economy
The Portland (Oregon) Bureau of Water Works (PBWW) is a rate-fi nanced, City-owned utility that serves 840,000 people in por-tions of the Portland Metro Area (including businesses responsible for 98% and 72% of sales in Mult-nomah County and Washington County, respectively). In 1999, PBWW water sales amounted to 39 billion gallons. The largest customers are major manufactur-ing companies, the Portland City Bureau of Parks and Recreation, and several hospitals.
The PBWW transmission and distribution is comprised of near-ly 2000 kilometers of pipelines, 29 pump stations, and 69 major storage tanks. About 70% of the system still consists of cast iron pipes, even though the agency began installing ductile iron in the 1960s. Additional information on
the PBWW, and its earthquake vul-nerability and mitigation costs, can be found in Chang et al. (2002).
We constructed a CGE model of the portion of Portland Metro-politan Area economy that over-laps with the Portland Bureau of Water Works (PBWW) Service Area (Rose and Liao, 2004). The main data upon which the empiri-cal model is based are the 1998 IMPLAN Social Accounting Matrix (SAM) and Input-Output Table for Multnomah County and Wash-ington County (MIG, 2000). It is divided into several partitions that reveal the structure of the regional economy, including the industry, commodity, factor income, house-hold, government, capital, and trade accounts.4
Water Disruption Simulations
Chang et al. (2002) performed simulations for alternative com-binations of earthquake types, calendar years, and mitigation options, using several sophisti-cated geological and engineering models. Each case was subject to 100 Monte Carlo simulations. These simulations were used to estimate direct losses in sectoral output, factoring in resilience but without any specifi cation of the type of resilience response. We adapted the results of a question-naire survey by Tierney (1997) for the Northridge earthquake to as-sume that water conservation and substitutability were likely to be the primary ways that customers implemented adaptive resilience (see Rose and Liao, 2004).
Our simulations are based on an engineering fragility analysis of the Portland water utility system and the direct loss estimation simula-

Defi ning and Measuring Economic Resilience to Earthquakes 49
tions of Chang et al. (2002) de-scribed above. Although Chang’s engineering vulnerability and di-rect loss simulations involve many scenarios relating to alternative earthquake magnitudes, outage du-rations, and resilience responses, this paper focuses on a subset of scenarios characterized by:• One earthquake type (Bolton
crustal fault) of magnitude 6.1• Impacts in the Year 2000• Scenarios for Business as Usual
(No Mitigation) and Pipe Re-placement (Mitigation)
• Outages of varying lengths from 3 to 9 weeks
We focused on the fi rst char-acteristic because it represented the “most likely” case, and on the latter three to keep the number of simulations manageable.
Resilience in the Absence of Mitigation
The results of our simulations for the Business as Usual Scenario (no mitigation) are presented in the fi rst column of Table 1. Note that the duration of this outage is projected to be four weeks, but the table summarizes the situation for the maximum disruption, which takes place during the fi rst week.
Unmitigated sectoral water dis-ruptions are estimated by Chang to average 50.5 percent of pre-earthquake levels. However, direct output losses are estimated to be only 33.7 percent, because they incorporate direct sectoral re-silience to water service outages. Our measure of direct regional economic resilience (DRER) is the extent to which the estimated direct output reduction deviated from the likely (fi xed-coeffi cient) maximum, which is equivalent to
the percentage water input dis-ruption in our linear approach to baseline estimation:
DRER =% DQ
% DQ
m
m
D DD
- % DQ
(1)
where %∆DQm is the maximum percent change in direct output and %∆DQ is the estimated percent change in direct output.
The measure of DRER is 33.3 percent in this scenario [(50.5-33.7) ÷ 50.5].5
Our estimates of the indirect (net general equilibrium) and total re-gional (gross general equilibrium) economic impacts of the water lifeline disruption are presented in Rows 3 and 4 of Table 1. Over-all, they yield only a 7.3 percent indirect reduction in regional gross output and a 41.0 percent total re-duction in regional gross output for the first week. The former represents $99.9 million and the latter $561 million of lost sales.
Some interesting aspects of indi-rect output losses bear further dis-cussion. First, they are only about 22 percent the size of direct output losses. In the context of an input-output (I-O) model, this would be a multiplier of only about 1.22. The Portland Metro economy-wide I-O multiplier is significantly larger
Pre-Mitigation Post-Mitigation
Direct Water Outage 50.5 31.0
Direct Output Reduction 33.7 21.3
Indirect Output Reduction 7.3 9.2
Total Output Reduction 41.0 30.5
Direct Economic Resilience 33.0 31.3
Total Economic Resilience 60.4 48.2
■ Table 1. Economic Resilience to a Water Service Disruption in the Portland Metro Area (percentage)

50 Overarching Center-wide Cross Program Research Activities
than this, but the CGE model in-corporates many other factors that mute the uni-directional and linear nature of the pure interde-pendence effect of the I-O model. For example, the CGE model is able to capture price changes for intermediate goods from cost and demand pressures, various substi-tutions aside from those relating to water, and various income, substi-tution and spending considerations on the consumer side.
Our measure of total regional economic resilience (TRER) to earthquake disruptions of water services is the difference between the total fi xed coeffi cient I-O mul-tiplier and the CGE impacts:
TRER =% TQ
% TQ
M % DQ
M % DQ
m
m
m
m
D DD
D DD
-
= ∑ -∑
%
%
TQ
TQ
(2)
where M is the economy-wide average Type II input-output mul-tiplier; %∆TQm is the maximum percent change in total output; and %∆TQ is the estimated per-cent change in total output.
The weighted average Type II output multiplier for the Port-land Economy is 1.9, or a 90 percent increase over direct ef-fects. Thus, TRER in this case is 60.4 percent {[(1.9)(50.5) – 41] ÷ [(1.9)(50.5)]}.
Resilience in the Aftermath of Mitigation
The results of the scenario of an M6.1 crustal fault earthquake but with cast-iron pipe replacement are also presented in the second column of Table 1. In this second scenario, the direct water outage is reduced from 50.5 percent to 31.0 percent. Chang estimates direct output losses to be 21.3 percent. The DRER index is 31.3 percent in this case [(31-21.3) ÷ 31]. Direct resilience thus decreases a bit from the 33.3 percent of Scenario 1, and this is likely due to the fact that resilience opportunities decrease as the size of the direct disruption decreases. Note also that direct mitigation effectiveness, with respect to the difference in direct water losses between the two scenarios, could be measured by a similar index and would equal 38.6 percent [(50.5-31.0) ÷ 50.5].
The parameter recalibrations needed for the model to replicate the Chang direct loss estimates are lower than the corresponding pa-rameter values in our initial simu-lation, because the direct output losses are projected to be lower in each sector following mitigation. Note that this seemingly counter-intuitive result has a valid explana-tion -- because water disruptions are smaller after mitigation, there is less need and less room to ma-neuver (fewer opportunities for adaptive resilience). Mitigation lowers direct losses, but there is a partially offsetting effect from lowering adaptive capability.6
“This paper has presented major conceptual, operational, and policy analysis advances in evaluating individual and regional economic resilience to earthquakes.”
Defi ning and Measuring Economic Resilience to Earthquakes 51
Interestingly, our estimate of “indirect” losses in Scenario 2 is 9.2 percent, which is 43.2 percent the size of direct losses. Thus, the percentage increase over direct losses is higher in Scenario 2 than in Scenario 1, as is the absolute level (not shown). This appears surprising at fi rst glance. It would be an impossibility, for example, in the context of an I-O model (where multiplier values are the same at all scales). However, our CGE model is nonlinear. Secondly, we have changed parameters (with respect to water substitution), so, even in an I-O context, multipliers would differ (though likely only slightly given the small size of our parameter changes, which would correspond to coeffi cient changes in an I-O model). One explanation for the relatively higher percent-age of general equilibrium effects in Scenario 2 is the fact that water substitution and productivity term parameters are lower than in Sce-nario 1, meaning that not only is the direct response less fl exible, but so is the indirect response relating to water. Another ex-planation is the difference in the sectoral mix of direct water disrup-tions in relation to Scenario 1. This changes relative prices, and the model responds accordingly.
The discussion above can be summarized and quantifi ed in the TRER for the post-mitigation case, which is 48.2 percent {[(1.9)(31) – 30.5] ÷ [(1.9)(31)]}. The differ-ence between TRER and DRER is a measure of indirect regional eco-nomic resilience (IRER), which is relatively lower in the post-mitiga-tion case.7
Overall, the DRER is higher than IRER in both scenarios. This sug-gests that the overall resilience of
individual businesses is greater than the overall resilience of mar-kets in the Portland economy.
ConclusionThis paper has presented major
conceptual, operational, and poli-cy analysis advances in evaluating individual and regional economic resilience to earthquakes. We provided an operational, though relatively narrow, definition of resilience and couched it in terms of economic theory. We then summarized a methodology for incorporating disequilibria and re-calibrating CGE model parameters in light of empirical estimates of production losses due to a lifeline supply disruption. Our application to a disruption of water services in the Portland Metro economy showed how indirect (pure general equilibrium) economic losses vary according to the overall level and sectoral mix of water shortages, the extent of pre-event mitigation, and post-event inherent and adap-tive resilience. It also identifi ed some major complementarities and tradeoffs between mitigation and resilience. Our methodology can be adapted to other applications of CGE models for response to other types of disasters, including terror-ist attacks on economic targets.
The measurement of resilience is important because it enables us to evaluate an important strategy for reducing economic losses from earthquakes. Failure to incorpo-rate resilience in loss estimation will result in infl ated assessments of business interruption from earthquakes. Failure to include resilience in policy-making will result in missed opportunities to further reduce losses.
52 Overarching Center-wide Cross Program Research Activities
Acknowledgements
The research in this paper was supported by several grants from NSF-sponsored Multidisciplinary Center for Earthquake Engineering Research (Grant No. EEC-9701471), as well as a direct grant from the NSF (Grant No. 9802151). The author acknowledges the important contribution of Shu-Yi Liao to a related paper, and to Stephanie Chang for sharing results of her analysis of the Portland Bureau of Water Works network and for providing helpful comments on this paper. The author is solely responsible for any errors and omissions.
Endnotes
1 There is growing awareness of the behavioral aspects of the implementation of mitigation. For example, even promising new technology and policies may incur obstacles to its implementation and use (see, e.g., Alesch and Petak, 2001).
2 Recently, Chang and Shinozuka (2004) have operationalized a portion of this framework to examine the effects of mitigation, based on engineering performance standards for a water system, on basic measures of technological, organizational, and economic resilience. Their work differs from the presentation in this paper in terms of the defi nition of economic resilience overall, more in-depth analysis of the concept here, and our inclusion of region-wide economic losses.
3 We briefly note the relationship between resilience and two other concepts. Preparedness refers to steps taken before a disaster to subsequently reduce losses. Some of these actions, such as the building up of inventories, improve the capacity of inherent resilience, while others, such as the establishment of an improved communication network, increase adaptive resilience capacity. Preparedness typically focuses on ways of enhancing resilience before the event, while resilience emphasizes the reduction of economic losses due to an earthquake during and after the ground shaking (i.e., the benefi ts of reduced losses). Moreover, not all preparedness affects innate resilience (e.g., that which is pure mitigation), and not all resilience stems from preparedness (e.g., innate human ingenuity and the natural self-adjusting feature of markets). Note also that resilience differs from the concept of adaptation. Adaptation consists of two components: an active effect to reduce losses after an event has taken place (e.g., migration) and a passive absorption (“suffering”) of the loss. Our concept of adaptive resilience overlaps with the fi rst component.
4 The computational procedure we have developed to improve model accuracy also generates an additional dividend of enabling us to decompose loss estimates into direct (partial equilibrium) and indirect (total general minus partial equilibrium) effects. While the I-O model automatically makes this distinction, our methodology to decompose the two categories of effects is a necessary advance in CGE modeling to do so.
5 The fi xed coeffi cient production function of an I-O model yields an upper-bound estimate of direct output losses from water input disruption, where the percentage loss of the former would be equal to the percentage loss for the latter. All other types of production functions would yield percentage output losses lower than the percentage decrease in water availability because of substitution possibilities. We measure direct individual business (or sectoral) resilience (DIBR) as the difference between the fi xed coeffi cient (proportional) result and the fl exible input (disproportional) result, which is attributable both to the various response mechanisms related to water services (1st Tier) and inherent in the overall production function with respect to other inputs (Tiers 2-4). DRER is simply the weighted average of DIBR for all businesses in the region.
Note that our choice of a linear reference base for resiliency estimation is reasonable but still somewhat arbitrary pending more empirical work. There are
Defi ning and Measuring Economic Resilience to Earthquakes 53
instances in which the maximum potential loss is greater than a proportional impact (i.e., a situation in which an X% loss of water results in greater than an X% loss of output). However, our general loss estimation and resilience modeling methodologies are suffi ciently general to accommodate these defi nitional changes.
6 This reduction in resilience is more than offset by the benefi cial effect of mitigation in reducing recovery time (Chang et al., 2002), but it is a negative side effect of mitigation just the same and may dominate the recovery time benefi t in other cases.
7 Note that we have not been able to distinguish between inherent and adaptive resilience in the sectoral (summed to direct regional) case because of limitations of accuracy of our initial elasticity estimate. It would appear that TRER includes only inherent resiliency, since we have not included any explicit adaptive considerations. However, our assumption of return to equilibrium (in all markets except water, labor, and the government budget) in a period of only 3-4 weeks invokes some implicit adaptive responses (such as improved information fl ows). In fact, the 3-4 week adjustment is greatly optimistic, such that our TRER estimates contain a signifi cant upward bias.
References
Alesch, D. and Petak, W., (2001), Overcoming Obstacles to Implementing Earthquake Hazard Mitigation Policies: Stage 1 Report, Technical Report MCEER-01-0004, Multidisciplinary Center for Earthquake Engineering Research, University at Buffalo.
Brookshire, D. and McKee, M., (1992), “Other Indirect Costs and Losses from Earthquakes: Issues and Estimation,” Indirect Economic Consequences of a Catastrophic Earthquake, FEMA, Washington, DC.
Bruneau, M., Chang, S., Eguchi, R., Lee, G, O’Rourke, T., Reinhorn, A., Shinozuka, M., Tierney, K., Wallace, W. and von Winterfeldt, D., (2003), “A Framework to Quantitatively Assess and Enhance Seismic Resilience of Communities,” Earthquake Spectra, Vol. 19, No. 4, pp. 733-752.
Chang, S. and Shinozuka, M., (2004), “Measuring Improvements in the Disaster Resilience of Communities,” Earthquake Spectra, forthcoming.
Chang, S., Svekla, W. and Shinozuka, M., (2002), “Linking Urban Infrastructure and Urban Economy: Simulation of Water Disruption Impacts in Earthquakes,” Environment and Planning B, Vol. 29, pp. 281-301.
Cochrane, H. et al., (1997), “Indirect Economic Losses,” Development of Standardized Earthquake Loss Estimation Methodology Vol. II, RMS, Inc., Menlo Park, CA.
Comfort, L., (1999), Shared Risk: Complex Seismic Response, Pergamon, New York.
Holling, C., (1973), “Resiliency and Stability of Ecological Systems,” Annual Review of Ecological Systems, Vol. 4, pp. 1-24.
Mileti, D., (1999), Disasters by Design: A Reassessment of Natural Hazards in the United States, Joseph Henry Press, Washington, DC.
(MIG) Minnesota IMPLAN Group, (2000), Impact Analysis for Planning System (IMPLAN), Stillwater, MN.

54 Overarching Center-wide Cross Program Research Activities
References (Cont’d)
Perrings, C., (2001), “Resilience and Sustainability,” Frontiers of Environmental Economics. H. Folmer, H. L. Gabel, S. Gerking, and A. Rose (eds.), Edward Elgar, Cheltenham, UK.
Petak, W., (2002), “Earthquake Resilience Through Mitigation: A System Approach,” paper presented at the International Institute for Applied Systems Analysis, Laxenburg, Austria.
Porter, M., and van der Linde, C., (1995), “Towards a New Conception of the Environment-Competitiveness Relationship,” Journal of Economic Perspectives, Vol. 9, pp. 97-118.
Rose, A., (1995), “Input-Output Economics and Computable General Equilibrium Models,” Structural Change and Economic Dynamics, Vol. 6, pp. 295-304.
Rose, A., (2004), “Economic Principles, Issues, and Research Priorities of Natural Hazard Loss Estimation,” Modeling of Spatial Economic Impacts of Natural Hazards, Y. Okuyama and S. Chang (eds.), Heidelberg: Springer, forthcoming.
Rose A., and Benavides, J., (1999), “Optimal Allocation of Electricity After Major Earthquakes: Market Mechanisms Versus Rationing,” Advances in Mathematical Programming and Financial Planning, K. Lawrence (ed.), JAI Press, Greenwich, CT.
Rose, A., and Guha, G., (2004), “Computable General Equilibrium Modeling of Electric Utility Lifeline Losses from Earthquakes,” Modeling the Spatial Economic Impacts of Natural Hazards, Y. Okuyama and S. Chang (eds.), Heidelberg: Springer, forthcoming.
Rose, A. and Liao, S. (2004), “Modeling Regional Economic Resilience to Disasters: A Computable General Equilibrium Analysis of Water Service Disruptions,” Journal of Regional Science, forthcoming.
Rose, A. and Lim, D., (2002), “Business Interruption Losses from Natural Hazards: Conceptual and Methodological Issues in the Case of the Northridge Earthquake,” Environmental Hazards, Vol. 4, pp. 1-14.
Shoven, J. and Whalley, J., (1992), Applying General Equilibrium, Cambridge University Press, New York.
Tierney, K., (1997), “Impacts of Recent Disasters on Businesses: The 1993 Midwest Floods and the 1994 Northridge Earthquake,” Economic Consequences of Earthquakes: Preparing for the Unexpected, B. Jones (ed.), National Center for Earthquake Engineering Research, University at Buffalo.
Tinch, R., (1998), Resilience and Resource Management Under Risk, School of Environmental Science, University of East Anglia, UK.
Webb, G., Tierney, K. and Dahlhamer, J., (2000), “Business and Disasters: Empirical Patterns and Unanswered Questions,” Natural Hazards Review, Vol. 1, pp. 83-90.
West, C. and Lenze, D., (1994), “Modeling the Regional Impact of Natural Disaster and Recovery,” International Regional Science Review, Vol. 17, pp. 121-150.