Embed Size (px)
Citation preview
JOURNAL OF EXPERIMENTAI~ SOCIAL PSYCHOLOGY 17, 159-182 (1981)
Measuring the Importance of Cues in Judgment for Individuals: Subjective Theories of IQ as a Function of
Heredity and Environment
MICHAEL H. BIRNBAUM AND STEVEN E. STECNER
Ut7itwsii.v 01’ Illinois al Urhat7a-Cl7c7t77prti~~7
Received December 3 I. 1979
To measure the relative subjective importance attached to heredity and envi- ronment, undergraduates. graduate students, and faculty were asked to predict the IQ scores of hypothetical adopted children based on the IQs of the biological mother and father, the IQs of the adoptive parents, and the socioeconomic status of the adoptive parents. Intuitive predictions of IQ were inconsistent with addi- tive, multiple regression models. Rather, the data for individual subjects were consistent with a configural-weight averaging model, Weights derived from this model were correlated with ratings of the relative importance of cues. Judges who rated the environment more important not only had greater weights for the environmental variables. but also placed greater weight on high rather than low scores. The judges who rated heredity more important than environment had greater estimated weights for heredity information and for lower-valued informa- tion. Results were thus consistent with the hypothesis that model-derived relative weights and individuals’ ratings of the relative importance of cues are both measures of the importance that individuals attach to these cues.
The fields of psychology and education remain embroiled in an ancient debate concerning the relative importance of heredity and environment in determining intellectual performance. This debate also rages in the gen- eral populace, fluctuating in intensity from time to time (Cronbach, 1975). Many people have strong opinions on the subject, even though few are able to state the statistical definitions of “importance” that give the debate meaning in the academic arena. The thesis of this paper is that people have well-defined systems of intuitive IQ prediction that differ in striking ways from the statistical models used in IQ studies.
This project was supported in part by a grant from the research board of the University of Illinois. We thank Barbara Mellers and Clairice Veit for comments on the manuscript and Howard Garb for assistance. Requests for reprints should be addressed to Michael H. Birnbaum, Department of Psychology, University of Illinois. Champaign. IL 61820.
OOZZ- 103 i/8 t/O201 59-24$02.00/O Copyright 6) 1987 by Academw Press. Inc
All rights of reproductmn I” any toI-m reserved.
160 BIRNBAUM AND STEGNER
The present paper does not focus on the statistical attempts to untangle the effects of heredity and environment on actual IQs, but rather on the subjective representations of these factors. Judges are asked to predict the IQs of adopted children in a hypothetical experiment that uncon- founds the biological and adoptive parents’ IQs and socioeconomic status. (For example, “What would you predict for the adult IQ of a child whose biological parents’ IQs were both 70, and who was raised by adoptive parents with IQs of 130‘~“). If the responses to such questions can be modeled, one can measure the subjective importance of heredity and environment information and detect the presence of perceived interactive effects of heredity and environmental factors. The IQ judgment domain was selected for study because IQ judgments were expected to show large individual differences. The major purpose of this study is to examine whether individual differences in judgment are lawful and whether they can be systematically predicted from self-reports.
Additive Model
Before discussing how judges might make IQ predictions, it is instruc- tive to consider how a statistician might perform this task. One procedure would be to use an additive, linear regression model:
i=l
where R is the predicted IQ, )rAM and it’ll are the weights of the adoptive mother and biological father, respectively; .rAM and sBF are the IQs of the adoptive mother and biological father, respectively; and the series (+ . . . ) indicates addition of terms for other variables (such as socioeconomic status) that might be available to aid prediction.
It seems possible that Eq. (1) could also be used to represent judgments of IQ. (When used as a model of judgment, the scale values (.rAM, etc.) would be assumed to depend upon actual values but would nonetheless be estimated from the data.) However, judgment data for numerous tasks have shown systematic violations of the additive model (Anderson, 1974; Birnbaum, 1974, 1976; Birnbaum, Wong, & Wong, 1976; Birnbaum & Stegner, 1979). Averaging models have been shown superior to additive models for these tasks; therefore, it seems reasonable to consider the possibility that judgments of IQ will also violate Eq. (l), in favor of an averaging model.
Averaging Model
An averaging model for IQ prediction can be written

MEASURING IMPORTANCE OF CUES IN JUDGMENT 161
+ “AM
iv0 + M’AM + M’BF + . . . SAM
+ M’BF
w(j + M’AM + N’BF + . . . $BF . . . 3 + (2)
where M’,, and s, are the weight and subjective scale value of the initial impression, and other terms are defined as above.
When the number of cues is varied, or the weight of the cues is manipulated, additive and averaging models make different predictions. Assume that the weight of an unpresented cue is zero and the weight of a cue is independent of the other cues presented for judgment. The additive model implies that the effect of a cue is independent of the number and weight of other cues. In contrast, the averaging model predicts that the effect of each cue will be inversely related to the number and weight of the other cues. For example, Eq. (2) shows that the effect of adoptive mother’s IQ on the child’s IQ will be less when the biological father’s IQ is presented than when this information is omitted, since wBF appears in the denominator of the relative weight of SAM in the first case but not in the second. Similarly, the greater the weight of biological father’s IQ, the less the effect of adoptive mother’s IQ.
Corzjigural- Weight Averaging Model
Both Eqs. (1) and (2) predict that the effect of each cue will be indepen- dent of the value of the other cues. For example, the effects of the adoptive mother’s IQ should be the same whether the child had a biologi- cal father with an IQ of 70 or one with an IQ of 130. However, suppose the judge believes in a heredity-environment interaction. For example, the judge could believe that the effect of environment is greater for children of high-IQ biological parents compared with low. If judges exhibit evidence of such interactions, then Eq. (1) or (2) would need to be revised or replaced.
Configural-weight averaging models have been proposed to account for similar interactions obtained in other judgment domains (Birnbaum, 1974; Birnbaum & Stegner, 1979). In these models, the relative weight of a cue depends in part on the relationship between the value of that cue and the values of other cues presented simultaneously. A simple model assumes that the relative weight is given by the expression
162 BIRNBAUM AND STEGNER
),‘ =
lrn tt’i/Ctt’j + WUim, (3)
where MI+ is the relative weight of cue i on trial m; it’s is the absolute tm weight of cue i; uirn = 1 if the scale value of cue i on trial m is the largest of those presented on that trial; aim = - 1 if the scale value of cue i is smallest on trial m; and vim = 0 otherwise; and w is the relative weight added to or subtracted from the weight of the cue with the largest or smallest scale value, respectively. If w is positive, the largest scale value receives an increment in relative weight; if w is negative, the smallest scale value receives an increment in weight. In the IQ prediction task, for example, w could represent a heredity x environment interaction. A positive o would reflect belief that the differences due to heredity are less when the environment is improved. A negative value of w would reflect a tendency to believe that differences due to heredity are amplified by improved environments.
Measuring Psychological Importance
“Importance” has a meaning in this paper different from its definitions in statistical discussions of analysis of variance or multiple regression. The reason for this distinction is that models describing intuitive judg- ments differ from the models frequently used to make normative statisti- cal predictions (Birnbaum, 1976). The additive models of statistics often represent “importance” in terms of relative magnitudes of effects. In the additive model, indices of effect magnitudes have undesirable properties, especially when the variables are correlated (Darlington, 1968). Even under the best conditions, Eq. (1) cannot be used to separate weight and scale value (Schonemann, Cafferty, & Rotton, 1973). For example, let ~1’~ = M’ilai and s’i = aisi. Then, M”~s’~ = 1.1’~s~. and the predicted response would be the same regardless of the arbitrarily selected value of ai. Therefore. the scaling of the weights and of the scale values of the cues are con- founded. When additive multiple regression is used, the scale values are either assumed to be known, or the variance of the scale values is assumed to be equal for all cues. However. if these assumptions are not applicable to human judgment, then these indices of the “importance” of variables would seem unlikely to correlate with other methods for mea- surement of importance.
Early research in judgment (Goldberg, 1968; Slavic & Lichtenstein, 1971; Wiggins, Hoffman, & Taber, 1969) once used additive models to represent judgments. In this research, ratings of the “importance” of a variable rarely coincided with statistical measures of importance. Nisbett and Bellows (1977) recently argued on the basis of a lack of correlation between additive model main effects and judged importance that people lack understanding of the importance of variables in judgment. Nisbett and Wilson (1977) argued from such findings to the conclusion that sub-
MEASURING IMPORTANCE OF CUES IN JUDGMENT 163
jects do not have introspective access to higher-order cognitive pro- cesses. However, those studies used such poor procedures for the mea- surement of importance that lack of correlation between the measures should not be considered a diagnostic test of the conclusion.
In contrast with the additive model, which has not been successful in judgment experiments and does not provide unique weight estimates, the configural-weight averaging model remains consistent with data for other domains and (given appropriate experimental designs) constrains the weights of the variables. The weights can be estimated from the averaging model only when proper experimental designs are utilized (Birnbaum, 1976; Birnbaum & Stegner, 1979; Norman, 1976). In particular, the weight of a variable is estimated tzot from the main effect of that variable, but instead from a comparison of effects of other variables when the variable under consideration is or is not presented. The present research utilizes appropriate experimental designs that permit a test of the modela and also permit an estimation of weights should the averaging model be found applicable.
Purposes of Present Research
This research addresses five questions. I. What model characterizes how judges combine heredity and envi-
ronment information to form predictions of IQ? Do different individuals appear to use different processes to combine the information, or can all the data be summarized by a single model using different parameters for different individuals?
2. Are individual differences in parameters localized in weights, scale values, configural weighting, or all of these?
3. Are parameter estimates for individuals predictable from self- reports?
4. How are individual differences related to educational level? 5. How do intuitive predictions of IQ and actual IQ data compare? These questions bear not only on the generality of the configural-weight
averaging model, but also address issues in individual differences that have been raised as challenges to the psychological meaning of algebraic models as representations of judgment (Wyer & Carlston, 1979). Indi- vidual differences would be troublesome for the use of algebraic models unless the individual differences are themselves predictable. If the param- eter estimates for individuals are predictable from self-reports, it would not only refute the notion of Nisbett and Wilson (1977) that individuals lack self-insight into their cognitive processes in this domain, but it would also lend support to the model ofjudgment and measurement techniques.
It might seem reasonable to suppose that highly trained psychologists would use a process to predict IQ different from that used by undergradu- ates. It has been suggested that such experts would use a model more

164 BIRNBAUM AND STEGNER
consistent with the additive multiple linear regression model (Eq. ( 1)) than with the averaging model (Eq. (2)). Accordingly, Experiment 2 employed samples of faculty, graduate students, and undergraduates to test this hypothesis.
One simple possibility for the locus of individual differences is that individuals differ mostly in the weight and rated importance of different sources of information and in the configural weights but that they are homogeneous with respect to the process used to combine the informa- tion. This theory, which will be shown viable in this paper, assumes that people who believe a factor is more important will place more weight on that factor. Thus, this possibility assumes that weights estimated from judgment data and ratings of importance are two distinct methods for measuring the importance of cues.
METHOD
Judges were asked to predict IQ scores for hypothetical adoptees based on subsets of the following information: biological mother’s IQ, biological father’s IQ, adoptive mother’s IQ,
adoptive father’s IQ. and socioeconomic status. There were two experiments. The first used 50 students as judges with 200 trials to complete. The second experiment used a smaller design with a larger sample of subjects that included 54 faculty, 77 graduate students, and 57 undergraduates. After making IQ predictions, judges then rated the relative importance of each cue.
Instructions The judges in both experiments were instructed to assume that the individuals had all been
adopted at birth, that they had been randomly assigned to adopting families, and that they took a standardized Stanford-Binet or Wechsler-type IQ test at the age of 18. A diagram of the normal distribution was used to show that the test had a mean of 100 with a standard deviation of I5 and to depict the normal proportions of cases below 70. between 70 and 85. from 85 to 100, 100 to 115. 115 to 130, and above 130.
The judges were given subsets of the following five pieces of information: ( 1) biological mother’s IQ; (2) biological father’s IQ; (3) adoptive mother’s IQ; (4) adoptive father’s IQ; and (5) socioeconomic status (SES) of the adoptive family. The IQ test scores for the parents were described as based on the same test with the same distribution. Socioeconomic status (SES) level was described as reflecting the occupation and income of the adopting family during the childhood of the person to be judged. It was also depicted as a normally distributed variable with mean 3 and standard deviation I, with the upper 2.5% labeled “very high SES,“ the region from ? to 4 labeled “middle SES,” and the region below I labeled “very low SES.”
Instructions noted that biological and environmental information would be uncorrelated. since the infants were randomly assigned to adoptive parents at birth. Judges were also instructed to disregard the fact that the trials might be unrepresentative of a larger popula- tion since they were selected for judgment. and to make intuitive predictions rather than attempting numerical calculations.
Each set of stimulus information was presented in the format used for the example below: BMIQ: 100. BFIQ: 115, AMIQ: 130; AFIQ: 130, SES: 3,
where BMIQ. BFIQ. AMIQ, and AFIQ represent the IQs of the biological mother and father and adoptive mother and father, respectively, and SES represents socioeconomic status.

MEASURING IMPORTANCE OF CUES IN JUDGMENT 165
Questionnaire After completing the IQ prediction task, the judges completed 10 items in which they
judged the relative importance of each cue compared with each of the other cues along a 1-l 1 point scale in which 6 designated that the two variables were of “equal importance.” and the end points designated that the variable on the left or right was “very very much more important.” An 1 lth item asked the judges to rate their impression of the relative importance of all of the heredity variables vs all of the environment variables.
Experiment 1 There were 200 hypothetical cases to judge. constructed from single cues or cue combina-
tions. To include all possible combinations of five levels of each of five cues and all possible subsets would require 7775 trials. A subset of possible designs was therefore chosen that would include wide variation in set size (from one to five cues), would allow estimation of mother by father and heredity by environment interactions. would constrain parameter estimates. and would permit tests among the theories under investigation. The 200 cases were generated from three designs described below:
I. Single cue designs. On 25 trials. judges based their predictions on only one of the five cues. Each of the five cues had five values. The levels of SES were l(2.3.4, and 5: the levels of IQ were 70, 85. 100, 115, and 130.
2. Mother-father design. One hundred cases, in which two pieces of information were available, were constructed from a 2 x 5 x 2 x 5 factorial design in which (a) the mother was either biological or adoptive, (b) her IQ was either 70,85. 100, 115, or 130: (c) the father was either biological or adoptive, and (d) his IQ was either 70. 85, 100. 115. or 130.
3. Biologica! parents by environmrnt design. Seventy-five cases of three, four. or five pieces of information were generated from three 5 x 5 heredity x environment subdesigns in which the biological mother and father had identical IQs of either 70. 85. 100, 1 IS. or 130. (a) In the first subdesign, these five levels of biological parents’ IQ were paired with the five levels of SES. (b) In the second subsesign, biological parents’ IQ was combined with each of five levels of adoptive parents’ IQ (both 70. both 85, both 100, both 1 IS, or both 130). (c) In the third subdesign, biological parents’ IQ was combined with each of five combinations of adoptive parents‘ SES and adoptive parents’ IQ (i.e., SES = I, both IQs = 70: SES = 2, both IQs = 85; SES = 3, both IQs = 100; SES = 4, both IQs = 115; or SES = 5. both IQs = 130). In combination, these three subdesigns form a 5 x 5 x 3 design in which the third factor represents the amount of environmental information (SES only: IQs of both adoptive parents; SES and IQs of both adoptive parents).
Procedure. The 200 trials were printed in random order (all designs were intermixed) in booklets with three pages of instructions and 20 representative warm-up trials. The judges were permitted to work at their own pace.
Judges. The judges were 50 students at the University of Illinois, Urbana-Champaign. Of these, 18 were graduate students who were paid $2.00 each for their services and the rest were undergraduates who participated for extra credit in a lower-division psychology class. The judges were tested alone or in small groups.
Experiment 2 Judges. To investigate individual differences among judges with greater variance of
education in statistics and psychology, a short form of the experiment was mailed to the faculty and graduate students of the Psychology Department of the University of Illinois at Urbana-Champaign. The experiment was to be filled out at their convenience an’d returned by mail. Of the 98 doctorate-level scholars listed on the academic staff roster, 54 completed forms were returned. Of 160 graduate students, 77 completed forms were retlgrned. An additional 57 undergraduates, who received extra credit in introductory psychology, were tested on the short form in the laboratory for comparison with the faculty and graduate students.
166 BIRNBAUM AND STEGNER
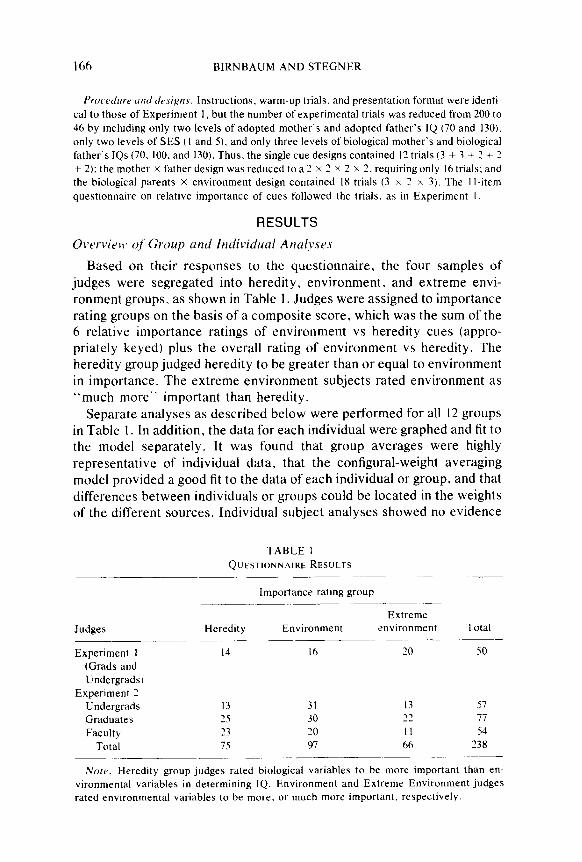
Proc~rdrrre ~rrlcl drsiyns. Instructions. warm-up trials. and presentation format were identi- cal to those of Experiment I, but the number of experimental trials was reduced from 200 to 46 by including only two levels of adopted mother’s and adopted father’s IQ (70 and 130). only two levels of SES (I and S), and only three levels of biological mother’s and biological father’s IQs (70. 100, and 130). Thus, the single cue designs contained 12 trials (3 + 3 + ? + 2 + 2): the mother x father design was reduced to a ? x 2 x 2 x 2. requiring only 16 trials; and the biological parents x environment design contained 18 trials (3 x 2 x 3). The 1 l-item questionnaire on relative importance of cues followed the trials. as in Experiment I.
RESULTS
Based on their responses to the questionnaire, the four samples of judges were segregated into heredity. environment, and extreme envi- ronment groups, as shown in Table 1. Judges were assigned to importance rating groups on the basis of a composite score. which was the sum of the 6 relative importance ratings of environment vs heredity cues (appro- priately keyed) plus the overall rating of environment vs heredity. The heredity group judged heredity to be greater than or equal to environment in importance. The extreme environment subjects rated environment as “much more” important than heredity.
Separate analyses as described below were performed for all 12 groups in Table 1. In addition, the data for each individual were graphed and fit to the model separately. It was found that group averages were highly representative of individual data, that the configural-weight averaging model provided a good fit to the data of each individual or group, and that differences between individuals or groups could be located in the weights of the different sources. Individual subject analyses showed no evidence
TABLE I QUESTIONNAIRE RESULW
-
Importance rating group
Extreme
Judges Heredity Environment environment Total ~~ -~ Experiment 1 14 16 20 SO
(Grads and Undergrads)
Experiment 2 Undergrads 13 31 13 51 Graduates 25 30 23 77 Faculty 23 20 II 54
Total 75 97 66 938 -___ .~~~
iV~,tr. Heredity group judges rated biological variables to be more important than en- vironmental variables in determining IQ. Environment and Extreme Environment judges rated environmental variables to be more. or much more important, respectively.
MEASURING IMPORTANCE OF CUES IN JUDGMENT 167
that subgroups of individuals would require different models; instead, it appeared that all subjects could be represented by the same model using different weights. Although a greater percentage of the more educated groups rated heredity more important to the determination of IQ (and placed greater weight on biological variables), no evidence was found to suggest that persons of different educational level used different strategies. Once the importance ratings were known, there was no sys- tematic difference in the faculty vs student data.
Accordingly, Experiment 1, which has a larger experimental design, will be used to illustrate graphical analyses at the group level. Experiment 2, which used a greater number of subjects, will be used to illustrate the individual differences analysis.
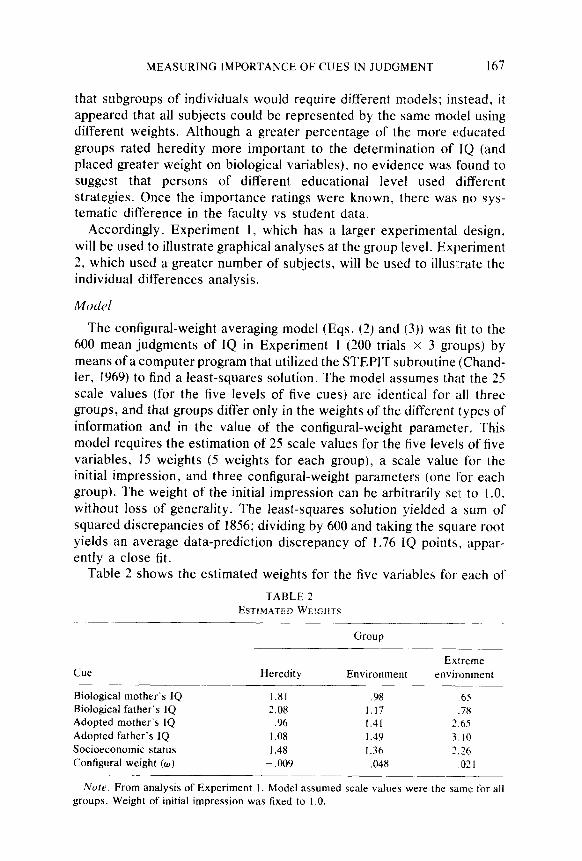
The configural-weight averaging model (Eqs. (2) and (3)) was tit to the 600 mean judgments of IQ in Experiment 1 (200 trials x 3 groups) by means of a computer program that utilized the STEPIT subroutine (Chand- ler, 1969) to find a least-squares solution. The model assumes that the 25 scale values (for the five levels of five cues) are identical for all three groups, and that groups differ only in the weights of the different types of information and in the value of the configural-weight parameter. This model requires the estimation of 25 scale values for the five levels of five variables, 15 weights (5 weights for each group), a scale value for the initial impression, and three configural-weight parameters (one for each group). The weight of the initial impression can be arbitrarily set to 1.0, without loss of generality. The least-squares solution yielded a sum of squared discrepancies of 1856; dividing by 600 and taking the square root yields an average data-prediction discrepancy of 1.76 IQ points, appar- ently a close fit.
Table 2 shows the estimated weights for the five variables for each of
TABLE 2 ESTIMATED WEIGHTS
Group
Extreme Cue Heredity Environment environment
Biological mother’s IQ 1.81 .98 .65
Biological father’s IQ 2.08 1.17 .78 Adopted mother’s IQ .96 1.41 -7.65 Adopted father’s IQ 1.08 I.49 3. IO Socioeconomic status 1.48 1.36 2.26 Configural weight (0) - ,009 ,048 ,091
--__
Note. From analysis of Experiment I. Model assumed scale values were the same for all groups. Weight of initial impression was fixed to 1.0.

168 BIRNBAUM AND STEGNER
TABLE 3 ESTIMA.~ED SCALE VALUES
Cue value
CW 70 85 100 I15 130 .______ __-__.
Biological mother’s IQ 65.01 82.95 102.98 122.65 138.50 Biological father’s IQ 67.1: 84.1 I lO?.87- 119.69 134.40 Adopted mother’s IQ 69.24 84.06 102.79 118.43 132.39 Adopted father‘s IQ 69.79 84.57 107.50 117.70 130.42
I 2 3 4 s
Socioeconomic status 63.87 85.15 104.89 123.80 136.1 I
Note. From analysis of Experiment I
the three groups. and the estimated configural-weight parameters for Experiment I. Table 3 shows the estimated scale values for the five levels of the five variables, which were constrained to be identical for ail three groups of subjects. The estimated weights show clear changes as a func- tion of the importance ratings. The weights of both biological mother and biological father decrease as belief in the effects of the environment increase. The weights of both adoptive parents are greater for the envi- ronment groups than for the heredity group. Similar results were obtained with separate analyses of faculty, graduate, and undergraduate samples of Experiment 2.
The groups also differ in the sign and magnitude of the configural weight effect. The fit of the model suffers if the configural weight terms are not included; the sum of squared discrepancies increases from 1856 to 2267. The estimated configural-weight parameter, w, has opposite signs for heredity and environment groups. The negative value of o for the heredity group can be interpreted as follows: if one parent (or source of informa- tion) has a low value. the predicted IQ of the child will tend to be lower. It is as if belief in environment vs heredity is correlated with an optimist- pessimist distinction.
Graphical Analyses
The mean judgments of IQ for Experiment 1 are shown as solid points in Figs. 1 and 2. The results are shown separately for the heredity group (upper panels), environment group (middle panels), and extreme envi- ronment group (lower panels). The curves represent predictions for the configural-weight averaging model (Eqs. (2) and (3)), assuming that only the weights depend upon group. As can be seen in the figures, the model predictions (lines) come very close to the data (points).
Biological parents by environment design. Figure 1 shows the results for the biological parents by environmental information design for Experi-
MEASURING IMPORTANCE OF CUES IN JUDGMENT
I ’ ’ ’ ’ ’ Heredity Group (N=14) , ’ ’ I ’ ’
Bloloqicol Pnrents’ IQs3 Biological Porents’ IQSJ 1 Biological Parents’ IQsJ
/ I I I I I 1 1 t
nvironment Group (N=16) 0 130- l-4
75 lx)-
E aJ llO- E
B loo-
3
E go-
r” eo-
70,
. H . . . . H . . . . ’ / .
,,lr--=
I1 I / I I I I I1 I
ne Environment Group (N =201 . 120 .
110 .
100 L- .
90 l
70 /
/ .
eo l
1 2 3 4 5 SES Level
Adoptive Porents’ 10s 70 85 loo 115 130 SES Level +
Environmental Information Adoptive Porents’IQs
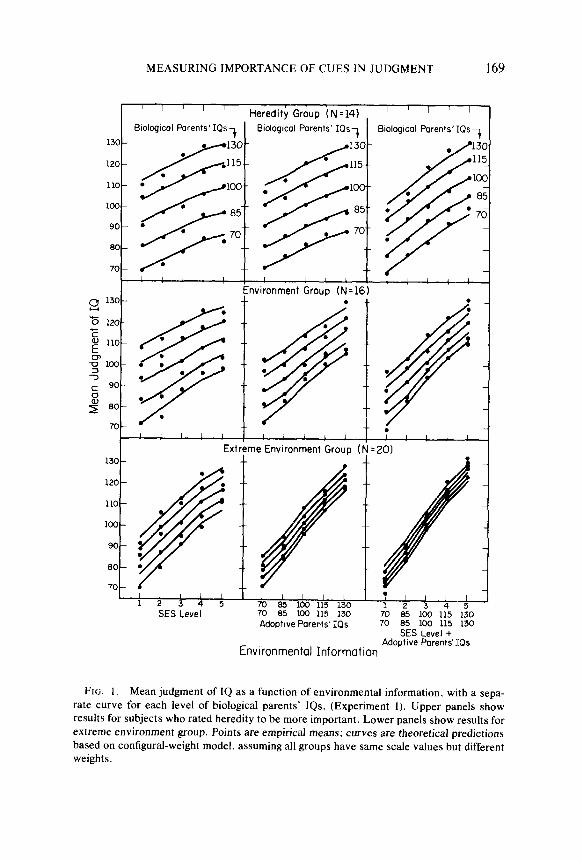
FIG. 1. Mean judgment of IQ as a function of environmental information, with a sepa- rate curve for each level of biological parents’ IQs. (Experiment 1). Upper panels show results for subjects who rated heredity to be more important. Lower panels show results for extreme environment group. Points are empirical means: curves are theoretical predictions based on configural-weight model. assuming all groups have same scale values but different weights.
170 BIRNBAUM AND STEGNER
ment 1. The abscissa depicts the level and value of environmental infor- mation, which consisted of either SES only (left panels), adoptive parents (middle panels), or both adoptive parents and SES. Separate curves are drawn for different levels of biological parents’ IQs.
In general, the slopes of the curves in Fig. I represent the effects of the environmental information. The slopes are smaller in all panels for the heredity group (upper panels) than they are for the environment group (middle panels), or the extreme environment group (lower panels). Also, as more environmental evidence is added (from left to right) the slopes increase. Thus, the curves increase in slope as one proceeds from the left-hand panels, where the abscissa represents SES only. to the right- hand panels, where the abscissa represents both adoptive parents’ IQs plus SES.
As the effects of environmental information (slopes) increase, the ef- fects of the biological parents’ IQs (vertical distances between the curves) decrease. This trade-off of relative magnitudes of effects is not predicted by additive models, including the least-squares multiple regression model, for additive models would require that the effect of the biological parents’ IQs (spreads in Fig. I from left to right) be independent of the amount of environmental evidence (see Birnbaum, 1976). This pattern, in which the effect of biological parents’ IQ diminishes as environmental evidence is added, was observed for 12, 13, and 18 of the 14, 16, and 20 subjects in the three respective groups: the interactions were statistically significant for all three groups, F(8, 104) = 7.81, F(8, 120) = 8.23, and F(8, 152) = 16.59, respectively. (In general, any systematic trend that can be seen in Figs. 1 and 2 is statistically significant and replicated in Experiment 2.)
The fact that the vertical spreads of the curves diminish as more environmental evidence is added is consistent with the averaging mecha- nism of Eq. (2), which predicts that the effect of any one variable will be inversely proportional to the total weight of other variables presented.
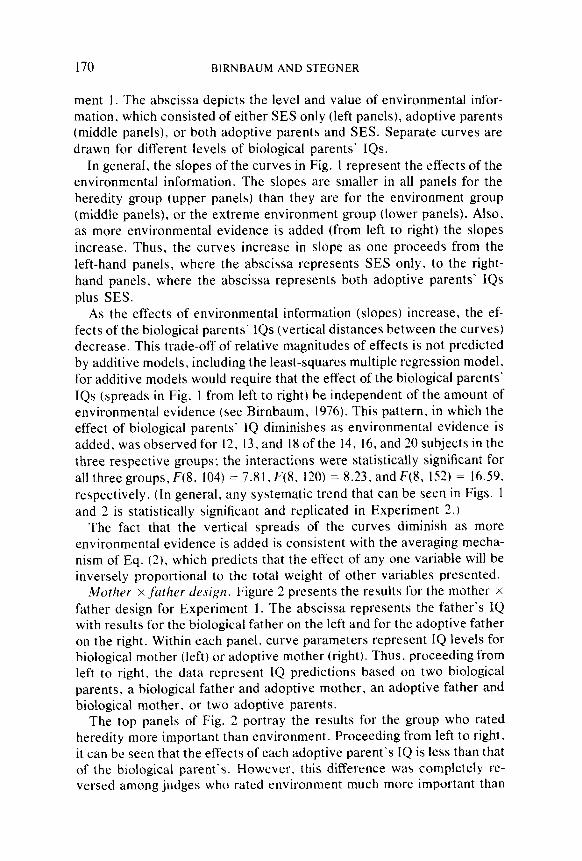
Mother x j&her design. Figure 2 presents the results for the mother x father design for Experiment 1. The abscissa represents the father’s IQ with results for the biological father on the left and for the adoptive father on the right. Within each panel. curve parameters represent IQ levels for biological mother (left) or adoptive mother (right). Thus. proceeding from left to right, the data represent IQ predictions based on two biological parents. a biological father and adoptive mother, an adoptive father and biological mother, or two adoptive parents.
The top panels of Fig. 2 portray the results for the group who rated heredity more important than environment. Proceeding from left to right, it can be seen that the effects of each adoptive parent’s IQ is less than that of the biological parent-s. However. this difference was completely re- versed among judges who rated environment much more important than
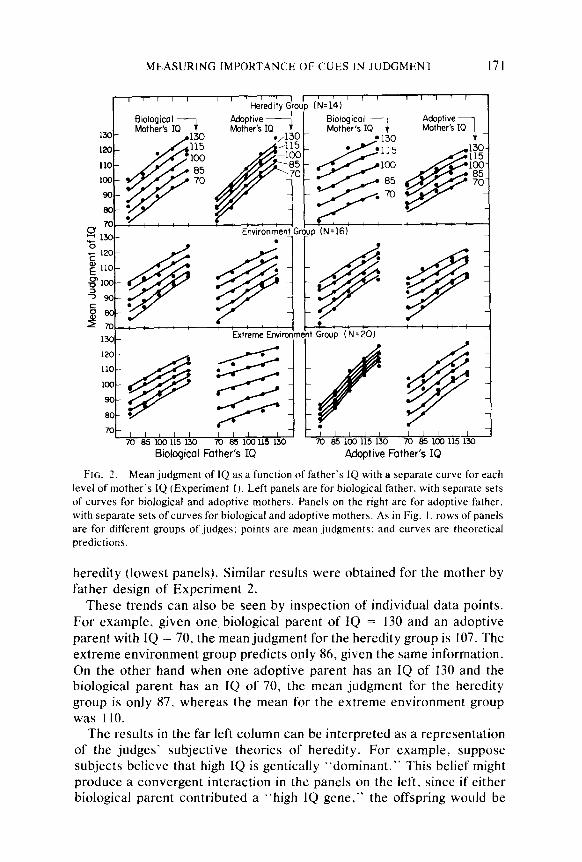
MEASURING IMPORTANCE OF CUES IN JUDGMENT 171
c ’ ’ ’ ’ ’ I I 1 ’ 1 Heredity Gro& (N=14)
I , , I 1 I 1 I
c -. -. - = _- Mother’s IQ t
.-_r. ._ 130
Mother’s IQ t 1 i ,130 .
I Rinlnnirnl - Montive I I Rbologicol Adoptive
/13E) r dother’s IQ 7 Mother’s IQ
1
AX
txtreme tnvlrontne?t broup t N = ZUI
Biological Father’s IQ Adoptive Fother’s IQ
FIG. 2. Mean judgment of IQ as a function of father’s IQ with a separate curve for each level of mother’s IQ (Experiment I). Left panels are for biological father, with separate sets of curves for biological and adoptive mothers. Panels on the right are for adoptive father, with separate sets of curves for biological and adoptive mothers. As in Fig. I. rows ‘of panels are for different groups of judges: points are mean judgments: and curves are theoretical predictions.
heredity (lowest panels). Similar results were obtained for the mother by father design of Experiment 2.
These trends can also be seen by inspection of individual data points. For example, given one, biological parent of IQ = 130 and an adoptive parent with IQ = 70, the mean judgment for the heredity group is 107. The extreme environment group predicts only 86, given the same information. On the other hand when one adoptive parent has an IQ of 130 and the biological parent has an IQ of 70, the mean judgment for the heredity group is only 87, whereas the mean for the extreme environment group was 110.
The results in the far left column can be interpreted as a representation of the judges’ subjective theories of heredity. For example, suppose subjects believe that high IQ is gentically “dominant.‘* This belief might produce a convergent interaction in the panels on the left, since if either biological parent contributed a “high IQ gene,” the offspring would be

172 BIRNBAUM AND STEGNER
“high.” Similarly, the curves on the far right represent intuitive theories of how the mother and father affect the quility of the family environment. Finally, the sets of curves in the two center columns represent the judges’ subjective theories of one aspect of the heredity-environment interaction.
The data points in Fig. 2 are not quite parallel, that is, they converge to the right for the environment groups (lower panels) and they diverge to the right for the heredity groups (upper panel). Similar patterns can also be seen in Fig. 1. The predicted curves also show convergence or di- vergence, since the configural-weight model (Eq. (3)) can account for interactions with nonzero values of w. A convergent interaction (which would be represented by a positive value of w) reflects a tendency to “give the benefit of the doubt” and make a high IQ prediction when there is both high and low valued information.
The data in the right of Fig. 2 for the environment groups converge even more than predicted (note that the response is above the predicted value when one adoptive parent has an IQ of 130 and the other 70). Except for these deviations, which do not appear serious, Figs. 1 and 2 show that whereas different values of o are required for different groups of subjects. the same value of o (same interaction) could be used for all of the subdesigns, including heredity x heredity, heredity x environment, and environment X environment.’
Individual Differences
Data for each individual judge were plotted as in Figs. 1 and 2, and it was found that the vast majority of judges in all groups of both experi- ments showed trends consistent with the averages. Experiment 2, having the larger number of subjects, will be used to present the individual subject analysis.
The data for each of the 188 subjects in Experiment 2 were fit to the configural-weight averaging model separately, assuming that all subjects have the same scale values. Different individuals were permitted to have different weights, a different w , and a different s,; MJ~ was fixed to 1 .O. The square root of the average data-model discrepancy was less than 5 IQ points for 84 of the 188 subjects and less than 6 for 134 of the 188 subjects.
Rating of the relative importance of variables can be used to predict the estimated weights for individuals. Since the judges rated the importance of each variable in comparison with each of the other four variables, it was possible to sum the four ratings to define an index for each variable representing its rated importance. These indices of rated importance were correlated .75, .77, .68, .S8, and .44 with the estimated relative weights of
’ Data for the single cue designs were also well-described by the model. A figure showing obtained judgments and predicted values for single cues, pairs of cues of equal value, and the marginal means of the cues in the various designs is available upon request from the first author.
MEASURING IMPORTANCE OF CUES IN JUDGMENT 173
Biological Mother (BM), Biological Father (BF), Adoptive Mother (AM), Adoptive Father (AF), and socioeconomic status (SES), respectively.z In the language of multitrait, multimethod analysis, these correlations repre- sent convergent validities.
To give a single overall indication of the predictability of the individual weights from the self-ratings, the simple heredity vs environment compo- site, wyBM + nlBF - wAM - o’er (sum of the relative weights of biological minus environmental parents) was correlated with the sum of the impor- tance ratings of biological vs environmental variables, yielding a correla- tion coefficient of .80. Thus, it appears that the relative weights of cues estimated from the model can be predicted from self-reports of the rela- tive importance of the cues.
As in Experiment 1, the value ofo is positively correlated (r = .24) with the single rating of environment minus heredity. A more detailed analysis of the correlation matrix of all of the ratings and estimated weights is presented in the Appendix.
Alternative Models
One might ask whether the differences between the groups in Figs. i and 2 could be just as well explained by assuming different scale values for the three groups and constraining the weights to be equal instead of vice versa. Although this model uses 41 additional parameters for Exper- iment 1, it yields a much larger sum of squared errors (3203) than the simpler model (l&56), which assumes that only the weights depend on the group. By allowing the range of scale values to vary for different groups, the more complex model could potentially explain the changes, in the effects of biological vs environmental information across groups. How- ever, it fails to explain adequately the decrease in the effect of one type of information when another piece of information of the same type is added. Hence, this model overpredicts the effects of two adoptive parents for the environment groups (Fig. I) and overpredicts the effects of two biological parents for the heredity group. The simpler theory that weights differ gives a more accurate account of these results. Since the change of scale value theory provides a poorer fit and uses a greater number of parame- ters, it seems preferable to represent differences among the groups in
terms of differences in weight. The most general model would allow both scale values and weights to
differ for different groups. The best-fit scale values derived separately are very nearly identical for all three groups of Experiment 1. Although the sum of squared deviations decreases from 1856 to 1708 for Experiment 1, it does so at the cost of 52 additional parameters. Therefore, the data do not appear to require different scale values for different groups.
p Based on 188 cases, the critical vaiue of r at the .Ol level of significance is ,188
174 BlRNBAUM AND STEGNER
When weights and scale value ranges were estimated separately for each subject in Experiment 2. the estimated weights continued to corre- late with the ratings of importance, but the scale value ranges did not. For example, the single rating of the relative importance of environment vs heredity correlated only -. 17, -. I I, .lS, -.02. and -.03 with the scale value ranges for BM, BF. AM, AF, and SES. respectively. The fit of the more general model to individuals in Experiment 2 does not appear sufficiently better to justify the additional parameters. The square root of the average squared data-model discrepancy was less than 6 IQ points for 144 subjects (compared with 134 subjects when the simpler model is applied). This does not seem a large improvement in tit, considering the additional complexity.
In summary, analyses showed that single subjects’ data are highly consistent with group data shown in Figs. 1 and 2, that data for individuals do not appear to require different models, that estimated weights are highly predictable from ratings of the relative importance of the variables, and that by assuming different subjects have the same scale values (but different weights), the configural-weight averaging model can provide a good fit to the data.
DISCUSSION
It should be apparent from the orderliness of the figures and the close agreement between the model and data that intuitive predictions of IQ can be well explained by a few simple premises. Predictions of 1Q can be described by the configural-weight averaging model (Eqs. (2) and (3)), where the value of the information is represented by scale value and the importance is represented by weight.
Ratings of the relative importance of the cues can be used to predict the relative weights. In addition, judges who rate heredity more important than environment tend to place greater configural weight on lower-valued information. In contrast, judges who rate environment more important tend to give the “benefit of the doubt” by placing greater weight on the higher-valued information. With these assumptions. the conhgural-weight averaging model gives a good account of the results of both within-subject design manipulations and individual differences between subjects.
The present results are consistent with the conclusions of Birnbaum (1976), Birnbaum et al. (1976), and of Birnbaum and Stegner (1979), who obtained data consistent with the configural-weight averaging model. In those studies the subjective validity of cues was manipulated, and this manipulation could be represented by variation in the weights. Birnbaum (1976) has shown that weights represent cue-criterion correlations in intui- tive numerical prediction; Birnbaum et al. (1976) found that weight of a source of information in impression formation depends on length of the source’s acquaintance with the person described. Birnbaum et al. ( 1976)

MEASURING IMPORTANCE OF CUES IN JUDGMENT 175
and Birnbaum and Stegner (1979) found that weights depend on the mechanical expertise of the source of information about used cats. In the IQ study, individual differences determine the weights of different cues. Note that weights summarize two effects in Fig. 1. As more environmen- tal information is added (from left to right in each row) or as one proceeds from heredity to environment groups (top to bottom), the weighlt of the environmental information increases. Thus, differences between indi- viduals can be explained in the same terms as adding more information for the same individual.
Nisbett and Wilson (1977) argued that determinants of judgments are often unavailable to the judge, so that the judge is unable to give self- reports of his or her policy. Slavic and Lichtenstein (1971) have als’o noted that regression weights do not correlate highly with self-reported weights. However, regression weights and main effects in analysis of variance confound weight and scale value. In order to compare main effects for two variables, it must be assumed that the psychological variation is equal for both variables. Therefore, previous failures to find correspondence be- tween self-ratings and magnitude of effects may be due to use of inappro- priate models of judgment.
Nisbett and Bellows (1977) used a between-subjects in which subjects were asked to rate the importance of a single cue level to judgment. However. this poses an impossible task, since a subject cannot be ex- pected to rate the importance (variation) attributable to a variable that is held constant unless the range of variation is known or assumed. Asking a subject (in a between-subjects design) to rate the importance of a cue is like asking an experimenter to tell the effect of a treatment without using a control group. Smith and Miller (1978) have also criticized the study of Nisbett and Bellows (1977) for their failure to examine the relationship between ratings and effects at the level of the individual.
The present experiment utilizes a design that permits segregation of weight and scale value for individuals and it was found that weights correlate with the ratings of importance, but that scale value ranges do not. It may not always be the case that weights will correlate with ratings of importance. In this study, the estimated ranges of scale values were approximately equal for all of the cues and showed no evidence of indi- vidual differences. Under different conditions, in which the ranges of scale values varied for different cues or different individuals, it is con- ceivable that ratings of the importance of variables would correspond to some more complex function such as. for example. the product of the weight times the range of the scale values.
The present results show that with appropriate measurement tech- niques in this judgment domain, individual differences in model parame-
176 BIRNBAUM AND STEGNER
ters are predictable from self-reports. The present results, therefore, do not support Nisbett and Wilson’s (1977) speculation that subjects do not have access to their cognitive processes. Although one cannot refute their general claim on the basis of one experiment, it does seem reasonable to caution that one should not be convinced by failures to find correlations between self-reports and experimental effects unless appropriate methods are used for the measurement of the variables to be correlated.
Comparisorl M’ith Actual IQ Data
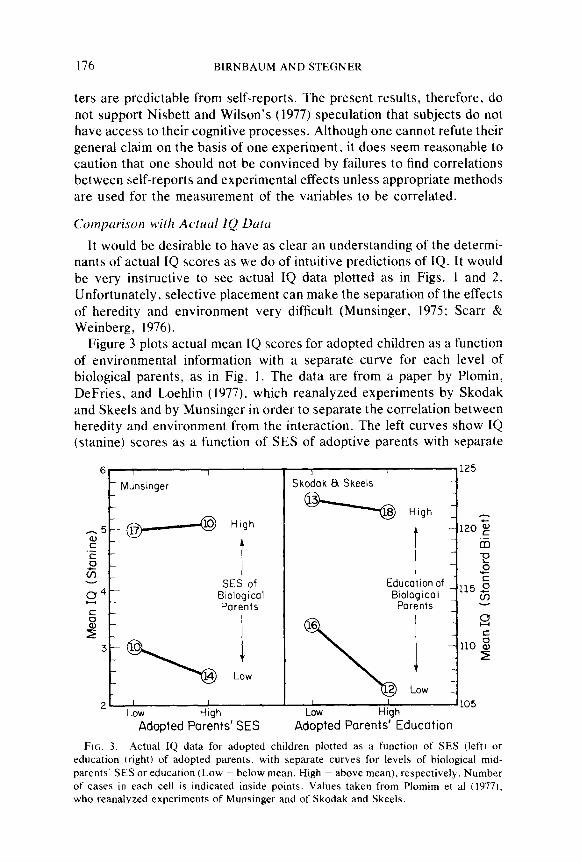
It would be desirable to have as clear an understanding of the determi- nants of actual IQ scores as we do of intuitive predictions of IQ. It would be very instructive to see actual IQ data plotted as in Figs. 1 and 2. Unfortunately, selective placement can make the separation of the effects of heredity and environment very difficult (Munsinger, 1975; Starr & Weinberg, 1976).
Figure 3 plots actual mean IQ scores for adopted children as a function of environmental information with a separate curve for each level of biological parents, as in Fig. 1. The data are from a paper by Plomin, DeFries, and Loehlin (1977). which reanalyzed experiments by Skodak and Skeels and by Munsinger in order to separate the correlation between heredity and environment from the interaction. The left curves show IQ (stanine) scores as a function of SES of adoptive parents with separate
6 I I 1 1 125
- Munsinger Skodok 8 Skeels A
1 \ High $ -
z L SES of
s4 Biological
is; \pa];
Educationof 115 & Biological -
\por[; r,,,!
2- ’ I I 1 Low High LOW High
105
Adopted Parents’ SES Adopted Parents’ Education
FIG. 3. Actual IQ data for adopted children plotted as a function of SES (left) or education (right) of adopted parents. with separate curves for levels of biological mid- parents’ SES or education (Low = below mean. High = above mean), respectively. Number of cases in each cell is indicated inside points. Values taken from Plomim et al (1977). who reanalyzed experiments of Munsinger and of Skodak and Skeels.

MEASURING IMPORTANCE OF CUES IN JUDGMENT 177
curves for low and high SES of biological parents. The right panel shows Stanford-Binet IQ scores of adopted children as a function of adopted parents’ education with separate curves for education level of biological parents. In both cases, the effect of heredity is sizable and statistically significant. The effect of environment in both cases is small, nonsig- nificant, and (from an environmental viewpoint) in the “wrong” direction. The interactions, though similar in the two studies, were also nonsig- nificant (Plomin et al., 1977). These data, though limited, are quite: differ- ent from the intuitive predictions of IQ shown in Fig. I.
In light of the evidence that is available (as in Fig. 3) it might seem surprising that only 75 of the 238 subjects (3 1 S%) rated heredity equal to or greater than environment in importance. Even the heredity group subjects place more weight on the environment than the data in Fig. 3 seem to justify. On the other hand, the popular media tend to support the environmentalist viewpoint and have given wide publicity to rec.ent ud hominum attacks on proponents of the theory that individual differences may be determined in part by genetic differences (Cronbach, 1975); hence, the present results may indeed reflect current beliefs about the effects of environment. It is interesting that a greater proportion of the Ph.D. psychologists (43%) were in the heredity group than graduates (32%) or undergraduates (22%), though these groups differ on so many variables that no conclusion regarding this difference should be drawn.
Some of the heat of the IQ debate may be made more understandable by comparing the statistical models used to discuss the heredity- environment issue with the model of IQ judgments. The heritability coefficient seems to be the locus of a number of misunderstandings. The additive regression model does nor predict that the variance due to hered- ity would increase if the environment were equalized, but the averaging model of intuitive statistics does make this prediction. The additive re- gression model does nol predict that the possible magnitude of environ- mental interventions is limited by the heritability coefficient, but intuitive judgments do appear to have this property.
Similarly, assuming heredity and environment are uncorrelated,, as in the present hypothetical ex.periment, the additive regression mode1 would not predict that as more environmental evidence is supplied, the ‘differ- ences due to heredity should decrease (Fig. 1). However, the averaging model does make the prediction. Thus. some of the disagreement over potential effects of equalizing or improving the environment may have stemmed from misinterpreting the heredity coefficient as a relative weight in an averaging model, that is, from thinking that decreases in one effect will increase another effect.
There has also been much disagreement over the heredity-environment interaction. This disagreement appears to be an empirical issue for Iwhich few data are currently available (Fig. 3), but over which the heredity and
178 BIRNBAUM AND STEGNER
environment groups appear to dispute (Fig. 2). Members of the environ- ment group seem to believe that an improvement in the environment would decrease differences due to heredity whereas the data for the heredity group suggest that they believe an improvement in the environ- ment will actually increase the differences due to heredity.
CONCLUSIONS
Intuitive predictions of IQ can be represented by a configural-weight model. It appears possible to represent the data for all subjects with the same model and scale values but different weights. The relative weights can be predicted from self-reports of the relative importance of the cues. Furthermore, it appears that subjects who rate environment to be of greater importance also tend to place more weight on the cue with the higher scale value than do subjects who judge heredity to be more impor- tant.
Although belief in the importance of heredity was correlated with education level, data for judges of different education levels can be represented by the same model using different weights. One possibility that did not materialize was that judges with more education would use a
process analogous to that of multiple regression, adding deviations for independent sources of information. Instead. faculty were as likely as anyone else to place less weight on biological information when more environmental information was given, contrary to additive models.
Although actual IQ data are of low quality and quantity, the meager data that exist do not justify the high weight placed on the environment even by subjects who rated heredity more important. If the determinants of actual IQ ever become as clear as intuitive predictions of IQ. it would be interesting to see if education reduces the differences in weights between individuals. Should that occur, then intuitive IQ prediction will cease to be a useful situation for the study of individual differences in judgment.
APPENDIX
This appendix assesses the hypothesis that self-reports and relative weights are measures of the importance of the five variables. For each subject, the relative weights were estimated from the fit of the configural-weight averaging model. These weights and the ratings of rela- tive importance of the variables were correlated. This appendix examines the structure of this resulting multitrait, multimethod correlation matrix.
The mean values of the relative importance ratings, estimated parame- ters, standard deviations, and intercorrelation matrix for Experiment 2 are shown in the left and lower triangle of Table 4. The weights used in Table 4 are relative weights (each weight divided by the sum of the five weights and the weight of the initial impression for each subject).

TABL
E 4
MEA
NS.
SIAN
DARD
DE
VIAT
IONS
, CO
RRIX
LA-II
ONS,
AN
D RE
SIDU
AL
CORR
EI.A
TION
S FO
R EX
PERI
MEN
T 2
Varia
ble
Ratin
gs
Wei
ghts
Mea
n SD
I
2 3
4 5
6 7
8 9
IO
11
12
13
14
15
16
Ratin
gs
1. E
-H
2.
BM-A
M
3.
BF-A
M
4.
AF-A
M
5.
SES-
AM
6.
BF-B
M
7.
AF-B
M
8.
SES-
BM
9.
AF-B
F 10
. SE
S-BF
11
. SE
S-AF
Wei
ghts
12
. Il'B
M
13.
M'BF
14.
I1'*M
15.
bvAF
16. e
m
17.
so
18.
w
6.99
2.32
5.23
2.36
5.15
2.34
5.46
1.04
5.57
2.04
5.82
.60
6.48
2.45
6.71
2.54
6.60
2.42
6.71
2.62
5.80
1.88
.14
.08
-.67
.71
.71
.03
p.01
.03
-.75
-.68
-.71
-.66
-.OZ
.I5
.09
-.73
.73
.93
.I0
-.Ol
.l?
-.75
-.69
-.73
-.71
-.04
.I9
.I0
.S8
-.64
-.68
-.32
-.20
-.I9
.62
.53
.61
,513
-.08
.18
.lO
.54
-.56
-.59
.07
.06
-.I0
.61
.56
.61
.56
-.Ol
.15
.09
.28
-.19
-.18
.03
.32
-.03
.I8
.35
.20
.37
.33
98.7
7.14
.07
-.12
-.12
-.08
-.I7
.I3
.I4
.04
.I5
.07
-.I6
.02
.Ob
.24
-.I7
-.17
.14
.08
-.I?
.34
.22
.?5
.19
-.Ol
.84
-.89
-.90
-.01
-.06
.84
-.80
-.81
-.04
.7-l
.83
-.85
-.89
-.03
-.02
.82
-.80
-.80
-.Ob
.24
.04
.06
.08
.04
.78
-.03
.03
.08
.04
-.02
-.05
-.07
-.04
.04
-.Ob
-.07
-.06
.27
.05
.01
.03
-.04
-.O?
-.06
.OO
zr$gr
i&
-.I2
-.08
.26
-.03
.05
-.07
-.04 .oo
-.03
-.03 .05
.08
.05
-.03
-.02 .03
.oo
.16
-.lO
-.02
-.02 .O
l -.0
3
.oo
-.03
-.Ol
-.03
.05
-.01
.oo
.03
.oo
-.04
.Ol
-.02
.03
.oo
-.Ol
-.06
-.Ol
-.05
.06
.Ol
-.07
p.05
.Ol
.06
.oo
.Ob
-.I2
-.04
.OO
.oo
.oo
.03
-.04
.oo
.02
.Ol
.07
.06
.03
-.02
.oo
.oo
-.04
.oo
.oo
.oo
.06
.04
.04
-.06
-.05
.Ol
.05
.Ol
.19
-.20
-.18
-.lI
-__
-___
-._
____
_ No
te.
Entri
es
below
di
agon
al
are
corre
latio
ns;
entri
es
abov
e di
agon
al
are
resid
ual
corre
latio
ns.
See
Q/SO
jbo
fnot
c,
2.
180 BIRNBAUM AND STEGNER
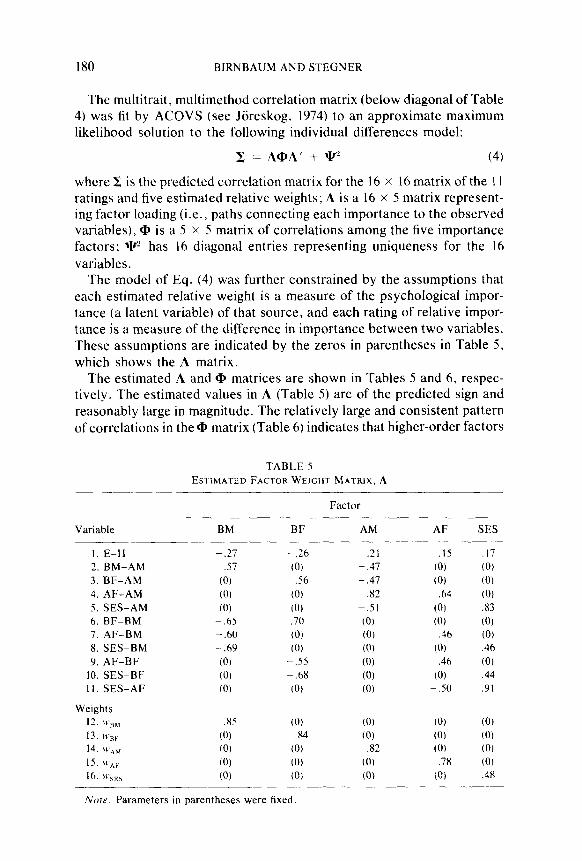
The multitrait, multimethod correlation matrix (below diagonal of Table 4) was fit by ACOVS (see Joreskog. 1974) to an approximate maximum likelihood solution to the following individual differences model:
Iz=A@A’i-w (4)
where C is the predicted correlation matrix for the 16 x 16 matrix of the 1 I ratings and five estimated relative weights; A is a 16 x 5 matrix represent- ing factor loading (i.e., paths connecting each importance to the observed variables), Q, is a 5 x 5 matrix of correlations among the five importance factors; W has 16 diagonal entries representing uniqueness for the 16 variables.
The model of Eq. (4) was further constrained by the assumptions that each estimated relative weight is a measure of the psychological impor- tance (a latent variable) of that source, and each rating of relative impor- tance is a measure of the difference in importance between two variables. These assumptions are indicated by the zeros in parentheses in Table 5. which shows the A matrix.
The estimated A and Q, matrices are shown in Tables 5 and 6, respec- tively. The estimated values in A (Table 5) are of the predicted sign and reasonably large in magnitude. The relatively large and consistent pattern of correlations in the @ matrix (Table 6) indicates that higher-order factors
TABLE 5 ESTIMATED FACTOR WEIGHT MATRIX, A
______
Factor
Variable BM
I. E-H 2. BM-AM 3. BF-AM 4. AF-AM 5. SES-AM 6. BF-BM 7. AF-BM 8. SES-BM 9. AF-BF
10. SES-BF II. SES-AF
- .27 .57
(0) (0) (0)
~ .65 -.60 -.69
(0) (0) (0)
BF
--.?h (0) .56
(0) (0) .7O (0) (0)
-.55 -.68
(0)
AM AF SES
.11 -.47 - .47 -.x2 p.51 (0) (0) (0) (0) (0) (0)
.I5 (0) (0)
.64 (01 (0)
.46
(0) .46
(0) -..50
.I7 (0) (0) (0) .83
(0) (0) .46
(0) .44 .Yl
Weights 12. ICBM ,845 (0) 13. W’,$b ((8 .x4 14. H‘,,h, (0) (0) 15. Il’,,p (0) (0) 16. x’q.\ (0) (01
____-~- __-___.
Note. Parameters in parentheses were fixed.
(0) (0) (0) (0) (0) (0)
.82 (0) (0) (0) .7x (0) (0) (0) .48
______ __-
MEASURING IMPORTANCE OF CUES IN JUDGMENT 181
TABLE 6 ESTIMATEDCORRELATIONS AMONG FACTORS,@
Factor
Factor BM BF AM AF SE.5
BM 1.00 BF .96 1.00 AM -.61 -.69 1.00 AF -.61 -.68 .77 1.00 SES -.29 -.37 .31 .47 1.00
are involved. One could give a good first approximation of Q, in terms of a general heredity vs environment factor.
The upper triangle of Table 4 shows the deviations from Eq. (4). All of the residual correlations are less than .18 with two exceptions. First, the .29 correlation between the rating of the difference in importance between AF-AM and BF-BM is predicted to be only .02 by the mode:l. This residual correlation may indicate a consistent, but perhaps unimportant tendency to rate the father or mother as higher in importance. The second locus of deviations is among the intercorrelations of the estimated weights. Since each relative weight is divided by the sum of the weights, residual correlations among the estimated parameters may not have a substantive interpretation. By allowing a “method” factor (on which only the estimated weights load) a better fit to the correlation matrix could be obtained. Thus, although the individual differences model of Eq. (4) (with the constraints shown in Table 5) could be improved, it appears to provide a reasonable approximation to the correlations in Table 4. Therefore, the correlation matrix appears compatible with the hypothesis that both weights and relative importance ratings are measures of the psychological importances of the cues to individuals.
REFERENCES Anderson. N. H. Information integration theory: A brief survey. In D. H. Krantz, R. C.
Atkinson, R. D. Lute. & P. Suppes (Eds.), Contemporu~~ derselopments in mathemati- cal psychology (Vol. 2). San Francisco: Freeman, 1974.
Birnbaum, M. H. The nonadditivity of personality impressions. Journrrl of Experimental Psychology Monograph. 1974, 102, 543-561.
Birnbaum, M. H. Intuitive numerical prediction. American Journal of‘ Psychology. 1976, 89, 417-429.
Birnbaum, M. H.. & Stegner, S. Source credibility: Expertise, bias. and the judge’s point of view. Journal of Personality and Social Psychology, 1979, 37, 48-74.
Birnbaum, M. H., Wong, R., & Wong, L. Combining information from sources that vary in credibility. Memory & Cogrzifion, 1976, 4, 330-336.
Chandler, J. P. STEPIT-Finds local minima of a smooth function of several parameters. Behavioral Science, 1969. 14, 81-82.
182 BIRNBAUM AND STEGNER
Cronbach, L. J. Five decades of public controversy over mental testing. Amrricnn Psychok ogist. 1975. 30, I-14.
Darlington. R. B. Multiple regression in psychological research and practice, Pspc~hok~~ical BuIktin. 1968, 69, 161-182.
Goldberg, L. R. Simple models or simple processes’? Some research on clinical judgments. Amrrican Ps~d7ologist. 1968, 23, 483-496.
Joreskog. K. G. Analyzing psychological data by structural analysis of covariance matrices. In D. H. Krantz. R. C. Atkinson, R. D. Lute, and P. Suppes (Eds.), “Contemporary developments in mathematical psychology” (Vol. 2). San Francisco: Freeman, 1974.
Munsinger, H. The adopted child’s IQ: A critical review. Psychological Bolletin, 1975. 82, 623-659.
Nisbett, R. E.. & Bellows, N. Verbal reports about causal influences on social judgments: Private access vs. public theories. Journu[ ofPersonality rind Social Psycholog.~. 1977. 35, 613-624.
Nisbett. R. E. & Wilson, T. D. Telling more than we can know: Verbal reports on mental processes. f.sycho/ogicu/ Reviw, 1977. 84, 23 l-259.
Norman. K. L. A solution for weights and scale values in functional measurement. Ps.Y- chologicu/ Review, 1976. 83, 80-84.
Norman. K. L. Attributes in bus transportation: Importance depends on trip purpose. Journul oj’ Applied Psychology, 1977, 62. 164-170.
Plomin. R.. DeFries. J. C., & Loehlin, J. C. Genotype-Environment interaction and correlation in the analysis of human behavior. Psychological Bulletin, 1977, 84, 309- 322.
Scan-. S.. 62 Weinberg, R. A. IQ test performance of black children adopted by white families. American Psychologist. 1976, 31, 726-739.
Schonemann. P. H., Cafferty, T.. & Rotton, J. A note on additive functional measurement. Psychological Ret’ieK,. 1973. 80, 85-87.
Slavic. P., & Lichtenstein, S. Comparison of Bayesian and regression approaches to the study of information processing in judgment. Orguniwtional Behavior and Human Pe~jawunce, 1971, 6, 649-744.
Smith, E. R.. & Miller. F. D. Limits on perception of cognitive processes: A reply to Nisbett and Wilson. Psychologicul Reviettt. 1978. 85, 355-362.
Wiggins, N.. Hoffman, P. J., & Taber. T. Types ofjudges and cue utilization injudgments of intelligence. Jourr7ul of Personulity and Sociul Psychology, 1969, 12, 52-59.
Wyer. R. S., & Carlston. D. E. Soriul congition. inference. and atrrihution. Hillsdale, N.J.: Erlbaum. 1979.