Embed Size (px)
Citation preview

VOL. 2, NO. 8, December 2013 ISSN 2225-7217
ARPN Journal of Science and Technology
2011-2013. All rights reserved.
http://www.ejournalofscience.org
539
1. INTRODUCTION
At the end of every trading day we hear of stock
market analysts articulate that the stock market has been a
bull or a bear, indicating an advancing or retreating
market. But they do not express how bullish or bearish the
market has been. There is no means to measure the degree
of bullishness or bearishness of the market. The paper of
Pagan and Sossounov [1] developed a method for
analyzing the bull and bear periods of the stock market
using an algorithm that could recognize the bull and bear
episodes or the rise and fall of US equity prices. This
method relies on time series measurement that would
characterize the bull and bear period over a length of time.
But this measurement only considers the prices of stocks
and not the volume of transactions. This paper has
developed a method of measuring the bullishness or
bearishness (market sentiment) of the stock market by
uniting the percentage changes in stock market index and
the percentage changes in the volume of transactions. This
measurement can account for inter-day trading. Section 2
of this paper reviews other measurement of market
sentiment while Sections 3 and 4 lay down the
mathematical procedures for the measurement of market
sentiment combining the stock market index and volume
of transactions. Section 6 applies this mathematical
procedure to the US Stock Market. With the method of
measurement that the researcher has developed, the
measurement is tested on the behaviour of the line
produced by the stock market crashes of 1987, 1989 and
1997 of the New York Stock Exchange (NYSE). Then, the
data produced were tested as to their randomness using
autocorrelation as the Efficient Market Theory would have
predicted.
2. REVIEW OF MARKET SENTIMENT
MEASUREMENT
Market or investor sentiment is an indicator of the
aggregate attitude of the investment community at a given
time [2]. There are three ways to measure market
sentiment: a) the put-call ratio, b) the bull-bear ratio, and
c) the volatility index. The put-call ratio is computed by
dividing the volume of put contracts against the volume of
call contracts within an established period of time.
Investors buying put contracts are speculating that the
market will fall while those placing call contracts are
expecting that the market will rally. A high put-call ratio
would indicate a pessimistic or retreating market while a
low put-call ratio would mean a rather optimistic or
advancing market. The bull-bear ratio is a survey that
solicits and monitors the direct opinion of investment
advisors whether the market would be bullish, bearish or
neutral. Levels beyond 60% had indicated optimism
(which is bearish for the market) and surveys less than
40% showed pessimism (which is bullish for the market).
Robert Whaley in 1993 introduced the volatility index or
VIX which is the estimated or implied volatility of the
S&P 500 for the next 30 days. The volatility index is used
by S&P 500 investors to ascertain the daily range for the
index and market derivatives. An increasing VIX reading
suggests a bullish signal that the market will dive and soon
follow an uphill trend. On the other hand, a low VIX
would mean a sluggish market that a bearish reversal is
about to occur [3].
Measuring Market Sentiment and the Three Stock Market Crashes of
the New York Stock Exchange Percival S. Gabriel
University of the East, Department of History and International Studies, Manila, Philippines
ABSTRACT
This research embarked on the development of a method to determine and measure market sentiment or the bullishness-
bearishness of the stock market. This was done using trigonometry by combining the percentage change in the stock market
index and the percentage change in the volume of transactions. The method yielded a formula that unified the stock market
index and volume of transactions and was tested on the three market crashes of 1987, 1989 and 1997 of the New York Stock
Exchange. Then the data produced by the measurement were tested as to their randomness in regard to prediction of the
Efficient Market Theory using autocorrelation. As envisioned, the lines yielded spikes in the bull region and dives in the
bear area. The deep dive of the 1987 crash resulted in a spike of bullish sentiment but the spike was not as high compared to
the 1989 and 1997 crashes which registered high bullish spikes due to slight dives in the bear region. The data produced by
the measurement predominantly yielded insignificant autocorrelation coefficients which indicate randomness as the
Efficient Market Theory would have predicted.
Keywords: market sentiment, weighted percentage change in negotiated factors, weighted percentage change in volume of transactions,
unified line, standard line, angle of sweep
JEL: C58, C65, G01

VOL. 2, NO. 8, December 2013 ISSN 2225-7217
ARPN Journal of Science and Technology
2011-2013. All rights reserved.
http://www.ejournalofscience.org
540
In the paper of Ip-wing and Chi-sang [4] entitled
“Measuring Market Sentiment in Hong Kong’s Stock
Market,” Yu and Tam developed two indicators to
measure investors’ attitude towards risk in the Hong Kong
stock market. These are risk appetite index and investment
sentiment index. The researchers found out that although
the risk appetite index can capture episodes of extreme
optimism and pessimism between 1996 and 2006, it is
volatile and could give inaccurate signals. The investment
sentiment indicator, on the other hand, which is derived by
combining the current realized return and expected short-
term return of the stock market has the power to predict
the returns from the stock market over a period of 6 to 12
months.
These measurements are meant to predict market
sentiment in order to provide indicative promise of what to
do with present or future investments. But these
measurements are short of actually measuring the
performance of the day’s trading or market performance.
The method and the series of formulae of this research will
provide for this gap.
Pagan and Sossounov’s [1] work “A Simple
Framework for Analyzing Bull and Bear Markets”
introduced an algorithm that could spot the bull episodes
in the US equity prices. This algorithm was inspired by the
works of Bry and Boshan [5]. The local peaks and troughs
were subjected into random walk and GARCH models and
found out that random walks could provide a good
explanation of bull and bear markets. While this research
is directly concerned with the creation of a framework for
analyzing the bull and bear markets, the framework is only
concerned with prices but never the volume of
transactions. The method which the present paper has
developed integrates both.
3. THE BULL-BEAR MEASUREMENT
With the measurement that this paper devised,
market sentiment or bull-bear-market measurement can be
defined as, a measure of market performance or activity
through the combined movement of negotiated factors
(price, index, rate, etc.) and their volume of transactions
in order to indicate the degree or appetite of investors in
acquiring or buying, disposing or selling their
investments. This measurement is also intended for other
markets where prices or rates are derived together with the
volumes of transactions.
The measurement devised by the author is
trigonometric. The location of the line produced by uniting
the percentage change in negotiated factors (price, index,
rate etc.) and percentage change in volume signify the
kind of market behaviour while the length of the line and
its angle of sweep, which can be used as the radius of a
half circle, can indicate the degree of the market
behaviour. This measurement is a posteriori. It is a
measure of how the trading fared at the end of the day. It
is not a priori. It is not a means of predicting market
outcomes to aid future investments. The formula is:
Hall [6] explained the dynamics of the Index and
Volume in terms of determining market sentiment as
provided for in Table 1.
If we situate the above table into the Cartesian
coordinate, bearing the dynamics of index or rate on the X
axis and volume on the Y axis, we would arrive at Figure
1 which illustrates the location of the bull and bear market
on the coordinate system. The weighted percentage change
in negotiated factors (L) on the X axis and the weighted
percentage change in volume of transactions (V) on the Y
axis can be united in a single line (r) through the
r2 γn
M = ------------- x 100
180o s
2
W Where: M = market sentiment
r = unified line combining the weighted percentage
change in negotiated factors L and the weighted percentage change
in volume of transactions V
s = unified line of the set standard
= angle of sweep
γ = subscript of indicating the kind of market
n = subscript of pertaining to the location of the given
angle
Table 1. Dynamics of the Price and Volume in a Bull or
Bear Market [6]
Price Volume Market
Sentiment
Explanation
Bull
Price will continue to rise. The increasing trading volume
reflects growing demand to buy
the security, which adds momentum to or supports the
upward direction of the market.
Bear
Price will continue to decline.
Increasing volume indicates more and more investors are
selling, leading to greater
downward momentum.
Moderate
Bear
The price increases is losing
momentum, as indicated by the
decline in trading volume. The price rise is unsupported and
will soon reverse itself becoming
a decline.
Moderate
Bull
The decreasing trading indicates that the price decline is losing
some of its steam. Demand is
still relatively low. Soon, however, the market will reach
its bottom, the price will again be attractive to new investors,
and the resulting increased
demand will cause the price to rally

VOL. 2, NO. 8, December 2013 ISSN 2225-7217
ARPN Journal of Science and Technology
2011-2013. All rights reserved.
http://www.ejournalofscience.org
541
Pythagorean formula which will constitute the radius of
the unified line r.
An ideal 45o line s can be drawn across each
quadrant to indicate a standard percentage change of both
variables (Figure 2). This standard line would indicate the
highest and lowest possible scenarios of bull and bear
markets. The 45o line would also show that both the
negotiated factors and volume of transactions are
increasing at the same rate.
The standard line s generates an angle α on the X
axis using the absolute value of the function of the
standard weighted change in negotiated factors on the
unified standard line. This would be 45o or closely
approximate to it to be exact.
The 45
o line would mean that the weighted
percentage change in negotiated factors and the weighted
percentage change in volume of transactions are increasing
in the same degree. But actually, that is not so in real life.
The volume of transactions changes at a higher rate than
that of negotiated factors. In order to equalize the two
variables and arrive at a standard 45o line, two different
weights for negotiated factors and volume of transactions
are calculated using the following formulae.
These formulae were arrived using simple algebraic
procedure. It would be assumed that the percentage change
in negotiated factors and the percentage in volume of
transactions are equal in order to arrive at a 45o line. This
r = (LoWx)2+(VoWy)
2
1/2
Where: r = unified line of the percentage change of negotiated
factor and percentage change of volume of transaction
Lo = observed percentage change in negotiated factors
Vo = observed percentage change volume of transactions
Wx = weight of negotiated factors
Wy = weight of volume of transactions
s = (Ls2+Vs
2)
1/2
Ls = LhWx
Vs= VhWy
Where: s = unified line of the set standard
Ls = standard weighted percentage change in negotiated factors
Vs= standard weighted percentage change in volume of
transactions
Lh = highest observed percentage change of negotiated factors
Vh= highest observed percentage change of volume of
transactions
Wx = weight of negotiated factors
Wy = weight of volume of transactions
cos α =| Ls/s|
Where : α = angle of s
s = unified line of the set standard
Ls = standard weighted percentage change in negotiated factors
Wx = Vh /(Lh + Vh)
Wy = 1- Wx
Where: Lh = highest observed percentage change in negotiated factors
Vh= highest observed percentage change in volume of
transactions
Wx = weight of negotiated factors
Wy = weight of volume of transactions

VOL. 2, NO. 8, December 2013 ISSN 2225-7217
ARPN Journal of Science and Technology
2011-2013. All rights reserved.
http://www.ejournalofscience.org
542
would mean that the two variables are increasing in the
same degree or level.
The angle β of the unified line r can be derived
through the cosine function of the absolute value of β.
Wherever the line r would be located, together with
the angle β that it generates, different formulae would
indicate the angle of sweep (γn) according to the direction
indicated by its location from the standard line s (Figure
3). The angle of sweep (γn) is the total angle covered by
the line r if it is swept from the lowest possible level up to
where r ends. The rationale behind the angle of sweep is
that the length of r indicates the degree of change of both
volume and negotiated factors but it can be located in any
quadrant depending on the type of the market. In order to
find out the degree of how this change can account for the
other changes from the lowest possible change, the line r
is swept from the lowest possible level. This would be true
for both the bull and the bear markets. For the bull market,
the following formulae can be derived in order to ascertain
the angle of sweep (γn) according to the specific areas
where r is situated. The subscript γ pertains to the kind of
market sentiment and the subscript n refers to the number
where the given angle is located.
For the bear market, the following formulae can be
derived in order to ascertain the angle of sweep (γn)
according to the specific areas where r is situated (Figure
4):
Where Lh = Vh The two variables are increasing in the same degree
Where: Wx + Wy = 1 The two weights when added will equal to 1, when translated to
percentage will equal to 100%
Wx = 1 - Wy
Wy = 1- Wx
LhWx = VhWy
LhWx = Vh (1-Wx)
LhWx = Vh – VhWx
LhWx + VhWx = Vh
(Lh + Vh) Wx = Vh
(Lh + Vh) Wx ÷ (Lh + Vh) = Vh ÷ (Lh + Vh)
Wx = Vh /(Lh + Vh)
cos β = |LoWx/r|
Where : β = angle of r
r = unified line of the percentage change in negotiated factor
and
percentage change in volume of transaction
Lo = observed percentage change of negotiated factors
Wx = weight of negotiated factors
1. γn = bull1 = cos α - cos β
2. γn = bull2 = cos β
3. γn = bull3 = 90o - cos β + 90
o
4. γn = bull4 = cos β + 180o – cos α
Where: = angle of sweep
γ = kind of market, bull or bear
n = location of angle on the coordinate depending on
standard line

VOL. 2, NO. 8, December 2013 ISSN 2225-7217
ARPN Journal of Science and Technology
2011-2013. All rights reserved.
http://www.ejournalofscience.org
543
One-half of the square of the radius (r) multiplied
with pi () can account for half of the circle produced by
the unification of the percentage change in negotiated
factors and volume.
If the angle of sweep (γn) is divided by 180o then the
result multiplied by half-circle covered by the unified
percentage of negotiated factors and volume can give the
total area of the half-circle covered by r.
If this is divided by the area of the half-circle
covered by the standard (s) then we can arrive at the
degree of the market behaviour.
In order to distinguish between bear and bull,
negative (-) would denote the bear and positive (+) would
signify the bull. It is multiplied with 100 to convert it to
percentages.
4. SETTING THE STANDARDS
The lowest observed percentage change in Dow
Jones Industrial Averages (DJIA) during the three periods
being studied was recorded on October 19, 1987 at -
22.6102% and the highest observed percentage change in
the volume of transactions was observed on November 30,
1987 at 211.3826%. The standard line (s) can be set using
the values of these percentage changes. The weights which
can be set as the benchmark can then be calculated.
The standard weighted percentage change of
negotiated factors (Ls) and the standard weighted
percentage change of volume of transactions (Vs) can now
be computed. In the same manner the standard line (s) can
be calculated.
5. γn = bear 1 = cos α - cos β
6. γn = bear 2 = cos β
7. γn = bear 3 = 90o - cos β + 90
o
8. γn = bear 4 = cos β + 180o – cos α
Where: = angle of sweep
γ = kind of market, bull or bear
n = location of angle on the coordinate depending on
standard line
r2
2
r2 γn
2 * 180o
r2 γn s
2
2 * 180o ÷
2
r2 γn 2
2 * 180o * s
2
r2 γn
180o s
2
r2 γn
M = ------------- x 100
180o s
2
Wx = Vh /(Lh + Vh)
= 211.3826 / (22.6102 + 211.3826)
= 0.9034
Wy = 1- Wx
= 1 - 0.912
= 0.0966
Ls = LhWx
= 22.6102 * 0.9034
= 20.4261
Vs= VhWy
=211.3926 * 0.0966
= 20.4205
s = (Ls2+Vs
2)
1/2
= (20.42612 + 20.4205
2)
1/2
= 28.8829

VOL. 2, NO. 8, December 2013 ISSN 2225-7217
ARPN Journal of Science and Technology
2011-2013. All rights reserved.
http://www.ejournalofscience.org
544
The angle of the standard line (s) then can also be
determined.
5. PROCEDURE FOR THE TREATMENT OF DATA
With the standards set, data treatment can now
proceed.
1) Compute the percentage changes of the negotiated
factors (L) and volume of transactions (V) from the data.
2) Compute the unified line (r) with the absolute weighted
percentage changes of negotiated factors and volume of
transactions.
3) Find the cosine of the absolute value of β by dividing
the weighted percentage changes of negotiated factors
(LoWx) over the unified line (r).
4) Locate r in the coordinate and determine on which
quadrant it is located to find out if it is a bear or bull.
5) Having known on which quadrant r is located and
knowing where exactly it is on the standard line (s), find
the angle of sweep (γn).
6) Market sentiment (M) can now be computed using the
formula:
The complete set of data and the market sentiment
computations can be found in Appendices 1-3.
6. RANDOMNESS TEST
The data generated from the measurement of the
bull-bear market that would characterize the 1987, 1989
and 1997 US stock market crashes will be subjected to
randomness test using autocorrelation. Eugene Fama’s
Efficient Market Theory suggests that “security prices
accurately reflect available information and respond
rapidly to new information as soon as it becomes
available.” This efficient market theory comes in three
flavours corresponding to different definitions of
“available information.” The weak form (or random walk
theory) says that prices reflect all the information in past
prices the semi-strong form says that prices reflect all
publicly available information and the strong form holds
that pries reflect all acquirable information [7]. Since
security prices would exhibit randomness even at any type
of market, it would naturally have its natural property
which autocorrelation can analyze in a time series data. A
theoretical property of the random-walk model is that the
autocorrelations of the sequence are zero [8].
7. FINDINGS
The stock market crashes when the stock market
index (prices) hastily dives with the sudden surge in the
volume of transactions. This would mean a sell-off. This
phenomenon can be captured by locating the steep dive of
market sentiment within the bear region. The sudden dip
in the line pattern produced by combining price or index
with volume of transactions would depict a crash while the
sudden spike of the line pattern would picture a bullish
market. A sluggish market will picture waves of tiny
fluctuations in the zero region. A market that ends flat
would then picture a flat line which would mean zero
change in the prices or index and volumes of transactions.
And just like a person who suffered cardiac arrest and
registers a flat line in the cardiogram, a continuous flat line
in market sentiment would mean a dead market. To spot a
stock market crash a sudden dive in market sentiment will
have to be registered.
7.1. THE 1987 STOCK MARKET CRASH
On October 19, 1987, the New York Stock Market
took a deep dive (Figure 5) with a market sentiment of -
49.1573% (or 49.1573% bearish). The plunge was brought
about by the hasty dip of the DJIA at -22.6102% (Figure
6) with a corresponding surge in the volume of
transactions on the same day at 78.5229% (Figure 7). A
slight bullish trading happened the next day with only a
market sentiment of 2.533% (or 2.533% bullish) (Table 2).
But another drop in the market sentiment happened on
November 30, 1987 with a market sentiment of -28.6793%
(or 28.6793% bearish) (Figure 5). But this does not merit a
crash since the DJIA only declined by -4.0267% though
the volume of transactions soared wildly at 211.3826%.
cos α =| Ls/s| = 0.7072
cos α = 44.9021o
L = (l2-l1)/l1 *100
V = (v2-v1)/v1 *100
Where: L = percentage change of negotiated factors
V = percentage change of volume of transactions
l = negotiated factor from data
v = volume of transactions from data
r = (LoWx)2+(VoWy)
2
1/2
cos β = |LoWx/r|
r2 γn
M = ------------- x 100
180o s
2

VOL. 2, NO. 8, December 2013 ISSN 2225-7217
ARPN Journal of Science and Technology
2011-2013. All rights reserved.
http://www.ejournalofscience.org
545
The Black Monday crash of October 19, 1987 was a
confluence of several factors. Two months prior to the
crash, the NYSE was wildly bullish with the DJIA surging
at a record high of 2722.44 points [9]. Going a little far
back, the Securities and Exchange Commission embarked
on tedious investigations of shady Initial Public Offerings
(IPOs) and insider trading. These investigations created
wariness among investors which was even more
aggravated by inflation. As a result, the Federal Reserves
raised interest rates to tighten the valve on the money
supply that could aggravate inflation. As a consequence,
institutional trading firms utilized portfolio insurance that
used stock index futures to hedge against future dips in the
stock market and protect against market losses. As interest
rates rose, many money managers hedged their portfolios
and started selling. The stock market and futures market
was swamped with sell orders pushing the market to crash
[10].
The main culprit of the crash was the program
trading done in computers which was being used by index
arbitrage and portfolio insurance. Index arbitrage was
being utilized by large investors to buy bundles of stocks
and to simultaneously sell them in futures contract. The
contract obliges the buyer to purchase the bundles of
stocks on a predetermined date at a predetermined price.
This will significantly hedge the funds of investors against
future losses. At the same time, large investors and
brokerage houses which were trading on their own
accounts banked on portfolio insurance by utilizing the
options market which grants the purchaser the right of a
future purchase of the bundles of stocks but not obliging
the purchaser to do so. The simultaneous sell orders from
these markets triggered a deluge of sale which the
computer program automatically facilitated without the
possibility of reneging from the automatic sale [11].
7.2. THE 1989 STOCK MARKET CRASH
The NYSE again took a slight dip of market
sentiment at -6.3791% (or 6.3791% bearish) (Figure 8) on
October 13, 1989, according to the measurement. This was
brought about by the plunge in th DJIA at -6.955%
(Figure 9) with a commensurate upsurge of the volume of
transactions at 56.8636% (Figure 10). The market
sentiment that dived on October 13 made a rebound the
next day with a market sentiment of 3.8576% (or 3.8576%
bullish) (Table 3). The market sentiment line from
September to November was marked with significant
spikes that pictured the bull market and interpersed with
harrowing depressions that pictured the bear market
(Figure 8).

VOL. 2, NO. 8, December 2013 ISSN 2225-7217
ARPN Journal of Science and Technology
2011-2013. All rights reserved.
http://www.ejournalofscience.org
546
The mini-crash of October 13, 1989 was belived to
have been brought about by the failed leverage buyout
deal of the United Airlines (UAL) Corporation. This
happened when the Association of Flight Attendants
(AFA) pulled our of the deal after the management of the
company refused to agree on the terms of the labor unions
regarding the Employee Stock Ownership plan which
would have financed the buyout [12].
7.3. THE 1997 STOCK MARKET CRASH
The ripples of the Asian financial crisis took its
toll on the NYSE with a slight dive at -3.8511% (or
3.8511% bearish) (Figure 11) on October 27, 1997 (Table
4). This coincided with the plunge of the DJIA at -
7.1838% (Figure 12) and the surge of market volume at
2.3759% (Figure 13). But the sudden dive delivered a
sudden spike in market sentiment the next day with
5.5023% (or 5.5023% bullish).
The ripples of the Asian financial meltdown started
as early as May 14, 1997 when the Thai government
poured in billions of US dollars from its foreign reserves
to defend the Baht against speculators. On July 2, the Thai
government devalued the Baht by as much as 20% and
was compeled to borrow $17 billion from the International
Monetary Fund. Meanwhile, Malaysia also pulled out
millions of US dollars from its foreign reserves to defend
the Ringgit from speculators. At that time, the Philippine
Peso was devalued as Indonesia widened its trading band
to discourage speculators. In July 24, Singaporean dollar
also started its gradual decline. Malaysian Prime Minister

VOL. 2, NO. 8, December 2013 ISSN 2225-7217
ARPN Journal of Science and Technology
2011-2013. All rights reserved.
http://www.ejournalofscience.org
547
Mahatir Mohammad singled out George Soros as the
culprit behind the speculative attacks. Indonesia
abandoned the trading band for its Rupiah and allowed the
currency to float, triggering the plunge. On October 8,
Indonesia asked the IMF for fresh funds while the Rupiah
plunged 30% of its value despite efforts of its central bank
to fend off attacks. On October 23, the Hong Kong stocks
index fell 10.4% after Hong Kong raised bank lending
rates to 300% to defend the Hong Kong dollar against
specultative attacks. Then the South Korean won also
began to weaken. On October 27, the NYSE was rattled
that DJIA plunged 554 points [13].
8. AUTOCORRELATION TEST OF THE
MEASUREMENT
No significant autocorrelation coefficients were
derived in the 1987 and 1989 bull-bear-market
measurement data (Tables 2 and 3). With insignificant and
very low autocorrelation coefficients, it would mean that
the measurement of the bull-bear-market exhibits
randomness.
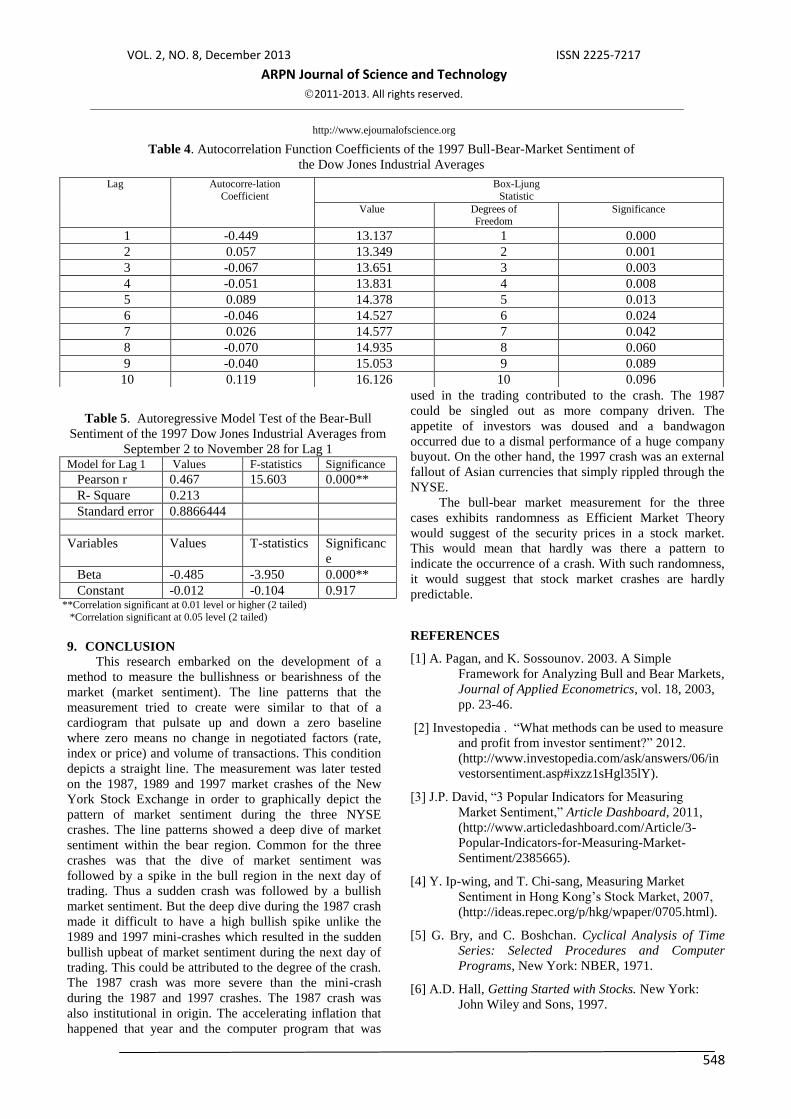
It was the 1997 bull-bear-market measurement
(Table 4) that significant autocorrelation coefficients were
derived from lag 1 to lag 7 at 0.0001 to 0.042 level. But
the autocorrelation coefficients were too low at 0.057 at
lag 2 to 0.026 at lag 7. It was only at lag 1 or the adjacent
series where the autocorrelation coefficient at -0.449 is in
a comparatively moderate fit. This would mean that the
upward movement at the bull region of the market
sentiment is moderately fitted to its adjacent downward
spike at the bear region.
But even then, an autoregressive model (Table 5)
which was hoped to be derived to model lag 1 yielded a
Pearson coefficient of only 0.467 with an R-square of only
0.218. This would mean that the prospective model can
account for only 21.8% of the cases, too low to make the
model usable. Moreover, while the beta coefficient of lag
1 at -0.485 possesses a significant t-statistic at over 0.001
level its constant at -0.012 does not incur significant t-
statistic, making the model irrelevant.
Table 2. Autocorrelation Function Coefficients of the 1987 Bull-Bear-Market Sentiment of
the Dow Jones Industrial Averages
Lag Autocorrelation
Coefficient
Box-Ljung
Statistic
Value Degrees of Freedom
Significance
1 -0.029 0.054 1 0.817
2 0.009 0.059 2 0.971
3 -0.015 0.074 3 0.995
4 -0.029 0.134 4 0.998
5 0.063 0.412 5 0.995
6 -0.021 0.444 6 0.998
7 -0.028 0.500 7 0.999
8 -0.020 0.529 8 1.000
9 -0.031 0.602 9 1.000
10 -0.027 0.659 10 1.000
Table 3. Autocorrelation Function Coefficients of the 1989 Bull-Bull-Market Sentiment of
the Dow Jones Industrial Averages
Lag Autocorre-lation
Coefficient
Box-Ljung
Statistic
Value Degrees of
Freedom
Significance
1 -0.243 3.734 1 0.053
2 -0.072 4.062 2 0.131
3 0.165 5.850 3 0.119
4 -0.133 7.025 4 0.135
5 0.077 7.426 5 0.191
6 -0.061 7.686 6 0.262
7 0.034 7.765 7 0.354
8 -0.009 7.771 8 0.456
9 0.163 9.701 9 0.375
10 -0.101 10.455 10 0.402
VOL. 2, NO. 8, December 2013 ISSN 2225-7217
ARPN Journal of Science and Technology
2011-2013. All rights reserved.
http://www.ejournalofscience.org
548
9. CONCLUSION
This research embarked on the development of a
method to measure the bullishness or bearishness of the
market (market sentiment). The line patterns that the
measurement tried to create were similar to that of a
cardiogram that pulsate up and down a zero baseline
where zero means no change in negotiated factors (rate,
index or price) and volume of transactions. This condition
depicts a straight line. The measurement was later tested
on the 1987, 1989 and 1997 market crashes of the New
York Stock Exchange in order to graphically depict the
pattern of market sentiment during the three NYSE
crashes. The line patterns showed a deep dive of market
sentiment within the bear region. Common for the three
crashes was that the dive of market sentiment was
followed by a spike in the bull region in the next day of
trading. Thus a sudden crash was followed by a bullish
market sentiment. But the deep dive during the 1987 crash
made it difficult to have a high bullish spike unlike the
1989 and 1997 mini-crashes which resulted in the sudden
bullish upbeat of market sentiment during the next day of
trading. This could be attributed to the degree of the crash.
The 1987 crash was more severe than the mini-crash
during the 1987 and 1997 crashes. The 1987 crash was
also institutional in origin. The accelerating inflation that
happened that year and the computer program that was
used in the trading contributed to the crash. The 1987
could be singled out as more company driven. The
appetite of investors was doused and a bandwagon
occurred due to a dismal performance of a huge company
buyout. On the other hand, the 1997 crash was an external
fallout of Asian currencies that simply rippled through the
NYSE.
The bull-bear market measurement for the three
cases exhibits randomness as Efficient Market Theory
would suggest of the security prices in a stock market.
This would mean that hardly was there a pattern to
indicate the occurrence of a crash. With such randomness,
it would suggest that stock market crashes are hardly
predictable.
REFERENCES
[1] A. Pagan, and K. Sossounov. 2003. A Simple
Framework for Analyzing Bull and Bear Markets,
Journal of Applied Econometrics, vol. 18, 2003,
pp. 23-46.
[2] Investopedia . “What methods can be used to measure
and profit from investor sentiment?” 2012.
(http://www.investopedia.com/ask/answers/06/in
vestorsentiment.asp#ixzz1sHgl35lY).
[3] J.P. David, “3 Popular Indicators for Measuring
Market Sentiment,” Article Dashboard, 2011,
(http://www.articledashboard.com/Article/3-
Popular-Indicators-for-Measuring-Market-
Sentiment/2385665).
[4] Y. Ip-wing, and T. Chi-sang, Measuring Market
Sentiment in Hong Kong’s Stock Market, 2007,
(http://ideas.repec.org/p/hkg/wpaper/0705.html).
[5] G. Bry, and C. Boshchan. Cyclical Analysis of Time
Series: Selected Procedures and Computer
Programs, New York: NBER, 1971.
[6] A.D. Hall, Getting Started with Stocks. New York:
John Wiley and Sons, 1997.
Table 4. Autocorrelation Function Coefficients of the 1997 Bull-Bear-Market Sentiment of
the Dow Jones Industrial Averages
Lag Autocorre-lation
Coefficient
Box-Ljung
Statistic
Value Degrees of Freedom
Significance
1 -0.449 13.137 1 0.000
2 0.057 13.349 2 0.001
3 -0.067 13.651 3 0.003
4 -0.051 13.831 4 0.008
5 0.089 14.378 5 0.013
6 -0.046 14.527 6 0.024
7 0.026 14.577 7 0.042
8 -0.070 14.935 8 0.060
9 -0.040 15.053 9 0.089
10 0.119 16.126 10 0.096
Table 5. Autoregressive Model Test of the Bear-Bull
Sentiment of the 1997 Dow Jones Industrial Averages from
September 2 to November 28 for Lag 1 Model for Lag 1 Values F-statistics Significance
Pearson r 0.467 15.603 0.000**
R- Square 0.213
Standard error 0.8866444
Variables Values T-statistics Significanc
e
Beta -0.485 -3.950 0.000**
Constant -0.012 -0.104 0.917 **Correlation significant at 0.01 level or higher (2 tailed)
*Correlation significant at 0.05 level (2 tailed)

VOL. 2, NO. 8, December 2013 ISSN 2225-7217
ARPN Journal of Science and Technology
2011-2013. All rights reserved.
http://www.ejournalofscience.org
549
[7] R.A. Brealey, C. Stewart , and A.J. Marcus.
Fundamentals of Corporate Finance. Boston:
McGraw Hill, 2004.
[8] G. Foster. Financial Statement Analysis. New Jersey:
Prentice-Hall,1978.
[9] “History of U.S. Stock Market Crashes Market
Volume.” 2012.
(http://www.marketvolume.com/info/stock_mark
et_crashes.asp).
[10] J. Colombo. “Black Monday – the Stock Market
Crash of 1987” 2012, (http://www.stock-market-
crash.net/1987-crash/)
[11] “Black Monday Stock Market Crash.” 2012,
(http://www.salempress.com/store/pdfs/Black_M
onday.pdf).
[12] L. Sanderson. “Black October Stock Market
Crashes,” West European History@ Suite 101,
2011,
(http://www.suite101.com/article/black_october_
stock_market_crashes_a392178)
[13] “Timeline of the Panic.” Frontline, 2012
(http://www.pbs.org/wgbh/pages/frontline/shows/
crash/etc/cron.html).

VOL. 2, NO. 8, December 2013 ISSN 2225-7217
ARPN Journal of Science and Technology
2011-2013. All rights reserved.
http://www.ejournalofscience.org
550
Appendix 1. Processed Data for the 1987 Stock Market Crash of the NYSE
Date DJIA
(X)
Volume
(Y)
L
( X) Lwx
V
(Y) Vwy r
Cos
(x/r) Cos β
Angle of
Sweep
(γn)
Market
Sentiment
Standard 22.6102 20.4261 211.3826 20.4196 28.8822 0.7072 44.9021 45.0979
1-Sep-87
2,610.97
1,935,000 0.0000 0.0000 0.0000
2-Sep-
87
2,60
2.04
1,999,0
00 -0.3420 -0.3090 3.3075 0.3195 0.4445 -0.6952 45.9594 134.0406 -0.0176 Bear
3-Sep-87
2,599.49
1,652,000 -0.0980 -0.0885 -17.3587 -1.6768 1.6792 -0.0527 86.9777 86.9777 0.1633
Bull
4-Sep-
87
2,56
1.38
1,291,0
00 -1.4661 -1.3244 -21.8523 -2.1109 2.4920 -0.5315 57.8951 57.8951 0.2394 Bull
8-Sep-87
2,545.12
2,429,000 -0.6348 -0.5735 88.1487 8.5152 8.5345 -0.0672 86.1470 93.8530 -4.5527
Bear
9-Sep-
87
2,54
9.27
1,649,0
00 0.1631 0.1473 -32.1120 -3.1020 3.1055 0.0474 87.2812 87.2812 -0.5606 Bear
10-Sep-87
2,576.05
1,798,000 1.0505 0.9490 9.0358 0.8729 1.2894 0.7360 42.6062 177.7037 0.1968
Bull
11-
Sep-87
2,60
8.74
1,780,0
00 1.2690 1.1464 -1.0011 -0.0967 1.1505 0.9965 4.8219 40.0802 -0.0353 Bear
14-Sep-87
2,613.04
1,544,000 0.1648 0.1489 -13.2584 -1.2808 1.2894 0.1155 83.3683 83.3683 -0.0923
Bear
15-
Sep-87
2,56
6.58
1,362,0
00 -1.7780 -1.6063 -11.7876 -1.1387 1.9689 -0.8158 35.3330 9.5691 0.0247 Bull
16-Sep-87
2,530.19
1,957,000 -1.4178 -1.2809 43.6858 4.2200 4.4101 -0.2904 73.1158 106.8842 -1.3845
Bear
17-
Sep-87
2,52
7.90
1,507,0
00 -0.0905 -0.0818 -22.9944 -2.2213 2.2228 -0.0368 87.8919 87.8919 0.2892 Bull
18-Sep-87
2,524.64
1,881,000 -0.1290 -0.1165 24.8175 2.3974 2.4002 -0.0485 87.2178 92.7822 -0.3560
Bear
21-
Sep-87
2,49
2.82
1,701,0
00 -1.2604 -1.1386 -9.5694 -0.9244 1.4666 -0.7764 87.2178 87.2178 0.1249 Bull
22-Sep-87
2,568.05
2,095,000 3.0179 2.7263 23.1628 2.2375 3.5270 0.7730 39.3760 174.4735 1.4454
Bull
23-
Sep-87
2,58
5.67
2,203,0
00 0.6861 0.6198 5.1551 0.4980 0.7951 0.7796 38.7786 173.8761 0.0732 Bull
24-Sep-87
2,566.42
1,622,000 -0.7445 -0.6726 -26.3731 -2.5476 2.6349 -0.2553 75.2115 75.2115 0.3478
Bull
25-
Sep-87
2,57
0.17
1,380,0
00 0.1461 0.1320 -14.9199 -1.4413 1.4473 0.0912 84.7670 95.2330 -0.1329 Bear
28-Sep-87
2,601.50
1,881,000 1.2190 1.1012 36.3043 3.5070 3.6758 0.2996 72.5672 107.4328 0.9668
Bull
29-
Sep-87
2,59
0.57
1,735,0
00 -0.4201 -0.3796 -7.7618 -0.7498 0.8404 -0.4516 63.1508 63.1508 0.0297 Bull
30-Sep-87
2,596.28
1,831,000 0.2204 0.1991 5.5331 0.5345 0.5704 0.3491 69.5677 110.4323 0.0239
Bull
1-Oct-
87
2,63
9.20
1,932,0
00 1.6531 1.4934 5.5161 0.5329 1.5857 0.9418 19.6363 154.7338 0.2591 Bull
2-Oct-87
2,640.99
1,891,000 0.0678 0.0613 -2.1222 -0.2050 0.2140 0.2864 73.3593 106.6407 -0.0033
Bear
5-Oct-
87
2,64
0.18
1,597,0
00 -0.0307 -0.0277 -15.5473 -1.5019 1.5021 -0.0184 88.9431 88.9431 0.1337 Bull
6-Oct-87
2,548.63
1,756,000 -3.4676 -3.1326 9.9562 0.9618 3.2769 -0.9560 17.0675 152.1650 -1.0882
Bear
7-Oct-
87
2,55
1.08
1,863,0
00 0.0961 0.0868 6.0934 0.5886 0.5950 0.1460 81.6073 98.3927 0.0232 Bull
8-Oct-
87
2,51
6.64
1,987,0
00 -1.3500 -1.2196 6.6559 0.6430 1.3787 -0.8846 27.7977 162.8952 -0.2062 Bear
9-Oct-
87
2,48
2.21
1,583,0
00 -1.3681 -1.2359 -20.3322 -1.9641 2.3206 -0.5326 57.8191 57.8191 0.2074 Bull
12-
Oct-87
2,47
1.44
1,419,0
00 -0.4339 -0.3920 -10.3601 -1.0008 1.0748 -0.3647 68.6114 68.6114 0.0528 Bull
13-
Oct-87
2,50
8.16
1,729,0
00 1.4858 1.3422 21.8464 2.1104 2.5010 0.5367 57.5425 122.4575 0.5101 Bull
14-
Oct-87
2,41
2.70
2,074,0
00 -3.8060 -3.4383 19.9537 1.9275 3.9418 -0.8723 29.2751 164.3726 -1.7009 Bear
15-
Oct-87
2,35
5.09
2,632,0
00 -2.3878 -2.1571 26.9045 2.5990 3.3776 -0.6387 50.3077 129.6923 -0.9853 Bear
16- 2,24 3,385,0 -4.6011 -4.1566 28.6094 2.7637 4.9915 -0.8327 33.6192 168.7167 -2.7996 Bear

VOL. 2, NO. 8, December 2013 ISSN 2225-7217
ARPN Journal of Science and Technology
2011-2013. All rights reserved.
http://www.ejournalofscience.org
551
Oct-87 6.73 00
19-
Oct-87
1,73
8.74
6,043,0
00 -22.6102 -20.4260 78.5229 7.5853 21.7890 -0.9374 20.3727 155.4702 -49.1573 Bear
20-
Oct-87
1,84
1.01
6,081,0
00 5.8818 5.3137 0.6288 0.0607 5.3140 0.9999 0.6550 135.7525 2.5530 Bull
21-
Oct-87
2,02
7.85
4,496,0
00 10.1488 9.1684 -26.0648 -2.5179 9.5079 0.9643 15.3562 29.5459 -1.7788 Bear
22-
Oct-87
1,95
0.43
3,922,0
00 -3.8178 -3.4490 -12.7669 -1.2333 3.6629 -0.9416 19.6757 25.2264 0.2254 Bull
23-
Oct-87
1,95
0.76
2,456,0
00 0.0169 0.0153 -37.3789 -3.6108 3.6108 0.0042 89.7575 89.7575 -0.7794 Bear
26-
Oct-87
1,79
3.93
3,088,0
00 -8.0394 -7.2628 25.7329 2.4858 7.6764 -0.9461 18.8942 153.9917 -6.0434 Bear
27-Oct-87
1,846.49
2,602,000 2.9299 2.6469 -15.7383 -1.5203 3.0524 0.8671 29.8726 15.0295 -0.0933
Bear
28-
Oct-87
1,84
6.82
2,794,0
00 0.0179 0.0161 7.3789 0.7128 0.7130 0.0226 88.7024 91.2976 0.0309 Bull
29-Oct-87
1,938.33
2,581,000 4.9550 4.4764 -7.6235 -0.7364 4.5365 0.9867 9.3423 35.5598 -0.4874
Bear
30-
Oct-87
1,99
3.53
3,034,0
00 2.8478 2.5727 17.5513 1.6955 3.0811 0.8350 33.3855 168.4830 1.0652 Bull
2-Nov-87
2,014.09
1,760,000 1.0313 0.9317 -41.9908 -4.0563 4.1619 0.2239 77.0639 77.0639 -0.8890
Bear
3-
Nov-87
1,96
3.53
2,278,0
00 -2.5103 -2.2678 29.4318 2.8431 3.6368 -0.6236 51.4223 128.5777 -1.1326 Bear
4-Nov-87
1,945.29
2,025,000 -0.9289 -0.8392 -11.1062 -1.0729 1.3621 -0.6161 51.9671 51.9671 0.0642
Bull
5-
Nov-87
1,98
5.41
2,260,0
00 2.0624 1.8632 11.6049 1.1210 2.1744 0.8569 31.0343 166.1318 0.5231 Bull
6-Nov-87
1,959.05
2,282,900 -1.3277 -1.1994 1.0133 0.0979 1.2034 -0.9967 4.6654 139.7629 -0.1348
Bear
9-
Nov-87
1,90
0.20
1,606,9
00 -3.0040 -2.7138 -29.6115 -2.8605 3.9430 -0.6883 46.5070 46.5070 0.4815 Bull
10-Nov-87
1,878.15
1,843,100 -1.1604 -1.0483 14.6991 1.4199 1.7650 -0.5939 53.5623 126.4377 -0.2623
Bear
11-
Nov-87
1,89
9.20
1,478,5
00 1.1208 1.0125 -19.7819 -1.9109 2.1626 0.4682 62.0829 62.0829 -0.1934 Bear
12-Nov-87
1,960.21
2,062,800 3.2124 2.9021 39.5198 3.8176 4.7954 0.6052 52.7585 127.2415 1.9487
Bull
13-
Nov-87
1,93
5.01
1,749,2
00 -1.2856 -1.1614 -15.2026 -1.4686 1.8723 -0.6203 51.6621 51.6621 0.1206 Bull
16-Nov-87
1,949.10
1,643,400 0.7282 0.6578 -6.0485 -0.5843 0.8798 0.7477 41.6118 3.2903 -0.0017
Bear
17-
Nov-87
1,92
2.25
1,482,4
00 -1.3776 -1.2445 -9.7968 -0.9464 1.5634 -0.7960 37.2511 7.6510 0.0125 Bull
18-
Nov-87
1,93
9.16
1,582,6
00 0.8797 0.7947 6.7593 0.6529 1.0286 0.7727 39.4069 174.5044 0.1229 Bull
19-
Nov-87
1,89
5.39
1,571,4
00 -2.2572 -2.0391 -0.7077 -0.0684 2.0403 -0.9994 1.9202 2.9819 0.0083 Bull
20-Nov-87
1,913.63
1,891,700 0.9623 0.8694 20.3831 1.9690 2.1524 0.4039 66.1772 113.8228 0.3512
Bull
23-
Nov-87
1,92
3.08
1,431,6
00 0.4938 0.4461 -24.3220 -2.3495 2.3915 0.1865 79.2487 79.2487 -0.3019 Bear
24-Nov-87
1,963.53
1,995,200 2.1034 1.9002 39.3685 3.8030 4.2513 0.4470 63.4505 116.5495 1.4029
Bull
25-
Nov-87
1,94
6.95
1,397,8
00 -0.8444 -0.7628 -29.9419 -2.8924 2.9913 -0.2550 75.2254 75.2254 0.4483 Bull
27-Nov-87
1,910.48 863,600 -1.8732 -1.6922 -38.2172 -3.6918 4.0611 -0.4167 65.3743 65.3743 0.7181
Bull
30-
Nov-87
1,83
3.55
2,689,1
00 -4.0267 -3.6378 211.3826 20.4196 20.7411 -0.1754 79.8987 100.1013 -28.6793 Bear
Data lifted from “Dow Jones Industrial Averages, Historical Prices”, Yahoo Finance. (http://finance.yahoo.com/q/hp?s=^DJI+Historical+Prices)

VOL. 2, NO. 8, December 2013 ISSN 2225-7217
ARPN Journal of Science and Technology
2011-2013. All rights reserved.
http://www.ejournalofscience.org
552
Appendix 2. Processed Data for the 1989 Stock Market Crash of the NYSE
Date DJIA
(X)
Volume
(Y)
L
( X) Lwx
V
(Y) Vwy r
Cos
(x/r) Cos β
Angle of
Sweep
(γn)
Market
Sentiment
Standard 22.6102 20.4261 211.3826 20.4196 28.8822 0.7072 44.9021 45.0979
1-Sep-89
2,752.09
1,333,000 0.0000 0.0000 0.0000
5-Sep-
89
2,74
4.68
1,451,
800 -0.2692 -0.2432 8.9122 0.8609 0.8946 -0.2719 74.2232 105.7768 -0.0564 Bear
6-Sep-89
2,719.79
1,618,000 -0.9068 -0.8192 11.4479 1.1059 1.3763 -0.5953 53.4683 126.5317 -0.1596
Bear
7-Sep-
89
2,70
6.88
1,601,
600 -0.4747 -0.4288 -1.0136 -0.0979 0.4399 -0.9749 12.8621 32.0400 0.0041 Bull
8-Sep-89
2,709.54
1,540,900 0.0983 0.0888 -3.7900 -0.3661 0.3767 0.2357 76.3698 76.3698 -0.0072
Bear
11-Sep-
89
2,70
4.41
1,260,
200 -0.1893 -0.1710 -18.2166 -1.7597 1.7680 -0.0967 84.4484 84.4484 0.1758 Bull
12-Sep-89
2,707.26
1,421,400 0.1054 0.0952 12.7916 1.2357 1.2393 0.0768 85.5943 94.4057 0.0966
Bull
13-Sep-
89
2,67
9.52
1,753,
300 -1.0247 -0.9257 23.3502 2.2556 2.4382 -0.3797 67.6876 112.3124 -0.4447 Bear
14-Sep-89
2,664.89
1,492,500 -0.5460 -0.4933 -14.8748 -1.4369 1.5192 -0.3247 71.0541 71.0541 0.1092
Bull
15-Sep-
89
2,67
4.58
2,348,
700 0.3636 0.3285 57.3668 5.5416 5.5514 0.0592 86.6076 93.3924 1.9168 Bull
18-Sep-
89
2,68
7.50
1,369,
400 0.4831 0.4364 -41.6954 -4.0278 4.0513 0.1077 83.8162 83.8162 -0.9162 Bear
19-Sep-
89
2,68
7.31
1,416,
100 -0.0071 -0.0064 3.4103 0.3294 0.3295 -0.0194 88.8893 91.1107 -0.0066 Bear
20-Sep-89
2,683.89
1,366,400 -0.1273 -0.1150 -3.5096 -0.3390 0.3580 -0.3212 71.2674 71.2674 0.0061
Bull
21-Sep-
89
2,68
0.28
1,469,
300 -0.1345 -0.1215 7.5307 0.7275 0.7375 -0.1648 80.5171 99.4829 -0.0360 Bear
22-Sep-89
2,681.61
1,333,500 0.0496 0.0448 -9.2425 -0.8928 0.8939 0.0501 87.1256 87.1256 -0.0464
Bear
25-Sep-
89
2,65
9.19
1,211,
300 -0.8361 -0.7553 -9.1639 -0.8852 1.1637 -0.6491 49.5283 49.5283 0.0447 Bull
26-Sep-
89
2,66
3.94
1,583,
500 0.1786 0.1614 30.7273 2.9683 2.9726 0.0543 86.8882 93.1118 0.5480 Bull
27-Sep-
89
2,67
3.06
1,584,
000 0.3424 0.3093 0.0316 0.0031 0.3093 1.0000 0.5651 135.6626 0.0086 Bull
28-Sep-
89
2,69
4.91
1,642,
400 0.8174 0.7385 3.6869 0.3562 0.8199 0.9007 25.7477 160.8452 0.0720 Bull
29-Sep-
89
2,69
2.82
1,553,
000 -0.0776 -0.0701 -5.4433 -0.5258 0.5305 -0.1321 82.4104 82.4104 0.0154 Bull
2-Oct-
89
2,71
3.72
1,274,
100 0.7761 0.7012 -17.9588 -1.7348 1.8712 0.3747 67.9929 67.9929 -0.1585 Bear
3-Oct-
89
2,75
4.56
1,825,
500 1.5049 1.3596 43.2776 4.1806 4.3961 0.3093 71.9851 108.0149 1.3902 Bull
4-Oct-
89
2,77
1.09
1,945,
900 0.6001 0.5421 6.5955 0.6371 0.8366 0.6480 49.6055 130.3945 0.0608 Bull
5-Oct-
89
2,77
3.56
1,778,
900 0.0891 0.0805 -8.5821 -0.8290 0.8329 0.0967 84.4523 84.4523 -0.0390 Bear
6-Oct-
89
2,78
5.52
1,725,
200 0.4312 0.3896 -3.0187 -0.2916 0.4866 0.8006 36.8170 8.0851 -0.0013 Bear
9-Oct-
89
2,79
1.41
868,10
0 0.2115 0.1910 -49.6812 -4.7992 4.8030 0.0398 87.7206 87.7206 -1.3477 Bear
10-Oct-
89
2,78
5.33
1,475,
600 -0.2178 -0.1968 69.9804 6.7601 6.7630 -0.0291 88.3327 91.6673 -2.7923 Bear
11-Oct-
89
2,77
3.36
1,640,
700 -0.4298 -0.3882 11.1887 1.0808 1.1484 -0.3381 70.2415 70.2415 -0.0617 Bear
12-Oct-
89
2,75
9.84
1,601,
200 -0.4875 -0.4404 -2.4075 -0.2326 0.4980 -0.8843 27.8374 17.0647 0.0028 Bull
13-Oct-89
2,569.26
2,511,700 -6.9055 -6.2384 56.8636 5.4930 8.3121 -0.7505 41.3645 138.6355 -6.3791
Bear
16-Oct-
89
2,65
7.38
4,162,
900 3.4298 3.0985 65.7403 6.3505 7.0661 0.4385 63.9919 116.0081 3.8576 Bull
17-Oct- 2,63 2,240, -0.7018 -0.6340 -46.1745 -4.4605 4.5053 -0.1407 81.9100 81.9100 1.1073 Bull

VOL. 2, NO. 8, December 2013 ISSN 2225-7217
ARPN Journal of Science and Technology
2011-2013. All rights reserved.
http://www.ejournalofscience.org
553
89 8.73 700
18-Oct-
89
2,64
3.65
1,669,
000 0.1865 0.1684 -25.5143 -2.4647 2.4704 0.0682 86.0904 86.0904 -0.3499 Bear
23-Oct-
89
2,66
2.91
1,358,
600 0.7285 0.6582 -18.5980 -1.7966 1.9133 0.3440 69.8800 69.8800 -0.1704 Bear
24-Oct-
89
2,65
9.22
2,379,
600 -0.1386 -0.1252 75.1509 7.2596 7.2607 -0.0172 89.0121 90.9879 -3.1945 Bear
25-Oct-
89
2,65
3.28
1,556,
500 -0.2234 -0.2018 -34.5898 -3.3414 3.3475 -0.0603 86.5439 86.5439 0.6459 Bull
26-Oct-
89
2,61
3.73
1,752,
400 -1.4906 -1.3466 12.5859 1.2158 1.8143 -0.7422 42.0775 177.1750 -0.3884 Bear
27-Oct-
89
2,59
6.72
1,703,
300 -0.6508 -0.5879 -2.8019 -0.2707 0.6472 -0.9084 24.7197 20.1824 0.0056 Bull
30-Oct-
89
2,60
3.48
1,266,
300 0.2603 0.2352 -25.6561 -2.4784 2.4895 0.0945 84.5793 84.5793 -0.3491 Bear
31-Oct-89
2,645.08
1,761,000 1.5979 1.4435 39.0666 3.7738 4.0405 0.3573 69.0679 110.9321 1.2061
Bull
1-Nov-
89
2,64
5.90
1,542,
400 0.0310 0.0280 -12.4134 -1.1991 1.1995 0.0233 88.6621 88.6621 -0.0850 Bear
2-Nov-89
2,631.56
1,524,400 -0.5420 -0.4896 -1.1670 -0.1127 0.5024 -0.9745 12.9663 31.9358 0.0054
Bull
3-Nov-
89
2,62
9.51
1,315,
000 -0.0779 -0.0704 -13.7366 -1.3270 1.3288 -0.0530 86.9641 86.9641 0.1023 Bull
6-Nov-89
2,582.17
1,354,800 -1.8003 -1.6264 3.0266 0.2924 1.6525 -0.9842 10.1908 145.2883 -0.2642
Bear
7-Nov-
89
2,59
7.13
1,630,
000 0.5794 0.5234 20.3130 1.9622 2.0308 0.2577 75.0650 104.9350 0.2882 Bull
8-Nov-89
2,623.36
1,701,500 1.0100 0.9124 4.3865 0.4237 1.0060 0.9070 24.9111 160.0086 0.1078
Bull
9-Nov-
89
2,60
3.69
1,433,
900 -0.7498 -0.6774 -15.7273 -1.5193 1.6634 -0.4072 65.9700 65.9700 0.1216 Bull
10-Nov-89
2,625.61
1,318,000 0.8419 0.7606 -8.0829 -0.7808 1.0900 0.6978 45.7526 45.7526 -0.0362
Bear
13-Nov-
89
2,62
6.43
1,407,
500 0.0312 0.0282 6.7906 0.6560 0.6566 0.0430 87.5372 92.4628 0.0265 Bull
14-Nov-89
2,610.25
1,431,700 -0.6160 -0.5565 1.7194 0.1661 0.5808 -0.9582 16.6170 151.7145 -0.0341
Bear
15-Nov-
89
2,63
2.58
1,551,
300 0.8555 0.7728 8.3537 0.8070 1.1173 0.6917 46.2377 133.7623 0.1112 Bull
16-Nov-89
2,635.66
1,483,700 0.1170 0.1057 -4.3576 -0.4209 0.4340 0.2435 75.9052 75.9052 -0.0095
Bear
17-Nov-
89
2,65
2.66
1,510,
200 0.6450 0.5827 1.7861 0.1725 0.6077 0.9588 16.4940 151.5915 0.0373 Bull
20-Nov-89
2,632.04
1,281,700 -0.7773 -0.7022 -15.1304 -1.4616 1.6215 -0.4331 64.3375 64.3375 0.1127
Bull
21-Nov-
89
2,63
9.29
1,479,
000 0.2755 0.2488 15.3936 1.4870 1.5077 0.1650 80.5000 99.5000 0.1506 Bull
22-Nov-89
2,656.78
1,457,300 0.6627 0.5987 -1.4672 -0.1417 0.6152 0.9731 13.3194 31.5827 -0.0080
Bear
24-Nov-
89
2,67
5.55
862,90
0 0.7065 0.6382 -40.7878 -3.9401 3.9915 0.1599 80.7987 80.7987 -0.8573 Bear
27-Nov-89
2,694.97
1,493,900 0.7258 0.6557 73.1255 7.0639 7.0943 0.0924 84.6967 95.3033 3.1944
Bull
28-Nov-
89
2,70
2.01
1,537,
700 0.2612 0.2360 2.9319 0.2832 0.3687 0.6401 50.1977 129.8023 0.0117 Bull
29-Nov-89
2,688.78
1,472,700 -0.4896 -0.4423 -4.2271 -0.4083 0.6020 -0.7348 42.7112 2.1909 0.0005
Bull
30-Nov-
89
2,70
6.27
1,532,
000 0.6505 0.5876 4.0266 0.3890 0.7047 0.8339 33.5012 168.5987 0.0558 Bull
Data lifted from “Dow Jones Industrial Averages, Historical Prices”, Yahoo Finance. (http://finance.yahoo.com/q/hp?s=^DJI+Historical+Prices)

VOL. 2, NO. 8, December 2013 ISSN 2225-7217
ARPN Journal of Science and Technology
2011-2013. All rights reserved.
http://www.ejournalofscience.org
554
Appendix 3. Processed Data for the 1997 Stock Market Crash of the NYSE
Date DJIA
(X)
Volume
(Y)
L
( X) Lwx
V
(Y) Vwy r
Cos
(x/r) Cos β
Angle
of
Sweep
(γn)
Market
Sentiment
Standard 22.6102 20.4261 211.3826 20.4196 28.8822 0.7072 44.9021 45.0979
2-Sep-
97
7,879.
78
4,918,7
00 0.0000 0.0000 0.0000
3-Sep-
97
7,894.
64
5,490,6
00 0.1886 0.1704 11.6271 1.1232 1.1360 0.1500 81.3749 98.6251 0.0848 Bull
4-Sep-
97
7,867.
24
5,593,1
00 -0.3471 -0.3135 1.8668 0.1803 0.3617 -0.8668 29.9055 165.0030 -0.0144 Bear
5-Sep-
97
7,822.
41
5,364,0
00 -0.5698 -0.5148 -4.0961 -0.3957 0.6493 -0.7929 37.5473 7.3548 0.0021 Bull
8-Sep-
97
7,835.
18
4,664,3
00 0.1632 0.1475 -13.0444 -1.2601 1.2687 0.1162 83.3245 83.3245 -0.0893 Bear
9-Sep-
97
7,851.
91
5,022,0
00 0.2135 0.1929 7.6689 0.7408 0.7655 0.2520 75.4051 104.5949 0.0408 Bull
10-Sep-
97
7,719.
28
5,176,2
00 -1.6891 -1.5260 3.0705 0.2966 1.5545 -0.9816 10.9997 33.9024 0.0546 Bull
11-Sep-
97
7,660.
98
5,750,2
00 -0.7553 -0.6823 11.0892 1.0712 1.2701 -0.5372 57.5056 122.4944 -0.1316 Bear
12-Sep-
97
7,742.
97
5,441,5
00 1.0702 0.9668 -5.3685 -0.5186 1.0971 0.8812 28.2083 16.6938 -0.0134 Bear
15-Sep-
97
7,721.
14
4,680,3
00 -0.2819 -0.2547 -13.9888 -1.3513 1.3751 -0.1852 79.3260 79.3260 0.0999 Bull
16-Sep-
97
7,895.
92
6,363,8
00 2.2637 2.0450 35.9699 3.4747 4.0318 0.5072 59.5216 120.4784 1.3043 Bull
17-Sep-
97
7,886.
44
5,905,5
00 -0.1201 -0.1085 -7.2017 -0.6957 0.7041 -0.1540 81.1383 81.1383 0.0268 Bull
18-Sep-
97
7,922.
72
5,668,3
00 0.4600 0.4156 -4.0166 -0.3880 0.5686 0.7310 43.0338 43.0338 -0.0093 Bear
19-Sep-
97
7,917.
27
6,310,4
00 -0.0688 -0.0621 11.3279 1.0943 1.0960 -0.0567 86.7496 93.2504 -0.0746 Bear
22-Sep-97
7,996.83
4,909,000 1.0049 0.9078 -22.2078 -2.1453 2.3294 0.3897 67.0633 67.0633 -0.2424
Bear
23-Sep-
97
7,970.
06
5,229,3
00 -0.3348 -0.3024 6.5248 0.6303 0.6991 -0.4326 64.3678 115.6322 -0.0376 Bear
24-Sep-97
7,906.71
6,394,600 -0.7948 -0.7181 22.2841 2.1526 2.2692 -0.3164 71.5526 108.4474 -0.3719
Bear
25-Sep-
97
7,848.
01
5,248,8
00 -0.7424 -0.6707 -17.9182 -1.7309 1.8563 -0.3613 68.8196 68.8196 0.1579 Bull
26-Sep-97
7,922.18
5,053,400 0.9451 0.8538 -3.7228 -0.3596 0.9264 0.9216 22.8410 22.0611 -0.0126
Bear
29-Sep-
97
7,991.
43
4,771,0
00 0.8741 0.7897 -5.5883 -0.5398 0.9566 0.8255 34.3566 10.5455 -0.0064 Bear
30-Sep-97
7,945.26
5,875,000 -0.5777 -0.5219 23.1398 2.2353 2.2954 -0.2274 76.8572 103.1428 -0.3619
Bear
1-Oct-
97
8,015.
50
5,986,6
00 0.8840 0.7986 1.8996 0.1835 0.8195 0.9746 12.9398 148.0373 0.0662 Bull
2-Oct-97
8,027.53
4,747,600 0.1501 0.1356 -20.6962 -1.9993 2.0038 0.0677 86.1202 86.1202 -0.2303
Bear
3-Oct-
97
8,038.
58
6,233,7
00 0.1377 0.1244 31.3021 3.0238 3.0263 0.0411 87.6450 92.3550 0.5633 Bull
6-Oct-97
8,100.22
4,956,200 0.7668 0.6927 -20.4934 -1.9797 2.0974 0.3303 70.7139 70.7139 -0.2072
Bear
7-Oct-
97
8,178.
31
5,519,7
00 0.9640 0.8709 11.3696 1.0983 1.4017 0.6213 51.5867 128.4133 0.1680 Bull
8-Oct-
97
8,095.
06
5,731,1
00 -1.0179 -0.9196 3.8299 0.3700 0.9912 -0.9277 21.9156 157.0131 -0.1027 Bear
9-Oct-
97
8,061.
42
5,518,4
00 -0.4156 -0.3754 -3.7113 -0.3585 0.5191 -0.7232 43.6806 1.2215 0.0002 Bull
10-Oct-97
8,045.21
5,006,800 -0.2011 -0.1817 -9.2708 -0.8956 0.9138 -0.1988 78.5336 78.5336 0.0437
Bull
13-Oct-
97
8,072.
22
3,548,0
00 0.3357 0.3033 -29.1364 -2.8146 2.8309 0.1071 83.8496 83.8496 -0.4475 Bear
14-Oct-97
8,096.29
5,103,300 0.2982 0.2694 43.8360 4.2346 4.2431 0.0635 86.3601 93.6399 1.1228
Bull

VOL. 2, NO. 8, December 2013 ISSN 2225-7217
ARPN Journal of Science and Technology
2011-2013. All rights reserved.
http://www.ejournalofscience.org
555
15-Oct-
97
8,057.
98
5,053,1
00 -0.4732 -0.4275 -0.9837 -0.0950 0.4379 -0.9762 12.5326 32.3695 0.0041 Bull
16-Oct-
97
7,938.
88
5,970,1
00 -1.4780 -1.3353 18.1473 1.7530 2.2036 -0.6059 52.7039 127.2961 -0.4117 Bear
17-Oct-
97
7,847.
03
6,249,8
00 -1.1570 -1.0452 4.6850 0.4526 1.1390 -0.9177 23.4126 158.5101 -0.1369 Bear
20-Oct-
97
7,921.
44
4,838,8
00 0.9483 0.8567 -22.5767 -2.1809 2.3431 0.3656 68.5553 68.5553 -0.2507 Bear
21-Oct-
97
8,060.
44
5,823,1
00 1.7547 1.5852 20.3418 1.9650 2.5247 0.6279 51.1061 128.8939 0.5472 Bull
22-Oct-
97
8,034.
65
6,134,9
00 -0.3200 -0.2890 5.3545 0.5172 0.5925 -0.4878 60.8026 119.1974 -0.0279 Bear
23-Oct-
97
7,847.
77
6,732,7
00 -2.3259 -2.1012 9.7443 0.9413 2.3024 -0.9126 24.1310 159.2285 -0.5622 Bear
24-Oct-
97
7,715.
41
6,776,3
00 -1.6866 -1.5237 0.6476 0.0626 1.5250 -0.9992 2.3511 137.4486 -0.2129 Bear
27-Oct-
97
7,161.
15
6,937,3
00 -7.1838 -6.4898 2.3759 0.2295 6.4939 -0.9994 2.0254 137.1229 -3.8511 Bear
28-Oct-
97
7,498.
32
12,025,
500 4.7083 4.2535 73.3455 7.0852 8.2639 0.5147 59.0220 120.9780 5.5023 Bull
29-Oct-
97
7,506.
67
7,776,6
00 0.1114 0.1006 -35.3324 -3.4131 3.4146 0.0295 88.3117 88.3117 -0.6857 Bear
30-Oct-
97
7,381.
67
7,122,3
00 -1.6652 -1.5043 -8.4137 -0.8128 1.7099 -0.8798 28.3816 16.5205 0.0322 Bull
31-Oct-
97
7,442.
08
6,380,7
00 0.8184 0.7393 -10.4124 -1.0058 1.2483 0.5923 53.6828 53.6828 -0.0557 Bear
3-Nov-
97
7,674.
39
5,647,4
00 3.1216 2.8200 -11.4925 -1.1102 3.0307 0.9305 21.4883 23.4138 -0.1432 Bear
4-Nov-97
7,689.13
5,415,900 0.1921 0.1735 -4.0992 -0.3960 0.4323 0.4013 66.3379 66.3379 -0.0083
Bear
5-Nov-
97
7,692.
57
5,656,8
00 0.0447 0.0404 4.4480 0.4297 0.4316 0.0936 84.6264 95.3736 0.0118 Bull
6-Nov-97
7,683.24
5,228,900 -0.1213 -0.1096 -7.5643 -0.7307 0.7389 -0.1483 81.4721 81.4721 0.0296
Bull
7-Nov-
97
7,581.
32
5,699,8
00 -1.3265 -1.1984 9.0057 0.8700 1.4809 -0.8092 35.9774 171.0749 -0.2498 Bear
10-Nov-97
7,552.59
4,641,400 -0.3790 -0.3424 -18.5691 -1.7938 1.8261 -0.1875 79.1948 79.1948 0.1759
Bull
11-Nov-
97
7,558.
73
4,356,6
00 0.0813 0.0734 -6.1361 -0.5927 0.5973 0.1230 82.9368 82.9368 -0.0197 Bear
12-Nov-97
7,401.32
5,853,400 -2.0825 -1.8813 34.3571 3.3189 3.8150 -0.4931 60.4531 119.5469 -1.1588
Bear
13-Nov-
97
7,487.
76
6,539,6
00 1.1679 1.0551 11.7231 1.1325 1.5478 0.6817 47.0257 132.9743 0.2122 Bull
14-Nov-97
7,572.48
6,357,600 1.1314 1.0221 -2.7830 -0.2688 1.0569 0.9671 14.7360 149.8335 -0.1115
Bear
17-Nov-
97
7,698.
22
5,765,4
00 1.6605 1.5001 -9.3148 -0.8998 1.7493 0.8576 30.9571 13.9450 -0.0284 Bear
18-Nov-97
7,650.82
5,213,800 -0.6157 -0.5562 -9.5674 -0.9242 1.0787 -0.5157 58.9579 58.9579 0.0457
Bull
19-Nov-
97
7,724.
74
5,427,2
00 0.9662 0.8728 4.0930 0.3954 0.9582 0.9109 24.3698 159.4673 0.0975 Bull
20-Nov-97
7,826.61
6,026,100 1.3187 1.1914 11.0352 1.0660 1.5987 0.7452 41.8213 176.9188 0.3011
Bull
21-Nov-
97
7,881.
07
6,110,0
00 0.6958 0.6286 1.3923 0.1345 0.6428 0.9779 12.0765 147.1740 0.0405 Bull
24-Nov-97
7,767.92
5,149,200 -1.4357 -1.2970 -15.7250 -1.5190 1.9974 -0.6493 49.5077 49.5077 0.1315
Bull
25-Nov-
97
7,808.
95
5,878,9
00 0.5282 0.4772 14.1711 1.3689 1.4497 0.3292 70.7828 109.2172 0.1529 Bull
26-Nov-97
7,794.78
4,877,500 -0.1815 -0.1639 -17.0338 -1.6455 1.6536 -0.0991 84.3107 84.3107 0.1535
Bull
28-Nov-
97
7,823.
13
1,890,7
00 0.3637 0.3286 -61.2363 -5.9154 5.9245 0.0555 86.8208 86.8208 -2.0296 Bear
Data lifted from “Dow Jones Industrial Averages, Historical Prices”, Yahoo Finance. (http://finance.yahoo.com/q/hp?s=^DJI+Historical+Prices)