Embed Size (px)
Citation preview

Measuring In�ation in the Modern Economy �
a Micro Price-Setting View
Aviv Nevo and Arlene Wong
discussed by Michael Weber
June 20, 2018

Motivation
In�ation over time in the U.S.
1970
1980
1990
2000
2010
-2
0
2
4
6
8
10
12
14
United States
Sample Jan 1970 � May 2018
Average CPI in�ation of 4% p.a.
Last 10 years below historical mean

Motivation
In�ation over time in the U.S.
1960
1960
1970
1980
1990
2000
2010
-2
0
2
4
6
8
10
12
14
United States
Sample Jan 1960 � May 2018
Average CPI in�ation of 3.4% p.a.
Last 10 years below historical mean

Motivation
In�ation over time in the U.S.
1990
2000
2010
-2
0
2
4
6
8
10
12
14
United States
Sample Jan 1990 � May 2018
Average CPI in�ation of 2.4% p.a.
Currently below historical mean?

Motivation
In�ation over time in the Eurozone
2002
2007
2012
2017
-1
0
1
2
3
4
5
Euro Area
Sample Jan 2002 � April 2018
Average CPI in�ation of 1.7% p.a.
Currently below historical mean

Motivation
Low In�ation? Determinants
Depending on sample period in�ation historically low
What are potential drivers?
Change in age composition of workforce?
Change in market power?
Change in expectations?

Empirics
Change of Age Composition of Labor Force
Substantial heterogeneity in in�ation across industries
Large heterogeneity in age composition across industries over time
Recent trend: tech industry top employer for college grads
Increasing age in middle-class jobs
Low wage-bargaining power in industries with primarily old workers?

Empirics
Aging Middle-Class Job 48 AEA PAPERS AND PROCEEDINGS MAY 2009
5
Skill percentile (ranked by occupational mean wage)
Figure 2. Smoothed Changes in Mean Worker Age by Occupational Skill Percentile, 1980-2005
where R and Mare, respectively, the intensity of routine and manual task input in each occupa tion in 1980, measured on a 0 to 10 scale. This measure is rising in the relative importance of routine tasks within an occupation and falling in the relative importance of manual tasks. Since RTI does not have a cardinal scale, we standard ize it with a mean of zero and an employment weighted, cross-occupation standard deviation of unity in 1980.
This simple measure appears to capture well the job categories that motivate our conceptual frame work. Among the 10 most routine task-intensive occupations in our sample of 330, 6 are clerical and accounting occupations and several others represent repetitive physical motion activities. Among the 10 least routine task intensive occupa tions, 4 are in-person service occupations, while the remainder involve driving motor vehicles.5 To test the link between routine task-intensity
and changes in age structure, we estimate a vari ant of equation (1) in which the RTI measure is included as a predictor of changes in occupa tional age structure. The second and third pan els of Table 1 show that this variable is highly significant in all specifications. Occupations that in 1980 were one standard deviation above the mean of routine intensity gain 0.6 years of age relative to the mean over the next 25 years. This age gain is driven by declining relative employ ment of young workers in routine task-intensive occupations, and by rising relative employment
5 Additional details on the Routine Task Intensity mea sure are found in Autor and Dorn (2008), who develop this measure using the ALM data.
of older workers, particularly those age 55 to 64. The third panel of Table 1 shows that the predictive relationship between routine intensity and occupation aging is quite robust to control ling for contemporaneous changes in occupa tions' employment shares?though of course the employment shares of routine task-intensive occupations fall significantly in this period.
Thus, like middle-skill occupations, routine task-intensive occupations are getting old. This finding reflects the fact that middle-skill occu pations are also disproportionately routine task intensive.
III. Where Do the Routine Workers Go?
We now exploit the robust predictive relation ship between occupational decline and occupa tional aging to study how the decline of routine occupations affects the opportunity set of work ers at different age and skill levels. Specifically, we ask which nonroutine jobs absorb young and older workers as routine task-intensive occupa tions are displaced.
For this analysis, we shift the unit of observa tion from changes in age structure within occu pations to changes in the age composition of employment within local labor markets, following an approach developed by Christopher L. Smith (2008). Based on the results above, we anticipate that local labor markets that were specialized in routine task-intensive occupations at the start of the sample period should have experienced a dif ferential contraction of middle-skill jobs over the subsequent 25 years. We use this cross-market variation in (expected) occupational declines to analyze the effect of the thinning of the ranks of middle-skill occupations on the occupational dis tribution of young and old workers. As a time-consistent measure of local labor
markets, we implement the concept of Commuting Zones ("CZs"), developed by Charles M. Tolbert and Molly Sizer (1996), who used commuting data from the 1990 census to identify clusters of counties?i.e., CZs?that exhibit strong com muting ties within clusters but weak commuting across clusters. Our analysis uses 722 CZs that cover the entire mainland of the United States, including metropolitan and rural areas.6
6 Commuting zones have two advantages over other geographic units typically used for analysis of local labor
This content downloaded from 73.93.60.216 on Wed, 08 Nov 2017 19:08:18 UTCAll use subject to http://about.jstor.org/terms
Source: This Job Is �Getting Old� by Autor & Dorn, AER P&P (2009)
Routine-task jobs getting older
High & low skill jobs younger

Empirics
Age Composition and Industry In�ation
Automation drives out routine-task middle class jobs
Results in aging labor force within those industries
Do industries with larger share of old workers have lower in�ation?
Does lower wage growth drive lower in�ation?

Empirics
Age Composition and Industry In�ation cont.
Use Census IPUMS data to create senior to all ratio (S2A)
Hours worked by workers with age btw. 55 & 64 to total hours worked
Average 5-year PPI industry in�ation data from BLS (INF)
Labor intensity (INT) as ratio of labor costs to value added
Add. controls: shipping costs (CE), industry unemployment (UE), unionization (MEM),
commodity-price in�ation
Age Composition and Industry In�ation by Schoefer, Weber, & Yin

Empirics
Age Composition and Industry In�ation: Evidence
(1) (2) (3) (4) (5) (6)
S2A −0.0603 ∗ ∗ −0.1389∗∗∗−0.3763∗∗∗−0.3617∗∗∗−0.3680∗∗∗−0.2961∗∗∗(0.03) (0.03) (0.07) (0.07) (0.07) (0.07)
INT −0.0349 ∗ ∗ −0.0335 ∗ ∗ −0.0074
(0.02) (0.02) (0.03)
S2A × INT −0.0014 ∗ ∗ −0.0015 ∗ ∗ −0.0023 ∗ ∗(0.00) (0.00) (0.00)
SC 0.0711 −0.0083
(0.10) (0.08)
UE −0.0729 −0.0919
(0.07) (0.06)
MEM 0.0049 −0.0106
(0.02) (0.02)
Nobs 825 825 825 825 825 825
R2 0.009 0.2516 0.687 0.6935 0.6954 0.7721
Ind FE X X X X X
Period FE X X X X
Commodity Prices X
Standard errors in parentheses
∗p < 0.10, ∗ ∗ p < 0.05, ∗ ∗ ∗p < 0.01
Higher ratio of old workers negatively associated with future in�ation: S2A 1 std higher → in�ation 0.5 std lower
Especially in industries with higher labor intensity

Empirics
Age Composition and Industry In�ation: Evidence over Time
46
810
0 5 10 15 20
1975 - 1979
46
810
0 5 10 15 20
1980 - 1984
12
34
5
0 5 10 15 20
1985 - 1989
Aver
age
Annu
al In
flatio
n (%
)
Old-to-All ratio (binned)
Residualized industry in�ation and ratio of old-to-all workers negatively associated

Empirics
Age Composition and Industry In�ation: Evidence over Time
-10
12
0 5 10 15 20
1990 - 1994
-10
12
3
0 5 10 15 20
1995 - 1999
-2-1
01
0 5 10 15 20
2000 - 2004
Aver
age
Annu
al In
flatio
n (%
)
Old-to-All ratio (binned)
Residualized industry in�ation and ratio of old-to-all workers negatively associated

Empirics
Age Composition and Industry In�ation: Evidence over Time
-1.5
-1-.5
0.5
1
0 5 10 15 20
2005 - 2009
-10
12
3
0 5 10 15 20
2010 - 2014
-2-1
01
2
0 5 10 15 20
2015 - 2018
Aver
age
Annu
al In
flatio
n (%
)
Old-to-All ratio (binned)
Residualized industry in�ation and ratio of old-to-all workers negatively associated
Empirics
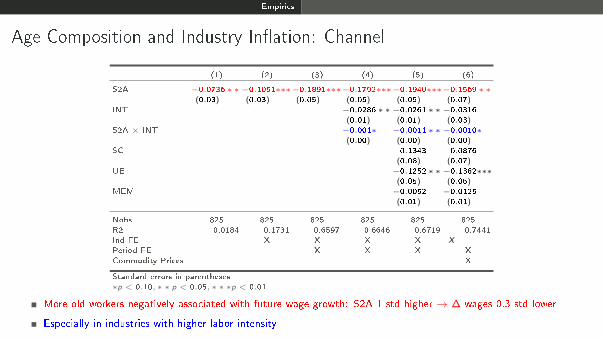
Age Composition and Industry In�ation: Channel
(1) (2) (3) (4) (5) (6)
S2A −0.0736 ∗ ∗ −0.1051∗∗∗−0.1891∗∗∗−0.1792∗∗∗−0.1940∗∗∗−0.1569 ∗ ∗(0.03) (0.03) (0.05) (0.05) (0.05) (0.07)
INT −0.0286 ∗ ∗ −0.0261 ∗ ∗ −0.0316
(0.01) (0.01) (0.03)
S2A × INT −0.001∗ −0.0011 ∗ ∗ −0.0010∗(0.00) (0.00) (0.00)
SC 0.1343 0.0876
(0.08) (0.07)
UE −0.1252 ∗ ∗ −0.1382∗∗∗(0.05) (0.05)
MEM −0.0052 −0.0125
(0.01) (0.01)
Nobs 825 825 825 825 825 825
R2 0.0184 0.1731 0.6597 0.6646 0.6719 0.7441
Ind FE X X X X X
Period FE X X X X
Commodity Prices X
Standard errors in parentheses
∗p < 0.10, ∗ ∗ p < 0.05, ∗ ∗ ∗p < 0.01
More old workers negatively associated with future wage growth: S2A 1 std higher → ∆ wages 0.3 std lower
Especially in industries with higher labor intensity

Empirics
Industry Concentration and Price Setting
Growing industry concentration over time
Lower pass-through of shocks in more concentrated industries?
Evidence from AC Nielsen retail scanner data

Empirics
Industry Concentration and Price Setting: De�nitions
Market: identify products that are substitutable within market
Baseline: designated market area (DMA) × product module
Examples:
DMA: SF-Oakland-San Jose
Module: Candy-Chocolate
Use �rst 6 digits of UPC to proxy for �rms
Concentration measures: Her�ndahl-Hirschman Index (HHI) and �leave-out version�
HHIS ,t =∑
i(t)∈M(t)
(Salei ,t∑
i(t)∈M(t) Salei ,t
)2

Empirics
Concentration Trends in Retail
.6.6
2.6
4.6
6W
eigh
ted
Aver
age
Top
3 Sh
are
.2.2
1.2
2.2
3.2
4
Wei
ghte
d Av
erag
e H
HI
2006 2008 2010 2012 2014 2016
Weighted Average HHI (Left)Weighted Average Top 3 Share (Right)
Firm is defined as 6 digit UPC; indices are averaged across modules.
National Level Grocery Concentration
.27
.28
.29
.3.3
1
Wei
ghte
d Av
erag
e H
HI
2006 2008 2010 2012 2014 2016
Weighted Average HHI (Module*DMA*Chain)Firm is defined as 6 digit UPC; indices are averaged across modules.
Decreasing concentration in retail over time
Robust feature across measures and market de�nition

Empirics
Concentration and Price Setting: Evidence
LogPM,t = α+ βHHiM,t + γFEM,t + εM,t
(1) (2) (3) (4) (5) (6)
HHI −0.056 ∗ ∗∗ −0.056 ∗ ∗∗ −0.058 ∗ ∗∗ −0.058 −0.056 ∗ ∗∗ −0.056 ∗ ∗∗(0.02) (0.01) (0.02) (0.04) (0.02) (0.02)
× DMA × DMA × Chain × Chain
FE Firm × Year Firm × Year Firm × Year Firm × Year Firm × Year Firm × Year
Cluster Firm DMA × Chain Firm DMA × Chain Firm DMA × Chain
Nobs 16,816,747 16,816,747 12,620,216 12,620,216 16,346,276 16,346,276
Standard errors in parentheses
∗p < 0.10, ∗ ∗ p < 0.05, ∗ ∗ ∗p < 0.01
Focus on main product for each �rm by sales for practical purposes
Lower prices in more concentrated markets
Holds across de�nitions for concentration and in changes
Need better understanding of IO of retail sector

Empirics
In�ation Expectations
New Keynesian Philipps Curve: in�ation = f(in�ation expectations)
πt = β Et πt+1 +(1− θ)(1− θβ)
θm̂c rt
Low in�ation because low in�ation expectations?
How do households form in�ation expectations?
Did households revise expectations upward with forward guidance?

Empirics
Shopping Experiences and In�ation Expectations
Central Banks typically focus on core in�ation
Gas and food prices volatile
Trips to grocery store frequent price experience
Well-known �fact�: women higher in�ation perception than men
Do households extrapolate from salient price changes to overall in�ation?
D'Acunto, Malmendier, Ospina, Weber (2018):
Large Salient Price Changes, In�ation Expectations, and Household Behavior

Empirics
Shopping Experiences and In�ation Expectations: Evidence
From gender e�ect to �grocery e�ect�. LHS: perceived in�ation
All All Women Men
Male −1.32∗∗∗ −0.46(0.18) (0.32)
Makes Groceries 1.64∗∗∗ 3.89∗∗∗ 4.89∗∗∗(0.32) (0.60) (1.06)
Household FE X X
Nobs 25,595 25,595 17,246 8,349
Adjusted R2 0.95 0.95 0.99 0.99
Run customized survey on AC Nielsen panel: identify main grocery shopper within household
Grocery shopping drives gender e�ect
Households extrapolate from shopping experience to overall in�ation and act on in�ation expectations

Empirics
Cognitive Abilities and In�ation Expectations
�[We assume] Unrealistic cognitive abilities of decision makers�Woodford (2018)
Many policies complex and di�cult to understand
Large XS heterogeneity in cognitive abilities + complex policies
(How much) Does limited cognition matter for policy e�ectiveness?
Main empirical hurdles
Need to measure cognitive abilities for a representative sample
Need to measure impact on policy e�ectiveness
D'Acunto, Hoang, Paloviita, Weber (2018):
Human Frictions to the Transmission of Economic Policy

Empirics
Mean Absolute Forecast Error by IQ
22.
53
3.5
44.
55
Mea
n Ab
solu
te F
orec
ast E
rror
0 2 4 6 8 10Normalized IQ
Absolute forecast errors twice as large for low IQ men than for high IQ men
Monotonic relationship btw absolute forecast error and IQ

Empirics
Euler Equations: Good Time to Purchase Durables
Marginal E�ects:∂P(y = t|x)
∂x= P(y = t|x)
βtx − ∑z=0,1,2
P(y = z|x)βzx
Men high IQ Men low IQ
(1) (2)
In�ation expectation 0.0358∗∗∗ −0.0096(0.0119) (0.0138)
Demographics X X
Pseudo R2 0.0108 0.0091
Nobs 16,606 16,256
Standard errors in parentheses
∗p < 0.10, ∗ ∗ p < 0.05, ∗ ∗ ∗p < 0.01
Strong positive assocation for men with high IQ: if expect higher in�ation, 4% more likely to purchase durables
No assocation for men with low IQ

Empirics
ECB Deposit Facility Rate: Beginning of Quarter
12
34
Dep
osit
Faci
lity
Rat
e
2.4
2.6
2.8
33.
2
01jan2001 01jul2002 01jan2004 01jul2005 01jan2007
Until end of 2001: rate falls from 3.75% to 2.25%
Trough of 1% in June 2003
December 2005 rates start to increase; 2.5% end of 2006

Empirics
Propensity to take out Loan: High IQ
12
34
Dep
osit
Faci
lity
Rat
e
2.4
2.6
2.8
33.
2Av
erag
e Pr
open
sity
Loa
n
01jan2001 01jul2002 01jan2004 01jul2005 01jan2007
Early 2001: average propensity to take out loans is about 2.5
2001-2003: rates fall and propensities increase to more than 3
Until mid-2005: rates and propensities �at
2005-2007: rates increase, propensities fall

Empirics
Propensity to take out Loan: Low IQ
12
34
Dep
osit
Faci
lity
Rat
e
2.4
2.6
2.8
33.
2Av
erag
e Pr
open
sity
Loa
n
01jan2001 01jul2002 01jan2004 01jul2005 01jan2007
Early 2001: average propensity to take out loans of around 2.6
2011-2007: propensities �at, hover around 2.8

Conclusion
Conclusion
In�ation might have been historically low in last 10 years
Aging societies possibly play a role
Little evidence for increasing competition in retail
Shopping experiences matter
Complexity of policies crucial: human frictions
Role for policy salience, policy communication, and education