Embed Size (px)
Citation preview

Measuring Energy Access
Progress and challenges in
implementing the Multi-Tier
Framework

Progress to date

SE4ALL Goals
• By 2030, ensure universal access to modern energy services.
SDG 7
• Target 7.1: 2030, ensure universal access to affordable, reliable and modern energy services
COP 21 • Post-COP 21 – Focus on Sustainable Energy
The Universal Access Goal now Firmly Set

GTF 2013
RISE 2014
GTF 2015
MTF 2015
….
SE4ALL Knowledge Hub
SEAR (2016)
Energy Access
Financing
(2017)h
Defining Access as a Continuum of Service Levels

The MTF redefines energy
access as a continuum of
service levels, based on key
attributes
Energy access has been
measured using binary
indicators
60%
40%
No Access Access
But what does
it mean to
have “access”?
How is Access Typically Measured?
0%
20%
40%
60%
80%
Tier 0(no
access)
Tier 1 Tier 2 Tier 3 Tier 4 Tier 5

Multi-Tier Framework for Electricity
Multi-Tier Framework for Electricity
Tier 0 Tier 1 Tier 2 Tier 3 Tier 4 Tier 5
Capacity Capacity (from 3W to above 2kW) and ability to power appliances (applicable for off-grid
solutions)
Duration - day From at least 4 hours a day to over 23 hours a day
Duration -
evening
From at least 1 hour in the evening to over 4 hours
Reliability Number and duration of outages
(applicable for Tier 4 & 5 only)
Quality Voltage problems do not affect the
use of desired appliances (Tier 4&5)
Affordability Basic service less than 5% of a household income
(Tiers 3-5)
Legality Service provided legally (Tier 4&5)
Health and
Safety
Absence of accidents (Tier 4&5)
Moving up the tiers

Multi-Tier Framework for Cooking
Multi-Tier Framework for Cooking
Tier 0 Tier 1 Tier 2 Tier 3 Tier 4 Tier 5
Indoor air quality Concentration of PM2.5 and CO; tiers aligned with WHO guidelines
Efficiency Tier benchmarks under development, awaiting results of ISO process
Convenience Stove preparation time and fuel collection and preparation (applicable
from Tier 2 on)
Safety Absence of accidents and alignment with the ISO process (from Tier 2 on)
Affordability Levelized cost of cooking solution < 5% of
household income
Quality and
availability of fuel
Cooking not affected by seasonal
variations in fuel quality and

MTF provides more information about households with access, allowing for a differentiation of service levels
MTF has a minimum quality and quantity requirements for a “connection” to count as access (e.g. at least 4 hours of daily supply to count as Tier 1)
MTF measures and allows an aggregation of households with access served by different technologies – e.g. grid and off-grid (comparing apples with apples)
Benefits of Multi-Tier Energy Access Results
Project
Results
Country
progress

Conceptualization and piloting
2011 2012 2013 2014 2015 2016 2017
Application
Support from more than 20 agencies in conceptualization
PILOTS:
• Aug.-Sep. 2013: Kinshasa, DRC.
• Oct.-Dec. 2013: Uganda
• May 2015: Bihar, India.
• Dec 2015: Malawi
Jun.-Dec. 2015: MTF survey
in Guinea (3,000 HH)
Apr. 2016: Launch of MTF
Global energy access survey
in 15 countries.
: This is where we are
The UN General Assembly declares
“International Year of Sustainable Energy for All.” SDG 7: “Ensure access to affordable, reliable,
sustainable and modern energy for all”
UN General Assembly declares
“Decade of Sustainable
Energy for All” 2014-2024
Applying MTF – Where Are We?
We are here

MTF Energy Global Survey
Estimated time: 90 minutes
Nationally statistically representative Rural/Urban
Provides data for multi-tier Supply and Demand information – households and community
module
Implemented by a local survey firm supervised by WB team
Need to collaborate with National Statistical Office
MTF Energy module – integrated in National Surveys*
Estimated time: 15 mins
TA and training available and funded by SREP/ESMAP
Key supply and demand information allowing tier calculation
Additional simplification of monitoring being tested – e.g. use of cell phone surveys
Need to collaborate with National Statistical Office
* Collaboration with the World Bank survey group
MTF Implementation Plan: Survey Tools

Country baselines (at least 20 low access countries)
Ongoing:
Kenya, Rwanda,
Honduras
In procurement
Ethiopia, Liberia, Niger,
Bangladesh, Myanmar
Upcoming
Uganda, Nigeria, DRC,
Zambia, India,
Cambodia, Nepal, Haiti
Second wave

• SOURCE: including mini-grid, off-grid solution and solar lantern
• SUPPLY CHARACTERISTICS: duration, reliability, quality, affordability, legality, health and safety
• DEMAND CHARACTERISTICS: Use of appliances, energy expenditures, affordability of services
HOUSEHOLD ELECTRICITY ASSESSMENT
• SOURCE: Combination of fuel/cookstove for up to 5 cookstoves
• SUPPLY CHARACTERISTICS: information on the fuels and physical characteristics of the cookstove (efficiency, convenience…)
• Information on cooking location to determine air pollution
• DEMAND CHARACTERISTICS: Cooking expenditures, affordability
HOUSEHOLD COOKING ASSESSMENT
• Gender disaggregation
• Use of time by gender (collecting fuel, cooking etc)
GENDER ASPECTS
• Electricity and cooking aspects evaluated by poverty quintile
• Impacts of access on quality of life in the household
POVERTY AND IMPACTS
What Information will the Surveys Provide?
1
4
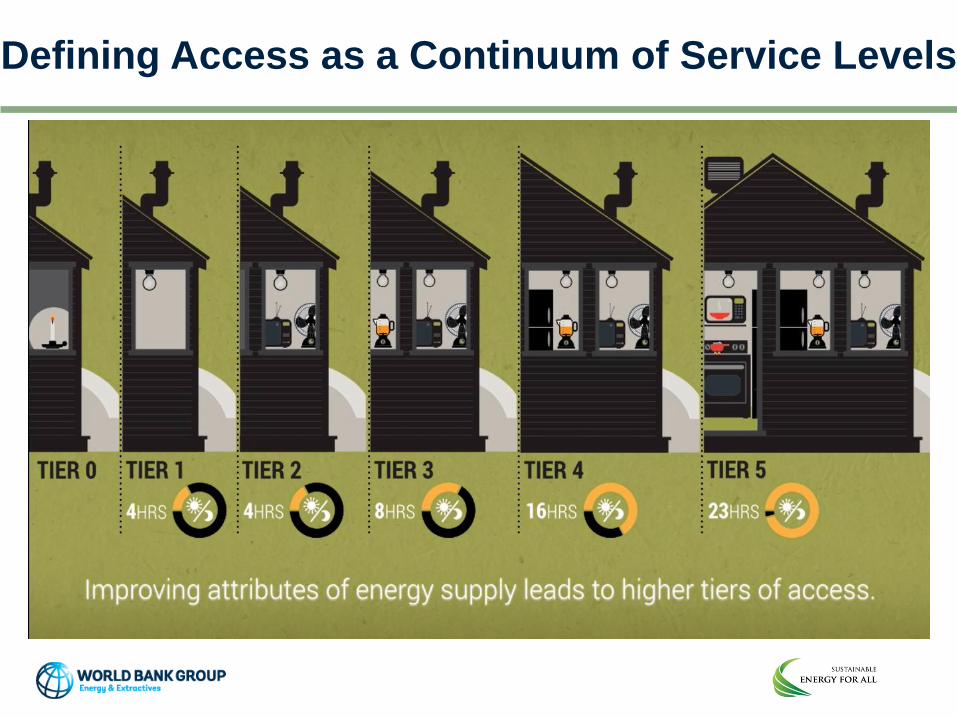
MTF survey: Gap Analysis (Guinea example)
Gap analysis at Glance:
9% of household with connection is in tier 0 due to the low duration in supply during day time (5%) or evening time (4%)
18% of household with connection is in tier 2 due to the low duration in supply during day time. 3 % of household is in tier 2 due to technology gap (system with low capacity)
50%
0% 3% 1% 0%
4%
2%
8%
1%
5%
18%
3% 0%
2%
1% 0% 0%
0%
TIER-0 TIER-1 TIER-2 TIER-3 TIER-4 TIER-5
Reliability
Health & Safety
Legality
Quality
Affordability
Daytime duration
Evening duration
Technology

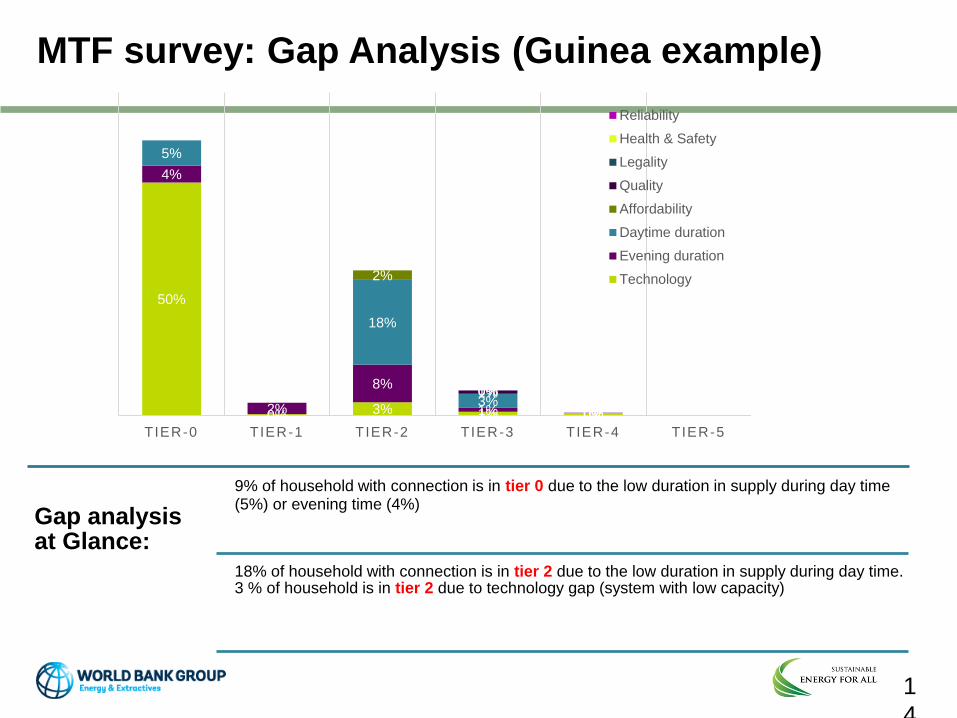
Challenges and next steps
FINAL
DIAGNOSTIC REPORT
Survey roll out
Recruitment and Training
of Survey Staff
Hiring Survey Firms
Get in contact with
NSO
Agree with Government
s on MTF survey
6-8 Months
Data collection
• Long process to ensure Government buy-in

Conceptual: framework adjustments and
simplification
• E.g. electricity reliability and affordability – are we measuring them
correctly
• Are tier thresholds set on the right levels? Multi-Tier Framework for Electricity
Tier 0 Tier 1 Tier 2 Tier 3 Tier 4 Tier 5
Capacity Capacity (from 3W to above 2kW) and ability to power appliances (applicable for off-grid
solutions)
Duration - day From at least 4 hours a day to over 23 hours a day
Duration -
evening
From at least 1 hour in the evening to over 4 hours
Reliability Number and duration of outages
(applicable for Tier 4 & 5 only)
Quality Voltage problems do not affect the
use of desired appliances (Tier 4&5)
Affordability Basic service less than 5% of a household income
(Tiers 3-5)
Legality Service provided legally (Tier 4&5)
Health and
Safety
Absence of accidents (Tier 4&5)
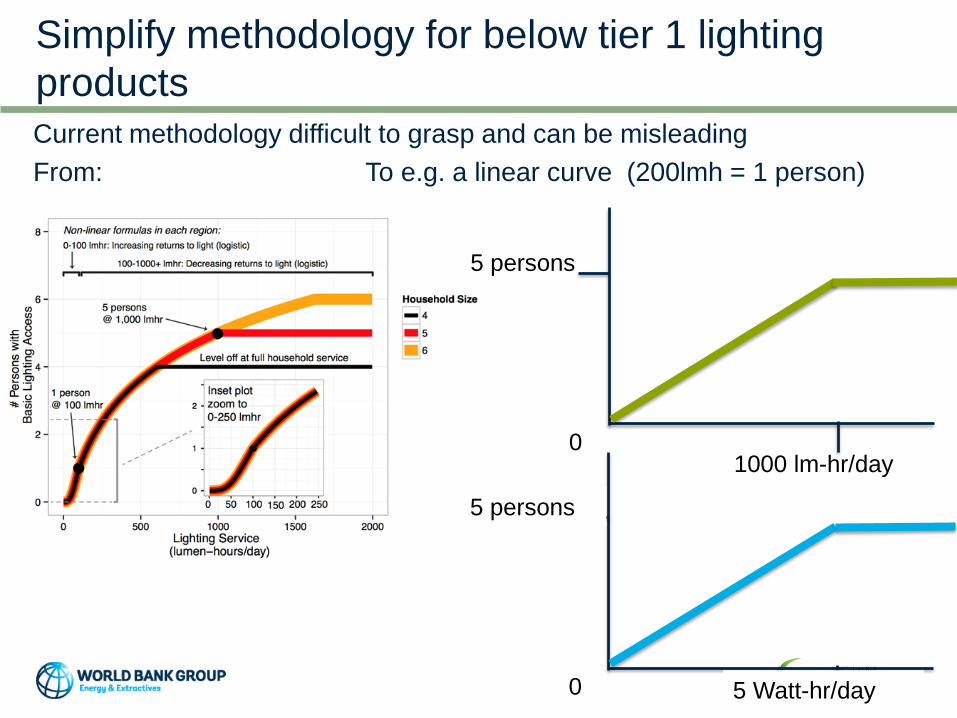
Simplify methodology for below tier 1 lighting
products Current methodology difficult to grasp and can be misleading
From: To e.g. a linear curve (200lmh = 1 person)
5 persons
0 1000 lm-hr/day
5 persons
0 5 Watt-hr/day

Defining indoor air quality and efficiency tier
thresholds
Multi-Tier Framework for Cooking
Tier 0 Tier 1 Tier 2 Tier 3 Tier 4 Tier 5
Indoor air quality Concentration of PM2.5 and CO; tiers aligned with WHO guidelines
Efficiency Tier benchmarks under development, awaiting results of ISO process
Convenience Stove preparation time and fuel collection and preparation (applicable
from Tier 2 on)
Safety Absence of accidents and alignment with the ISO process (from Tier 2 on)
Affordability Levelized cost of cooking solution < 5% of
household income
Quality and
availability of fuel
Cooking not affected by seasonal
variations in fuel quality and

Estimated tier impact of access projects/programs
• Relatively easy if technology known and tested Off-grid and
cooking
• Easy once tier distribution in the country/project area known (MTF survey)
Grid connections
• Adapt current “inferred access” methodology – tiers based on MTF survey results
• Estimate improved access based on the MTF surveys (e.g. from Tier 1 to Tier 3)
• Estimate tier distribution based on available sector statistics (where MTF surveys are not available)
Upstream investment

Thank you!
For more information on the report:
https://www.esmap.org/node/55526
Contacts:
Dana Rysankova [email protected]
Elisa Portale [email protected]