Embed Size (px)
Citation preview

Measuring Progress Toward Universal Access to Water and Sanitation in California
Defining Goals Indicators and Performance Measures
Laura Feinstein
September 2018PACIFICINSTITUTE
Measuring Progress Toward Universal Access to Water and Sanitation in California Defining Goals Indicators and Performance Measures
September 2018
Author
Laura Feinstein
ISBN 978-1-893790-83-4copy 2018 Pacific Institute All rights reserved
Cover Photo Source J Carl Ganter Circle of Blue | Designer Bryan Kring Kring Design Studio
PACIFICINSTITUTE
Pacific Institute 654 13th Street Preservation ParkOakland California 946125102511600 | infopacinstorgwwwpacinstorg
Measuring Progress Toward Universal Access to Water and Sanitation in California I
AboUT The PACIfIC InSTITUTe
The Pacific Institute envisions a world in which society the economy and the environment have the water they need to thrive now and in the future In pursuit of this vision the Institute creates and advances solutions to the worldrsquos most pressing water challenges such as unsustainable water management and use climate change environmental degradation food fiber and energy production for a growing population and basic lack of access to freshwater and sanitation Since 1987 the Pacific Institute has cut across traditional areas of study and actively collaborated with a diverse set of stakeholders including policymakers scientists corporate leaders international organizations such as the United Nations advocacy groups and local communities This interdisciplinary and nonpartisan approach helps bring diverse interests together to forge effective real-world solutions More information about the Institute and our staff directors and funders can be found at wwwpacinstorg
AboUT The AUThor
Laura Feinstein
Laura Feinstein joined Pacific Institute in 2016 as a Senior Researcher Laura conducts research on aquatic ecosystems the water-energy nexus and environmental health and justice Prior to joining the Pacific Institute she was a research scientist and project manager with the California Council on Science and Technology She also served as a Science and Technology Policy Fellow with the California Senate Committee on Environmental Quality and was a California Delta Science Fellow Laura holds a bachelorrsquos degree in Anthropology from the University of California Berkeley and a doctorate in Ecology from the University of California Davis
ACknoWleDGMenTS
This work was supported by a generous grant from the Conrad N Hilton Foundation
Sarah Diringer and Rapichan Phurisamban of Pacific Institute provided technical support on calculating water use for indoor needs Heather Cooley also at Pacific Institute provided extensive editorial input
A number of peer reviewers provided comments that greatly improved this work Kena Cador and Angeacutelica Salceda of the American Civil Liberties Union Foundation of Northern California Peter Gleick of Pacific Institute Gregory Pierce of Luskin Center for Innovation at UCLA Carolina Balazs of the Office of Environmental Health Hazard Assessment Jessica Goddard of UC Berkeley Max Gomberg and Elizabeth Haven of the California State Water Resources Control Board and Larry Levine of Natural Resources Defense Council Tedde Simon of the American Civil Liberties Union Foundation of Northern California interviewed and wrote the profiles of community members Maricela Alatorre and Horacio Amezquita generously shared their personal experiences of living in communities without safe water Brendan McLaughlin copy edited the report while Rebecca Olson helped guide it through its final stages
Measuring Progress Toward Universal Access to Water and Sanitation in California II
exeCUTIve SUMMAry
Most people in California take for granted the water and sanitation in their homes They turn the tap and clean
relatively inexpensive abundant water flows out They flush the toilet and waste vanishes
Yet there are communities in California who do not have these basic necessities in their homes In January 2018 over half a million Californians were served by water utilities that were out of compliance with the Safe Drinking Water Act (SDWA) The worst outbreak of Hepatitis A in recent memory occurred in 2016-2018 due to open defecation and lack of handwashing facilities for persons experiencing homelessness Californiarsquos tribes continue to face problems of poor housing and water and sanitation service with two-thirds of tribal communities reporting inadequate home plumbing in 20151 And the cost of water has increased for many particularly among small and medium size systems with 39 community water systems in the state charging more than $100 a month for 12 CCF of water 2
In response to the problem California enacted the Human Right to Water in 2012 declaring that ldquoEvery human being has the right to safe
1 California Department of Housing and Community Development Rural Community Assistance Corporation and California Coalition for Rural Housing ldquoTribal Housing Studyrdquo in press
2 CA Water Board ldquoWater System Electronic Annual Reportsrdquo 2015
clean affordable and accessible water adequate for human consumption cooking and sanitary purposesrdquo
The California State Water Resources Control Board (State Water Board) further recognized the need to address water and sanitation for disadvantaged communities when it adopted a resolution directing staff to ldquodevelop performance measures for the evaluation of the boardrsquos progress towards the realization of the human right to water evaluate that progress and explore ways to
Source J Carl Ganter Circle of Blue
Vicente Tapia filling buckets of water to bring home when his well ran dry during the 2012-2017 drought
Measuring Progress Toward Universal Access to Water and Sanitation in California III
This report offers a unified framework on how to measure progress toward universal access to water and sanitation in California Tables ES-1 and ES-2 provide an overview of goals and qualitative service indicators while quantitative performance measures can be found in the body of the report These service ladders offer a checklist of the numerous and disparate components of a
make that information more readily available to the publicrdquo and to ldquowork withhellip stakeholders to develop new or enhance existing systems to collect the data needed to identify and track communities that do not have or are at risk of not having safe clean affordable and accessible water adequate for human consumption cooking and sanitary purposesrdquo
Table ES-1
Overview of Drinking Water Service Ladder for California ndash Goals and Service Indicators
Safe Affordable Accessible
Goal Chemicals regulated by state and federal SDWA standards should be consistently below levels that pose a significant risk to health
Cost of essential water and sanitation should be inexpensive enough that cost does not prevent access nor interfere with other essential expenditures
Water should be available in the home in sufficient volumes to meet domestic needs at hot and cold temperatures at the times needed
Satisfactory Water has met state and federal SDWA standards for Public Water Systems for the past three years
Household can afford safe accessible water without facing tradeoffs with other essential expenditures
Sufficient hot and cold indoor piped water reliably available 24 hours a day
Moderate Water has met state and federal SDWA standards for Public Water Systems for the vast majority of time in the past three years
Sufficient hot and cold water from an improved source available on premises (indoors or outside) and reliably available 24 hours a day bottled or delivered water acceptable in some circumstances
Marginal Water meets standards set by US Food and Drug Administration is treated by Point of UseEntry filter that meets California Title 22 regulations or meets voluntary domestic well guidelines
Household ocassionally cannot afford safe accessible water without facing tradeoffs with other essential expenditures
Sufficient water from an improved source including bottled water or tanks of water delivered by truck provided collection time is not more than 30 minutes round-trip (including waiting time) and reliably available at least 12 hours a day
Unacceptable Drinking water quality that is not regularly tested and verified as meeting at least the Marginal standard for safety
Household regularly cannot afford safe accessible water without facing tradeoffs with other essential expenditures
Water that does not meet at least the Marginal standards for access
Notes Drinking water refers to water for indoor domestic purposes consumption cooking cleaning laundry personal hygiene and sanitation (operating a toilet) It does not include the treatment and disposal of wastewater which is covered in the sanitation service ladder Improved sources of water are piped running water protected wells protected springs and rainwater Discretionary income is income minus all essential expenses but water housing health care food energy child care essential transportation and taxes SDWA - Safe Drinking Water Act
Serv
ice
Indic
ato
r
Measuring Progress Toward Universal Access to Water and Sanitation in California IV
point rather than a template for their work there are general principles that can be used as guidelines for any attempt to measure water and sanitation in the state Below we make a series of recommendations on how to improve our understanding of water and sanitation service in California and use that knowledge to improve the quality of service
fully-developed approach to tracking adequate water and sanitation service at the household and individual level
The service ladders are themselves sets of recommendations for goals indicators and performance measures for the state to adopt Even for those who only use this report as a starting
Table ES-2
Service Ladder for Adequate Sanitation in California ndash Overview of Goals and Service Indicators
Safe Affordable Accessible
Goal A sanitation system should separate waste from human contact until it can be safely treated and released to the environment or reused
Sanitation should be inexpensive enough that cost does not prevent access nor interfere with other essential expenditures
Toilets should be private located in the home safe to visit and available when needed
Satisfactory Flush toilet connected to a system that hygienically separates waste from human contact where waste is safely disposed of on-site or transported and treated off-site
Household can afford safe accessible sanitation without facing tradeoffs with other essential expenditures
Private secure well-maintained in-home facility not shared with other households available 24 hours a day
Moderate An improved facility that hygienically separates waste from human contact where waste is safely disposed of on-site or transported and treated off-site
Private secure well-maintained on-site facility possibly shared with other households available 24 hours a day
Marginal An improved facility that hygienically separates waste from human contact
Household ocassionally cannot afford safe accessible sanitation without facing tradeoffs with other essential expenditures
Private secure well-maintained facility possibly shared with other households no more than 50 meters from home available 24 hours a day
Unacceptable Use of unimproved facilities or open defecation
Household regularly cannot afford safe accessible sanitation without facing tradeoffs with other essential expenditures
Facility is more than 50 meters from home not available 24 hours a day or use of the facility compromises personal safety or privacy
Notes Sanitation refers to the physical structure of a toilet and the infrastructure and management for safe disposal of human waste and wastewater Improved sanitation facilities refer to equipment that hygienically separates waste from human contact such as flush toilets pit latrines and composting toilets
Serv
ice
Indic
ato
r
Measuring Progress Toward Universal Access to Water and Sanitation in California V
the State Water Boardrsquos resolution directing staff to develop goals and performance measures as part of its Human Right to Water Portal and the Office of Environmental Health Hazard Assessmentrsquos evaluation of the status of the Human Right to Water are all valuable efforts Each will be more useful if they are merged into a unified framework that is employed by all stakeholders in California The Governor should convene the appropriate cabinet secretaries to identify the lead responsible agency for assessing water and sanitation service
bullUse a unified set of water and sanitation performance measures to direct funds and resources to the most pressing problems The current approach to allocating funds to disadvantaged communities relies on local actors applying for resources it is unknown to what degree needs go unmet because local entities do not have the capacity to seek assistance Measuring a set of drinking water and sanitation performance measures regularly would yield detailed information on the number location and characteristics of those households with the greatest need for improved water and sanitation services Funds to address drinking water and sanitation problems such as the proposed Safe and Affordable Drinking Water Fund (SB 623 Monning) should use performance measure results to identify and reach out to communities that are likely eligible for assistance
recommendations on the Scope and Scale of Water and Sanitation Service Metrics
bullShift from using performance of centralized water and sanitation systems as exclusive proxies for the quality of service to also tally households and individuals that are not
recommendations on Metrics
bullSafe Water When tracking compliance with the California Safe Drinking Water Act consider duration and frequency of time out of compliance in a given time period
bull Affordable Water and Sanitation Consider water wastewater and the costs of basic non-water needs when calculating affordability and consider both regional- and household-scale metrics
bullAccessible Water Consider facets of location volume and availability over short and long time scales (ie both running 24 hours a day and resilient to drought and climate change) Update common assumptions about volumes of water used indoors to reflect declining use in California and recognize that this trend will continue as appliances and fixtures are replaced
bullSafe Sanitation Consider both the adequacy of the toilet facility as constructed and the functioning of the sanitary system which should include a centralized or on-site wastewater system that adequately treats and disposes of or recycles human waste
bullAccessible Sanitation Consider proximity privacy security cleanliness and maintenance If the toilet is shared consider whether the number of people using the toilet is below reasonable limits
recommendations on Developing a Unified Set of Metrics to Inform Policy
bullAdopt a single consistent set of indicators and performance measures and designate a single entity entrusted with regularly assessing those metrics Efforts by the California Department of Water Resources to develop sustainable water management indicators as part of the California Water Plan
Measuring Progress Toward Universal Access to Water and Sanitation in California VI
this publication does not address institutional settings this is a clear next step for further investigation
recommendations on remedying key Data Gaps
bull Investigate quality of water delivered by Very Small Systems ie domestic wells Mapping these problems requires understanding the quality of source water as well as the treatment of the water by the well operator If the state begins to offer more financial support for domestic well owners to test and treat their water the program may yield useful data
bull Identify Public Water Systems that persistently fail to deliver water that meets Safe Drinking Water Act standards In their present format it is difficult to use the Safe Drinking Water Information System and the Human Right to Water Portal to distinguish temporary one-time violations of the Safe Drinking Water Act from long-term problems
bullMeasure how many Californians face trade-offs between paying their water bill and other necessary expenses and how often that trade-off results in long-term debt accumulation or service disconnections A regional-scale understanding of households likely to have difficulty paying their water bill can be gleaned from datasets on cost of living household income and local water rates though the data on water rates are not complete There is relatively little information however on the number of households who face difficulty paying their water bill and almost none on whether difficulties in paying water bills results in long-term debt accumulation or service disconnections
adequately served by large institutions The Human Right to Water implies the importance of considering water and sanitation for every person Yet for many indicators the best or only data available are collected at regional scales ndash often the Public Water System or centralized wastewater system While most people are served by these systems many of the people without adequate water and sanitation are not These are small disadvantaged and remote rural communities outside of service area boundaries or persons within service area boundaries that are not connected to centralized systems have an on-premises plumbing problem or lack shelter Regional-scale data are useful but it is important to acknowledge its limits and to supplement it with granular information at the individual and household level when available
bullRecognize sanitation as an essential component of the Human Right to Water Current statute recognizes a right to water for sanitary purposes but does not address the other components of sanitation a toilet for personal use and a system for safely treating and disposing of the waste Like safe and sufficient water sanitation is necessary to ensure human health prevent epidemics of water-borne diseases and safeguard the quality of drinking water resources Adequate water without sanitation is insufficient for meeting the overriding objective of preventing waterborne health threats from chemical contaminants and disease
bullMeasure water and sanitation services in non-residential settings Schools preschools and hospitals host high concentrations of people vulnerable to disease Ensuring the basics of clean water a functional sanitation facility and a place to wash onersquos hands are vital for the health and safety of children and the ill While
Measuring Progress Toward Universal Access to Water and Sanitation in California VII
on strategies to clean stormwater rather than prevent fecal matter from entering in the first place Regional Water Boards could alter this by placing greater emphasis on provision of public toilets to reduce fecal matter in stormwater The first step would be to systematically collect information on location usability hours of public toilets and proximity to homeless encampments
recommendations for Policy Solutions to Address failures in Drinking Water and Sanitation Service
bullUse the Eligibility for Customer Assistance Program (ECAP) metric described in ldquoAncillary Performance Indicators for Affordable Water and Sanitationrdquo to qualify households for a water affordability assistance program The ECAP metric is relatively simple to calculate aligns with other well-established social service programs enrollment thresholds and addresses disparities in cost of living around the state
bullExpand CalFresh benefits to include soap for handwashing Lack of access to soap is a persistent problem among food-insecure families California has recently experimented with expanding CalFresh assistance by providing a supplementary drinking water benefit for customers of public water systems with unsafe drinking water (California 2017-18 Budget enacted June 2017) Adding soap to CalFresh benefits would be a relatively inexpensive way to ensure that low-income children obtain access to an essential component of hygiene
We live in a time of extraordinary progress toward reducing poverty worldwide Between 1990 and 2013 the number of extremely poor people globally fell by over a billion even as the
bullCollect information on service disconnections that distinguishes between occupied and unoccupied residences Community water systems typically track service disconnections but it is not possible to distinguish between occupied households that lose service for failure to pay and unoccupied households where residences simply neglected to notify the utility when they vacated their home Yet utilities are required to notify the occupants of a home before disconnecting service and also routinely receive communications from the occupants offering multiple opportunities to record whether the unit appears to be occupied Medium and large community water systems should record when service disconnections are for units that are known to be occupied
bullCompile locally-held information on leaking septic systems or other onsite wastewater treatment systems Anecdotally community organizations working with disadvantaged communities report that they serve households with improperly maintained septic systems Information on permit violations is collected by local government entities and transmitted to the Regional Water Quality Control Boards (Regional Water Boards) The State Water Board should compile this information in a single statewide electronic database to develop a greater understanding of wastewater problems in the state
bullRegional Water Board stormwater permits should require municipalities to collect data on publicly-accessible toilets and handwashing facilities Given the well-established role of universal sanitation in preventing water pollution and disease public toilets and handwashing facilities should be regarded as a primary strategy to safeguard the quality of Californiarsquos waterways Yet resources to improve stormwater quality have focused
Measuring Progress Toward Universal Access to Water and Sanitation in California VIII
worldrsquos population grew by more than one and a half billion3 But the final steps of eradicating poverty are perennially plagued by the ldquolast mile problemrdquo the pace of progress slows as a society nears the goal of eliminating extreme poverty4
California is no exception Only a small percentage of Californiarsquos population lives without adequate water and sanitation yet progress toward eliminating these last inequities is long overdue mdash all the more so in comparison to the magnitude of the infrastructure we have constructed to transport and treat water for the vast majority of the statersquos residents But seen from another perspective the statersquos problems in ensuring universally adequate water and sanitation are surmountable We have the resources to bridge these last gaps in service With concerted effort the vision of universal water and sanitation for all Californians can be realized
3 The World Bank ldquoPoverty Overviewrdquo 4112018 Accessed January 9 2018 httpwwwworldbankorgentopicpovertyoverview
4 Chandy Laurence Hiroshi Kato and Homi Kharas ldquoThe Last Mile in Ending Extreme Povertyrdquo Brookings Institution Press July 20 2015 httpswwwbrookingsedubookthe-last-mile-in-ending-extreme-poverty
Measuring Progress Toward Universal Access to Water and Sanitation in California IX
Contentsabout the Pacific institute Iabout the author Iacknowledgments lexecutive summary llacronyms and abbreviations XIGlossary XIIintroduction 1
Motivating Questions Approach and Outcomes 5Comparing Joint Monitoring Programme Standards to California Context 7Service Ladders Defining Goals and Indicators 8Service Ladders Indicators and Performance Measures 11Sanitation Indicators and Performance Measures 35
Conclusions and recommendations 44references 48appendices (Online) 56
BOXeS
Box 1 The Human Right to Water in Disadvantaged Communities Interview With
Horacio Amezquita General Manager San Jerardo Cooperativa 4
Box 2 What About Hygiene 11
Box 3 Living Without Safe Water Interview With Maricela Mares-Alatorre Community Organizer Kettleman City 15
Box 4 Shared Toilets Context and Controversies 41
FIGureS
Figure 1 Joint Monitoring Programme (JMP) Service Ladders on Water Sanitation and Hygiene 3
Figure 2 Structure of Water and Sanitation Service Ladders 6
TABLeS
Table ES-1 Overview of Drinking Water Service Ladder for California ndash Goals and Service Indicators III
Table ES-2 Service Ladder for Adequate Sanitation in California ndash Overview of Goals and Service Indicators IV
Table 1 Overview of Drinking Water Service Ladder for California ndash Goals and Service Indicators 9
Table 2 Service Ladder for Adequate Sanitation in California ndash Overview of Goals and Service Indicators 10
Measuring Progress Toward Universal Access to Water and Sanitation in California X
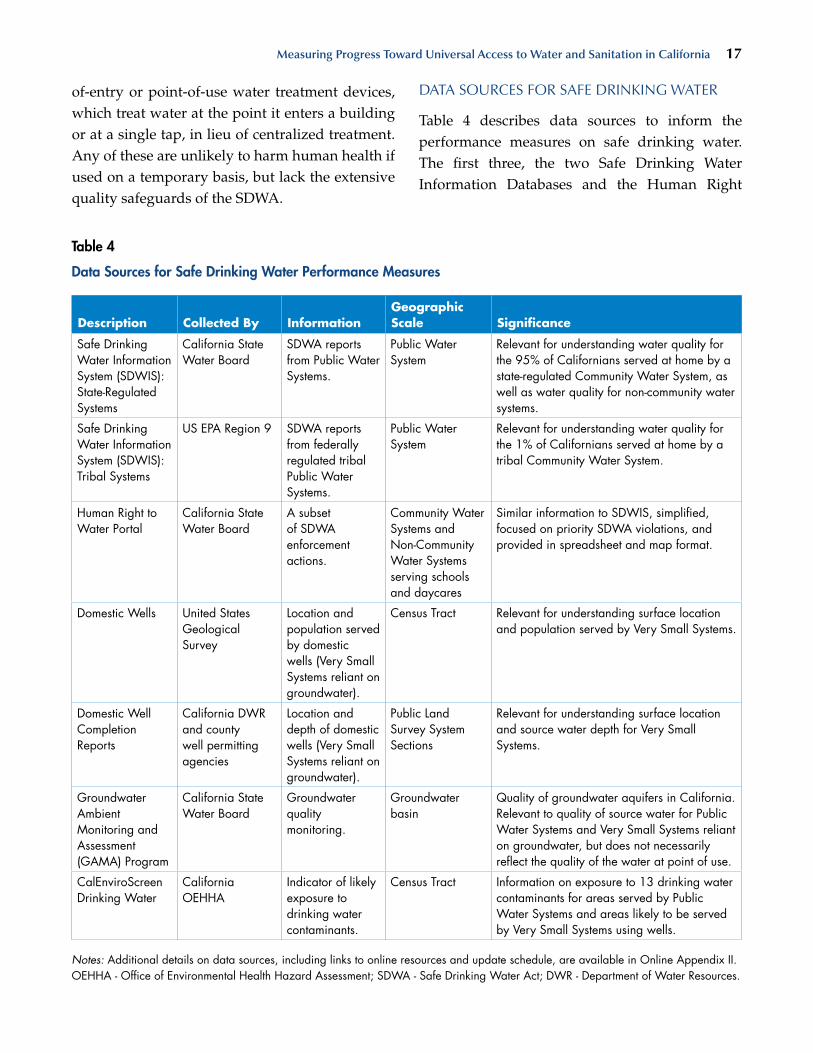
Table 3 Service Indicators and Performance Measures for Safe Drinking Water in California 16
Table 4 Data Sources for Safe Drinking Water Performance Measures 17
Table 5 ldquoAffordablerdquo Drinking Water Bills According to Three Metrics for Three Representative Counties 22
Table 6 Household-Level Service Indicators and Performance Measures for
Affordable Drinking Water and Sanitation in California 24
Table 7 System-Level Service Indicators and Performance Measures for
Affordable Drinking Water and Sanitation in California 25
Table 8 Data Sources for Affordable Water and Sanitation Performance Measures 26
Table 9 ldquoAffordablerdquo Drinking Water Bills According to Three Metrics for Three Representative Counties 31
Table 10 Service Indicators and Performance Measures for Accessible Drinking Water in California 31
Table 11 Data Sources for Accessible Drinking Water Performance Measures 34
Table 12 Service Indicators and Performance Measures for Safe Sanitation in California 37
Table 13 Data Sources for Safe Sanitation Performance Measures 39
Table 14 Service Indicators and Performance Measures for Accessible Sanitation in California 42
Table 15 Data Sources for Accessible Sanitation Performance Measures 43
Measuring Progress Toward Universal Access to Water and Sanitation in California XI
CCF ndash Centum (Hundred) Cubic Feet
CCR ndash California Code of Regulations
CFR ndash Code of Federal Regulations
DWR ndash Department of Water Resources
EIU ndash Essential Indoor Use
FPL ndash Federal Poverty Line
GPCD ndash Gallons Per Capita Day
HHS ndash Health and Human Services
HUD ndash Housing and Urban Development
JMP ndash Joint Monitoring Programme
LAMP ndash Local Area Monitoring Program
MCL ndash Maximum Contaminant Level
NPDES - National Pollutant Discharge Elimination
OEHHA ndash Office of Environmental Health Hazard Assessment
OWTS ndash Onsite Wastewater Treatment Systems
PHG ndash Public Health Goal
PWS ndash Public Water Systems
SDGs ndash Sustainable Development Goals
SDWA ndash Safe Drinking Water Act
SRO ndash Single Resident Occupancies
TT ndash Treatment Technique
UNICEF - United Nations Childrenrsquos Fund
US EPA ndash United States Environmental Protection Agency
VLI ndash Very Low Income
WASH ndash Water Sanitation and Hygiene
WHO ndash World Health Organization
ACronyMS AnD AbbrevIATIonS
Measuring Progress Toward Universal Access to Water and Sanitation in California XII
GloSSAry
key Terms in California Water Governance
Public Water Systems (PWS) ndash All domestic water suppliers large enough to be regulated under the California Safe Drinking Water Act A Public Water System serves 15 or more connections or at least 25 individuals at least 60 days out of the year (California Health and Safety Code sect116275(h)) The term encompasses both publicly-owned utilities (commonly referred to as municipal systems) and privately-owned utilities
There are three categories of Public Water Systems
bullCommunity Water Systems ndash Public Water Systems that serve at least 15 connections used by year-long residents or at least 25 year-long residents (California Health and Safety Code sect116275(i)) Tribal Water Systems are Community Water Systems that serve a federally recognized tribe and consequently are regulated by the United States Environmental Protection Agency rather than the California State Water Resources Control Board (State Water Board) Community Water Systems serve about 96 of Californians of which less than 1 receive water from a Tribal Water System (State Water Board 2013 US EPA 2016b)
bullTransient Non-Community Water Systems ndash Public Water Systems that deliver water to places where there are few or no long-term residents or consistent visitors such as parks motels and campgrounds Do not regularly serve at least 25 of the same persons over six months per year (California Health and Safety Code sect116275(o))
bullNon-Transient Non-Community Water Systems ndash Public Water Systems that deliver water to places where the same people visit regularly but do not reside there such as schools and workplaces Serve at least 25 of the same persons over six months per year (California Health and Safety Code sect116275(k)
Very Small Systems ndash All domestic water systems too small to be regulated under the Safe Drinking Water Act Serve fewer than 15 connections and 25 individuals at least 60 days out of the year Encompasses a few subcategories differentiated by size Most Very Small Systems are supplied by domestic wells although some are supplied by surface diversions Very Small Systems supply the homes for an estimated 4 of Californians (California State Water Board 2013 Johnson and Belitz 2015)
bullState Small Water Systems ndash Systems that serve 5ndash14 service connections and do not regularly serve drinking water to more than an average of 25 individuals daily for more than 60 days out of the year (California Health and Safety Code sect116275(n)) The requirements for operation of a State Small Water System are less stringent than the requirements for a Public Water System such as testing for a truncated list of potential contaminants
bullPrivate Wells (and Surface Diversions) ndash Water sources not regulated by federal or California state government agencies The category is subdivided into local systems serving 2ndash4 service connections and private water sources serving only one service connection (DWR 2014)
Measuring Progress Toward Universal Access to Water and Sanitation in California XIII
for safe disposal of human waste and wastewater It does not include the water for operations which is included in the water service ladders (see below)
Service Level ndash the safety affordability and accessibility of water or sanitation service received by a household
Service Ladder ndash a set of service levels with respect to water sanitation or hygiene with the service levels forming the ldquorungsrdquo of the ladder In this report we define two service ladders one for water and one for sanitation both with four service levels (ldquorungsrdquo)
The Four Service Levels
bullSatisfactory ndash protective of human and environmental health meets or exceeds statutory and regulatory standards Examples include water that has met Safe Drinking Water Act standards consistently for a sustained period of time indoor running water and an indoor flush toilet connected to a well-functioning treatment and disposal system
bullModerate ndash meets minimum human needs compliant with statutory and regulatory requirements most of the time and unlikely to cause long-term health or environmental harm if used on a temporary basis but would be regarded as unusual and inferior for regular at-home use by most Californians Moderate service would be regarded by most Californians as acceptable for a weekend stay at a campground but not for long-term in-home service Examples include water delivered by a system with one violation of the Safe Drinking Water Act in the past three years obtaining water from an outdoor standpipe or using a properly maintained and serviced latrine (such as a porta potty or an outhouse connected a properly maintained septic system)
Centralized Municipal Wastewater Systems ndashThe systems of pipes and treatment facilities for conveying treating and discharging domestic sewage from residential and commercial customers Municipal wastewater systems are regulated in California by the State Water Board under the Clean Water Act via the National Pollutant Discharge Elimination and Waste Discharge Requirements programs
Onsite Wastewater Treatment Systems (OWTS) ndash Individual disposal systems community collection and disposal systems and alternative collection and disposal systems that use subsurface disposal As of 2012 there were an estimated 12 million OWTS operating in California (California State Water Board 2012) A septic system is the most common type of OWTS and for readability we primarily use the term ldquoseptic systemrdquo in this report
key Terms Used in Service ladders in this report
Goals ndash a set of aspirational objectives for delivering clean affordable accessible water and sanitation to all Californians The Human Right to Water is realized through gradual and consistent progress up the levels of service provision toward the eventual goal
Water Service ndash the means by which a person obtains water for domestic purposes Based on the language of the California Human Right to Water statute we consider water in this report only for indoor domestic purposes consumption cooking cleaning laundry personal hygiene and sanitation (operating a toilet)
Sanitation Service ndash the means by which a person disposes of their excreta Sanitation refers to the physical structure of a toilet and the infrastructure
Measuring Progress Toward Universal Access to Water and Sanitation in California XIV
Adequate Water ServiceAdequate Sanitation Service ndash satisfactory service across the three dimensions of safety affordability and accessibility
Service Indicators ndash a qualitative description of a service level for each service ladder and dimension1
Performance Measures ndash an objectively quantifiable metric for clean affordable and accessible water We use the phrase based on the California State Water Resources Control Boardrsquos Resolution on the Human Right to Water which references ldquoperformance measuresrdquo as the tool to measure progress towards the realization of the Human Right to Water (California State Water Board 2016b)
Ancillary Metrics ndash metrics that complement the main service ladder by measuring the service dimension among a marginalized community or focusing on a dysfunction in service that is relatively uncommon but severe for those affected
1 There are many competing definitions for the terms ldquoservice indicatorsrdquo ldquoperformance measuresrdquo and ldquometricsrdquo in public policy both in and outside California (eg see OECD 2002 for a glossary of terms in policy evaluation) While we define and use the terms consistently in this document other documents assign distinct and equally legitimate definitions
bullMarginal ndash requires sacrifices in quality of life that most Californians would regard as unacceptable on a regular basis Examples include households that rely on bottled water because their tap water is unsafe to drink households that rely on a toilet that is near but not inside their home or households using a toilet that is not connected to a properly functioning treatment and disposal system Marginal service is clearly deficient but is nonetheless an improvement compared to unacceptable service Providing marginal service may be an appropriate recourse in short-term emergency scenarios such as delivering bottled water to homes experiencing an unexpected water shortage or providing shared outdoor toilets following a natural disaster
bullUnacceptable ndash near or complete absence of any water or sanitation service Drinking directly from unprotected surface water outdoor defecation or using pit latrines without a seat would qualify for unacceptable service
Measuring Progress Toward Universal Access to Water and Sanitation in California 1
InTroDUCTIon
Californiarsquos human right to Water in an International Context
Californiarsquos Human Right to Water passed in 2012 states that ldquoevery human being has the right to safe clean
affordable and accessible water adequate for human consumption cooking and sanitary purposesrdquo (California Water Code sect1063 Chaptered 2012) While a laudable declaration of the statersquos values the statute requires no action to reach this goal beyond requiring state agencies to ldquoconsiderrdquo the right to water when revising or establishing policy
To formalize its commitment to the Human Right to Water the California State Water Resources Control Board (State Water Board) adopted Resolution No 2016-0010 which ldquodirects State Water Board staff tohellip develop performance measures for the evaluation of the boardrsquos progress towards the realization of the Human Right to Water evaluate that progress and explore ways to make that information more readily available to the publicrdquo The resolution also ldquodirects State Water Board staff to work with relevant stakeholders to as resources allow develop new or enhance existing systems to collect the data needed to identify and track communities that do not have or are at risk of not having safe clean affordable and accessible water adequate for human consumption cooking and sanitary purposesrdquo
Californiarsquos effort to recognize define and measure progress toward realization of the Human Right to Water is part of an international movement to address the need for water sanitation and hygiene often referred to as WASH The United Nations (UN) General Assembly recognized the Human Right to Water and Sanitation in 2010 calling upon states and international organizations to ldquoprovide safe clean accessible and affordable
Source J Carl Ganter Circle of Blue
Inequities persist for Californians in water sanitation and hygiene service In this photo Belan Ruia carefully washes dishes in her Porterville home Like her neighbors her well ran dry during the 2012-2017 drought She and her husband Artemio fetched water from a nearby fire station
Measuring Progress Toward Universal Access to Water and Sanitation in California 2
While the majority of Californians enjoy water and sanitation service that meets or exceeds the highest tier of service described in the JMP service ladders there still are persistent inequities in WASH for Californians Water quality problems stem from a variety of natural sources such as arsenic and anthropogenic causes such as nitrate contamination and Trichloropropane (TCP) 123 In January 2018 520000 Californians were served by water utilities that were out of compliance with the Safe Drinking Water Act (SDWA) (State Water Board 2018a) Problems are particularly persistent in small low-income rural communities and are particularly prevalent in the Central Valley and Salinas Valley Tribal lands also grapple with poor water quality and a lack of indoor plumbing a 2012 Indian Health Services report estimated that 36000 persons on California tribal lands had insufficient or unsafe water (DWR 2014) During the 2012-2016 drought nearly 5000 households primarily reliant on private wells reported a shortage of water to their county government (Feinstein Phurisamban and Ford 2017) Meanwhile the homeless population has reached 120000 persons statewide (US Department of Housing and Urban Development 2016) The homeless population largely relies on public facilities for water and sanitation but such services are often hard to reach unclean poorly maintained or simply unavailable (Los Angeles Central Providers Collaborative 2017)
Safe relatively inexpensive indoor running water and flush toilets are taken for granted by many Californians but they are not universal The passage of Californiarsquos Human Right to Water was in response to a growing realization that persistent problems in delivery of water and sanitation persist in the state According to Horacio Amezquita general manager of a housing cooperative that had unsafe water for decades
drinking water and sanitation for allrdquo (UN General Assembly 2010) This language was echoed in the California statute with some notable differences such as the shift from the UN language on ldquosanitationrdquo to the more ambiguous and indirect phrase ldquowater forhellip sanitary purposesrdquo
As in the California statute the UN Human Right to Water is aspirational rather than prescriptive Though lacking an enforcement mechanism the Resolution on the Human Right to Water urges nations and international organizations to direct resources toward the delivery of drinking water and sanitation for all With the aim of ending global poverty the United Nations laid out seventeen Sustainable Development Goals (SDGs) which reflect and recognize human rights standards as a key component of global development The sixth SDG aims to ldquoensure availability and sustainable management of water and sanitation for allrdquo
Progress toward SDG 6 is monitored by the World Health Organization (WHO) and United Nations Childrenrsquos Fund (UNICEF) through the Joint Monitoring Programme for Water Supply Sanitation and Hygiene (JMP) Since 1990 JMP has produced regular estimates of national regional and global progress on WASH with the most recent update issued in 2017 (WHO and UNICEF 2017a) The JMP has developed service ladders to measure progress in WASH with a set of service levels making up the ldquorungsrdquo forming a ladder of gradual progression from low- to high-quality service They describe service ladders for water sanitation and hygiene For water the lowest service level is Unprotected Surface Water followed by Unimproved Limited Basic and at the top Safely Managed Service For sanitation the lowest service level is Open Defecation moving up through Unimproved Limited Basic and Safely Managed Service (Figure 1)
Measuring Progress Toward Universal Access to Water and Sanitation in California 3
Source Figure reproduced from WHO and UNICEF (WHO and UNICEF 2017a)
Figure 1
Joint Monitoring Programme (JMP) Service Ladders on Water Sanitation and Hygiene
Sanitation Services
Service Level Definition
SAFELY MANAGED
Use of improved facilities that are not shared with other households and where excreta are safely disposed of in situ or transported and treated offsite
BASIC Use of improved facilities that are not shared with other households
LIMITED Use of improved facilities shared between two or more households
UNIMPROVEDUse of pit latrines without a slab or platform hanging latrines or bucket latrines
OPEN DEFECATION
Disposal of human faeces in fields forests bushes open bodies of water beaches or other open spaces or with solid waste
Note Improved facilities include flushpour flush to piped sewer systems septic tanks or pit latrines ventilated improved pit latrines composting toilets or pit latrines with slabs
Drinking Water Services
Service Level Definition
SAFELY MANAGED
Drinking water from an improved water source that is located on premises available when needed and free from faecal and priority chemical contamination
BASIC
Drinking water from an improved source provided collection time is not more than 30 minutes for a round trip including queuing
LIMITED
Drinking water from an improved source for which collection time exceeds 30 minutes for a round trip including queuing
UNIMPROVEDDrinking water from an unprotected dug well or unprotected spring
SURFACE WATER
Drinking water directly from a river dam lake pond stream canal or irrigation canal
Note Improved sources include piped water boreholes or tubewells protected dug wells protected springs rainwater and packaged or delivered water
Hygiene
Service Level Definition
BASICAvailability of a handwashing facility on premises with soap and water
LIMITEDAvailability of a handwashing facility on premises without soap and water
NO FACILITY No handwashing facility on premises
Notes Handwashing facilities may be fixed or mobile and include a sink with tap water buckets with taps tippy-taps and jugs or basins designated for handwashing Soap includes bar soap liquid soap powder detergent and soapy water but does not include ash soil sand or other handwashing agents
Measuring Progress Toward Universal Access to Water and Sanitation in California 4
effect of the law is limited and will continue to be so unless it is linked to identifying problems and prioritizing resources
and an outspoken advocate of the Human Right to Water the lawrsquos passage was groundbreaking because it recognized the problems experienced by his community (Box 1) However the tangible
Box 1
The Human Right to Water in Disadvantaged Communities Interview With Horacio Amezquita General Manager San Jerardo Cooperativa
ldquoWith the Human Right to Water campaign it took hundreds of people making noise to get Sacramento to pay attention to us Decision makers arenrsquot impacted by these problems and county and state governments donrsquot take affected communities into account
ldquoWersquove had clean water for five years now It started back in 1990 when one by one wells were contaminated People were sick and had to spend a lot of money on bottled water No one believed us
ldquoThe Human Right to Water law was really important for me San Jerardo suffered It was a long struggle but we won
ldquoHerersquos the thing Anyone who has money and water contamination issues can solve the problem quickly Itrsquos not hard for them But when itrsquos a poor communityhellip there are still communities that have been waiting for 20 or 30 years for water
ldquoThe Right to Water in reality isnrsquot being applied equally for all people The solutions require resourcesmdashfinancial resources and people We need technical assistance and action Itrsquos not actually complicatedmdashprioritize communities with the most need This could have been solved decades ago and itrsquos only getting worse No one wants to take responsibility and itrsquos the people who pay the price
ldquoWhat is the Human Right to Water worth if communities donrsquot have clean water and polluters keep polluting As a law it should help people and the environment But if there isnrsquot a way to apply the law to enforce the law if there arenrsquot financial and human resources dedicated to making it a reality the law isnrsquot meaningful Itrsquos dormant just sitting thererdquo
Horacio Amezquita is the General Manager of the San Jerardo Cooperative in Salinas California which provides housing and community services for over 350 low-income farmworker families He has lived in the community with his family since the 1970s
Source Bree Zender KCBX Central Coast Public Radio
Horacio Amezquita of San Jerardo Cooperativa in Salinas California says that the Human Right to Water is meaningful only if it is accompanied by resources and action
Measuring Progress Toward Universal Access to Water and Sanitation in California 5
Each service ladder describes a goal with four levels of service reflecting the full range of quality observed in California To avoid confusion with JMP standards we employed different terms for service levels Satisfactory Moderate Marginal and Unacceptable Each rung is described qualitatively by a service indicator and more precisely with a quantitative performance measure Figure 2 provides a schematic to illustrate the structure of the service ladders described in this report
The service ladders for water and sanitation each have three dimensions safe affordable and accessible which can vary independently from one another For example a household with high-quality running water that is severely cost-burdened would have Satisfactory drinking water service for the safety and accessibility dimensions but only Marginal service for affordability Although California Water Code sect1063 also declares a right to ldquocleanrdquo water we do not call out ldquocleanrdquo as a separate fourth dimension of the service ladders in this report It seems equally plausible that ldquocleanrdquo is redundant with ldquosaferdquo or that it was intended to refer to the SDWArsquos voluntary secondary drinking water standards governing the aesthetics of how drinking water looks and smells We deemed an extensive discussion of the aesthetics of drinking water to be beyond the scope of this document We restrict the service ladders to aspects of water and sanitation service with a clear nexus to human health
The service ladders we describe formalize a normative framework for water and sanitation in California The ladders include goals and service indicators for water and sanitation service in California that align with statute regulation and common practice The performance measures for quantifying water and sanitation service were designed whenever possible such that they
MOtivatinG QuestiOns aPPrOaCh and OutCOMes
In this report we attempt to answer the question what would realizing the Human Right to Water in California mean in terms that are concrete measurable and socially acceptable within the context of a developed country
We modeled our approach on the service ladder framework employed by JMP as well as other international practitioners of WASH monitoring and development (WHO and UNICEF 2017a Moriarty et al 2011) This approach offers a range of service levels as a way of measuring incremental progress and providing benchmarks for appropriate service in contexts where there are insurmountable barriers to offering excellent service
Service ladders are a common approach to define norms and develop benchmarks for comparison of broad categories of service The service ladder reflects trade-offs between complex multivariate systems for evaluating the quality of water and sanitation service and the oversimplification of dividing service levels into the binary categories of ldquogoodrdquo and ldquobadrdquo service By assessing the range of variation in problems the ladder framework encourages stakeholders to consider both how to help the large population with modest problems and the relatively small population burdened by the most extreme inequities While we employed JMPrsquos service ladders as a template we modified both the content and structure as needed to reflect common expectations and legal standards relevant to California This is a common approach in the literature on developing metrics for water and sanitation Norms are not objectively determined rather they reflect communitiesrsquo values resources and political choices (Moriarty et al 2011)
Measuring Progress Toward Universal Access to Water and Sanitation in California 6
meeting the Human Right to Water implied by existing statutes regulations and societal norms
This report focuses on water and sanitation service in homes including standard housing types such as single-family and multi-family units unconventional housing such as RVs vans and boats group residences such as dormitories Single Resident Occupancies (SROs) and homeless shelters To a limited extent we address access to
can be informed by available statewide public datasets Where data are not available to inform a performance measure the missing information is identified in the accompanying ldquodata gapsrdquo section for the dimension The laddersrsquo broad classes of service levels simplify complex datasets to communicate broad patterns and identify high-priority areas for improvement to a general audience They also serve as an opportunity to articulate commonly-held but unstated goals in
Figure 2
Structure of Water and Sanitation Service Ladders
Adequate Water Service
Safe Affordable Accessible
Goal
Satisfactory
Moderate
Marginal
Unacceptable
Serv
ice
Leve
ls (
ldquorungsrdquo
)
Adequate Water Service
Service Dimensions
Service Indicators amp Performance
Measures
Adequate Sanitation Service
Safe Affordable Accessible
Goal
Satisfactory
Moderate
Marginal
Unacceptable
Serv
ice
Leve
ls (
ldquorungsrdquo
)
Adequate Sanitation Service
Service Dimensions
Service Indicators amp Performance
Measures
Measuring Progress Toward Universal Access to Water and Sanitation in California 7
for Satisfactory Moderate Marginal and Unacceptable service to be commensurate with what is found in state and federal regulations
2 Affordability is not included in JMP service ladders JMP determined that there was ldquono commonly agreed-upon way to measure affordabilityrdquo and decided to defer incorporating affordability into its service ladders in 2017 until a designated work group could develop and test metrics (WHO and UNICEF 2017a p 20) Given that affordability is one of the key components called for in the California Human Right to Water we chose to include affordability and propose a measurable index
3 ldquoImprovedrdquo water sources and sanitation facilities include infrastructure that would be considered illegal under California housing laws JMP defines safely managed water and sanitation as having access to an improved water source and sanitation facility respectively ldquoImprovedrdquo facilities while generally protective of human health do not necessarily imply indoor piped water or flush toilets which are mandatory under state
water and sanitation in public spaces as it affects those experiencing homelessness who must make use of such public facilities as their primary points of access We did not address water and sanitation outside the place of residence ie in schools workplaces or health care facilities The home is the primary place where people consume cook and clean with water and adequate service in the place of residence is of primary importance in meeting basic needs Developing service ladders for non-residences in California remains a topic for future work
COMParinG JOint MOnitOrinG PrOGraMMe standards tO CaLiFOrnia COntext
There are five ways in which JMPrsquos standards for safely managed water and sanitation diverge from what is commonly regarded as acceptable in California Usually - though not always ndash it is because the highest level of service in JMP would be below legal standards in the state or below the standards found in most California households
1 Water quality standards are much lower in JMP than is commonly considered acceptable in the United States JMP defines safely managed water as free from fecal and priority chemical contaminants arsenic and fluoride In California most households receive tap water from a Public Water System (PWS) regulated under the state and federal SDWAs which set limits on 88 contaminants as of 2017 (US EPA 2016a) Bottled water is subject to US Food and Drug Administration oversight which sets limits on nearly as many contaminants (CFR 21 2017) Under JMPrsquos definition communities affected by contaminants apart from arsenic and fluoride such as nitrate contamination in Californiarsquos Central and Salinas Valleys would be regarded as having safely managed water service We set water quality standards
Source Peeterv iStock
Poor access to water and sanitation is often found in substandard housing
Measuring Progress Toward Universal Access to Water and Sanitation in California 8
In consideration of the differences between how JMP benchmarks and measures water and sanitation service and the common standards and practices found in California we found it necessary to adapt the goals indicators and performance measures so that they are specific to California and its unique framework of statute and regulation available datasets and prevailing norms and resources
serviCe Ladders deFininG GOaLs and indiCatOrs
The Service Ladder Overviews for Water and Sanitation in California (Tables 1 and 2) present goals and service indicators for water and sanitation in California We used the language of the California Human Right to Water as the organizing framework ldquoevery human being has the right to safe clean affordable and accessible water adequate for human consumption cooking and sanitary purposesrdquo (California Water Code sect1063) Each ladder covers three dimensions of water and sanitation service safety affordability and accessibility
Water refers to water for indoor domestic purposes consumption cooking cleaning laundry personal hygiene and sanitation (operating a toilet) Sanitation refers to the physical structure of a toilet and the infrastructure and management for safe disposal of human waste and wastewater it does not include the water for operations which is measured in the water service ladders Hygiene refers to a facility for handwashing accompanied by soap In this report we address facilities for handwashing in the home as a component of access to water Soap is not included as a component of the service ladders but it is often a difficult-to-acquire staple for families who are struggling to makes end meet (see Box 2)
housing laws We treat indoor plumbing as a necessary element of adequate water and sanitation
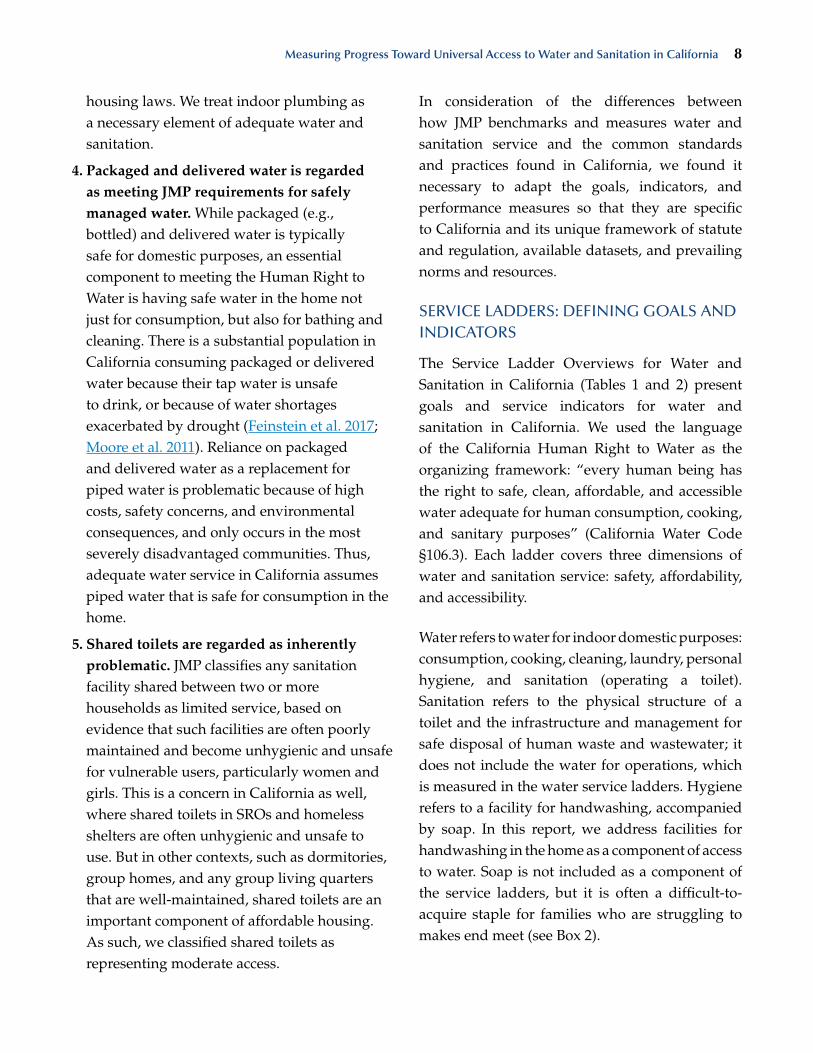
4 Packaged and delivered water is regarded as meeting JMP requirements for safely managed water While packaged (eg bottled) and delivered water is typically safe for domestic purposes an essential component to meeting the Human Right to Water is having safe water in the home not just for consumption but also for bathing and cleaning There is a substantial population in California consuming packaged or delivered water because their tap water is unsafe to drink or because of water shortages exacerbated by drought (Feinstein et al 2017 Moore et al 2011) Reliance on packaged and delivered water as a replacement for piped water is problematic because of high costs safety concerns and environmental consequences and only occurs in the most severely disadvantaged communities Thus adequate water service in California assumes piped water that is safe for consumption in the home
5 Shared toilets are regarded as inherently problematic JMP classifies any sanitation facility shared between two or more households as limited service based on evidence that such facilities are often poorly maintained and become unhygienic and unsafe for vulnerable users particularly women and girls This is a concern in California as well where shared toilets in SROs and homeless shelters are often unhygienic and unsafe to use But in other contexts such as dormitories group homes and any group living quarters that are well-maintained shared toilets are an important component of affordable housing As such we classified shared toilets as representing moderate access
Measuring Progress Toward Universal Access to Water and Sanitation in California 9
Each service ladder is described by a set of service indicators and performance measures The service indicators give abstract qualitative descriptions of each service level Performance measures focus on translating abstract concepts into measurable items and are heavily circumscribed by the datasets available The subsequent section
Table 1
Overview of Drinking Water Service Ladder for California ndash Goals and Service Indicators
Safe Affordable Accessible
Goal Chemicals regulated by state and federal SDWA standards should be consistently below levels that pose a significant risk to health
Cost of essential water and sanitation should be inexpensive enough that cost does not prevent access nor interfere with other essential expenditures
Water should be available in the home in sufficient volumes to meet domestic needs at hot and cold temperatures at the times needed
Satisfactory Water has met state and federal SDWA standards for Public Water Systems for the past three years
Household can afford safe accessible water without facing tradeoffs with other essential expenditures
Sufficient hot and cold indoor piped water reliably available 24 hours a day
Moderate Water has met state and federal SDWA standards for Public Water Systems for the vast majority of time in the past three years
Sufficient hot and cold water from an improved source available on premises (indoors or outside) and reliably available 24 hours a day bottled or delivered water acceptable in some circumstances
Marginal Water meets standards set by US Food and Drug Administration is treated by Point of UseEntry filter that meets California Title 22 regulations or meets voluntary domestic well guidelines
Household ocassionally cannot afford safe accessible water without facing tradeoffs with other essential expenditures
Sufficient water from an improved source including bottled water or tanks of water delivered by truck provided collection time is not more than 30 minutes round-trip (including waiting time) and reliably available at least 12 hours a day
Unacceptable Drinking water quality that is not regularly tested and verified as meeting at least the Marginal standard for safety
Household regularly cannot afford safe accessible water without facing tradeoffs with other essential expenditures
Water that does not meet at least the Marginal standards for access
Notes Drinking water refers to water for indoor domestic purposes consumption cooking cleaning laundry personal hygiene and sanitation (operating a toilet) It does not include the treatment and disposal of wastewater which is covered in the sanitation service ladder Improved sources of water are piped running water protected wells protected springs and rainwater Discretionary income is income minus all essential expenses but water housing health care food energy child care essential transportation and taxes SDWA - Safe Drinking Water Act
Serv
ice
Leve
lldquoEvery human being has the right to safe clean affordable and accessible water adequate for human consumption cooking and sanitary purposesrdquo
mdash California Water Code sect1063
Measuring Progress Toward Universal Access to Water and Sanitation in California 10
the number of households in California with access to sufficient water A system-level approach would quantify the number of PWSs with sufficient supply to meet the needs of its residential customers In California much of the available data on water and sanitation is collected on PWSs and centralized wastewater but this approach potentially masks variation between households or individuals and excludes those that are not served by such systems This document focuses on household-level performance measures as the
ldquoService Ladders Indicators and Performance Measuresrdquo examines each dimension of water and sanitation in greater detail defining the meaning precisely proposing specific numeric definitions for the abstract qualitative terms in the service indicators and suggesting data sources to inform the performance measures
Water and sanitation service can be measured at varying scales For example a household-level measurement of sufficient water would calculate
Table 2
Service Ladder for Adequate Sanitation in California ndash Overview of Goals and Service Indicators
Safe Affordable Accessible
Goal A sanitation system should separate waste from human contact until it can be safely treated and released to the environment or reused
Sanitation should be inexpensive enough that cost does not prevent access nor interfere with other essential expenditures
Toilets should be private located in the home safe to visit and available when needed
Satisfactory Flush toilet connected to a system that hygienically separates waste from human contact where waste is safely disposed of on-site or transported and treated off-site
Household can afford safe accessible sanitation without facing tradeoffs with other essential expenditures
Private secure well-maintained in-home facility not shared with other households available 24 hours a day
Moderate An improved facility that hygienically separates waste from human contact where waste is safely disposed of on-site or transported and treated off-site
Private secure well-maintained on-site facility possibly shared with other households available 24 hours a day
Marginal An improved facility that hygienically separates waste from human contact
Household ocassionally cannot afford safe accessible sanitation without facing tradeoffs with other essential expenditures
Private secure well-maintained facility possibly shared with other households no more than 50 meters from home available 24 hours a day
Unacceptable Use of unimproved facilities or open defecation
Household regularly cannot afford safe accessible sanitation without facing tradeoffs with other essential expenditures
Facility is more than 50 meters from home not available 24 hours a day or use of the facility compromises personal safety or privacy
Notes Sanitation refers to the physical structure of a toilet and the infrastructure and management for safe disposal of human waste and wastewater Improved sanitation facilities refer to equipment that hygienically separates waste from human contact such as flush toilets pit latrines and composting toilets
Serv
ice
Leve
l
Measuring Progress Toward Universal Access to Water and Sanitation in California 11
serviCe Ladders indiCatOrs and PerFOrManCe Measures
This section presents a series of tables describing indicators and performance measures for each aspect of the Human Right to Water as well as information on the relevant data sources and data gaps The tables in this section can also be found in the companion online appendices which include additional detail on context and rationale as well as useful links
most relevant level for understanding the service actually received by individuals in California For most of the dimensions the household- and system-level performance measures are simple corollaries In cases where the system-level metric is not a simple corollary of a household-level measurement we explicitly define system performance measures
Box 2
What About Hygiene
JMP defines safely managed hygiene as access to a basic handwashing facility with soap and water available on premises In this report we include sufficient water for hygiene under access to water We do not explicitly discuss soap but it is an essential component of hygiene Recent surveys and disease outbreaks indicate that lack of soap for handwashing among low-income families may be an unappreciated problem in the United States One survey of nearly 2000 low-income families with children found that one in three reported that at times they could not afford to purchase soap for handwashing and bathing (Feeding America 2012) Recent Hepatitis A outbreaks in southern California indicate that homeless populations are burdened by lack of access to handwashing facilities which exacerbates their problems with inadequate sanitation (San Diego County Health and Human Services Agency 2018 Karlamangla 2017)
Given that soap is inexpensive and necessary for human health it would be reasonable to include it in food assistance programs Yet social welfare programs such as CalFresh do not provide funds for non-food items nor is soap commonly found at food pantries (Department of Social Services 2018 Feeding America 2012) There is a clear nexus between handwashing and nutrition Long-term lack of handwashing among children causes intestinal dysfunction that limits their ability to absorb the full nutritional value in their food thus handwashing sanitation and nutrition are inextricably linked (Mbuya and Humphrey 2016 Syed Ali and Duggan 2016)
Source Thepalmer iStock
Measuring Progress Toward Universal Access to Water and Sanitation in California 12
The goal for safe drinking water sounds straightforward chemicals regulated by the state and federal SDWAs should be consistently below levels that pose a significant risk to health In practice however determining what constitutes safe water is complicated First although 96 of the population in California is served by a PWS not every person drinks water governed by the California SDWA (State Water Board 2013) Some people drink bottled water regulated by the Food and Drug Administration Others use water from domestic wells that are subject only to voluntary guidelines (State Water Board 2015b) And in some unusual circumstances a PWS can receive a temporary permit to use point-of-use treatment such as under-the-sink filters in lieu of centralized drinking water treatment1
Even for the majority of Californians who use and consume water governed under the California SDWA there are complexities to understanding who receives water that is ldquosaferdquo or ldquounsaferdquo There are several distinct legal standards encapsulated in Californiarsquos SDWA Public Health Goals (PHGs) Maximum Contaminant Levels (MCLs) and Treatment Techniques (TTs)2 Of these PHGs issued by the California Office of Environmental
1 Point-of-Use Treatment CCR Title 22 Article 25 httpswwwwaterboardscagovdrinking_watercertlicdrinkingwaterregulationsdocspou_poe_draft_reg_textpdf
2 California Safe Drinking Water Act California Health and Safety Code Division 104 Part 12 Chapter 4 sect116270 et seq
We address affordability of drinking water wastewater and sewer costs collectively in one combined performance measure A large proportion of households in California pay the costs for water wastewater and sewer on a single bill and inability to pay any substantial proportion of the total can result in a water service disconnection Since inability to pay any one of the costs results in losing access to the other services it is best to address the costs collectively whenever possible This is aligned with how current research on the topic recommends handling affordability (NAPA 2017 Teodoro 2018) There are cases when one might have information on the cost of drinking water for a region but not for wastewater and sewer in those cases we offer alternative measures that isolate the costs of each
Drinking Water Indicators and Performance Measures
SAFe DrInkInG WATer
Unsafe drinking water is perhaps the most pervasive problem in drinking water service provision in California and the problem affects every aspect of life in the affected communities (Box 3) Estimates for the number of Californians with unsafe drinking water vary widely because of uncertainties about the quality of water delivered by Very Small Systems and differing definitions of what constitutes ldquounsaferdquo One of the best indicators we have at this time of the number of Californians with unsafe water is the State Water Boardrsquos Human Right to Water Portal which records whether community water systems are in compliance with key requirements of the SDWA Of the approximately 38 million Californians served by a community water system 520000 Californians were served by a system that was out of compliance in January 2018 (State Water Board 2018a)
In January 2018 520000 Californians were served by a community water system that was out of compliance with the Safe Drinking Water Act
Measuring Progress Toward Universal Access to Water and Sanitation in California 13
bullDrinkingwaterqualityismeasuredatcentralized places in the water distribution system The water is often diluted or undergoes further treatment before delivery or may not be delivered to all connections served by a utility
bullTheCaliforniaSDWAregulatesthequalityofwater delivered by a PWS before it leaves the systemrsquos pipes to enter a service connection Similarly domestic well guidelines focus on the quality of water up to the time it enters the home There is scant information on the water quality problems that originate on private premises
bullQualitystandardssetbytheCaliforniaSDWAare intended to prioritize human health but they also must consider economic and technical feasibility Consequently water can meet SDWA requirements but fail to meet more rigorous standards set by the PHGs
bullTheprocessofidentifyingandsettingnewdrinking water quality regulations can be slow and lag behind the emergence of evidence that a contaminant of concern is found in drinking water For example OEHHA set a PHG for TCP 123 in 2009 the state did not adopt an associated MCL until July 2017 (State Water Board 2018c) Similarly there has been a PHG for hexavalent chromium since July 2011 but the final MCL has been delayed following an adverse court decision (State Water Board 2017)
Safe drinking water is the dimension of water and sanitation service with the most technical complexity given that there are approximately a hundred enforceable standards for clean drinking water The ladder we propose is based on the number of violations of primary California SDWA standards over the previous three years This offers a relatively simple way to translate compliance with laws governing safe drinking water to an indicator
Health Hazard Assessment (OEHHA) are the most rigorous standards PHGs for drinking water contaminants are set at levels that should pose no significant health risk if consumed for a lifetime PWSs however are not required to meet PHGs rather they are required to meet MCLs and TTs The State Water Board sets MCLs at a level that balances the primary objective of meeting the PHGs against technological and financial limitations In cases where there is no feasible method to measure contaminant levels the state may use a TT to limit exposure rather than an MCL A TT is a procedure that if followed should reduce the presence of a contaminant in drinking water to acceptable levels Lead and copper for example are governed by TTs rather than MCLs3
It is important to keep these caveats in mind when attempting to connect exceedances of PHGs MCLs and TTs to a measurement of populations with ldquosaferdquo and ldquounsaferdquo water
bullCaliforniaSDWAviolationsarerecordedasbinary yesno events but the degree and duration of elevated contaminant levels determines the health impact PHGs and MCLs are set to minimize the risk caused by consuming a contaminant over a human lifetime An exceedance that is modest in quantity or duration does not necessarily measurably increase human health risk
3 California Lead and Copper Rule CCR sect64670
The goal for safe water is that chemicals regulated by the state and federal Safe Drinking Water Act should be consistently below levels that pose a significant risk to health
Measuring Progress Toward Universal Access to Water and Sanitation in California 14
health impacts of those contaminants to model the risk of disease caused by consuming a given water supply California OEHHA took an approach that was not as exhaustive as a full quantitative risk assessment but did take into account the relative concentrations of different contaminants and whether multiple contaminants are present for their California Communities Environmental Health Screening Tool (CalEnviroScreen 30 OEHHA 2017) Our approach is more closely aligned with that of the State Water Boardrsquos Human Right to Water Portal (State Water Board 2018a) It allows a more rapid analysis of water quality lending itself to frequent updates and has the virtue of being clearly aligned with enforceable laws (or in the case of private wells with state-issued voluntary guidelines)
We consider a household receiving water from a PWS that has met California SDWA standards every monitoring period for three years to be Satisfactory in the safe water dimension
We define the Moderate rung as applying to households receiving water from a PWS that has had no more than one enforcement action for non-acute drinking water standards in the past three years The Moderate definition intends to acknowledge that a short-term violation of the SDWA for a chronic contaminant does not necessarily result in serious harm to human health In fact the Moderate standard still represents a rather high bar given the wide gap between a violation lasting less than a few months and the standard of harm caused by lifelong exposure set by the PHG
of whether a household is likely to receive safe drinking water The approach also has the benefit of relying on data in the Safe Drinking Water Information System that is updated multiple times a year We selected a three-year period because that is the length of one SDWA compliance period Systems are generally required to test for MCLs at least once per compliance period and usually more frequently although systems deemed lower-risk for specified contaminants can be granted intervals as long as nine years between testing (US EPA 2004) We also suggest treating violations for contaminants that are occasionally found at levels associated with acute health impacts more stringently than contaminants typically found far below the level at which they have immediate acute effects Specifically violations of MCLs and TTs pertaining to microorganisms nitrates and nitrites are occasionally found in California PWSs at levels high enough to cause serious harm in short time periods and we recommend treating even violations of these acute contaminants more stringently (US EPA 2007 Senate Office of Research 2015)
Given the caveats listed above while water meeting the definitions of Marginal Moderate and Satisfactory can reasonably be considered ldquosaferdquo water that does not meet these definitions should not be assumed to be ldquounsaferdquo Populations served by systems failing to reach at least the Marginal level should be characterized as being potentially exposed to unsafe water
We developed the rungs of the safe drinking water service ladder to be categories that can be informed with a relatively simple analyses of compliance with relevant statutes and regulations (Table 3) It would be more rigorous but more complex to categorize water quality using a quantitative risk assessment approach A quantitative risk assessment entails using measured concentrations of multiple chemicals along with data on the
ldquoThe pistachio trees have better water than we do They care a lot about the crops here Not the peoplerdquo- Maricela Mares-Alatorre
Measuring Progress Toward Universal Access to Water and Sanitation in California 15
Box 3
Living Without Safe Water Interview With Maricela Mares-Alatorre Community Organizer Kettleman City
ldquoIt is so ingrained in us now We just donrsquot drink the waterrdquo
Maricela Mares-Alatorre is a community leader in Kettleman City a small unincorporated community of 1500 people halfway between Los Angeles and San Francisco
ldquoWe are seen as disposable people and disposable people donrsquot need clean water We arenrsquot disposable people Wersquore hardworking people Maybe we donrsquot have high paying jobs but wersquore hardworking and we deserve dignity We deserve the dignity of clean water just like anyone elserdquo
In Kettleman City residents ndash along with organizations such as People for Clean Air and Water California Rural Legal Assistance and Greenaction ndash have been fighting for years for their right to water After a cluster of severe birth defects and infant deaths in 2008 and 2009 the state finally tested the water As residents already knew it wasnrsquot safe to drink
ldquoBut the state took their time in addressing the problemrdquo Maricela says ldquoThe pistachio trees have better water than we do They care a lot about the crops here Not the peoplerdquo
After years of delays a plan to finance a new water treatment plant with help from the waste management company is nearing completion The plant is now projected to be finished in early 2019 ndash nine years after the state recommended the water problem be fixed
Maricela says it was ldquonine years too longrdquo given the hardships unsafe drinking water imposes on her community ldquoWe get bottled water for drinking But we still have to bathe in the tap water brush our teeth with it cook with it People canrsquot afford to buy more bottled water for all those things
ldquoYou change your cooking and your diet Things that are going to be drained or not in water for a long time like pasta you can cook in tap water But things like beans that you boil for hours and then stay in the pot the whole week you have to cook in bottled water
ldquoI was over 40 the first time I heard lsquowater is a human rightrsquo Here it is a given that we donrsquot have clean waterrdquo
Maricela Mares-Alatorre is a Community Organizer and Policy Advocate with Greenaction for Health and Environmental Justice Maricela is also coordinator for El Pueblo Para el Aire y Agua LimpiaPeople for Clean Air and Water of Kettleman City
Source Bradley Angel Greenaction for Health and Environmental Justice
Maricela Mares-Alatorre a community organizer in Kettleman City California says her community has been fighting for years for their right to water
Measuring Progress Toward Universal Access to Water and Sanitation in California 16
correct for that be defining a constant time horizon of three years as the assessment window
We define the Marginal rung as applying to households that rely primarily on bottled water Very Small Systems or water from PWSs that do not have a centralized treatment facility Bottled water is regulated by the Food and Drug Administration with a less restrictive set of testing and treatment protocols than tap water from PWSs Very Small Systems are not regulated under the SDWA and are encouraged to follow Californiarsquos voluntary guidelines for domestic well owners (State Water Board 2015b) Last PWSs under specified circumstances can apply for a permit to use point-
The Satisfactory and Moderate rungs in Table 3 are similar to the State Water Boardrsquos definition of systems that are in compliance for the Human Right to Water Portal The key difference is the way the portal treats the duration and period of time without an enforcement action On the portal ldquoin compliancerdquo reflects a systemrsquos current status while ldquoreturned to compliancerdquo indicates a system is currently in compliance but had at least one enforcement action since January 2012 The problem with the portalrsquos categories is that they do not reflect consistent criteria over time as time passes the ldquoreturn to compliancerdquo group will grow while ldquoin compliancerdquo will shrink We attempt to
Table 3
Service Indicators and Performance Measures for Safe Drinking Water in California
Goal Chemicals regulated by state and federal SDWA standards should be consistently below levels that pose a significant risk to health
Household-Level Service Indicator Household-Level Performance Measure
Satisfactory Water has met state and federal SDWA standards for Public Water Systems for the past three years
Household served by Public Water System that has been without an enforcement action during the last three years for state or federal drinking water standards
Moderate Water has met state and federal SDWA standards for Public Water Systems for the vast majority of time in the past three years
Household served by Public Water System that 1) has been without an enforcement action for an acute drinking water standard during the last three years and 2) has been without an enforcement action lasting more than one monitoring period during the last three years for state or federal chronic drinking water standards
Marginal Water meets standards set by US Food and Drug Administration is treated by Point of UseEntry filter that meets California Title 22 regulations or meets voluntary domestic well guidelines
Household uses bottled water regulated by US Food and Drug Administration or water from a Public Water System that does not have a centralized treatment facility but is treated by a Point of EntryUse filter that meets State Water Board resolution 2016-0015 or water from well serving fewer than 15 connections that meets voluntary domestic well guidelines
Unacceptable Drinking water quality that is not regularly tested and verified as meeting at least the Marginal standard for safety
Any one of the characteristics of Marginal access to water is not met
Notes Acute contaminants are microorganisms nitrates and nitrites Californiarsquos voluntary guidelines for domestic well owners are described in A Guide for Private Domestic Well Owners (State Water Board 2015b) Regulations for point-of-use and point-of-entry water treatment devices are described in California Code of Regulations (CCR) Title 22 Article 25 SDWA ndash Safe Drinking Water Act
Serv
ice
Leve
l
Measuring Progress Toward Universal Access to Water and Sanitation in California 17
DATA SOurCeS FOr SAFe DrInkInG WATer
Table 4 describes data sources to inform the performance measures on safe drinking water The first three the two Safe Drinking Water Information Databases and the Human Right
of-entry or point-of-use water treatment devices which treat water at the point it enters a building or at a single tap in lieu of centralized treatment Any of these are unlikely to harm human health if used on a temporary basis but lack the extensive quality safeguards of the SDWA
Table 4
Data Sources for Safe Drinking Water Performance Measures
Description Collected By InformationGeographic Scale Significance
Safe Drinking Water Information System (SDWIS) State-Regulated Systems
California State Water Board
SDWA reports from Public Water Systems
Public Water System
Relevant for understanding water quality for the 95 of Californians served at home by a state-regulated Community Water System as well as water quality for non-community water systems
Safe Drinking Water Information System (SDWIS) Tribal Systems
US EPA Region 9 SDWA reports from federally regulated tribal Public Water Systems
Public Water System
Relevant for understanding water quality for the 1 of Californians served at home by a tribal Community Water System
Human Right to Water Portal
California State Water Board
A subset of SDWA enforcement actions
Community Water Systems and Non-Community Water Systems serving schools and daycares
Similar information to SDWIS simplified focused on priority SDWA violations and provided in spreadsheet and map format
Domestic Wells United States Geological Survey
Location and population served by domestic wells (Very Small Systems reliant on groundwater)
Census Tract Relevant for understanding surface location and population served by Very Small Systems
Domestic Well Completion Reports
California DWR and county well permitting agencies
Location and depth of domestic wells (Very Small Systems reliant on groundwater)
Public Land Survey System Sections
Relevant for understanding surface location and source water depth for Very Small Systems
Groundwater Ambient Monitoring and Assessment (GAMA) Program
California State Water Board
Groundwater quality monitoring
Groundwater basin
Quality of groundwater aquifers in California Relevant to quality of source water for Public Water Systems and Very Small Systems reliant on groundwater but does not necessarily reflect the quality of the water at point of use
CalEnviroScreen Drinking Water
California OEHHA
Indicator of likely exposure to drinking water contaminants
Census Tract Information on exposure to 13 drinking water contaminants for areas served by Public Water Systems and areas likely to be served by Very Small Systems using wells
Notes Additional details on data sources including links to online resources and update schedule are available in Online Appendix II OEHHA - Office of Environmental Health Hazard Assessment SDWA - Safe Drinking Water Act DWR - Department of Water Resources
Measuring Progress Toward Universal Access to Water and Sanitation in California 18
consumed On-premises problems are a poorly-understood source of potential contamination PWSs perform a limited set of tests at a handful of taps in their service area for lead and copper levels A more extensive sampling protocol would likely reveal water quality problems as has been demonstrated by the recent efforts to expand testing for lead at taps in schools (State Water Board 2018b) In addition we do not know the extent to which point-of-use and point-of-entry filters mitigate water quality problems
Affordable Drinking Water and Sanitation
The goal for affordable water and sanitation is that essential drinking wastewater and sewer needs should be inexpensive enough that cost does not prevent access nor interfere with other essential expenditures (Heller 2015) The Human Right to Water does not imply that it should be free Indeed to do so would endanger the financial sustainability of water and sanitation systems undermining quality of service for future generations However the Human Right to Water does imply that public entities have a responsibility to consider affordability for low-income customers and assist households who have difficulty paying for essential expenses
The affordability of water and sanitation should be measured together if the household is billed jointly as the cost of one impacts the affordability of the other For the many households paying combined drinking water and wastewater bills the inability to pay one part of the bill results in loss of both services For households receiving separate bills affordability for water and sanitation can be calculated separately
While the WASH sector has long identified affordability as a key factor in ensuring equitable water and sanitation service there is no
to Water Portal directly inform the Satisfactory and Moderate Safe Drinking Water performance measures The datasets on location and depth of drinking water wells coupled with information from the Groundwater Ambient Monitoring and Assessment (GAMA) Program could potentially be synthesized to generate estimates of drinking water wells reliant on contaminated aquifers (though the degree to which well-owners treat the water remains unknown) CalEnviroScreen provides a synthetic indicator of drinking water contaminants in California although their approach provides information that does not directly align with how we have constructed the safe drinking water service ladder
DATA GAPS AnD AnALyTICAL ChALLenGeS FOr SAFe DrInkInG WATer
A major challenge in obtaining comprehensive estimates of Californians with safe drinking water is a lack of information on systems too small to be regulated under the SDWA For PWSs while we have excellent information on the quality of water at centralized points in the distribution system this may differ from the quality of water at the point of use
Quality of water as delivered by Very Small Systems small systems are subject to highly variable local regulation on their water quality and private domestic wells have no mandatory requirements on management of water quality As such we have very little understanding of the quality of water delivered by Very Small Systems including the extent to which they are monitored and treated before use
Quality of water at point-of-use water quality tested at a central point in the distribution system of a PWS may differ from the quality of water at the tap The water can be further treated diluted or exposed to additional contaminants before it is
Measuring Progress Toward Universal Access to Water and Sanitation in California 19
clearly not intended to make a formal universal recommendation on water affordability It appears with no rationale or citation for the figure However it was likely derived from studies and government agencies that had consistently found that most households spent a proportion of their income that was in the low single digits A review of water expenditures for median-income households in mid- to high-income countries found they spent between 05 and 24 of their income on water (OECD 2003 Table 22) Households in the lower 20th percentile of incomes spent somewhat more ranging from 07 to 27 of income on water (OECD 2003 Table 23) The UNDP may also have based their rule of thumb on other institutional precedents For example the World Bank and United Kingdom have used thresholds of 3 to 5 of income as indicators of water cost burdens although in both cases these were intended to be used as approximate guides rather than categorical designations of whether water was or was not affordable (OECD 2003 p 43)
commonly-agreed upon performance indicator for affordability (WHO and UNICEF 2017a 20 Hutton 2012) A common instrument for measuring affordability is to calculate the percent of income spent on water and compare it to some designated threshold Some of the most commonly-cited thresholds for affordable water are 3 of household income (attributed to the United Nations Development Programme) 45 of median household income (attributed to the US EPA) and 15 of median household income (attributed to the California State Water Board) These thresholds for the proportion of income spent on water are commonly referenced in the literature as accepted rules for household water affordability (eg see Christian-Smith et al 2013 Feinstein et al 2017 Mack and Wrase 2017) However as described below these thresholds were not intended to provide institutional recommendations on the maximum an individual household should spend on water
In the international setting there have been attempts to develop guidelines on affordability but these are more back-of-the-envelope suggestions than firm standards For example the commonly referenced ldquoguidelinerdquo from the United Nations Development Programme (UNDP) on affordability originates from a brief mention in a single publication ldquoOne rule of thumb is that no household should be spending more than 3 of its income on water and sanitationrdquo (UNDP 2006) Viewed in context this passing statement was
Essential drinking wastewater and sewer needs should be inexpensive enough that cost does not prevent access nor interfere with other essential expenditures
Source J Carl Ganter Circle of Blue
Guillermina Andrade and Vicente Tapia filled five 55-gallon barrels twice a week from this water depot outside the Porterville fire station in winter 2016
Measuring Progress Toward Universal Access to Water and Sanitation in California 20
needs median household income rather than the full range of incomes in a community and accounting only for the cost of drinking water leaving out wastewater and sewer costs They also ignore the cost of other essential needs failing to indicate whether a household is likely to face a financial trade-off in paying for water Upon closer examination these commonly-used benchmarks are slender reeds to form the basis of major decisions on water rates and social assistance programs
Citing the lack of commonly agreed-upon metrics JMP did not include affordability in the service ladders in their 2017 progress report They noted that they are engaged in a collaborative process ldquoto develop and test indicators that will enable more systematic and consistent monitoring of affordability in the futurerdquo (WHO and UNICEF 2017a p 20)
A recent report by the National Academy of Public Administration concluded that the approach of calculating affordability as a percentage of mean household income was inadequate for assessing affordability making a set of six broad recommendations on how to develop better affordability metrics The report suggested several characteristics of an improved user affordability metric
bullWaterneedsshouldbedefinedbroadlytoinclude water and wastewater
bullThecostofotheressentialexpensesbesideswater should be factored into the analysis
bullVariabilityinhouseholdincomeandspecifically the impact of water costs on low-income households should be considered
bullThefocusshouldbeonessentialwaterneedsand not discretionary uses
bullThemetricshouldbeeasytocalculatefromreadily available data and
bullThemetricshouldbesimpletounderstand
Another set of commonly-referenced affordability thresholds are the US EPA cost benchmarks which are often applied outside of their intended scope The 45 benchmark originates from US EPA recommendations on assessing the cost of compliance with federal regulations (US EPA 1997 2006 1998) The EPArsquos benchmarks were intended to assess impacts of regulations on affordability as measured against average household incomes regionally or nationally they were not intended to be the target for individual household spending for water or wastewater (US Conference of Mayors American Water Works Association and Water Environment Federation 2013) The US EPA affordability metric of 25 of median household income for drinking water was developed to evaluate the impact of regulations on average water bills across the country The corresponding metric from US EPA for wastewater and combined sewer overflows was intended to evaluate an individual communityrsquos financial capacity to comply with regulatory mandates and schedules Both metrics are misapplied when they are used as targets for household-level spending (US Conference of Mayors American Water Works Association and Water Environment Federation 2013)
Finally in California it is common to reference 15 of median household income as an affordability benchmark (Christian-Smith et al 2013 Feinstein et al 2017) The figure appears in documentation from the California State Water Board on eligibility for particular funding streams However the 15 threshold used by the California State Water Board was only intended to evaluate affordability within low-income communities and to inform a specific set of funding decisions (State Water Board 2016c)
While the general approach of measuring the ratio of cost of water to income is sound the commonly-used indices often measure the wrong factors focusing on average water use rather than basic
Measuring Progress Toward Universal Access to Water and Sanitation in California 21
cost of 43 GPCD drinking waterand wastewater
discretionary incomeARhousehold =
Where discretionary income equals household gross income minus expenses on shelter health care transportation food laundry and cleaning telephone home energy and taxes
The cutoffs between Satisfactory Moderate Marginal and Unacceptable Affordability service indicators are more-or-less arbitrary It is clear that the cost of water should be less than 100 of discretionary income and more than 0 but there is no clear set of guidelines to determine precisely where to place affordability thresholds We suggest defining Satisfactory affordability as a household spending no more than 10 of their discretionary income on all water costs (or 5 on drinking water and 5 on wastewater if information on one is unavailable) We suggest a maximum of 20 of discretionary income as the cutoff for Moderate and 30 for Marginal (Table 6) We selected 10 of discretionary income for the Satisfactory standard because it aligned with the suggestion in Teodoro (2018) It seems reasonable to infer that a household spending more than 30 of discretionary income would face unreasonable tradeoffs with other necessary expenditures especially when unanticipated large expenses arise
At face value these thresholds seem higher than other affordability ratios such as the 15 of
Two recent papers (Davis and Teodoro 2014 Teodoro 2018) proposed calculating an Affordability Ratio (AR) as essential water needs divided by discretionary income Discretionary income is defined as income minus essential expenses apart from water They offer a ldquorule-of-thumbrdquo that AR should be no more than 10 for a four-person household with an income in the 20th percentile for the utility service area Their formula for calculating the affordability metric addresses some of the shortcomings of other definitions used in the past It calculates affordability for essential indoor water needs rather than average usage focuses on lower-income households rather than the median and makes an adjustment for the local cost of living The authors are clear that the offered 10 threshold is arbitrary and that it can and should be viewed as an expression of community values around water affordability and not regarded as a fixed immutable number
For household affordability we suggest calculating the percentage of discretionary income an individual household spends on essential indoor needs We recommend 43 gallons per capita per day (GPCD) as a reasonable volume of water to meet basic needs Detailed calculations for the volume of water required for household uses are described below in ldquoAccessible Drinking Waterrdquo The cost of water should be defined broadly to include drinking water and wastewater For areas with poor-quality domestic water the cost of water includes bottled water purchases For those reliant on private domestic wells and septic systems costs should include construction costs as well as operations and maintenance costs
Our recommendation for an affordability service indicator is to calculate an Affordability Ratio (AR) for a given household as the cost of 43 GPCD of drinking water and wastewater divided by discretionary income
Affordability should be calculated as the percentage of discretionary income an individual household spends on essential indoor needs
Measuring Progress Toward Universal Access to Water and Sanitation in California 22
$13 a month A satisfactory combined water and wastewater bill would be twice that or $26 For all 58 California Counties the Satisfactory Drinking Water standard sets a lower dollar limit on an ldquoaffordablerdquo bill than does 15 of gross income for a very low-income family
The data to inform this metric are typically available at the Census Tract scale or larger Consequently we also outline how to calculate an aggregate system-level analysis as a system-level affordability indicator For the System-Level Performance Measure described in Table 7 we consider a system in which half or more of its customers spend more than 10 of their discretionary income on water as Unacceptable When at least half the ratepayers are heavily burdened by the cost of water it is a strong indication that systemic reforms should be considered to bring the cost of water in line with what the community can afford to pay We suggest that a system in which 40 to 50 of households spend more than 10 of discretionary income on water would be considered Marginal 33 to 40 would be Moderate and less than 33 would be Satisfactory
MHI used in California This first impression is misleading The threshold for the proposed Affordability Service Indicator is set at a higher percentage than other metrics because the proposed indicator has a larger numerator and a smaller denominator The numerator incorporates water and wastewater while replacing gross or disposable income with discretionary income vastly reduces the denominator Consequently the dollar amount that would be considered ldquounaffordablerdquo is lower for the household-level performance measure than for 15 of MHI or even 15 of total income for a very low income family (Table 5)
For example in Tulare county where median household income was $43000 in 2017 (US Census Bureau 2017) a water bill would be considered unaffordable according to the State Water Board standard of 15 MHI if drinking water cost more than $53 a month For a family classified as Very Low Income for Tulare County earning $27000 annually 15 of monthly income equals $34 By contrast 5 of discretionary income for a very low-income family in Tulare County is only
Table 5
ldquoAffordablerdquo Drinking Water Bills According to Three Metrics for Three Representative Counties
Metric 1 Metric 2 Metric 3 (this report)
CA State Water Board definition le15 of MHI le15 of VLI
Satisfactory Drinking Water Cost le5 of DI
Moderate Drinking Water Cost gt5-10 of DI
Marginal Drinking Water Cost gt10 -15 of DI
Unacceptable Drinking Water Cost (gt15 of DI)
dollars ($)
Santa Clara County
le126 le67 le40 gt40 - 81 gt81 - 121 gt121
Tulare County le53 le34 le13 gt13 - 26 gt26 - 39 gt39
Trinity County le44 le34 le13 gt13 - 25 gt25 - 38 gt38
Notes Figures are for drinking water alone excluding wastewater All values in dollars Cost for non-water essentials based on US Housing and Urban Development Fair Market Rate for a 2-bedroom unit in 2018 other figures from US Census Bureau Customer Expenditure Survey results for households earning $20-29000 annually in the Western United States VLI ndash Very Low Income for a household of 3 according to US Housing and Urban Development (2017) DI ndash Discretionary Income for a VLI household
Measuring Progress Toward Universal Access to Water and Sanitation in California 23
The System-Level Performance Measure indicator could be used to evaluate the impact of management decisions Rate-setting investment decisions and conservation and efficiency programs can all be considered in the context of how they will impact the System-Level Performance Measure Every system is unique and the cost of service can vary greatly depending on factors such as the quality and reliability of the source water and the size of the ratepayer base Yet there are management decisions that can depending on circumstances lower the cost of essential water needs Options include consolidation and regionalization (Wolff and Hallstein 2005) rate structures that reduce the cost of indoor water use relative to outdoor use (Feinstein et al 2017 Donnelly and Christian-Smith 2013) accurate demand forecasting that does not drive overinvestment in new supplies (Heberger Kristina and Cooley 2016 Diringer et al in press) and prioritizing the lowest-cost sources of new supply (Cooley and Phurisamban 2017)
We caution that water priced too low to cover the long-term costs of maintaining the system may appear affordable but is merely deferring expenses until later Many water systems in the United States have consistently underinvested in infrastructure needs which leads eventually to failures to deliver safe and accessible water and in the long run are likely to result in rate hikes that make water unaffordable for future generations (Kane 2016) Truly affordable water is priced with a trade-off in mind revenue should be high enough that the service provider can maintain their system and make necessary infrastructure investments but household bills should be low enough that customers can afford their other essential expenses
To calculate discretionary income one can use a simple approach to identify a lower-limit estimate of essential expenses US Housing and Urban Development gives estimates of Fair Market Rents by county or metropolitan area for shelter For other items (healthcare transportation food at home laundry and cleaning telephone home energy and taxes) US Bureau of Labor Statisticsrsquo Customer Expenditure Surveys information on expenses for households earning $20000 to $30000 a year for the United States Western Region provides an approximation of a basic cost of living4 We selected expenses in the $20000 to $30000 annual income category as an indicator of a conservative basic cost of living because spending on essential expenses increases sharply up to this income bracket than gradually levels off for households in higher-earning categories There are limits to this approach to estimating cost of living first it does not account for fine-scale variation in cost of living and it leaves out childcare which is necessary for families that do not have a stay-at-home parent or other caregiver A sensitivity analysis could illuminate the degree to which these limitations impact the estimate of water affordability
4 The Western Region for the Customer Expenditure Survey is composed of Alaska Arizona California Colorado Hawaii Idaho Montana Nevada New Mexico Oregon Utah Washington and Wyoming
We caution that water priced too low to cover the long-term costs of maintaining the system may appear affordable but is merely deferring expenses until later
Measuring Progress Toward Universal Access to Water and Sanitation in California 24
Eligibility for Customer Assistance Program (ECAP) A persistent question in water affordability is who should qualify for a low-income customer assistance program The household-level metric we propose is challenging to calculate and would be difficult for customers to understand Ultimately if the goal of an affordability program is to prevent low-income families from being forced to make trade-offs to pay their water bill or do without sufficient water then it is unnecessary to construct an elaborate metric to determine who should qualify It is sufficient simply to identify households with very limited discretionary income and offer them customer assistance A simple eligibility standard for customer assistance programs is whether a household earns less than 200 of the Federal Poverty Line (FPL) or less than the US Housing and Urban Developmentrsquos Very Low Income (VLI) cutoff for the county whichever
It is important to note that spending 10 of discretionary income on water is only attainable for those with some discretionary income The most severely impoverished persons will be unable to cover any substantial portion of the costs of water service The goal of providing affordable water to all implies the need for customer assistance programs to ensure water is affordable for the poorest households who have little or no income remaining after meeting basic living expenses
AnCILLAry PerFOrMAnCe MeASureS FOr AFFOrDABLe DrInkInG WATer AnD SAnITATIOn
We propose two related metrics to consider when evaluating affordability at the system level These are intended to supplement the main affordability performance measures
Table 6
Household-Level Service Indicators and Performance Measures for Affordable Drinking Water and Sanitation in California
Goal Cost of essential water and sanitation needs should be inexpensive enough that cost does not prevent access nor interfere with other essential expenditures
Household-Level Service Indicator Household-Level Performance Measure
Satisfactory Household can afford safe accessible water and sanitation without facing tradeoffs with other essential expenditures
Household spends le10 of discretionary income on essential water and sanitation needs
Moderate
Household spends gt10 but le20 of discretionary income on essential water and sanitation needs
Marginal Household occasionally cannot afford safe accessible water and sanitation without facing tradeoffs with other essential expenditures
Household spends gt20 but le30 of discretionary income on essential water and sanitation needs
Unacceptable Household regularly cannot afford safe accessible water and sanitation without facing tradeoffs with other essential expenditures
Household spends gt30 of discretionary income on essential water and sanitation needs
Notes To provide the best indication of true cost burden per household these costs should be calculated after any applicable low-income bill discount is applied In many areas there is data available only for the cost of drinking water in which case we suggest halving the percentage of discretionary income (ie 5 of discretionary income would meet the Satisfactory standard for affordable water) Essential water and sanitation needs covers 43 GPCD of water and wastewater (Table 9)
Serv
ice
Leve
l
Measuring Progress Toward Universal Access to Water and Sanitation in California 25
Involuntary Shutoff Rate The involuntary shutoff rate calculated as the number of involuntary shutoffs for residential customers divided by the number of residential connections is a coarse but useful metric for gauging the affordability of water rates The number is an imperfect metric for households unable to pay for water because it may include involuntary service disconnections to households that choose not to pay along with those unable to pay5 Nonetheless it provides a useful relative index of affordability for example one
5 Ideally one would be able to measure disconnections for low-income households separately but at this time the State Water Board plans to collect information solely on total number of shutoffs ordered by each water utility
is greater Thus a relatively simple formula to determine whether a household in a given county qualifies for customer assistance would be
gross household income le 200 FPL or VLI whichever is greater
This standard can be calculated from readily-available data It has the advantages of scaling with household size (FPL and VLI account for the number of persons in a household) and also adjusting to some extent for local cost of living (VLI is higher than 200 FPL in high-earning counties) This approach also would facilitate cross-enrollment with other programs that use the 200 FPL and VLI standards
Table 7
System-Level Service Indicators and Performance Measures for Affordable Drinking Water and Sanitation in California
Goal Cost of essential water and sanitation needs should be inexpensive enough that cost does not prevent access nor interfere with other essential expenditures
System-Level Service Indicator System-Level Performance Measure
Satisfactory Most households spend a minority of their discretionary income on essential drinking and wastewater needs without financial assistance households with a high water cost burden receive financial assistance
More than 33 of households do not meet the Satisfactory standard for affordability disregarding low-income bill discount programs For those spending more a low-income bill discount program is available
Moderate
More than 40 of households do not meet the Satisfactory standard for affordability disregarding low-income bill discount programs For those spending more a low-income bill discount program is available
Marginal Nearly half of households spend a substantial proportion of their discretionary income on essential drinking and wastewater needs without financial assistance and financial assistance is not available
More than 50 of households do not meet the Satisfactory standard for affordability disregarding low-income bill discount programs
Unacceptable More than half of households spend a substantial proportion of their discretionary income on essential drinking and wastewater needs without financial assistance and financial assistance is not available
More than 50 of households do not meet the Satisfactory standard for affordability disregarding low-income bill discount programs
Serv
ice
Leve
l
Measuring Progress Toward Universal Access to Water and Sanitation in California 26
between households that are enrolled in a customer assistance program to similar households that are not enrolled
DATA SOurCeS FOr AFFOrDABLe DrInkInG WATer AnD SAnITATIOn
Table 8 describes data sources to inform the performance measures on affordable water and sanitation The Electronic Annual Reports California American Water Rate Survey and Wastewater User Charge Survey provide information on water rates for PWSs and centralized municipal wastewater systems The Electronic Annual Reports also began to collect information on service disconnections in 2018
would expect involuntary shutoffs to decline after instituting a customer assistance program Indeed when a group of customers with delinquent bills in St Petersburg Florida were randomly selected to receive debt restructuring and financial counseling they had a decreased rate of shutoffs relative to control groups (Moulton et al 2016) Most importantly measuring involuntary shutoffs should generate information on the degree to which affordability acts as a barrier to water access and whether existing affordability programs are sufficient to ensure that even very low-income customers can afford to consistently pay their water bill A related useful approach to measuring involuntary shutoffs would be to compare rates
Table 8
Data Sources for Affordable Water and Sanitation Performance Measures
Description Collected By InformationGeographic Scale Significance
Electronic Annual Reports
California State Water Board
Self-reported data on rate structures for Public Water Systems calculates residential bill at 6 12 and 24 CCF (4500 7500 and 1500 gals) Also collects information on service disconnections
Public Water System
Cost of drinking water for Public Water Systems In 2015 public version of report had information for ~650 large systems Rates information is not extensively screened for accuracy Also useful for estimating the Involuntary Shutoff Rate
California American Water Rate Survey
California American Water (private sector)
Rate structures for Public Water Systems calculates residential bill at 10 CCF (7500 gals)
Public Water System
Cost of drinking water for Public Water Systems of a variety of sizes mostly larger 2015 version had information for ~900 systems Detailed structure information allows user to calculate cost at any volume
Wastewater User Charge Survey
California State Water Board
Self-reported rate structures for ~650 wastewater systems gives estimate of average residential bill
Wastewater Agency
Gives an approximation of wastewater costs though few details are provided on how systems estimated the average bill
American Community Survey
US Census Bureau
Table S1901 gives number of households by income category B19080 gives income quintile limits S2501 gives household size
Census Tract Information on the income levels and household sizes for calculating the affordability ratio
Continued on Next Page
Measuring Progress Toward Universal Access to Water and Sanitation in California 27
DATA GAPS AnD AnALyTICAL ChALLenGeS FOr AFFOrDABLe DrInkInG WATer AnD SAnITATIOn
There are a number of topics relevant to affordability where information is unavailable data have not been compiled in a centralized dataset or important numbers are challenging to calculate
The American Community Survey US Customer Expenditure Survey Family Budget Calculator American Housing Survey and American Community Survey Public Use Microdata Samples provide information on household incomes and expenditures Federal Poverty Guidelines and Affordable Housing Income Thresholds and Fair Market Rents provide information on thresholds for poverty and baseline housing costs
Table 8 (Continued)
Data Sources for Affordable Water and Sanitation Performance Measures
Description Collected By InformationGeographic Scale Significance
US Customer Expenditure Survey
US Department of Labor Bureau of Labor Statistics
Information on household expenditures by income category
Aggregated for American West and large metro areas microdata for county and metro area
Information on non-water essential expenses for calculating the affordability indicator
Family Budget Calculator
Economic Policy Institute
Information on essential expenditures by category based on family size and composition
County and metropolitan area
Information on non-water essential expenses for calculating the affordability indicator
American Housing Survey (topics Income and Housing Costs)
US Census Bureau
Information on income and housing costs
Statewide and select metro areas full geographic data in classified version
Survey of income and housing costs including shelter and utilities
American Community Survey Public Use Microdata Samples
US Census Bureau
Self-reported information on income and the amount of money spent on water
Public Use Microdata area
Asks individual households to report their spending on water and income
Federal Poverty Guidelines
US HHS Threshold for poverty defined by income and household size
National Relevant for calculating Eligibilityfor Customer Assistance Program (ECAP) performance measure
Affordable Housing Income Thresholds and Fair Market Rents
US HUD Lists Area Median Incomes defines regional income categories (eg VLI) and lists Fair Market Rents for housing
County and metro area
Relevant for calculating Eligibilityfor Customer Assistance Program (ECAP) performance measure
Note Additional details on data sources including links to online resources and update schedule are available in Online Appendix II
Measuring Progress Toward Universal Access to Water and Sanitation in California 28
Valley in 2016 cost $25000 to $35000 which was prohibitively expensive for many households whose wells ran dry in the 2012-2016 drought (Feinstein et al 2017) Septic systems require routine maintenance every 2-5 years that costs a few hundred dollars (US EPA 2005)
Accessible Drinking Water
We describe standards for accessible drinking water in Table 10 as meeting defined requirements for volume location and reliability of drinking water access similar to the approach employed by JMP (WHO and UNICEF 2017b) The goal for accessible water should be available in the home in sufficient volumes to meet domestic needs at hot and cold temperatures twenty-four hours a day The goal has four components volume temperature physical proximity and temporal availability We generated estimates of sufficient volume both from existing literature and recent data collected in California and North America described in greater detail in the section on ldquoSufficient Volumerdquo The standards for temperature location and times available were derived from statutory guidelines
California statute expressly defines residences fit for habitation as including indoor hot and cold running water (California Civil Code sect1941 and Health and Safety Code sect179203)6 This standard also aligns with the best available dataset on access to water the American Community Survey which asks respondents whether they have hot and cold piped water in their dwelling unit (US
6 California Civil Code sect19411(a) deems dwellings ldquountenantablerdquo if they lack a water supply capable of producing hot and cold running water furnished to appropriate fixtures and connected to a sewage disposal system Likewise California Health and Safety Code sect179203 defines a substandard building as lacking hot and cold running water to plumbing fixtures in a dwelling unit or hotel
Sewer charges not billed by the utility Sewer charges are often levied through other means besides a utility bill such as through annual property taxes To our knowledge there is no centralized dataset of such charges
Fine-resolution method to calculate discretionary income The Customer Expenditure Survey provides fine-scale information on expenditures for the largest metropolitan areas For other areas the information is generally classified at the state or multi-state level It is possible to use regression models to account for regional variability (eg see Teodoro 2018) but this approach compromises the goal of ease of use and transparency
Data that disaggregate income and household size simultaneously Both income and household size impact affordability but American Community Survey data do not disaggregate both simultaneously preventing one from understanding the interaction between the two factors For example a household of one earning $30000 a year may not be burdened by the cost of water but a household earning a similar amount with seven members may be Generally analysts have looked at the variation in household income while assuming that all households are average or slightly above average size ignoring the interaction between income and household size
Costs to construct operate and maintain a Very Small System or septic system The capital costs of constructing operating and maintaining decentralized infrastructure are not often addressed in conversations around affordability nor are we aware of authoritative estimates of the costs The maintenance costs of decentralized systems while low on a per-month basis often arrive in lump sums that are difficult to pay for families with limited cash and credit For example drilling or deepening a well in the San Joaquin
Measuring Progress Toward Universal Access to Water and Sanitation in California 29
SuFFICIenT VOLuMe
There have been several attempts to quantify the amount of water required to meet basic human water needs in the international community One of the most commonly-cited figures is from Gleick (1996) which estimated that 13 GPCD was sufficient to provide a minimum standard for drinking sanitation bathing and food preparation The WHO (2015) suggests that a lesser amount (6-9 GPCD) is sufficient in the medium-term to meet basic needs Further UNDP (2006) recommends an additional 2 GPCD for personal consumption to account for the greater needs of lactating women We used a combination of Gleickrsquos estimates for sanitation bathing and food preparation plus the UNDPrsquos higher estimate for consumption to recommend 14 GPCD as meeting the Marginal standard for access to water in California These volumes while sufficient for survival nonetheless reflect an austere standard of living ndash for instance they would not accommodate the use of a flush toilet To develop the Moderate and Satisfactory standards for volume we looked to legal and observed precedents developed for indoor residential use in California
Various statutes regulations and government documents have suggested reasonable volumes for basic indoor use in California Specifically the State Water Boardrsquos resolution on the Human Right to Water (State Water Board 2016b) pointed to two precedents for estimating a reasonable maximum daily per capita human use the 55 GPCD ldquoprovisional indoor standardrdquo referred to in California Water Code sect1060820 and the 50 GPCD maximum for domestic use diversions filed in the California Code of Regulations (CCR) during the height of drought in 2014 (CCR sect8781)7 The 55 GPCD figure in the California Water Code was offered as a ldquoprovisional indoor standardrdquo when
7 CCR sect8781 was repealed in 2015
Census Bureau 2016) Consequently we defined Satisfactory water access as including hot and cold indoor piped water available 24 hours a day in sufficient volumes for an average Californian to use for drinking cooking cleaning and operating a flush toilet
For Moderate access we allow for hot and cold running water that is on the premises but either shared with other units or outdoors For example shared living situations such as SROs boat marinas and parks for vans and trailers typically offer shared access to piped hot and cold drinking water Moderate access should provide sufficient enough water to meet typical indoor needs for a house with indoor plumbing including a flush toilet Marginal access would constitute traveling some distance no more than half an hour round-trip to collect a minimum volume of water sufficient for cooking cleaning and modest sanitation needs such as flushing an efficient toilet two or three times a day
Estimating sufficient volume to meet essential indoor needs in a developed country was challenging We found that most existing estimates are based on volumes necessary for survival in short-term circumstances such as refugee camps On the other hand estimates of typical indoor use in California and the United States were generally not based on recent empirical data that separate leaks and outdoor irrigation from essential indoor uses of water In the following section we offer an empirical estimate of the amount of water needed for essential indoor uses In brief we recommend 43 GPCD as a reasonable volume of water to meet indoor needs in a building with indoor plumbing We incorporated the 43 GPCD figure into the Satisfactory and Moderate standards We suggest 14 GPCD as a volume sufficient to meet basic human needs in the short term and employ that figure for the Marginal standard
Measuring Progress Toward Universal Access to Water and Sanitation in California 30
basis for the volumes but 50 GPCD is a common benchmark for minimum indoor water use in the United States supported by US EPA work from the 1990s to estimate flows for sewer system design (Bowne Naret and Otis 1994)
We estimated a volume of water to meet Essential Indoor Uses (EIU) including to operate a shower or bath run a faucet wash dishes and clothes and flush a toilet We calculated indoor water requirements by determining the expected water use from each device in the home and summing the volumes We exclude water loss from household leaks The average water use for each appliance or fixture in California was based on data from the California Single Family Water Use Efficiency Study (DeOreo et al 2011) This study found that total indoor use (including leaks) was 58 GPCD although observed indoor use was highly variable with a standard deviation of 36 GPCD The study was conducted between 2006-2008 and we expect average indoor use to have declined since then as new high-efficiency devices have become more common in both new and existing homes Based on studies documenting a 09 annual decline in average indoor water use from the 2006-2008 period to 2016 (DeOreo et al 2016) we estimate that average indoor water use likely declined to slightly less than 10 from 2007 to 2018 from 47 to 43 GPCD (Table 9 detailed calculations in Appendix I Sufficient Water) Residents in California tend to use less water indoors than residents of other regions in North America For example residents of nine North American cities in the United States and Canada in 2016 still used slightly more water indoors than residents did a decade earlier in California (DeOreo et al 2016)
We also provide estimates of the water required to meet EIU for households with appliances that meet current state standards and leading-edge technology For these estimates we multiply
California adopted laws on water conservation in 2009 Based on an earlier study (Mayer et al 1999) California Department of Water Resources (DWR) estimated that baseline indoor use in California was 693 GPCD (DWR 2010a) A 20 reduction in per capita usage as required under Senate Bill 7x-7 would reduce indoor usage to 55 GPCD DWR recognized that the 55 GPCD indoor standard was arbitrary and committed to conduct a study to allow the legislature to re-evaluate the standard in 2016 (California Water Code sect1060820 DWR 2010b) To the best of our knowledge the eventual report to the legislature on the topic did not revisit the indoor standard (DWR 2017)
The 50 GPCD standard has a more enigmatic origin In their resolution adopting a maximum of 50 GPCD for domestic diversion the State Water Board noted that there were ldquodata indicating that basic human needs require between 37 and 50 gallons per person per dayrdquo (State Water Board 2015a) Without a citation it is difficult to infer the
Source Mshch iStock
A typical Californian requires 43 gallons a day for consumption cooking cleaning and to flush a toilet
Measuring Progress Toward Universal Access to Water and Sanitation in California 31
Table 9
Volume of Drinking Water to Meet Essential Indoor Uses
Use(s)
A B C D E
Adjusted Water Use in California Cities 2018
Observed Water Use in California Cities 2006-2008
California Standard Flow Rating
Leading Edge Technology Flow Rating
Observed Water Use in North American Cities 2016
Essential Indoor Use 43 47 37 24 49
Leaks 9 10 NA NA 8
Total Indoor Use 52 58 37 24 57
Notes Detailed calculations and additional estimates for average behavior are available in Online Appendix I worksheet ldquoSufficient Waterrdquo Tables B-D Units in gallons per capita day (GPCD) Observed Water Use for California and North American Cities (Cols B and E) are derived from residential end uses of water studies The Adjusted Water Use (Col A) is based on Col B with the assumption that per capita indoor water use declined by 9 annually from 2007-2018 Cols C and D are the product of observed water use behavior multiplied by California and leading-edge device flow ratings Numbers are rounded to the nearest whole number and may not sum to total because of rounding errors
Source Cols A and B from DeOreo et al 2016 Cols C and D are average indoor water use behavior from DeOreo et al 2011 multiplied by California 2018 flow rating standards and leading-edge technology flow ratings given in Online Appendix I Col E is observed residential end uses of water for cities in the United States and Canada
Table 10
Service Indicators and Performance Measures for Accessible Drinking Water in California
Goal Water should be available in sufficient volumes to meet domestic needs at hot and cold temperatures in a location near home at the times needed
Household-Level Service IndicatorHousehold-Level Performance Measure
Satisfactory Sufficient hot and cold indoor piped water reliably available 24 hours a day
At least 43 GPCD hot and cold indoor piped potable water available 24 hours a day
Moderate Sufficient hot and cold water from an improved source available on premises (indoors or outside) and reliably available 24 hours a day bottled or delivered water acceptable in some circumstances
At least 43 GPCD hot and cold piped potable water available on the premises 24 hours a day
Marginal Sufficient water from an improved source including bottled water or tanks of water delivered by truck provided collection time is not more than 30 minutes round-trip (including waiting time) and reliably available at least 12 hours a day
Improved potable water source providing at least 14 GPCD within 30 minutes round-trip of place of residence (including waiting time) available at least 12 hours a day
Unacceptable Water that does not meet at least the Marginal standards for access
Any one of the characteristics of Marginal access to water is not met
Notes The rationale for 43 GPCD as sufficient to meet Essential Indoor Uses is shown in Table 9 The figure of 14 GPCD for marginal access sums figures given in Gleick (1996) for sanitation services cooking and cleaning and bathing plus the figure given in UNDP (2006) as a minimum requirement for drinking Gleick states that 5 liters is a true minimum of drinking water to sustain life in moderate climatic conditions but UNDP (2006) states that the basic requirement for a lactating woman engaged in moderate physical activity is 75 liters a day We selected the higher number as a precaution
Serv
ice
Leve
l
Measuring Progress Toward Universal Access to Water and Sanitation in California 32
We recommend a number of ancillary metrics to consider not just current access to water but also long-term factors that may impact access
Water Supply Resilience While a household may have sufficient water in the short term its water supply may be vulnerable to drought and other natural disasters in the long term Indicators of supply resilience include
bullDrought Contingency Plan in Place Resilience for urban water suppliers can be evaluated based on the results of the Urban Water Management Plans submitted to California Department of Water Resources Urban water suppliers are defined as serving more than 3000 customers or supplying more than 3000 acre-feet of water annually Water systems below the size threshold to qualify as urban suppliers may develop drought contingency plans voluntarily DWR began a stakeholder process in 2015 to develop a county-wide drought contingency planning process to encompass small and medium water suppliers but this policy has not been finalized
bullHistory of Past Water Shortages Water shortages among public water systems have been tracked through several datasets Applications for Drought Assistance Funding (California State Water Board 2016e) Small Supplier Conservation Reports (California State Water Board 2016d) and Drought Vulnerability and Risk Assessments for Tribal Drinking Water Systems (Indian Health Services 2015) These three datasets were compiled for the 2012-2016 report Drought and Equity in California (Feinstein et al 2017) Water shortages in Very Small Systems have been tracked through voluntary reporting to counties and compiled statewide in the Household Water Supply Shortage Reporting System (State of California 2017)
average daily use rates for each device eg number of flushes per day from DeOreo et al (2011) by the flow rates of devices meeting current state standards and ultra-high efficiency devices Leaks in California households result in an average loss of 10 GPCD although we do not include leaks in the estimate of EIU Based on these assumptions we estimate that the water required for EIU is 37 GPCD and 24 GPCD for a household equipped with devices that meet current standards and cutting-edge technology respectively Upgraded devices could yield substantial improvements in water efficiency More efficient devices will continue to penetrate the market over time and new water-efficient technologies are regularly being developed
Based on available data we estimate that current EIU in California is 43 GPCD which is equivalent to 5 Centum Cubic Feet (CCF) per month for an average-sized household of 295 persons in California (US Census Bureau 2018) This is likely a somewhat generous estimate of EIU given that it is higher than what was observed for many cities during winter months in 2016 and 2017 (Outdoor irrigation is lower in the winter so residential usage during these months reflects mostly essential indoor uses plus leaks and winter outdoor irrigation) In February 2017 34 out of 409 urban water suppliers had a per capita residential usage of 43 GPCD or lower (Heberger 2018) This indicates that many Californians are already using 43 GPCD or less even when including leaks and some winter outdoor irrigation
AnCILLAry MeTrICS On ACCeSSIBLe DrInkInG WATer
One of the most challenging aspects of evaluating access to water is that it can fluctuate over time due to factors such as a shutoff for delinquent payment or long-term supply vulnerabilities
Measuring Progress Toward Universal Access to Water and Sanitation in California 33
home or rely on a very small water system that cannot consistently supply sufficient quantities of water Marginalized and disadvantaged communities are also typically the most difficult to count in surveys Persons with inadequate housing or water may avoid reporting problems because they fear repercussions such as eviction or deportation While American Community Survey and homeless Point-in-Time counts described in Table 10 provide a relatively robust overview of persons without adequate access to water by region of California they may undercount vulnerable persons
In terms of understanding water supply vulnerabilities we have information on shortages during the 2012-2016 drought which affected thousands of Very Small Systems and more than one hundred small to medium public water systems in the state (Feinstein et al 2017) The chief analytical challenge is projecting the likelihood of future supply shortages For Very Small Systems
bullGroundwater Levels and Trends Relative to Domestic Water Well Depth In over-drafted water basins groundwater levels are declining over the long term The trend may reverse during wet years but not enough to compensate for over drafting during dry periods Shallow domestic water wells are vulnerable to supply shortages as the groundwater level drops The Sustainable Groundwater Management Act should bring groundwater levels into equilibrium once the Groundwater Management Plans go into effect however it is unclear whether these plans will universally set groundwater levels above the depth of existing domestic wells An understanding of long-term trends in groundwater relative to the completion depths of domestic wells would provide an index of supply vulnerability by groundwater basin
bullUrban Water Supplier Reliability Urban water suppliers (water utilities serving more than 3000 customers or over 3000 acre-feet annually) report information on supply reliability under the California State Water Boardrsquos Emergency Urban Water Conservation Requirements as well as DWRrsquos Urban Water Management Plans
DATA SOurCeS On ACCeSSIBLe DrInkInG WATer
Table 11 describes data sources to inform the performance measures on accessible water Much of these data sources focus on the quality of housing which is a major determining factor in water access Other focus on water supply vulnerabilities either as reported in the past or projected in the future
DATA GAPS AnD AnALyTICAL ChALLenGeS FOr ACCeSSIBLe DrInkInG WATer
Persons with inadequate access to water typically reside in homes not built to code do not have a
Source InnaPoka iStock
Lack of indoor running water and toilets is closely linked to problems of poor-quality housing
Measuring Progress Toward Universal Access to Water and Sanitation in California 34
Table 11
Data Sources for Accessible Drinking Water Performance Measures
Description Collected By InformationGeographic Scale Significance
American Housing Survey (topics Equipment and Appliances Healthy Homes Housing Problems)
US Census Bureau
Source of water indoor plumbing fixtures water supply outages hot water availability
Statewide and select metro areas full geographic data in classified version
Household survey on source of water supply outages and nature of indoor plumbing fixtures
American Community Survey tables
US Census Bureau
Complete plumbing Census Tract Useful for understanding rates of housing with incomplete plumbing at a fairly fine geographic scale However results conflate lack of hot piped water lack of cold piped water lack of tub or shower and lack of toilet
American Community Survey Integrated Public Use Microdata Series
US Census Bureau
Hot and cold piped water bathshower toilet (discontinued in 2016)
Public Use Microdata Areas (103 counties)
Useful for understanding rates of housing units lacking hot and cold running water
Homeless point-in-time counts
US Housing and Urban Development
Annual counts of homeless persons
Continuums of Care (cities or counties)
Gives the number of homeless persons in an area
Household water shortages
California DWR Reports of household water shortages resulting from a dry well stream creek or other surface water supply
County Voluntary reporting of shortages for households supplied by very small systems
Water well completion reports
California DWR Well location completion depth perforation depth and intended use
Public Land Survey System sections (1 m2)
Perforated depths in conjunction with local groundwater level and trend can indicate likelihood of groundwater supply vulnerability
California Statewide Groundwater Elevation Monitoring
California DWR Groundwater depth over time Groundwater basin
In conjunction with well completion reports can indicate likelihood of groundwater supply vulnerability
Urban Water Management Plans
California DWR Projects future supply and demand describes drought contingency plan
Public Water System
Indicator of potential for future supply shortages
Safe Drinking Water Information System
California State Water Board
Type of water source (groundwater surface water) number of interties
Public Water System
Information on water sources for public water systems
Notes Additional details on data sources including links to online resources and update schedule are available in Online Appendix II
Measuring Progress Toward Universal Access to Water and Sanitation in California 35
incidence of water-borne diseases such as cholera bacillary dysentery Escherichia (E) coli infections viral hepatitis A and typhoid The advances made in the late 19th and early 20th centuries to remove bacteria from drinking water and provide access to sanitation systems are the principle reason that mortality rates dropped by around half in major cities in the United States during that period (Cutler and Miller 2005) Additionally improved sanitation and the associated reduction in disease burden is a prerequisite for humans to realize their full potential cognitive and physical development (Hammer and Spears 2016)
Today the public is often more preoccupied with drinking water contaminants stemming from industrial or agricultural pollution than from human waste Yet there is evidence of serious gaps and failures in Californiarsquos sanitation systems For example between September 2017 and January 2018 there was a Hepatitis A outbreak concentrated in San Diego and Los Angeles counties with 588 cases reported in San Diego and 42 in Los Angeles (County of Los Angeles Public Health 2018 San Diego County Health and Human Services Agency 2018)8 Hepatitis A is transmitted by oral contact with feces and is associated with a lack of proper sanitation and hygiene facilities or the failure to use those facilities properly such as not washing onersquos hands after changing a diaper or before preparing food (County of Los Angeles Department of Public Health 2017) The majority of those affected were homeless and transmission
8 By comparison 770 cases were reported annually in the state in 2013-2014 according to California Department of Public Healthrsquos database of infectious diseases
that are strictly reliant on groundwater it would be useful to bring together information on groundwater basin levels trends and well depths to predict locations where domestic wells are vulnerable to shortages For small and medium Public Water Systems too small to be required to develop Urban Water Management Plans and the associated drought contingency plans for DWR there is little information to understand and predict their supply resilience The Safe Drinking Water Information System offers some information about the primary type of water supply (ground versus surface water) and number of interties to other systems However this is insufficient to develop a strong understanding of the supply resilience of small- to medium-sized Public Water Systems
sanitatiOn indiCatOrs and PerFOrManCe Measures
The California Water Code states that ldquoevery human being has the right to safe clean affordable and accessible water adequate for human consumption cooking and sanitary purposesrdquo (California Water Code sect1063) The last phrase designates water for sanitary purposes ndash ie operating a toilet ndash as part of the Human Right to Water However the infrastructure required for sanitation ndash namely a toilet for hygienically separating a person from their waste and a system for safely treating and disposing of waste such as a connection to a centralized wastewater treatment plant or a functional septic tank ndash are not explicitly mentioned and have been treated as lower priorities by government programs and civil society organizations dedicated to improving access to water (see companion report by Cador and Salceda 2018 for more discussion on efforts to improve access to water and sanitation)
While the law is ambiguous sanitation and hygiene are essential to realizing the public health benefits of adequate water Sanitation reduces the
There is evidence of serious gaps and failures in Californiarsquos sanitation systems
Measuring Progress Toward Universal Access to Water and Sanitation in California 36
closely linked to inadequate housing conditions In 2015 there were 89000 Californians living in substandard housing without private indoor flush toilets (ACS 2015) Lack of indoor toilets is a particularly prevalent on Californiarsquos tribal lands (California Department of Housing and Community Development Rural Community Assistance Corporation and California Coalition for Rural Housing in press)
There are also problems with inadequate sanitation that arise at the stage of treatment and disposal Proper treatment and disposal (or reuse) of waste can be accomplished with onsite wastewater treatment systems such as septic tanks or by centralized municipal wastewater systems While there are no comprehensive data on the numbers or extent of inadequate treatment of human waste in California there are known incidents of improper treatment and leaks In 2014 and 2016 30 of 1967 California waterways were designated as impaired for fecal indicator bacteria under section 303(d) of the federal Clean Water Act (California State Water Board 2016a) Fecal indicator bacteria can originate from any warm-blooded animal and it is technically difficult to determine whether the source is human or another animal However at least some of the sources are human In the San Diego Bay watershed it has been established that humans are the main source of fecal indicator bacteria in the waterways though the precise leakage pathway is undetermined (Steele et al 2017) Sanitary sewer overflows ndash accidental releases of untreated or partially treated water from centralized wastewater systems ndash occur thousands of times each year in California with 3361 releases reported in 2017 (State Water Board 2018d) The City of Oakland has a particularly egregious history of large sewage spills accompanied by inadequate reporting and public notification (Canon 2018)
stemmed from open defecation and lack of handwashing facilities
Public health officials tend to prioritize water over sanitation and within the realm of sanitation to focus on the toilet to the exclusion of the waste treatment system However there is growing recognition that the benefits of improved drinking water are only fully realized when there is also access to improved sanitation (Lipson et al 2010) Additionally field studies have shown that toilets not connected to a treatment system offer little health benefit to the users (Null et al 2018 Luby et al 2018) Safe water a toilet a system for treating human waste and facilities and soap for handwashing are all necessary to reduce fecal pathogen contamination and a disease burden that limits human potential
Safe Sanitation
The goal for safe sanitation is that waste be separated from the person by a well-designed toilet and then safely transported treated and discharged to the environment Problems can arise at both stages if people lack clean and properly-designed toilets or because the toilet is not connected to a functioning sanitary system
Problems with unsafe sanitation stemming from the lack of a toilet or other improved facility (such as a latrine with a seat or platform) are
The goal for safe sanitation is that waste be separated from the person by a well-designed toilet and then safely transported treated and discharged to the environment
Measuring Progress Toward Universal Access to Water and Sanitation in California 37
reasonable estimates of the number of people with a satisfactory standard of service are available although gaps exist as is described further in the sections exploring data on clean sanitation below
Moderate sanitation is essentially the same as the Satisfactory standard but can be met by any improved facility including a pour-flush or non-flush toilet as long as the toilet separates a person from their waste and is connected to a system for treatment and disposal The Moderate standard is
The indicators for measuring safe sanitation are informed by variation in the quality of the toilet and the caliber of the treatment and disposal system (Table 12) Satisfactory sanitation consists of a flush toilet connected to a system that hygienically separates waste from human contact where waste is safely disposed of on-site or transported and treated off-site This is consistent with various California statutes and regulations California statutes on owner-occupied and rental housing require that residences have hot and cold water connected to ldquoappropriate fixturesrdquo and connected to a sewage disposal system (California Civil Code sect1941 Health and Safety Code sect179203) State plumbing regulations describe standards for flush toilets connected to a sanitary drainage system (CCR Title 24 Part 5) Data to make
Thirty percent of California waterways were impaired for fecal indicator bacteria in 2016
Table 12
Service Indicators and Performance Measures for Safe Sanitation in California
Goal A sanitation system should separate waste from human contact until it can be safely treated and released to the environment or reused
Household-Level Service IndicatorHousehold-Level Performance Measure
Satisfactory Flush toilet connected to a system that hygienically separates waste from human contact where waste is safely disposed of on-site or transported and treated off-site
Flush toilet connected to a well-maintained sewage system or an onsite wastewater treatment system
Moderate An improved facility that hygienically separates waste from human contact where waste is safely disposed of on-site or transported and treated off-site
Pit latrine improved pit latrine (pit latrine with a slab or ventilated pit latrine) or composting toilets connected to a sewage system or an onsite wastewater treatment system
Marginal An improved facility that hygienically separates waste from human contact
Flush toilet pit latrine improved pit latrine or composting toilet not connected to a functional sewage system or an onsite wastewater treatment system
Unacceptable Use of unimproved facilities or open defecation Pit latrines without a seat hanging latrines bucket latrines or open defecation
Notes Improved facilities safely separate a person from their waste and include flush toilets pour flush toilets and latrines with a platform or seat Unimproved facilities do not safely separate a person from their waste while using the toilet Septic systems are the most common type of Onsite Wastewater Treatment System (OWTS)
Serv
ice
Leve
l
Measuring Progress Toward Universal Access to Water and Sanitation in California 38
the State Water Board in their Interactive Sanitary System Overflow Report There is relatively little centralized information available on the maintenance and illegal discharges from OWTS There is no California statewide database of OWTS locations which are regulated by Local Area Monitoring Programs (LAMPs) Pursuant to the OWTS Policy adopted in 2012 the LAMPs are required to transmit information annually to the Regional Water Boards on complaints investigations and permit issues for new and replacement OWTSs (State Water Board 2012) Acquiring copies of this information requires filing requests with the Regional Water Boards we have not reviewed the data and have limited insight into the content of the datasets
DATA GAPS AnD AnALyTICAL ChALLenGeS FOr SAFe SAnITATIOn
Lack of granularity for information on quality of toilets in the home Both the American Community Survey and American Housing Survey collect information on toilets but there are some barriers to effective use of these data The principle challenge in evaluating information on the location and adequacy of OWTS is that the information is collected by LAMPs and transmitted to Regional Water Boards it is not aggregated for the state nor is it readily available online The information is far more decentralized and difficult to access than comparable information on safe drinking water Additionally the American Community Survey collected information on toilets in the home until 2015 but discontinued the question in 2016 due to privacy concerns
Accessible Sanitation
The goal for accessible sanitation is that toilets should be private located in the home safe to visit and available when needed Accessibility is tightly interrelated with questions of safety and
consistent with the JMP Safely Managed Standard Non-flush toilets are legal in California and standards for such ldquoalternate plumbing systemsrdquo are described in regulations (CCR Title 24 Part 5 Appendix C) but typically non-flush toilets are meant to supplement not replace an indoor flush toilet
Marginal sanitation is met by an improved facility not connected to a functional sewage system or Onsite Wastewater Treatment System (OWTS) such as a septic system Such systems separate the person from their waste in the moment but allow release of pathogens to the environment that raise the disease burden of the population Such sanitation systems are an improvement over open defecation but still represent an unacceptable risk to the environment
Unacceptable sanitation is characterized by the use of an unimproved facility such as a pit latrine without a seat or platform or open defecation While not common among persons with housing open defecation is a growing problem as the homeless population rises in California and has been a topic of vigorous debate in cities as diverse as Chico Sacramento San Francisco Los Angeles San Diego and Anaheim (Halverstadt 2017 Scharaga 2018 Street Sheet Staff 2017 Sacramento Bee Editorial Board 2018 Los Angeles Central Providers Collaborative 2017)
DATA SOurCeS FOr SAFe SAnITATIOn
Table 13 describes data sources to inform the performance measures on safe sanitation Households report whether they have a flush toilet in the home and information on whether they are connected to a centralized sewer or OWTS via the American Community Survey and American Housing Survey Information on discharges of inadequately treated wastewater from centralized municipal systems is tracked by
Measuring Progress Toward Universal Access to Water and Sanitation in California 39
According to the American Community Survey and the American Housing Survey between 995 and 100 of housing units in California had an indoor toilet in 2015 (US Census Bureau 2015b) Nonetheless there are some important regional differences in the rates of housing units without toilets with some counties reaching rates as high as 2 (Feinstein and Daiess in prep) Many of those reporting that they lack their own toilet likely have access to a shared facility
cleanliness addressed in the previous section But the focus in the access dimension is on the factors affecting usability of a toilet the number of people who share it its location and whether it is properly maintained and cleaned
As with the safety dimension of sanitation housing conditions are a major determining factor in access to sanitation The vast majority of homes in California have a flush toilet in the unit
Table 13
Data Sources for Safe Sanitation Performance Measures
Description Collected By InformationGeographic Scale Significance
American Housing Survey (topics Equipment and Appliances Healthy Homes Housing Problems)
US Census Bureau
Availability and functionality of indoor toilet type and functionality of sewer system
Statewide and select metro areas full geographic data in classified version
Household survey on nature of sanitation equipment sewage system (sanitary sewer OWTS or none) and recent breakdowns of the toilet and sewage system
American Community Survey tables
US Census Bureau
Complete plumbing Census Tract Useful for understanding number of housing units with incomplete plumbing at a fine geographic scale However results conflate lack of hot piped water lack of cold piped water lack of tub or shower and lack of toilet
American Community Survey Integrated Public Use Microdata Series
US Census Bureau
Hot and cold piped water bathshower toilet (discontinued in 2016)
Public Use Microdata Areas (vary from 1-3 counties)
Useful for understanding rates of housing units lacking indoor private flush toilets
Interactive Sanitary System Overflow Report
California State Water Board
Sanitary sewer overflows for permitted SSOs and private lateral sewage discharges
County Useful for identifying centralized sanitary sewers and private lateral connections that are discharging untreated human waste to the environment
Local Area Monitoring Programs (LAMPs) Onsite Wastewater Treatment System Permits
LAMPs and Regional Water Boards
Permits for Onsite Wastewater Treatment Systems (OWTS) impact of OWTSs on regional water quality
LAMP (usually a county)
Information on discharges to the environment of untreated wastewater from OWTS
Note Additional details on data sources including links to online resources and update schedule are available in Online Appendix II
Measuring Progress Toward Universal Access to Water and Sanitation in California 40
public agencies close public restrooms at night to reduce the potential that they will be used for illegal activity One report on access to toilets for the homeless living on Los Angelesrsquos Skid Row found that while there were 43 toilets open at peak daytime hours that number dropped to only 9 between the hours of 8 PM and 6 AM (Los Angeles Central Providers Collaborative 2017) Many of the open toilets were broken or lacked some basic feature such as a door or minimum cleanliness The same report also interviewed homeless women who avoided public bathrooms because approaching them made the women vulnerable to assault These problems are not restricted to Los Angeles For instance San Francisco touts the 22 restrooms Yet all the toilets close by 8 PM or earlier (San Francisco Public Works nd)
DATA SOurCeS FOr ACCeSSIBLe SAnITATIOn
Table 15 describes data sources to inform the performance measures on accessible sanitation For housing units with private toilets the American
For those who have a home problems arise either because the toilet breaks down or is shared with too many people and non-relatives (Box 4) In 2015 2 of households reported experiencing a period of at least six hours in the past three months when they had no working toilet (US Census Bureau 2015a see Housing Quality Table) Crowded living conditions and non-relatives sharing a home also present problems for access to sanitation Problems of inadequate numbers of toilets have been documented for low-income farmworkers in crowded housing and for inhabitants of SROs reliant on shared facilities (California Institute for Rural Studies 2018 SRO Families United Collaborative nd San Francisco DPH 2016)
While there are problems of access to sanitation facing some Californians with housing by far the most serious problems are experienced by the homeless community As noted above in the Safe Sanitation section homeless persons must regularly resort to using buckets or defecating in the open because of a lack of nearby public toilets (McGahan 2018 Green 2017 Walker 2017 Schneider 2018) There are also more subtle issues around access wherein a public toilet is available but is unusable for a multitude of reasons toilets become unusable or unclean because they are shared by many people are subject to careless treatment and vandalism lack doors for privacy or are insufficiently maintained But there are also problems that are unique to public toilets These include bathrooms occupied by people for unintended purposes or the problem that people especially women are physically vulnerable when they approach a public restroom Many
San Francisco touts its 22 public restrooms Yet all the toilets close by 8 PM or earlier
Source Diane Bentley Raymond iStock
Persons experiencing homelessness lack ready access to toilets which compromises their and the communityrsquos health
Measuring Progress Toward Universal Access to Water and Sanitation in California 41
Box 4
Shared Toilets Context and Controversies
Are shared toilet facilities an adequate solution for meeting the right to sanitation The answer depends on how well the facilities are managed Residences of group facilities such as dormitories with professional cleaning staff routinely share toilets without difficulties How well these facilities function depends on whether there are sufficient cleaning and maintenance resources and the number of people sharing a toilet Originally the JMP Sanitation Task Team recommended a benchmark which would consider households using facilities shared by no more than five families and no more than 30 people (taken as a proxy for adequate management) as having access to ldquobasicrdquo sanitation Ultimately JMP designated shared facilities as having ldquolimitedrdquo sanitation service due to a lack of data on households and people sharing facilities and insufficient evidence to demonstrate that there is a link between the number of people and households sharing a toilet and how well it is operated (Evans et al 2017)
Ultimately the question of whether a shared toilet is adequate for access to sanitation depends on whether it is hygienic well-maintained and available when needed Shared toilets do not always fail to meet these standards but regularly do In SROs and homeless shelters tenants routinely encounter toilets too dirty to use and must resort to chamber pots instead A 2016 survey by the San Francisco Department of Public Health of the cityrsquos SROs found more than 400 sanitation violations and 170 plumbing violations from 2008 to 2012 (SF DPH 2016) The department noted that exposure to diseases transmitted through feces are a ldquoreal hazardrdquo for SRO residents Local news media profiles vividly documented problems San Francisco residents of SROs and homeless shelters face when using the toilet
The Tan family ldquoThe Tans immigrated to San Francisco from Canton in 2011 They moved into this hotel a year later Life in the US is better than in China they say but life in the hotel isnrsquot easy Each of the two rooms in the apartment costs $900 per month There is one communal toilet per floor (shared by 15 families) and one communal kitchen In the morning itrsquos not uncommon to wait 20 minutes for the bathroom Sometimes the family uses a bucket in their room insteadrdquo (Lybarger 2014)
Clarence ldquoWith nowhere else to turn he got a bed in the Sanctuary a menrsquos shelter administered by Episcopal Community Services He describes it as lsquoa ward of broken men who coughed and cursed all night In the morning half a dozen would file into the bathroom and shit on everythingrsquordquo (Lybarger 2014)
Ivy Gao and her family ldquoTheir three-year-old son uses a chamber pot she says lsquoThe bathroom on our floor is too dirty so Irsquom reluctant to let him use it If we had our own house I could let him go to the bathroom without worryingrsquordquo (Kam 2015)
SROs and shelters can have clean safe shared toilets if they are well-maintained but given the well-documented shortfalls one cannot simply assume that physical access to a toilet ensures that it is in usable condition
Measuring Progress Toward Universal Access to Water and Sanitation in California 42
at very low frequency such as lack of a toilet However it does not contain the same level of detail on breakdowns and number of bathrooms per household as the American Housing Survey
DATA GAPS AnD AnALyTICAL ChALLenGeS FOr ACCeSSIBLe SAnITATIOn
Access to sanitation for homeless persons To our knowledge there is no centralized extensive dataset on sanitation access for this population San Francisco posts some disconnected datasets on the locations of public toilets operated by a variety of city agencies (San Francisco Public Works nd) but to the best of our knowledge most cities do not offer even that level of information A model for surveying availability of toilets for the homeless can be found in ldquoNo Place to Go An Audit of the Public Toilet Crisis in Skid Rowrdquo (Los Angeles Central Providers Collaborative 2017)
Housing Survey collects information on the number of toilets frequency of breakdowns and the number of people sharing a housing unit For units without their own toilet there is a follow-up question on the location of the toilet (under Interior Features variable ldquoBATHEXCLUrdquo) However the rate of households in California is so small ndash less than 05 - that the results do not report any units without a toilet in its sample of 12900 housing units statewide The dataset is useful for tracking more common problems such as the number of households that lacked a usable toilet recently because of breakdowns and the number of people sharing a bathroom
The American Community Survey is a larger survey reaching nearly 2 million California households over a 5-year period Consequently it is more useful for tracking problems that occur
Table 14
Service Indicators and Performance Measures for Accessible Sanitation in California
Goal Toilets should be private located in the home safe to visit and available when needed
Household-Level Service IndicatorHousehold-Level Performance Measure
Satisfactory Private secure well-maintained in-home facility not shared with other households available 24 hours a day
Household has 24-hour access to a functioning toilet not shared with other households
Moderate Private secure well-maintained on-site facility possibly shared with other households available 24 hours a day
Household has 24-hour access to a functioning toilet either in the structure (not necessarily in their unit for multi-unit buildings) or on the property with at least one toilet per 10 male residents plus one toilet per 8 female residents
Marginal Private secure well-maintained facility possibly shared with other households no more than 50 meters from home available 24 hours a day
Household has 24-hour access to a functioning toilet shared with no more than 20 people within 50 meters of their usual place of residence
Unacceptable Facility is more than 50 meters from home not available 24 hours a day or use of the facility compromises personal safety or privacy
Any one of the characteristics of Marginal access to sanitation is not met
Serv
ice
Leve
l
Measuring Progress Toward Universal Access to Water and Sanitation in California 43
Adequacy of shared toilets Given the format of data collection on group quarters and SROs with shared toilets we are left to assume that they are moderately accessible if they do not serve more than the appropriate number of people In practice that may be far from the case but we have little information on their condition outside of any Department of Public Health inspections that may have taken place
Table 15
Data Sources for Accessible Sanitation Performance Measures
Description Collected By InformationGeographic Scale Significance
American Housing Survey (topics Structural Demographics)
US Census Bureau
Number of persons bathrooms per household location of bathroom (in unit out of unit outdoors)
Statewide and select metro areas full geographic data in classified version
Useful for understanding number of persons per bathroom
American Community Survey microdata
US Census Bureau
Hot and cold piped water bathshower toilet (discontinued in 2016)
Public Use Microdata Areas (vary from 1-3 counties)
Useful for understanding rates of housing lacking hot and cold running water tubshower or toilet
American Community Survey tables
US Census Bureau
Complete plumbing Census Tract Useful for understanding rates of housing units with incomplete plumbing at a fine geographic scale However results conflate lack of hot piped water lack of cold piped water lack of tub or shower and lack of toilet
Note Additional details on data sources including links to online resources and update schedule are available in Online Appendix II
Source Phi2 iStock
Shared toilets should be used by no more than 20 people within 50 meters of their usual place of residence and available 24 hours a day
Measuring Progress Toward Universal Access to Water and Sanitation in California 44
bullAccessible Water Consider facets of location volume and availability over short and long time scales (ie both running 24 hours a day and resilient to drought and climate change) Update common assumptions about volumes of water used indoors to reflect declining use in California and recognize that this trend will continue as appliances and fixtures are replaced
bullSafe Sanitation Consider both the adequacy of the toilet facility as constructed and the functioning of the sanitary system which should include a centralized or on-site wastewater system that adequately treats and disposes of or recycles human waste
bullAccessible Sanitation Consider proximity privacy security cleanliness and maintenance If the toilet is shared consider whether the number of people using the toilet is below reasonable limits
recommendations on Developing a Unified Set of Metrics to Inform Policy
bullAdopt a single consistent set of indicators and performance measures and designate a single entity entrusted with regularly assessing those metrics Efforts by DWR to develop sustainable water management indicators as part of the California Water Plan the State Water Boardrsquos resolution directing staff to develop goals and performance measures as part of its Human Right to Water Portal and OEHHArsquos evaluation of the status of the Human Right to Water are all valuable efforts Each will be more useful if they are merged into a unified framework that is employed by all stakeholders in California The Governor should convene the appropriate cabinet secretaries to identify the lead responsible agency for assessing water and sanitation service
ConClUSIonS AnD reCoMMenDATIonS
This report offers a unified framework on how to measure progress toward universal access to water and sanitation in California The various indicators and performance measures are tightly linked and it is not useful to work toward any subset in isolation What use is affordable water if it is undrinkable What is the value of clean water if it is unreliable What benefit is it to provide a sanitation facility with no place to wash your hands or a toilet that is connected to a leaky sewage system But taken as a whole these service ladders offer a checklist of the many items that compose a fully-developed approach to adequate water and sanitation service at the household and individual level
The service ladders are themselves sets of recommendations for goals indicators and performance measures for the state to adopt Even for those who only use this report as a starting point rather than a template for their work there are general principles that can be used as guidelines for any attempt to measure water and sanitation in the state Below we make a series of recommendations on how to improve our understanding of water and sanitation service in California and use that knowledge to improve the quality of service
recommendations on Metrics
bullSafe Water When tracking compliance with the California SDWA consider duration and frequency of time out of compliance in a given time period
bullAffordable Water and Sanitation Consider water wastewater and the costs of basic non-water needs when calculating affordability and consider both regional- and household-scale metrics
Measuring Progress Toward Universal Access to Water and Sanitation in California 45
within service area boundaries that are not connected to centralized systems have an on-premises plumbing problem or lack shelter Regional-scale data are useful but it is important to acknowledge its limits and to supplement it with granular information at the individual and household level when available
bullRecognize sanitation as an essential component of the Human Right to Water Current statute recognizes a right to water for sanitary purposes but does not address the other components of sanitation a toilet for personal use and a system for safely treating and disposing of the waste Like safe and sufficient water sanitation is necessary to ensure human health prevent epidemics of water-borne diseases and safeguard the quality of drinking water resources Adequate water without sanitation is insufficient for meeting the overriding objective of preventing waterborne health threats from chemical contaminants and disease
bullMeasure water and sanitation services in non-residential settings Schools preschools and hospitals host high concentrations of people vulnerable to disease Ensuring the basics of clean water a functional sanitation facility and a place to wash onersquos hands are vital for the health and safety of children and the ill While this publication does not address institutional settings this is a clear next step for further investigation
recommendations on remedying key Data Gaps
bull Investigate quality of water delivered by Very Small Systems ie domestic wells Mapping these problems requires understanding the quality of source water as well as the treatment of the water by the well operator If the state
bullUse a unified set of water and sanitation performance measures to direct funds and resources to the most pressing problems The current approach to allocating funds to disadvantaged communities relies on local actors applying for resources it is unknown to what degree needs go unmet because local entities do not have the capacity to seek assistance Measuring a set of drinking water and sanitation performance measures regularly would yield detailed information on the number location and characteristics of those households with the greatest need for improved water and sanitation services Funds to address drinking water and sanitation problems such as the proposed Safe and Affordable Drinking Water Fund (SB 623 Monning) should use performance measure results to identify and reach out to communities that are likely eligible for assistance
recommendations on the Scope and Scale of Water and Sanitation Service Metrics
bullShift from using performance of centralized water and sanitation systems as exclusive proxies for the quality of service to also tally households and individuals that are not adequately served by large institutions The Human Right to Water implies the importance of considering water and sanitation for every person Yet for many indicators the best or only data available are collected at regional scales ndash often the Public Water System or centralized wastewater system While most people are served by these systems many of the people without adequate water and sanitation are not These are small disadvantaged and remote rural communities outside of service area boundaries or persons
Measuring Progress Toward Universal Access to Water and Sanitation in California 46
Medium and large community water systems should record when service disconnections are for units that are known to be occupied
bullCompile locally-held information on leaking septic systems or other onsite wastewater treatment systems Anecdotally community organizations working with disadvantaged communities report that they serve households with improperly maintained septic systems Information on permit violations is collected by local government entities and transmitted to the Regional Water Boards The State Water Board should compile this information in a single statewide electronic database to develop a greater understanding of wastewater problems in the state
bullRegional board stormwater permits should require municipalities to collect data on publicly-accessible toilets and handwashing facilities Given the well-established role of universal sanitation in preventing water pollution and disease public toilets and handwashing facilities should be regarded as a primary strategy to safeguard the quality of Californiarsquos waterways Yet resources to improve stormwater quality have focused on strategies to clean stormwater rather than prevent fecal matter from entering in the first place Regional Water Boards could alter this by placing greater emphasis on provision of public toilets to reduce fecal matter in stormwater The first step would be to systematically collect information on location usability hours of public toilets and proximity to homeless encampments
begins to offer more financial support for domestic well owners to test and treat their water the program may yield useful data
bull Identify Public Water Systems that persistently fail to deliver water that meets Safe Drinking Water Act standards In their present format it is difficult to use the Safe Drinking Water Information System and the Human Right to Water Portal to distinguish temporary one-time violations of the SDWA from long-term problems
bullMeasure how many Californians face trade-offs between paying their water bill and other necessary expenses and how often that trade-off results in long-term debt accumulation or service disconnections A regional-scale understanding of households likely to have difficulty paying their water bill can be gleaned from datasets on cost of living household income and local water rates though the data on water rates are not complete There is relatively little information however on the number of households who face difficulty paying their water bill and almost none on whether difficulties in paying water bills results in long-term debt accumulation or service disconnections
bullCollect information on service disconnections that distinguishes between occupied and unoccupied residences Community water systems typically track service disconnections but it is not possible to distinguish between occupied households that lose service for failure to pay and unoccupied households where residences simply neglected to notify the utility when they vacated their home Yet utilities are required to notify the occupants of a home before disconnecting service and also routinely receive communications from the occupants offering multiple opportunities to record whether the unit appears to be occupied
Measuring Progress Toward Universal Access to Water and Sanitation in California 47
eliminating these last inequities is long overdue mdash all the more so in comparison to the magnitude of the infrastructure we have constructed to transport and treat water for the vast majority of the statersquos residents But seen from another perspective the statersquos problems in ensuring universally adequate water and sanitation are surmountable We have the resources to bridge these last gaps in service With concerted effort the vision of universal water and sanitation for all Californians can be realized
recommendations for Policy Solutions to Address failures in Drinking Water and Sanitation Service
bullUse the Eligibility for Customer Assistance Program (ECAP) metric described in ldquoAncillary Performance Indicators for Affordable Water and Sanitationrdquo to qualify households for a water affordability assistance program The ECAP metric is relatively simple to calculate aligns with other well-established social service programs enrollment thresholds and addresses disparities in cost of living around the state
bullExpand CalFresh benefits to include soap for handwashing Lack of access to soap is a persistent problem among food-insecure families California has recently experimented with expanding CalFresh assistance by providing a supplementary drinking water benefit for customers of public water systems with unsafe drinking water (California 2017-18 Budget enacted June 2017) Adding soap to CalFresh benefits would be a relatively inexpensive way to ensure that low-income children obtain access to an essential component of hygiene
We live in a time of extraordinary progress toward reducing poverty worldwide Between 1990 and 2013 the number of extremely poor people globally fell by over a billion even as the worldrsquos population grew by more than one and a half billion (The World Bank nd) But the final steps of eradicating poverty are perennially plagued by the ldquolast mile problemrdquo the pace of progress slows as a society nears the goal of eliminating extreme poverty (Chandy et al 2015)
California is no exception Only a small percentage of Californiarsquos population lives without adequate water and sanitation yet progress toward
Measuring Progress Toward Universal Access to Water and Sanitation in California 48
American Community Survey (ACS) 2015 ldquo2011-2015 American Community Survey Public Use Microdata Samplesrdquo Downloaded from httpdoiorg1018128D010V60
Bowne William C Richard C Naret and Richard J Otis 1994 Alternative Wastewater Collection Systems Manual Washington DC EPA Office of Wastewater Enforcement and Compliance
Cador Kena C and Angeacutelica Salceda 2018 ldquoA Survey of Efforts to Achieve Universal Access to Water and Sanitation in Californiardquo American Civil Liberties Union (ACLU) of Northern California
California Building Standards Commission 2016 ldquoCalifornia Plumbing Coderdquo httpsupcodesviewercaliforniaca-plumbing-code-2016
California Department of Housing and Community Development Rural Community Assistance Corporation and California Coalition for Rural Housing in press ldquoTribal Housing Studyrdquo
California Institute for Rural Studies 2018 ldquoFarmworker Housing Study And Action Plan For Salinas Valley And Pajaro Valleyrdquo httpswwwcityofsalinasorgour-city-servicescommunity-developmentregional-farmworker-housing-study
Canon Gabrielle 2018 ldquoBroken Pipes Broken Systemrdquo httpswwweastbayexpresscomoaklandbroken-pipes-broken-systemContentoid=12464701
Chandy Laurence Hiroshi Kato and Homi Kharas ldquoThe Last Mile in Ending Extreme Povertyrdquo Brookings Institution Press July 20 2015 httpswwwbrookingsedubookthe-last-mile-in-ending-extreme-poverty
Code of Federal Regulations (CFR) 21 2017 httpswwwaccessdatafdagovscriptscdrhcfdocscfcfrCFRSearchcfmfr=165110
Christian-Smith J C Balazs Matthew Heberger and K Longley 2013 Assessing Water Affordability A Pilot Study in Two Regions of California Oakland Pacific Institute httpwwwpacinstorgwp-contentuploads201308assessing-water-affordabilitypdf
Cooley Heather and Rapichan Phurisamban 2017 ldquoThe Cost of Alternative Water Supply and Efficiency Options in Californiardquo httppacinstorgpublicationcost-alternative-water-supply-efficiency-options-california
County of Los Angeles Department of Public Health 2017 ldquoFrequently Asked Questions Hepatitis Ardquo httpwwwpublichealthlacountygovhealibrarytopicshepatitisCDCP-ACDC-0099-01pdf
County of Los Angeles Public Health 2018 ldquoHepatitis A Outbreakrdquo May 15 2018 httppublichealthlacountygovacdDiseasesHepAOBhtm
Cutler David and Grant Miller 2005 ldquoThe Role of Public Health Improvements in Health Advances The Twentieth-Century United Statesrdquo Demography 42 (1) 1ndash22
references
Measuring Progress Toward Universal Access to Water and Sanitation in California 49
Davis Jon P and Manuel P Teodoro 2014 ldquoFinancial Capability and Affordabilityrdquo In Water and Wastewater Finance and Pricing The Changing Landscape Fourth Edition edited by George Raftelis 443ndash66 CRC Press
DeOreo William B Peter Mayer Benedykt Dziegielewski and Jack Kiefer 2016 ldquoResidential End Uses of Water Version 2rdquo 4309 Water Research Foundation httpwwwwaterrforgPagesProjectsaspxPID=4309
DeOreo William B Peter W Mayer Leslie Martien Matthew Hayden Andrew Funk Michael Kramer-Duffield Renee Davis James Henderson Bob Raucher and Peter Gleick 2011 ldquoCalifornia Single-Family Water Use Efficiency Studyrdquo Aquacraft Water Engineering and Management Boulder Colorado USA httpwatercityofdavisorgMediaPublicWorksDocumentsPDFPWWaterDocumentsCalifornia-Single-Family-Home-Water-Use-Efficiency-Study-20110420pdf
Department of Social Services 2018 ldquoFrequently Asked Questions About CalFreshrdquo 2018 httpwwwcdsscagovinforesourcesCalFreshFAQs
Diringer Sarah Heather Cooley Matthew Heberger Rapichan Phurisamban Kristina Donnelly Andres Turner John McKibbin and Mary Ann Dickinson in press ldquoIntegrating Water Efficiency Standards and Codes into Long-Term Demand Forecastingrdquo Water Research Foundation Pacific Institute Institute for Sustainable Futures and Alliance for Water Efficiency
Donnelly K and J Christian-Smith 2013 An Overview of the ldquoNew Normalrdquo and Water Rates Basics Oakland Pacific Institute httpwwwpacinstorgpublicationwater-rates-series
Department of Water Resources (DWR) 2010a ldquoFourth Target Method Preliminary DWR Staff Assessment of Proposed Alternativesrdquo httpswatercagovLegacyFileswateruseefficiencysb7docsU420PreliminaryDWR20Staff20Assessment20Of20Proposed20Alternatives2011-16-10pdf
mdashmdashmdash 2010b ldquoMethodologies for Calculating Baseline and Compliance Urban Per Capita Water Use (For the Consistent Implementation of the Water Conservation Act of 2009)rdquo httpswwwwatercagovLegacyFileswateruseefficiencysb7docsmethodologies-urban-per-capita-water-use-10042010pdf
mdashmdashmdash 2014 ldquoCalifornians Without Safe Water and Sanitation California Water Plan Updaterdquo httpwwwwatercagovwaterplandocscwpu2013Finalvol4water_quality04Californians_Without_Safe_Water_Sanitationv2pdf
mdashmdashmdash 2017 ldquoStatus of 2015 Urban Water Management Plansrdquo httpwwwwatereducationorgsitesmainfilesfile-attachments2015_uwmp_leg_report_-_final_-9-22-17pdf
Editorial Board 2018 ldquoInaccessibility a Lawsuit in the Makingrdquo Chico News and Review May 10 2018
Evans Barbara Andreacutes Hueso Richard Johnston Guy Norman Eddy Peacuterez Tom Slaymaker and Sophie Treacutemolet 2017 ldquoLimited Services The Role of Shared Sanitation in the 2030 Agenda for Sustainable Developmentrdquo
Feeding America 2012 ldquoIn Short Supply American Families Struggle to Secure Everyday Essentialsrdquo httpwwwfeedingamericaorgresearchin-short-supply
Feinstein Laura and Gabriel Daiess in prep ldquoPlumbing the Depths An Analysis of Census Data on Running Water and Toilets in California 2011-2015rdquo
Feinstein Laura Rapichan Phurisamban and Amanda Ford 2017 ldquoDrought and Equity in Californiardquo Pacific Institute and Environmental Justice Coalition for Water httppacinstorgpublicationdrought-equity-california
Measuring Progress Toward Universal Access to Water and Sanitation in California 50
Gleick Peter H 1996 ldquoBasic Water Requirements for Human Activities Meeting Basic Needsrdquo Water International 21 (2) 83ndash92
Green Carla 2017 ldquoCalifornia City Confiscates Toilets from Homeless Residents ndash Forcing Them to Use Bucketsrdquo The Guardian September httpswwwtheguardiancomus-news2017sep08anaheim-homeless-toilets-confiscated-public-health-crisis
Halverstadt Lisa 2017 ldquoSan Diego Scrambles to Address Long-Festering Lack of Restroomsrdquo Voice of San Diego September 18 2017 httpswwwvoiceofsandiegoorgtopicsgovernmentsan-diego-scrambles-to-address-long-festering-lack-of-restrooms
Hammer Jeffrey and Dean Spears 2016 ldquoVillage Sanitation and Child Health Effects and External Validity in a Randomized Field Experiment in Rural Indiardquo Journal of Health Economics 48 135ndash48
Heberger Matthew 2018 ldquoCalifornia Urban Water Suppliers Water Use Map February 2017rdquo Pacific Institute January 2018
Heberger Matthew Donnelly Kristina and Heather Cooley 2016 ldquoA Community Guide for Evaluating Future Urban Water Demandrdquo Pacific Institute httppacinstorgwp-contentuploads201608A-Community-Guide-for-Evaluating-Future-Urban-Water-Demand-1pdf
Heller Leo 2015 ldquoAffordability of Water and Sanitation Services Report of the Special Rapporteur on the Human Right to Safe Drinking Water and Sanitationrdquo httpapohchrorgdocumentsdpage_easpxsi=AHRC3039
Hutton Guy 2012 ldquoMonitoring lsquoAffordabilityrsquo of Water and Sanitation Services After 2015 Review of Global Indicator Optionsrdquo Paper submitted to the United Nations Office of the High Commission for Human Rights httpswwwwssinfoorgfileadminuser_uploadresourcesEND-WASH-Affordability-Reviewpdf
Indian Health Services 2015 ldquoTribal Water Systems at High Risk Due to Drought Conditionsrdquo
Johnson TD and K Belitz 2015 ldquoLocation and Population Served by Domestic Wells in Californiardquo httpswwwsciencebasegovcatalogitem55ad2901e4b066a24924099b
Kam Katherine 2015 ldquoFamilies Live Jammed into Chinatown Rooms With No Hope of Leavingrdquo San Francisco Chronicle November 30 2015 httpwwwsfchroniclecombayareaarticleFamilies-live-jammed-into-Chinatown-rooms-with-6663902php
Kane Joseph 2016 ldquoInvesting in Water Comparing Utility Finances and Economic Concerns across US Citiesrdquo Brookings (blog) December 14 2016 httpswwwbrookingseduresearchinvesting-in-water-comparing-utility-finances-and-economic-concerns-across-u-s-cities
Karlamangla Soumya 2017 ldquoCaliforniarsquos Deadly Hepatitis A Outbreak Could Last Years Official Saysrdquo LA Times October 5 2017 httpwwwlatimescomlocalcaliforniala-me-ln-hepatitis-outbreaks-20171006-htmlstoryhtml
Lipson Jacob Leigh Anderson and Susan Bolton 2010 ldquoThe Public Health Benefits of Sanitation Interventionsrdquo Evans School of Public Affairs httpsevansuwedusitesdefaultfilesEvans_UW_Request_104_Public_Health_Benefits_of_Sanitation_November-10-2010_ft_0pdf
Los Angeles Central Providers Collaborative 2017 ldquoNo Place to Go An Audit of the Public Toilet Crisis in Skid Rowrdquo httpwwwinnercitylaworgwp-contentuploads201707No-Place-To-Go-finalpdf
Measuring Progress Toward Universal Access to Water and Sanitation in California 51
Luby Stephen P Mahbubur Rahman Benjamin F Arnold Leanne Unicomb Sania Ashraf Peter J Winch Christine P Stewart Farzana Begum Faruqe Hussain and Jade Benjamin-Chung 2018 ldquoEffects of Water Quality Sanitation Handwashing and Nutritional Interventions on Diarrhoea and Child Growth in Rural Bangladesh A Cluster Randomised Controlled Trialrdquo The Lancet Global Health 6 (3) e302ndash15
Lybarger Jeremy 2014 ldquoLife Inside SFrsquos Vanishing Single Resident Occupanciesrdquo July 9 2014 httpsthebolditaliccomlife-inside-sf-s-vanishing-single-resident-occupancies-the-bold-italic-san-francisco-20bf7aa0b3c8
Mack Elizabeth A and Sarah Wrase 2017 ldquoA Burgeoning Crisis A Nationwide Assessment of the Geography of Water Affordability in the United Statesrdquo PLoS ONE 12 (1) 1ndash19 httpsdoiorg101371journalpone0169488
Mayer Peter W William B DeOreo Eva M Opitz Jack C Kiefer William Y Davis Benedykt Dziegielewski and John Olaf Nelson 1999 ldquoResidential End Uses of Waterrdquo Subject Area Water Resources 241 AWWA Research Foundation and American Water Works Association
Mbuya M and J Humphrey 2016 ldquoPreventing Environmental Enteric Dysfunction through Improved Water Sanitation and Hygiene An Opportunity for Stunting Reduction in Developing Countriesrdquo httpswwwncbinlmnihgovpmcarticlesPMC5019251
McGahan Jason 2018 ldquoLiving Homeless in California Public Bathrooms and Other Miragesrdquo Capital and Main May 2018 httpscapitalandmaincomliving-homeless-in-california-public-bathrooms-and-other-mirages-0525
Moore Eli Eyal Matalon Carolina Balazs Jennifer Clary Laurel Firestone and Susana De Anda 2011 The Human Costs of Nitrate-Contaminated Drinking Water in the San Joaquin Valley Oakland California Pacific Institute httpwwwpacinstorgreportsnitrate_contamination
Moriarty Patrick Charles Batchelor Catarina Fonseca Amah Klutse Arjan Naafs Kwabena Nyarko Christelle Pezon Alana Potter Ratna Reddy and Mekala Snehalatha 2011 ldquoLadders for Assessing and Costing Water Service Deliveryrdquo IRC International Water and Sanitation Centre httpswwwresearchgatenetpublication228470692_Ladders_for_assessing_and_costing_water_service_delivery
Moulton Stephanie Danielle Harlow Olga Kondratjeva and Stephanie Casey Pierce 2016 ldquoImplementation and Impact Evaluation of Local Interventions for Financial Empowerment through Utility Payments (LIFT-UP)rdquo National League of Cities httpwwwnlcorgsitesdefaultfilesLIFT_UP20FINAL20REPORT_6-24-16pdf
NAPA 2017 ldquoDeveloping a New Framework for Community Affordability of Clean Water Servicesrdquo httpswwwnapawashorguploadsAcademy_StudiesNAPA_EPA_FINAL_REPORT_110117pdf
Null Clair Christine P Stewart Amy J Pickering Holly N Dentz Benjamin F Arnold Charles D Arnold Jade Benjamin-Chung Thomas Clasen Kathryn G Dewey and Lia CH Fernald 2018 ldquoEffects of Water Quality Sanitation Handwashing and Nutritional Interventions on Diarrhoea and Child Growth in Rural Kenya A Cluster-Randomised Controlled Trialrdquo The Lancet Global Health 6 (3) e316ndash29
Organization for Economic Co-operation and Development (OECD) 2003 ldquoSocial Issues in the Provision and Pricing of Water Servicesrdquo httpdxdoiorg1017879789264099890-en
Office of Environmental Health Hazard Assessment (OEHHA) 2017 ldquoCalEnviroScreen 30rdquo httpsoehhacagovmediadownloadscalenviroscreenreportces3reportpdf
Measuring Progress Toward Universal Access to Water and Sanitation in California 52
Organization of Economic Cooperation and Development (OECD) 2002 ldquoGlossary of Key Terms in Evaluation and Results Based Managementrdquo httpwwwoecdorgdevelopmentpeer-reviews2754804pdf
Sacramento Bee Editorial Board 2018 ldquoEverybody Poops Sacramento Must Make Sure Homeless People Can Do It in a Toiletrdquo March 19 2018 httpwwwsacbeecomopinioneditorialsarticle205930754html
San Diego County Health and Human Services Agency 2018 ldquoHepatitis A Outbreakrdquo January 2018 httpwwwsandiegocountygovcontentsdchhsaprogramsphscommunity_epidemiologydcHepatitis_Aoutbreakhtml
San Francisco Public Works nd ldquoSan Francisco Pit Stoprdquo Accessed August 8 2018 httpssfpublicworkswixsitecompitstop
Scharaga Ashiah 2018 ldquoLocked Outrdquo httpswwwnewsreviewcomchicolocked-outcontentoid=26224602
Schneider B 2018 ldquoThe Dirty Truth About San Franciscorsquos Sidewalksrdquo August 2018 httpswwwcitylabcomequity201808san-franciscos-sidewalk-poop-problem566621
Senate Office of Research 2015 ldquoThe Water We Drink Part I What Is California Doing To Ensure Its Water Is Saferdquo httpsorsenatecagovsitessorsenatecagovfilesFINAL20draft20Part20120Drinking20Waterpdf
San Francisco Department of Public Health (SF DPH) 2016 ldquoSingle Room Occupancy Hotels in San Francisco A Health Impact Assessment (Draft Version)rdquo httpswwwsfdphorgdphfilesoppSFDPH-SROHIA-FinalDraftv3pdf
SF Public Works nd ldquoPublic Toiletsrdquo Accessed April 6 2018 httpsfpublicworksorgservicespublic-toilets
SRO Families United Collaborative nd ldquo2015 SRO Families Report Living in the Margins An Analysis and Census of San Francisco Families Living in SROsrdquo httpwwwchinatowncdcorgimagesstoriesNewsEventsNewsletterssro_families_report_2015_pdf
State of California 2017 ldquoHousehold Water Supply Shortage Reporting Systemrdquo httpsmydrywatersupplywatercagovreportpublicpage
State Water Board 2012 ldquoOWTS Policy Water Quality Control Policy for Siting Design Operation and Maintenance of Insite Wastewater Treatment Systemsrdquo httpswwwwaterboardscagovwater_issuesprogramsowtsdocsowts_policypdf
mdashmdashmdash 2013 ldquoCommunities That Rely on a Contaminated Groundwater Source for Drinking Waterrdquo Report to the Legislature httpwwwwaterboardscagovgamaab2222docsab2222pdf
mdashmdashmdash 2015a ldquoResolution No 2015-0014rdquo httpswwwwaterboardscagovboard_decisionsadopted_ordersresolutions2015rs2015_0014pdf
mdashmdashmdash 2015b ldquoA Guide for Private Domestic Well Ownersrdquo httpswwwwaterboardscagovgamadocswellowner_guidepdf
mdashmdashmdash 2016a ldquoCalifornia 2014 and 2016 303(d) List - Excel Filerdquo httpswwwwaterboardscagovwater_issuesprogramstmdlintegrated2014_2016shtml
mdashmdashmdash 2016b ldquoResolution No 2016-0010 Adopting the Human Right to Water as a Core Value and Directing Its Implementation in Water Board Programs and Activitiesrdquo httpswwwwaterboardscagovboard_decisionsadopted_ordersresolutions2016rs2016_0010pdf
Measuring Progress Toward Universal Access to Water and Sanitation in California 53
mdashmdashmdash 2016c ldquoState of California Drinking Water State Revolving Fund and the Water Quality Supply and Infrastructure Improvement Act of 2014 Intended Use Planrdquo httpwwwwaterboardscagovboard_decisionsadopted_ordersresolutions2016final_dwsrf_iup_report_062116_with_coverpdf
mdashmdashmdash 2016d ldquoSmall Water Supplier Conservation Reportsrdquo httpdrinccagovdnnApplicationsDWPRepositoryaspx
mdashmdashmdash 2016e ldquoApplications for Drought Assistance Fundingrdquo httpwwwwaterboardscagovwater_issuesprogramsgrants_loanscaadw_droughtfund
mdashmdashmdash 2017 ldquoChromium-6 Drinking Water MCLrdquo httpswwwwaterboardscagovdrinking_watercertlicdrinkingwaterChromium6html
mdashmdashmdash 2018a ldquoHuman Right to Water Portalrdquo February 20 2018 httpswwwwaterboardscagovwater_issuesprogramshr2w
mdashmdashmdash 2018b ldquoLead Sampling of Drinking Water in California Schools Lab Resultsrdquo httpswwwwaterboardscagovdrinking_watercertlicdrinkingwaterleadsamplinginschoolshtml
mdashmdashmdash 2018c ldquo123-Trichloropropane (123 - TCP)rdquo httpswwwwaterboardscagovdrinking_watercertlicdrinkingwater123TCPhtml
mdashmdashmdash 2018d ldquoCIWQS Interactive Sanitary Sewer Overflows Reportrdquo httpsciwqswaterboardscagovciwqsreadOnlyPublicReportSSOServletreportAction=criteriaampreportId=sso_main
Steele Joshua John Griffith Rachel Noble and Kenneth Schiff 2017 ldquoTracking Human Fecal Sources In An Urban Watershed During Wet Weatherrdquo Southern California Coastal Water Research Project
Street Sheet Staff 2017 ldquoSan Francisco Needs to Provide Safe Dignified Bathrooms for Homeless Peoplerdquo httpwwwstreetsheetorgp=3323
Syed Sana Asad Ali and Christopher Duggan 2016 ldquoEnvironmental Enteric Dysfunction in Children A Reviewrdquo Journal of Pediatric Gastroenterology and Nutrition 63 (1) 6
Teodoro Manuel P 2018 ldquoMeasuring Household Affordability for Water and Sewer Utilitiesrdquo American Water Works Association 110 (1) httpsdoiorg105942jawwa20181100002
The World Bank nd ldquoPoverty Overviewrdquo 4112018 Accessed January 9 2018 httpwwwworldbankorgentopicpovertyoverview
UN General Assembly 2010 ldquoResolution 64292 The Human Right to Water and Sanitationrdquo httpwwwunorgescomundocssymbol=ARES64292amplang=E
United Nations Development Programme (UNDP) 2006 ldquoHuman Development Report 2006 Beyond Scarcity Power Poverty and the Global Water Crisisrdquo httpwwwundporgcontentdamundplibrarycorporateHDR200620Global20HDRHDR-2006-Beyond20scarcity-Power-poverty-and-the-global-water-crisispdf
United Nations High Commissioner for Refugees (UNHCR) 2018 ldquoEmergency Sanitation Standardrdquo httpsemergencyunhcrorgentry116007emergency-sanitation-standard
US Census Bureau 2015a ldquoAmerican Housing Surveyrdquo httpswwwcensusgovprograms-surveysahsdatainteractiveahstablecreatorhtmls_areas=a00006amps_year=s2015amps_tableName=Table15amps_byGroup1=a1amps_byGroup2=a1amps_filterGroup1=t1amps_filterGroup2=g1amps_show=SO
Measuring Progress Toward Universal Access to Water and Sanitation in California 54
mdashmdashmdash 2015b ldquoAmerican Housing Survey 2015 California Housing Qualityrdquo httpswwwcensusgovprograms-surveysahsdatainteractiveahstablecreatorhtmls_areas=a00006amps_year=s2015amps_tableName=Table5amps_byGroup1=a1amps_byGroup2=a1amps_filterGroup1=t1amps_filterGroup2=g1amps_show=S
mdashmdashmdash 2016 ldquoAmerican Community Survey 5-Year Estimates 2011 ndash 2015rdquo httpftp2censusgov
mdashmdashmdash 2017 ldquoQuick Facts Tulare County Californiardquo httpswwwcensusgovquickfactsfacttabletularecountycaliforniaPST045217
mdashmdashmdash 2018 ldquoQuickFacts Californiardquo httpswwwcensusgovquickfactsCA
US Conference of Mayors American Water Works Association and Water Environment Federation 2013 ldquoAssessing the Affordability of Federal Water Mandates An Issue Briefrdquo httpwwwawwaorgPortals0filesresourceswater20utility20managementaffordabilityAffordability-IssueBriefpdf
US Department of Housing and Urban Development 2016 ldquoThe 2016 Annual Homeless Assessment Report (AHAR) to Congressrdquo Office of Community Planning and Development httpswwwhudexchangeinforesourcesdocuments2016-AHAR-Part-1pdf
US Environmental Protection Agency (US EPA) 1997 ldquoGuidance for Financial Capability Assessment and Schedule Developmentrdquo httpswww3epagovnpdespubscsofcpdf
mdashmdashmdash 1998 ldquoVariance Technology Findings for Contaminants Regulated Before 1996rdquo httpsnepisepagovExeZyNETexe200021A9TXTZyActionD=ZyDocumentampClient=EPAampIndex =1995+Thru+1999ampDocs=ampQuery=ampTime=ampEndTime=ampSearchMethod=1ampTocRestrict=nampToc=ampTo cEntry=ampQField=ampQFieldYear=ampQFieldMonth=ampQFieldDay=ampIntQFieldOp=0ampExtQFieldOp=0ampXm lQuery=ampFile=D3A5Czyfiles5CIndex20Data5C95thru995CTxt5C000000125C200021A9txtampUs er=ANONYMOUSampPassword=anonymousampSortMethod=h7C-ampMaximumDocuments=1amp FuzzyDegree=0ampImageQuality=r75g8r75g8x150y150g16i425ampDisplay=hpframpDefSeekPage=xampSearch Back=ZyActionLampBack=ZyActionSampBackDesc=Results20pageampMaximumPages=1ampZyEntry=1ampSeek Page=xampZyPURL
mdashmdashmdash 2004 ldquoThe Standardized Monitoring Framework A Quick Reference Guiderdquo httpsnepisepagovExeZyPDFcgiDockey=3000667Ktxt
mdashmdashmdash 2005 ldquoHandbook for Managing Onsite and Clustered (Decentralized) Wastewater Treatment Systemsrdquo httpswwwepagovsitesproductionfiles2015-06documentsonsite_handbookpdf
mdashmdashmdash 2006 ldquoSmall Drinking Water Systems Variances ndash Revision of Existing National-Level Affordability Methodology and Methodology to Identify Variance Technologies That Are Protective of Public Healthrdquo Federal Register 71 (41)
mdashmdashmdash 2007 ldquoTalking to Your Customers About Chronic Contaminants in Drinking Water A Best Practices Guiderdquo httpsnepisepagovExeZyNETexe60000LWLTXTZyActionD=ZyDocumentampClient=EPAampIn dex=2006+Thru+2010ampDocs=ampQuery=ampTime=ampEndTime=ampSearchMethod=1ampTocRestrict=nampToc=ampTo cEntry=ampQField=ampQFieldYear=ampQFieldMonth=ampQFieldDay=ampIntQFieldOp=0ampExtQFieldOp=0ampXm lQuery=ampFile=D3A5Czyfiles5CIndex20Data5C06thru105CTxt5C000000015C60000LWLtxtampUs-er=ANONYMOUSampPassword=anonymousampSortMethod=h7C-ampMaximumDocuments=1amp FuzzyDegree=0ampImageQuality=r75g8r75g8x150y150g16i425ampDisplay=hpframpDefSeekPage=xampSearch Back=ZyActionLampBack=ZyActionSampBackDesc=Results20pageampMaximumPages=1ampZyEntry=1ampSeek Page=xampZyPURL
mdashmdashmdash 2016a ldquoNational Primary Drinking Water Regulationsrdquo httpswwwepagovsitesproductionfiles2016-06documentsnpwdr_complete_tablepdf
Measuring Progress Toward Universal Access to Water and Sanitation in California 55
mdashmdashmdash 2016b ldquoCalifornia Tribal Water Systems Datasetrdquo Dataset available upon request from US EPA Region 9
Walker Theresa 2017 ldquoPortable Toilets for Homeless Moved to Anaheim Site on Santa Ana River Trail but Likely to Be Moved Againrdquo May 16 2017 httpswwwocregistercom20170516non-permitted-portable-toilets-for-homeless-relocated-to-city-of-anaheim-site-at-santa-ana-river-trail-but-likely-to-be-moved-again-soon
World Health Organization (WHO) 2015 ldquoMinimum Water Quantity Needed for Domestic Usesrdquo httpeceuropaeuechofilesevaluationwatsan2005annex_filesWHOWHO520-20Minimum20water20quantity20needed20for20domestic20usepdf
WHO and United Nations Childrenrsquos Fund (UNICEF) 2017a Progress on Drinking Water Sanitation and Hygiene 2017 Update and SDG Baselines Geneva
mdashmdashmdash 2017b ldquoWASH in the 2030 Agenda New Global Indicators for Drinking Water Sanitation and Hygienerdquo httpwwwwhointwater_sanitation_healthmonitoringcoveragejmp-2017-wash-in-the-2030-agendapdfua=1
Wolff Gary and E Hallstein 2005 Beyond Privatization Restructuring Water Systems to Improve Performance Oakland CA Pacific Institute httppacinstorgpublicationwater-managers-must-look-beyond-privatization
Measuring Progress Toward Universal Access to Water and Sanitation in California 56
Appendices (online)
Appendix I California Service ladders for Measuring the human right to Water and Sanitation
Appendix II Data Sources for Performance Measures on Water and Sanitation
Appendices are available at httppacinstorgpublicationmeasuring-progress
PACIFICINSTITUTE
ISBN 978-1-893790-83-4
copy 2018 Pacific Institute All rights reserved
Pacific Institute 654 13th Street Preservation ParkOakland California 946125102511600 | infopacinstorgwwwpacinstorg

Measuring Progress Toward Universal Access to Water and Sanitation in California Defining Goals Indicators and Performance Measures
September 2018
Author
Laura Feinstein
ISBN 978-1-893790-83-4copy 2018 Pacific Institute All rights reserved
Cover Photo Source J Carl Ganter Circle of Blue | Designer Bryan Kring Kring Design Studio
PACIFICINSTITUTE
Pacific Institute 654 13th Street Preservation ParkOakland California 946125102511600 | infopacinstorgwwwpacinstorg
Measuring Progress Toward Universal Access to Water and Sanitation in California I
AboUT The PACIfIC InSTITUTe
The Pacific Institute envisions a world in which society the economy and the environment have the water they need to thrive now and in the future In pursuit of this vision the Institute creates and advances solutions to the worldrsquos most pressing water challenges such as unsustainable water management and use climate change environmental degradation food fiber and energy production for a growing population and basic lack of access to freshwater and sanitation Since 1987 the Pacific Institute has cut across traditional areas of study and actively collaborated with a diverse set of stakeholders including policymakers scientists corporate leaders international organizations such as the United Nations advocacy groups and local communities This interdisciplinary and nonpartisan approach helps bring diverse interests together to forge effective real-world solutions More information about the Institute and our staff directors and funders can be found at wwwpacinstorg
AboUT The AUThor
Laura Feinstein
Laura Feinstein joined Pacific Institute in 2016 as a Senior Researcher Laura conducts research on aquatic ecosystems the water-energy nexus and environmental health and justice Prior to joining the Pacific Institute she was a research scientist and project manager with the California Council on Science and Technology She also served as a Science and Technology Policy Fellow with the California Senate Committee on Environmental Quality and was a California Delta Science Fellow Laura holds a bachelorrsquos degree in Anthropology from the University of California Berkeley and a doctorate in Ecology from the University of California Davis
ACknoWleDGMenTS
This work was supported by a generous grant from the Conrad N Hilton Foundation
Sarah Diringer and Rapichan Phurisamban of Pacific Institute provided technical support on calculating water use for indoor needs Heather Cooley also at Pacific Institute provided extensive editorial input
A number of peer reviewers provided comments that greatly improved this work Kena Cador and Angeacutelica Salceda of the American Civil Liberties Union Foundation of Northern California Peter Gleick of Pacific Institute Gregory Pierce of Luskin Center for Innovation at UCLA Carolina Balazs of the Office of Environmental Health Hazard Assessment Jessica Goddard of UC Berkeley Max Gomberg and Elizabeth Haven of the California State Water Resources Control Board and Larry Levine of Natural Resources Defense Council Tedde Simon of the American Civil Liberties Union Foundation of Northern California interviewed and wrote the profiles of community members Maricela Alatorre and Horacio Amezquita generously shared their personal experiences of living in communities without safe water Brendan McLaughlin copy edited the report while Rebecca Olson helped guide it through its final stages
Measuring Progress Toward Universal Access to Water and Sanitation in California II
exeCUTIve SUMMAry
Most people in California take for granted the water and sanitation in their homes They turn the tap and clean
relatively inexpensive abundant water flows out They flush the toilet and waste vanishes
Yet there are communities in California who do not have these basic necessities in their homes In January 2018 over half a million Californians were served by water utilities that were out of compliance with the Safe Drinking Water Act (SDWA) The worst outbreak of Hepatitis A in recent memory occurred in 2016-2018 due to open defecation and lack of handwashing facilities for persons experiencing homelessness Californiarsquos tribes continue to face problems of poor housing and water and sanitation service with two-thirds of tribal communities reporting inadequate home plumbing in 20151 And the cost of water has increased for many particularly among small and medium size systems with 39 community water systems in the state charging more than $100 a month for 12 CCF of water 2
In response to the problem California enacted the Human Right to Water in 2012 declaring that ldquoEvery human being has the right to safe
1 California Department of Housing and Community Development Rural Community Assistance Corporation and California Coalition for Rural Housing ldquoTribal Housing Studyrdquo in press
2 CA Water Board ldquoWater System Electronic Annual Reportsrdquo 2015
clean affordable and accessible water adequate for human consumption cooking and sanitary purposesrdquo
The California State Water Resources Control Board (State Water Board) further recognized the need to address water and sanitation for disadvantaged communities when it adopted a resolution directing staff to ldquodevelop performance measures for the evaluation of the boardrsquos progress towards the realization of the human right to water evaluate that progress and explore ways to
Source J Carl Ganter Circle of Blue
Vicente Tapia filling buckets of water to bring home when his well ran dry during the 2012-2017 drought
Measuring Progress Toward Universal Access to Water and Sanitation in California III
This report offers a unified framework on how to measure progress toward universal access to water and sanitation in California Tables ES-1 and ES-2 provide an overview of goals and qualitative service indicators while quantitative performance measures can be found in the body of the report These service ladders offer a checklist of the numerous and disparate components of a
make that information more readily available to the publicrdquo and to ldquowork withhellip stakeholders to develop new or enhance existing systems to collect the data needed to identify and track communities that do not have or are at risk of not having safe clean affordable and accessible water adequate for human consumption cooking and sanitary purposesrdquo
Table ES-1
Overview of Drinking Water Service Ladder for California ndash Goals and Service Indicators
Safe Affordable Accessible
Goal Chemicals regulated by state and federal SDWA standards should be consistently below levels that pose a significant risk to health
Cost of essential water and sanitation should be inexpensive enough that cost does not prevent access nor interfere with other essential expenditures
Water should be available in the home in sufficient volumes to meet domestic needs at hot and cold temperatures at the times needed
Satisfactory Water has met state and federal SDWA standards for Public Water Systems for the past three years
Household can afford safe accessible water without facing tradeoffs with other essential expenditures
Sufficient hot and cold indoor piped water reliably available 24 hours a day
Moderate Water has met state and federal SDWA standards for Public Water Systems for the vast majority of time in the past three years
Sufficient hot and cold water from an improved source available on premises (indoors or outside) and reliably available 24 hours a day bottled or delivered water acceptable in some circumstances
Marginal Water meets standards set by US Food and Drug Administration is treated by Point of UseEntry filter that meets California Title 22 regulations or meets voluntary domestic well guidelines
Household ocassionally cannot afford safe accessible water without facing tradeoffs with other essential expenditures
Sufficient water from an improved source including bottled water or tanks of water delivered by truck provided collection time is not more than 30 minutes round-trip (including waiting time) and reliably available at least 12 hours a day
Unacceptable Drinking water quality that is not regularly tested and verified as meeting at least the Marginal standard for safety
Household regularly cannot afford safe accessible water without facing tradeoffs with other essential expenditures
Water that does not meet at least the Marginal standards for access
Notes Drinking water refers to water for indoor domestic purposes consumption cooking cleaning laundry personal hygiene and sanitation (operating a toilet) It does not include the treatment and disposal of wastewater which is covered in the sanitation service ladder Improved sources of water are piped running water protected wells protected springs and rainwater Discretionary income is income minus all essential expenses but water housing health care food energy child care essential transportation and taxes SDWA - Safe Drinking Water Act
Serv
ice
Indic
ato
r
Measuring Progress Toward Universal Access to Water and Sanitation in California IV
point rather than a template for their work there are general principles that can be used as guidelines for any attempt to measure water and sanitation in the state Below we make a series of recommendations on how to improve our understanding of water and sanitation service in California and use that knowledge to improve the quality of service
fully-developed approach to tracking adequate water and sanitation service at the household and individual level
The service ladders are themselves sets of recommendations for goals indicators and performance measures for the state to adopt Even for those who only use this report as a starting
Table ES-2
Service Ladder for Adequate Sanitation in California ndash Overview of Goals and Service Indicators
Safe Affordable Accessible
Goal A sanitation system should separate waste from human contact until it can be safely treated and released to the environment or reused
Sanitation should be inexpensive enough that cost does not prevent access nor interfere with other essential expenditures
Toilets should be private located in the home safe to visit and available when needed
Satisfactory Flush toilet connected to a system that hygienically separates waste from human contact where waste is safely disposed of on-site or transported and treated off-site
Household can afford safe accessible sanitation without facing tradeoffs with other essential expenditures
Private secure well-maintained in-home facility not shared with other households available 24 hours a day
Moderate An improved facility that hygienically separates waste from human contact where waste is safely disposed of on-site or transported and treated off-site
Private secure well-maintained on-site facility possibly shared with other households available 24 hours a day
Marginal An improved facility that hygienically separates waste from human contact
Household ocassionally cannot afford safe accessible sanitation without facing tradeoffs with other essential expenditures
Private secure well-maintained facility possibly shared with other households no more than 50 meters from home available 24 hours a day
Unacceptable Use of unimproved facilities or open defecation
Household regularly cannot afford safe accessible sanitation without facing tradeoffs with other essential expenditures
Facility is more than 50 meters from home not available 24 hours a day or use of the facility compromises personal safety or privacy
Notes Sanitation refers to the physical structure of a toilet and the infrastructure and management for safe disposal of human waste and wastewater Improved sanitation facilities refer to equipment that hygienically separates waste from human contact such as flush toilets pit latrines and composting toilets
Serv
ice
Indic
ato
r
Measuring Progress Toward Universal Access to Water and Sanitation in California V
the State Water Boardrsquos resolution directing staff to develop goals and performance measures as part of its Human Right to Water Portal and the Office of Environmental Health Hazard Assessmentrsquos evaluation of the status of the Human Right to Water are all valuable efforts Each will be more useful if they are merged into a unified framework that is employed by all stakeholders in California The Governor should convene the appropriate cabinet secretaries to identify the lead responsible agency for assessing water and sanitation service
bullUse a unified set of water and sanitation performance measures to direct funds and resources to the most pressing problems The current approach to allocating funds to disadvantaged communities relies on local actors applying for resources it is unknown to what degree needs go unmet because local entities do not have the capacity to seek assistance Measuring a set of drinking water and sanitation performance measures regularly would yield detailed information on the number location and characteristics of those households with the greatest need for improved water and sanitation services Funds to address drinking water and sanitation problems such as the proposed Safe and Affordable Drinking Water Fund (SB 623 Monning) should use performance measure results to identify and reach out to communities that are likely eligible for assistance
recommendations on the Scope and Scale of Water and Sanitation Service Metrics
bullShift from using performance of centralized water and sanitation systems as exclusive proxies for the quality of service to also tally households and individuals that are not
recommendations on Metrics
bullSafe Water When tracking compliance with the California Safe Drinking Water Act consider duration and frequency of time out of compliance in a given time period
bull Affordable Water and Sanitation Consider water wastewater and the costs of basic non-water needs when calculating affordability and consider both regional- and household-scale metrics
bullAccessible Water Consider facets of location volume and availability over short and long time scales (ie both running 24 hours a day and resilient to drought and climate change) Update common assumptions about volumes of water used indoors to reflect declining use in California and recognize that this trend will continue as appliances and fixtures are replaced
bullSafe Sanitation Consider both the adequacy of the toilet facility as constructed and the functioning of the sanitary system which should include a centralized or on-site wastewater system that adequately treats and disposes of or recycles human waste
bullAccessible Sanitation Consider proximity privacy security cleanliness and maintenance If the toilet is shared consider whether the number of people using the toilet is below reasonable limits
recommendations on Developing a Unified Set of Metrics to Inform Policy
bullAdopt a single consistent set of indicators and performance measures and designate a single entity entrusted with regularly assessing those metrics Efforts by the California Department of Water Resources to develop sustainable water management indicators as part of the California Water Plan
Measuring Progress Toward Universal Access to Water and Sanitation in California VI
this publication does not address institutional settings this is a clear next step for further investigation
recommendations on remedying key Data Gaps
bull Investigate quality of water delivered by Very Small Systems ie domestic wells Mapping these problems requires understanding the quality of source water as well as the treatment of the water by the well operator If the state begins to offer more financial support for domestic well owners to test and treat their water the program may yield useful data
bull Identify Public Water Systems that persistently fail to deliver water that meets Safe Drinking Water Act standards In their present format it is difficult to use the Safe Drinking Water Information System and the Human Right to Water Portal to distinguish temporary one-time violations of the Safe Drinking Water Act from long-term problems
bullMeasure how many Californians face trade-offs between paying their water bill and other necessary expenses and how often that trade-off results in long-term debt accumulation or service disconnections A regional-scale understanding of households likely to have difficulty paying their water bill can be gleaned from datasets on cost of living household income and local water rates though the data on water rates are not complete There is relatively little information however on the number of households who face difficulty paying their water bill and almost none on whether difficulties in paying water bills results in long-term debt accumulation or service disconnections
adequately served by large institutions The Human Right to Water implies the importance of considering water and sanitation for every person Yet for many indicators the best or only data available are collected at regional scales ndash often the Public Water System or centralized wastewater system While most people are served by these systems many of the people without adequate water and sanitation are not These are small disadvantaged and remote rural communities outside of service area boundaries or persons within service area boundaries that are not connected to centralized systems have an on-premises plumbing problem or lack shelter Regional-scale data are useful but it is important to acknowledge its limits and to supplement it with granular information at the individual and household level when available
bullRecognize sanitation as an essential component of the Human Right to Water Current statute recognizes a right to water for sanitary purposes but does not address the other components of sanitation a toilet for personal use and a system for safely treating and disposing of the waste Like safe and sufficient water sanitation is necessary to ensure human health prevent epidemics of water-borne diseases and safeguard the quality of drinking water resources Adequate water without sanitation is insufficient for meeting the overriding objective of preventing waterborne health threats from chemical contaminants and disease
bullMeasure water and sanitation services in non-residential settings Schools preschools and hospitals host high concentrations of people vulnerable to disease Ensuring the basics of clean water a functional sanitation facility and a place to wash onersquos hands are vital for the health and safety of children and the ill While
Measuring Progress Toward Universal Access to Water and Sanitation in California VII
on strategies to clean stormwater rather than prevent fecal matter from entering in the first place Regional Water Boards could alter this by placing greater emphasis on provision of public toilets to reduce fecal matter in stormwater The first step would be to systematically collect information on location usability hours of public toilets and proximity to homeless encampments
recommendations for Policy Solutions to Address failures in Drinking Water and Sanitation Service
bullUse the Eligibility for Customer Assistance Program (ECAP) metric described in ldquoAncillary Performance Indicators for Affordable Water and Sanitationrdquo to qualify households for a water affordability assistance program The ECAP metric is relatively simple to calculate aligns with other well-established social service programs enrollment thresholds and addresses disparities in cost of living around the state
bullExpand CalFresh benefits to include soap for handwashing Lack of access to soap is a persistent problem among food-insecure families California has recently experimented with expanding CalFresh assistance by providing a supplementary drinking water benefit for customers of public water systems with unsafe drinking water (California 2017-18 Budget enacted June 2017) Adding soap to CalFresh benefits would be a relatively inexpensive way to ensure that low-income children obtain access to an essential component of hygiene
We live in a time of extraordinary progress toward reducing poverty worldwide Between 1990 and 2013 the number of extremely poor people globally fell by over a billion even as the
bullCollect information on service disconnections that distinguishes between occupied and unoccupied residences Community water systems typically track service disconnections but it is not possible to distinguish between occupied households that lose service for failure to pay and unoccupied households where residences simply neglected to notify the utility when they vacated their home Yet utilities are required to notify the occupants of a home before disconnecting service and also routinely receive communications from the occupants offering multiple opportunities to record whether the unit appears to be occupied Medium and large community water systems should record when service disconnections are for units that are known to be occupied
bullCompile locally-held information on leaking septic systems or other onsite wastewater treatment systems Anecdotally community organizations working with disadvantaged communities report that they serve households with improperly maintained septic systems Information on permit violations is collected by local government entities and transmitted to the Regional Water Quality Control Boards (Regional Water Boards) The State Water Board should compile this information in a single statewide electronic database to develop a greater understanding of wastewater problems in the state
bullRegional Water Board stormwater permits should require municipalities to collect data on publicly-accessible toilets and handwashing facilities Given the well-established role of universal sanitation in preventing water pollution and disease public toilets and handwashing facilities should be regarded as a primary strategy to safeguard the quality of Californiarsquos waterways Yet resources to improve stormwater quality have focused
Measuring Progress Toward Universal Access to Water and Sanitation in California VIII
worldrsquos population grew by more than one and a half billion3 But the final steps of eradicating poverty are perennially plagued by the ldquolast mile problemrdquo the pace of progress slows as a society nears the goal of eliminating extreme poverty4
California is no exception Only a small percentage of Californiarsquos population lives without adequate water and sanitation yet progress toward eliminating these last inequities is long overdue mdash all the more so in comparison to the magnitude of the infrastructure we have constructed to transport and treat water for the vast majority of the statersquos residents But seen from another perspective the statersquos problems in ensuring universally adequate water and sanitation are surmountable We have the resources to bridge these last gaps in service With concerted effort the vision of universal water and sanitation for all Californians can be realized
3 The World Bank ldquoPoverty Overviewrdquo 4112018 Accessed January 9 2018 httpwwwworldbankorgentopicpovertyoverview
4 Chandy Laurence Hiroshi Kato and Homi Kharas ldquoThe Last Mile in Ending Extreme Povertyrdquo Brookings Institution Press July 20 2015 httpswwwbrookingsedubookthe-last-mile-in-ending-extreme-poverty
Measuring Progress Toward Universal Access to Water and Sanitation in California IX
Contentsabout the Pacific institute Iabout the author Iacknowledgments lexecutive summary llacronyms and abbreviations XIGlossary XIIintroduction 1
Motivating Questions Approach and Outcomes 5Comparing Joint Monitoring Programme Standards to California Context 7Service Ladders Defining Goals and Indicators 8Service Ladders Indicators and Performance Measures 11Sanitation Indicators and Performance Measures 35
Conclusions and recommendations 44references 48appendices (Online) 56
BOXeS
Box 1 The Human Right to Water in Disadvantaged Communities Interview With
Horacio Amezquita General Manager San Jerardo Cooperativa 4
Box 2 What About Hygiene 11
Box 3 Living Without Safe Water Interview With Maricela Mares-Alatorre Community Organizer Kettleman City 15
Box 4 Shared Toilets Context and Controversies 41
FIGureS
Figure 1 Joint Monitoring Programme (JMP) Service Ladders on Water Sanitation and Hygiene 3
Figure 2 Structure of Water and Sanitation Service Ladders 6
TABLeS
Table ES-1 Overview of Drinking Water Service Ladder for California ndash Goals and Service Indicators III
Table ES-2 Service Ladder for Adequate Sanitation in California ndash Overview of Goals and Service Indicators IV
Table 1 Overview of Drinking Water Service Ladder for California ndash Goals and Service Indicators 9
Table 2 Service Ladder for Adequate Sanitation in California ndash Overview of Goals and Service Indicators 10
Measuring Progress Toward Universal Access to Water and Sanitation in California X
Table 3 Service Indicators and Performance Measures for Safe Drinking Water in California 16
Table 4 Data Sources for Safe Drinking Water Performance Measures 17
Table 5 ldquoAffordablerdquo Drinking Water Bills According to Three Metrics for Three Representative Counties 22
Table 6 Household-Level Service Indicators and Performance Measures for
Affordable Drinking Water and Sanitation in California 24
Table 7 System-Level Service Indicators and Performance Measures for
Affordable Drinking Water and Sanitation in California 25
Table 8 Data Sources for Affordable Water and Sanitation Performance Measures 26
Table 9 ldquoAffordablerdquo Drinking Water Bills According to Three Metrics for Three Representative Counties 31
Table 10 Service Indicators and Performance Measures for Accessible Drinking Water in California 31
Table 11 Data Sources for Accessible Drinking Water Performance Measures 34
Table 12 Service Indicators and Performance Measures for Safe Sanitation in California 37
Table 13 Data Sources for Safe Sanitation Performance Measures 39
Table 14 Service Indicators and Performance Measures for Accessible Sanitation in California 42
Table 15 Data Sources for Accessible Sanitation Performance Measures 43
Measuring Progress Toward Universal Access to Water and Sanitation in California XI
CCF ndash Centum (Hundred) Cubic Feet
CCR ndash California Code of Regulations
CFR ndash Code of Federal Regulations
DWR ndash Department of Water Resources
EIU ndash Essential Indoor Use
FPL ndash Federal Poverty Line
GPCD ndash Gallons Per Capita Day
HHS ndash Health and Human Services
HUD ndash Housing and Urban Development
JMP ndash Joint Monitoring Programme
LAMP ndash Local Area Monitoring Program
MCL ndash Maximum Contaminant Level
NPDES - National Pollutant Discharge Elimination
OEHHA ndash Office of Environmental Health Hazard Assessment
OWTS ndash Onsite Wastewater Treatment Systems
PHG ndash Public Health Goal
PWS ndash Public Water Systems
SDGs ndash Sustainable Development Goals
SDWA ndash Safe Drinking Water Act
SRO ndash Single Resident Occupancies
TT ndash Treatment Technique
UNICEF - United Nations Childrenrsquos Fund
US EPA ndash United States Environmental Protection Agency
VLI ndash Very Low Income
WASH ndash Water Sanitation and Hygiene
WHO ndash World Health Organization
ACronyMS AnD AbbrevIATIonS
Measuring Progress Toward Universal Access to Water and Sanitation in California XII
GloSSAry
key Terms in California Water Governance
Public Water Systems (PWS) ndash All domestic water suppliers large enough to be regulated under the California Safe Drinking Water Act A Public Water System serves 15 or more connections or at least 25 individuals at least 60 days out of the year (California Health and Safety Code sect116275(h)) The term encompasses both publicly-owned utilities (commonly referred to as municipal systems) and privately-owned utilities
There are three categories of Public Water Systems
bullCommunity Water Systems ndash Public Water Systems that serve at least 15 connections used by year-long residents or at least 25 year-long residents (California Health and Safety Code sect116275(i)) Tribal Water Systems are Community Water Systems that serve a federally recognized tribe and consequently are regulated by the United States Environmental Protection Agency rather than the California State Water Resources Control Board (State Water Board) Community Water Systems serve about 96 of Californians of which less than 1 receive water from a Tribal Water System (State Water Board 2013 US EPA 2016b)
bullTransient Non-Community Water Systems ndash Public Water Systems that deliver water to places where there are few or no long-term residents or consistent visitors such as parks motels and campgrounds Do not regularly serve at least 25 of the same persons over six months per year (California Health and Safety Code sect116275(o))
bullNon-Transient Non-Community Water Systems ndash Public Water Systems that deliver water to places where the same people visit regularly but do not reside there such as schools and workplaces Serve at least 25 of the same persons over six months per year (California Health and Safety Code sect116275(k)
Very Small Systems ndash All domestic water systems too small to be regulated under the Safe Drinking Water Act Serve fewer than 15 connections and 25 individuals at least 60 days out of the year Encompasses a few subcategories differentiated by size Most Very Small Systems are supplied by domestic wells although some are supplied by surface diversions Very Small Systems supply the homes for an estimated 4 of Californians (California State Water Board 2013 Johnson and Belitz 2015)
bullState Small Water Systems ndash Systems that serve 5ndash14 service connections and do not regularly serve drinking water to more than an average of 25 individuals daily for more than 60 days out of the year (California Health and Safety Code sect116275(n)) The requirements for operation of a State Small Water System are less stringent than the requirements for a Public Water System such as testing for a truncated list of potential contaminants
bullPrivate Wells (and Surface Diversions) ndash Water sources not regulated by federal or California state government agencies The category is subdivided into local systems serving 2ndash4 service connections and private water sources serving only one service connection (DWR 2014)
Measuring Progress Toward Universal Access to Water and Sanitation in California XIII
for safe disposal of human waste and wastewater It does not include the water for operations which is included in the water service ladders (see below)
Service Level ndash the safety affordability and accessibility of water or sanitation service received by a household
Service Ladder ndash a set of service levels with respect to water sanitation or hygiene with the service levels forming the ldquorungsrdquo of the ladder In this report we define two service ladders one for water and one for sanitation both with four service levels (ldquorungsrdquo)
The Four Service Levels
bullSatisfactory ndash protective of human and environmental health meets or exceeds statutory and regulatory standards Examples include water that has met Safe Drinking Water Act standards consistently for a sustained period of time indoor running water and an indoor flush toilet connected to a well-functioning treatment and disposal system
bullModerate ndash meets minimum human needs compliant with statutory and regulatory requirements most of the time and unlikely to cause long-term health or environmental harm if used on a temporary basis but would be regarded as unusual and inferior for regular at-home use by most Californians Moderate service would be regarded by most Californians as acceptable for a weekend stay at a campground but not for long-term in-home service Examples include water delivered by a system with one violation of the Safe Drinking Water Act in the past three years obtaining water from an outdoor standpipe or using a properly maintained and serviced latrine (such as a porta potty or an outhouse connected a properly maintained septic system)
Centralized Municipal Wastewater Systems ndashThe systems of pipes and treatment facilities for conveying treating and discharging domestic sewage from residential and commercial customers Municipal wastewater systems are regulated in California by the State Water Board under the Clean Water Act via the National Pollutant Discharge Elimination and Waste Discharge Requirements programs
Onsite Wastewater Treatment Systems (OWTS) ndash Individual disposal systems community collection and disposal systems and alternative collection and disposal systems that use subsurface disposal As of 2012 there were an estimated 12 million OWTS operating in California (California State Water Board 2012) A septic system is the most common type of OWTS and for readability we primarily use the term ldquoseptic systemrdquo in this report
key Terms Used in Service ladders in this report
Goals ndash a set of aspirational objectives for delivering clean affordable accessible water and sanitation to all Californians The Human Right to Water is realized through gradual and consistent progress up the levels of service provision toward the eventual goal
Water Service ndash the means by which a person obtains water for domestic purposes Based on the language of the California Human Right to Water statute we consider water in this report only for indoor domestic purposes consumption cooking cleaning laundry personal hygiene and sanitation (operating a toilet)
Sanitation Service ndash the means by which a person disposes of their excreta Sanitation refers to the physical structure of a toilet and the infrastructure
Measuring Progress Toward Universal Access to Water and Sanitation in California XIV
Adequate Water ServiceAdequate Sanitation Service ndash satisfactory service across the three dimensions of safety affordability and accessibility
Service Indicators ndash a qualitative description of a service level for each service ladder and dimension1
Performance Measures ndash an objectively quantifiable metric for clean affordable and accessible water We use the phrase based on the California State Water Resources Control Boardrsquos Resolution on the Human Right to Water which references ldquoperformance measuresrdquo as the tool to measure progress towards the realization of the Human Right to Water (California State Water Board 2016b)
Ancillary Metrics ndash metrics that complement the main service ladder by measuring the service dimension among a marginalized community or focusing on a dysfunction in service that is relatively uncommon but severe for those affected
1 There are many competing definitions for the terms ldquoservice indicatorsrdquo ldquoperformance measuresrdquo and ldquometricsrdquo in public policy both in and outside California (eg see OECD 2002 for a glossary of terms in policy evaluation) While we define and use the terms consistently in this document other documents assign distinct and equally legitimate definitions
bullMarginal ndash requires sacrifices in quality of life that most Californians would regard as unacceptable on a regular basis Examples include households that rely on bottled water because their tap water is unsafe to drink households that rely on a toilet that is near but not inside their home or households using a toilet that is not connected to a properly functioning treatment and disposal system Marginal service is clearly deficient but is nonetheless an improvement compared to unacceptable service Providing marginal service may be an appropriate recourse in short-term emergency scenarios such as delivering bottled water to homes experiencing an unexpected water shortage or providing shared outdoor toilets following a natural disaster
bullUnacceptable ndash near or complete absence of any water or sanitation service Drinking directly from unprotected surface water outdoor defecation or using pit latrines without a seat would qualify for unacceptable service
Measuring Progress Toward Universal Access to Water and Sanitation in California 1
InTroDUCTIon
Californiarsquos human right to Water in an International Context
Californiarsquos Human Right to Water passed in 2012 states that ldquoevery human being has the right to safe clean
affordable and accessible water adequate for human consumption cooking and sanitary purposesrdquo (California Water Code sect1063 Chaptered 2012) While a laudable declaration of the statersquos values the statute requires no action to reach this goal beyond requiring state agencies to ldquoconsiderrdquo the right to water when revising or establishing policy
To formalize its commitment to the Human Right to Water the California State Water Resources Control Board (State Water Board) adopted Resolution No 2016-0010 which ldquodirects State Water Board staff tohellip develop performance measures for the evaluation of the boardrsquos progress towards the realization of the Human Right to Water evaluate that progress and explore ways to make that information more readily available to the publicrdquo The resolution also ldquodirects State Water Board staff to work with relevant stakeholders to as resources allow develop new or enhance existing systems to collect the data needed to identify and track communities that do not have or are at risk of not having safe clean affordable and accessible water adequate for human consumption cooking and sanitary purposesrdquo
Californiarsquos effort to recognize define and measure progress toward realization of the Human Right to Water is part of an international movement to address the need for water sanitation and hygiene often referred to as WASH The United Nations (UN) General Assembly recognized the Human Right to Water and Sanitation in 2010 calling upon states and international organizations to ldquoprovide safe clean accessible and affordable
Source J Carl Ganter Circle of Blue
Inequities persist for Californians in water sanitation and hygiene service In this photo Belan Ruia carefully washes dishes in her Porterville home Like her neighbors her well ran dry during the 2012-2017 drought She and her husband Artemio fetched water from a nearby fire station
Measuring Progress Toward Universal Access to Water and Sanitation in California 2
While the majority of Californians enjoy water and sanitation service that meets or exceeds the highest tier of service described in the JMP service ladders there still are persistent inequities in WASH for Californians Water quality problems stem from a variety of natural sources such as arsenic and anthropogenic causes such as nitrate contamination and Trichloropropane (TCP) 123 In January 2018 520000 Californians were served by water utilities that were out of compliance with the Safe Drinking Water Act (SDWA) (State Water Board 2018a) Problems are particularly persistent in small low-income rural communities and are particularly prevalent in the Central Valley and Salinas Valley Tribal lands also grapple with poor water quality and a lack of indoor plumbing a 2012 Indian Health Services report estimated that 36000 persons on California tribal lands had insufficient or unsafe water (DWR 2014) During the 2012-2016 drought nearly 5000 households primarily reliant on private wells reported a shortage of water to their county government (Feinstein Phurisamban and Ford 2017) Meanwhile the homeless population has reached 120000 persons statewide (US Department of Housing and Urban Development 2016) The homeless population largely relies on public facilities for water and sanitation but such services are often hard to reach unclean poorly maintained or simply unavailable (Los Angeles Central Providers Collaborative 2017)
Safe relatively inexpensive indoor running water and flush toilets are taken for granted by many Californians but they are not universal The passage of Californiarsquos Human Right to Water was in response to a growing realization that persistent problems in delivery of water and sanitation persist in the state According to Horacio Amezquita general manager of a housing cooperative that had unsafe water for decades
drinking water and sanitation for allrdquo (UN General Assembly 2010) This language was echoed in the California statute with some notable differences such as the shift from the UN language on ldquosanitationrdquo to the more ambiguous and indirect phrase ldquowater forhellip sanitary purposesrdquo
As in the California statute the UN Human Right to Water is aspirational rather than prescriptive Though lacking an enforcement mechanism the Resolution on the Human Right to Water urges nations and international organizations to direct resources toward the delivery of drinking water and sanitation for all With the aim of ending global poverty the United Nations laid out seventeen Sustainable Development Goals (SDGs) which reflect and recognize human rights standards as a key component of global development The sixth SDG aims to ldquoensure availability and sustainable management of water and sanitation for allrdquo
Progress toward SDG 6 is monitored by the World Health Organization (WHO) and United Nations Childrenrsquos Fund (UNICEF) through the Joint Monitoring Programme for Water Supply Sanitation and Hygiene (JMP) Since 1990 JMP has produced regular estimates of national regional and global progress on WASH with the most recent update issued in 2017 (WHO and UNICEF 2017a) The JMP has developed service ladders to measure progress in WASH with a set of service levels making up the ldquorungsrdquo forming a ladder of gradual progression from low- to high-quality service They describe service ladders for water sanitation and hygiene For water the lowest service level is Unprotected Surface Water followed by Unimproved Limited Basic and at the top Safely Managed Service For sanitation the lowest service level is Open Defecation moving up through Unimproved Limited Basic and Safely Managed Service (Figure 1)
Measuring Progress Toward Universal Access to Water and Sanitation in California 3
Source Figure reproduced from WHO and UNICEF (WHO and UNICEF 2017a)
Figure 1
Joint Monitoring Programme (JMP) Service Ladders on Water Sanitation and Hygiene
Sanitation Services
Service Level Definition
SAFELY MANAGED
Use of improved facilities that are not shared with other households and where excreta are safely disposed of in situ or transported and treated offsite
BASIC Use of improved facilities that are not shared with other households
LIMITED Use of improved facilities shared between two or more households
UNIMPROVEDUse of pit latrines without a slab or platform hanging latrines or bucket latrines
OPEN DEFECATION
Disposal of human faeces in fields forests bushes open bodies of water beaches or other open spaces or with solid waste
Note Improved facilities include flushpour flush to piped sewer systems septic tanks or pit latrines ventilated improved pit latrines composting toilets or pit latrines with slabs
Drinking Water Services
Service Level Definition
SAFELY MANAGED
Drinking water from an improved water source that is located on premises available when needed and free from faecal and priority chemical contamination
BASIC
Drinking water from an improved source provided collection time is not more than 30 minutes for a round trip including queuing
LIMITED
Drinking water from an improved source for which collection time exceeds 30 minutes for a round trip including queuing
UNIMPROVEDDrinking water from an unprotected dug well or unprotected spring
SURFACE WATER
Drinking water directly from a river dam lake pond stream canal or irrigation canal
Note Improved sources include piped water boreholes or tubewells protected dug wells protected springs rainwater and packaged or delivered water
Hygiene
Service Level Definition
BASICAvailability of a handwashing facility on premises with soap and water
LIMITEDAvailability of a handwashing facility on premises without soap and water
NO FACILITY No handwashing facility on premises
Notes Handwashing facilities may be fixed or mobile and include a sink with tap water buckets with taps tippy-taps and jugs or basins designated for handwashing Soap includes bar soap liquid soap powder detergent and soapy water but does not include ash soil sand or other handwashing agents
Measuring Progress Toward Universal Access to Water and Sanitation in California 4
effect of the law is limited and will continue to be so unless it is linked to identifying problems and prioritizing resources
and an outspoken advocate of the Human Right to Water the lawrsquos passage was groundbreaking because it recognized the problems experienced by his community (Box 1) However the tangible
Box 1
The Human Right to Water in Disadvantaged Communities Interview With Horacio Amezquita General Manager San Jerardo Cooperativa
ldquoWith the Human Right to Water campaign it took hundreds of people making noise to get Sacramento to pay attention to us Decision makers arenrsquot impacted by these problems and county and state governments donrsquot take affected communities into account
ldquoWersquove had clean water for five years now It started back in 1990 when one by one wells were contaminated People were sick and had to spend a lot of money on bottled water No one believed us
ldquoThe Human Right to Water law was really important for me San Jerardo suffered It was a long struggle but we won
ldquoHerersquos the thing Anyone who has money and water contamination issues can solve the problem quickly Itrsquos not hard for them But when itrsquos a poor communityhellip there are still communities that have been waiting for 20 or 30 years for water
ldquoThe Right to Water in reality isnrsquot being applied equally for all people The solutions require resourcesmdashfinancial resources and people We need technical assistance and action Itrsquos not actually complicatedmdashprioritize communities with the most need This could have been solved decades ago and itrsquos only getting worse No one wants to take responsibility and itrsquos the people who pay the price
ldquoWhat is the Human Right to Water worth if communities donrsquot have clean water and polluters keep polluting As a law it should help people and the environment But if there isnrsquot a way to apply the law to enforce the law if there arenrsquot financial and human resources dedicated to making it a reality the law isnrsquot meaningful Itrsquos dormant just sitting thererdquo
Horacio Amezquita is the General Manager of the San Jerardo Cooperative in Salinas California which provides housing and community services for over 350 low-income farmworker families He has lived in the community with his family since the 1970s
Source Bree Zender KCBX Central Coast Public Radio
Horacio Amezquita of San Jerardo Cooperativa in Salinas California says that the Human Right to Water is meaningful only if it is accompanied by resources and action
Measuring Progress Toward Universal Access to Water and Sanitation in California 5
Each service ladder describes a goal with four levels of service reflecting the full range of quality observed in California To avoid confusion with JMP standards we employed different terms for service levels Satisfactory Moderate Marginal and Unacceptable Each rung is described qualitatively by a service indicator and more precisely with a quantitative performance measure Figure 2 provides a schematic to illustrate the structure of the service ladders described in this report
The service ladders for water and sanitation each have three dimensions safe affordable and accessible which can vary independently from one another For example a household with high-quality running water that is severely cost-burdened would have Satisfactory drinking water service for the safety and accessibility dimensions but only Marginal service for affordability Although California Water Code sect1063 also declares a right to ldquocleanrdquo water we do not call out ldquocleanrdquo as a separate fourth dimension of the service ladders in this report It seems equally plausible that ldquocleanrdquo is redundant with ldquosaferdquo or that it was intended to refer to the SDWArsquos voluntary secondary drinking water standards governing the aesthetics of how drinking water looks and smells We deemed an extensive discussion of the aesthetics of drinking water to be beyond the scope of this document We restrict the service ladders to aspects of water and sanitation service with a clear nexus to human health
The service ladders we describe formalize a normative framework for water and sanitation in California The ladders include goals and service indicators for water and sanitation service in California that align with statute regulation and common practice The performance measures for quantifying water and sanitation service were designed whenever possible such that they
MOtivatinG QuestiOns aPPrOaCh and OutCOMes
In this report we attempt to answer the question what would realizing the Human Right to Water in California mean in terms that are concrete measurable and socially acceptable within the context of a developed country
We modeled our approach on the service ladder framework employed by JMP as well as other international practitioners of WASH monitoring and development (WHO and UNICEF 2017a Moriarty et al 2011) This approach offers a range of service levels as a way of measuring incremental progress and providing benchmarks for appropriate service in contexts where there are insurmountable barriers to offering excellent service
Service ladders are a common approach to define norms and develop benchmarks for comparison of broad categories of service The service ladder reflects trade-offs between complex multivariate systems for evaluating the quality of water and sanitation service and the oversimplification of dividing service levels into the binary categories of ldquogoodrdquo and ldquobadrdquo service By assessing the range of variation in problems the ladder framework encourages stakeholders to consider both how to help the large population with modest problems and the relatively small population burdened by the most extreme inequities While we employed JMPrsquos service ladders as a template we modified both the content and structure as needed to reflect common expectations and legal standards relevant to California This is a common approach in the literature on developing metrics for water and sanitation Norms are not objectively determined rather they reflect communitiesrsquo values resources and political choices (Moriarty et al 2011)
Measuring Progress Toward Universal Access to Water and Sanitation in California 6
meeting the Human Right to Water implied by existing statutes regulations and societal norms
This report focuses on water and sanitation service in homes including standard housing types such as single-family and multi-family units unconventional housing such as RVs vans and boats group residences such as dormitories Single Resident Occupancies (SROs) and homeless shelters To a limited extent we address access to
can be informed by available statewide public datasets Where data are not available to inform a performance measure the missing information is identified in the accompanying ldquodata gapsrdquo section for the dimension The laddersrsquo broad classes of service levels simplify complex datasets to communicate broad patterns and identify high-priority areas for improvement to a general audience They also serve as an opportunity to articulate commonly-held but unstated goals in
Figure 2
Structure of Water and Sanitation Service Ladders
Adequate Water Service
Safe Affordable Accessible
Goal
Satisfactory
Moderate
Marginal
Unacceptable
Serv
ice
Leve
ls (
ldquorungsrdquo
)
Adequate Water Service
Service Dimensions
Service Indicators amp Performance
Measures
Adequate Sanitation Service
Safe Affordable Accessible
Goal
Satisfactory
Moderate
Marginal
Unacceptable
Serv
ice
Leve
ls (
ldquorungsrdquo
)
Adequate Sanitation Service
Service Dimensions
Service Indicators amp Performance
Measures
Measuring Progress Toward Universal Access to Water and Sanitation in California 7
for Satisfactory Moderate Marginal and Unacceptable service to be commensurate with what is found in state and federal regulations
2 Affordability is not included in JMP service ladders JMP determined that there was ldquono commonly agreed-upon way to measure affordabilityrdquo and decided to defer incorporating affordability into its service ladders in 2017 until a designated work group could develop and test metrics (WHO and UNICEF 2017a p 20) Given that affordability is one of the key components called for in the California Human Right to Water we chose to include affordability and propose a measurable index
3 ldquoImprovedrdquo water sources and sanitation facilities include infrastructure that would be considered illegal under California housing laws JMP defines safely managed water and sanitation as having access to an improved water source and sanitation facility respectively ldquoImprovedrdquo facilities while generally protective of human health do not necessarily imply indoor piped water or flush toilets which are mandatory under state
water and sanitation in public spaces as it affects those experiencing homelessness who must make use of such public facilities as their primary points of access We did not address water and sanitation outside the place of residence ie in schools workplaces or health care facilities The home is the primary place where people consume cook and clean with water and adequate service in the place of residence is of primary importance in meeting basic needs Developing service ladders for non-residences in California remains a topic for future work
COMParinG JOint MOnitOrinG PrOGraMMe standards tO CaLiFOrnia COntext
There are five ways in which JMPrsquos standards for safely managed water and sanitation diverge from what is commonly regarded as acceptable in California Usually - though not always ndash it is because the highest level of service in JMP would be below legal standards in the state or below the standards found in most California households
1 Water quality standards are much lower in JMP than is commonly considered acceptable in the United States JMP defines safely managed water as free from fecal and priority chemical contaminants arsenic and fluoride In California most households receive tap water from a Public Water System (PWS) regulated under the state and federal SDWAs which set limits on 88 contaminants as of 2017 (US EPA 2016a) Bottled water is subject to US Food and Drug Administration oversight which sets limits on nearly as many contaminants (CFR 21 2017) Under JMPrsquos definition communities affected by contaminants apart from arsenic and fluoride such as nitrate contamination in Californiarsquos Central and Salinas Valleys would be regarded as having safely managed water service We set water quality standards
Source Peeterv iStock
Poor access to water and sanitation is often found in substandard housing
Measuring Progress Toward Universal Access to Water and Sanitation in California 8
In consideration of the differences between how JMP benchmarks and measures water and sanitation service and the common standards and practices found in California we found it necessary to adapt the goals indicators and performance measures so that they are specific to California and its unique framework of statute and regulation available datasets and prevailing norms and resources
serviCe Ladders deFininG GOaLs and indiCatOrs
The Service Ladder Overviews for Water and Sanitation in California (Tables 1 and 2) present goals and service indicators for water and sanitation in California We used the language of the California Human Right to Water as the organizing framework ldquoevery human being has the right to safe clean affordable and accessible water adequate for human consumption cooking and sanitary purposesrdquo (California Water Code sect1063) Each ladder covers three dimensions of water and sanitation service safety affordability and accessibility
Water refers to water for indoor domestic purposes consumption cooking cleaning laundry personal hygiene and sanitation (operating a toilet) Sanitation refers to the physical structure of a toilet and the infrastructure and management for safe disposal of human waste and wastewater it does not include the water for operations which is measured in the water service ladders Hygiene refers to a facility for handwashing accompanied by soap In this report we address facilities for handwashing in the home as a component of access to water Soap is not included as a component of the service ladders but it is often a difficult-to-acquire staple for families who are struggling to makes end meet (see Box 2)
housing laws We treat indoor plumbing as a necessary element of adequate water and sanitation
4 Packaged and delivered water is regarded as meeting JMP requirements for safely managed water While packaged (eg bottled) and delivered water is typically safe for domestic purposes an essential component to meeting the Human Right to Water is having safe water in the home not just for consumption but also for bathing and cleaning There is a substantial population in California consuming packaged or delivered water because their tap water is unsafe to drink or because of water shortages exacerbated by drought (Feinstein et al 2017 Moore et al 2011) Reliance on packaged and delivered water as a replacement for piped water is problematic because of high costs safety concerns and environmental consequences and only occurs in the most severely disadvantaged communities Thus adequate water service in California assumes piped water that is safe for consumption in the home
5 Shared toilets are regarded as inherently problematic JMP classifies any sanitation facility shared between two or more households as limited service based on evidence that such facilities are often poorly maintained and become unhygienic and unsafe for vulnerable users particularly women and girls This is a concern in California as well where shared toilets in SROs and homeless shelters are often unhygienic and unsafe to use But in other contexts such as dormitories group homes and any group living quarters that are well-maintained shared toilets are an important component of affordable housing As such we classified shared toilets as representing moderate access
Measuring Progress Toward Universal Access to Water and Sanitation in California 9
Each service ladder is described by a set of service indicators and performance measures The service indicators give abstract qualitative descriptions of each service level Performance measures focus on translating abstract concepts into measurable items and are heavily circumscribed by the datasets available The subsequent section
Table 1
Overview of Drinking Water Service Ladder for California ndash Goals and Service Indicators
Safe Affordable Accessible
Goal Chemicals regulated by state and federal SDWA standards should be consistently below levels that pose a significant risk to health
Cost of essential water and sanitation should be inexpensive enough that cost does not prevent access nor interfere with other essential expenditures
Water should be available in the home in sufficient volumes to meet domestic needs at hot and cold temperatures at the times needed
Satisfactory Water has met state and federal SDWA standards for Public Water Systems for the past three years
Household can afford safe accessible water without facing tradeoffs with other essential expenditures
Sufficient hot and cold indoor piped water reliably available 24 hours a day
Moderate Water has met state and federal SDWA standards for Public Water Systems for the vast majority of time in the past three years
Sufficient hot and cold water from an improved source available on premises (indoors or outside) and reliably available 24 hours a day bottled or delivered water acceptable in some circumstances
Marginal Water meets standards set by US Food and Drug Administration is treated by Point of UseEntry filter that meets California Title 22 regulations or meets voluntary domestic well guidelines
Household ocassionally cannot afford safe accessible water without facing tradeoffs with other essential expenditures
Sufficient water from an improved source including bottled water or tanks of water delivered by truck provided collection time is not more than 30 minutes round-trip (including waiting time) and reliably available at least 12 hours a day
Unacceptable Drinking water quality that is not regularly tested and verified as meeting at least the Marginal standard for safety
Household regularly cannot afford safe accessible water without facing tradeoffs with other essential expenditures
Water that does not meet at least the Marginal standards for access
Notes Drinking water refers to water for indoor domestic purposes consumption cooking cleaning laundry personal hygiene and sanitation (operating a toilet) It does not include the treatment and disposal of wastewater which is covered in the sanitation service ladder Improved sources of water are piped running water protected wells protected springs and rainwater Discretionary income is income minus all essential expenses but water housing health care food energy child care essential transportation and taxes SDWA - Safe Drinking Water Act
Serv
ice
Leve
lldquoEvery human being has the right to safe clean affordable and accessible water adequate for human consumption cooking and sanitary purposesrdquo
mdash California Water Code sect1063
Measuring Progress Toward Universal Access to Water and Sanitation in California 10
the number of households in California with access to sufficient water A system-level approach would quantify the number of PWSs with sufficient supply to meet the needs of its residential customers In California much of the available data on water and sanitation is collected on PWSs and centralized wastewater but this approach potentially masks variation between households or individuals and excludes those that are not served by such systems This document focuses on household-level performance measures as the
ldquoService Ladders Indicators and Performance Measuresrdquo examines each dimension of water and sanitation in greater detail defining the meaning precisely proposing specific numeric definitions for the abstract qualitative terms in the service indicators and suggesting data sources to inform the performance measures
Water and sanitation service can be measured at varying scales For example a household-level measurement of sufficient water would calculate
Table 2
Service Ladder for Adequate Sanitation in California ndash Overview of Goals and Service Indicators
Safe Affordable Accessible
Goal A sanitation system should separate waste from human contact until it can be safely treated and released to the environment or reused
Sanitation should be inexpensive enough that cost does not prevent access nor interfere with other essential expenditures
Toilets should be private located in the home safe to visit and available when needed
Satisfactory Flush toilet connected to a system that hygienically separates waste from human contact where waste is safely disposed of on-site or transported and treated off-site
Household can afford safe accessible sanitation without facing tradeoffs with other essential expenditures
Private secure well-maintained in-home facility not shared with other households available 24 hours a day
Moderate An improved facility that hygienically separates waste from human contact where waste is safely disposed of on-site or transported and treated off-site
Private secure well-maintained on-site facility possibly shared with other households available 24 hours a day
Marginal An improved facility that hygienically separates waste from human contact
Household ocassionally cannot afford safe accessible sanitation without facing tradeoffs with other essential expenditures
Private secure well-maintained facility possibly shared with other households no more than 50 meters from home available 24 hours a day
Unacceptable Use of unimproved facilities or open defecation
Household regularly cannot afford safe accessible sanitation without facing tradeoffs with other essential expenditures
Facility is more than 50 meters from home not available 24 hours a day or use of the facility compromises personal safety or privacy
Notes Sanitation refers to the physical structure of a toilet and the infrastructure and management for safe disposal of human waste and wastewater Improved sanitation facilities refer to equipment that hygienically separates waste from human contact such as flush toilets pit latrines and composting toilets
Serv
ice
Leve
l
Measuring Progress Toward Universal Access to Water and Sanitation in California 11
serviCe Ladders indiCatOrs and PerFOrManCe Measures
This section presents a series of tables describing indicators and performance measures for each aspect of the Human Right to Water as well as information on the relevant data sources and data gaps The tables in this section can also be found in the companion online appendices which include additional detail on context and rationale as well as useful links
most relevant level for understanding the service actually received by individuals in California For most of the dimensions the household- and system-level performance measures are simple corollaries In cases where the system-level metric is not a simple corollary of a household-level measurement we explicitly define system performance measures
Box 2
What About Hygiene
JMP defines safely managed hygiene as access to a basic handwashing facility with soap and water available on premises In this report we include sufficient water for hygiene under access to water We do not explicitly discuss soap but it is an essential component of hygiene Recent surveys and disease outbreaks indicate that lack of soap for handwashing among low-income families may be an unappreciated problem in the United States One survey of nearly 2000 low-income families with children found that one in three reported that at times they could not afford to purchase soap for handwashing and bathing (Feeding America 2012) Recent Hepatitis A outbreaks in southern California indicate that homeless populations are burdened by lack of access to handwashing facilities which exacerbates their problems with inadequate sanitation (San Diego County Health and Human Services Agency 2018 Karlamangla 2017)
Given that soap is inexpensive and necessary for human health it would be reasonable to include it in food assistance programs Yet social welfare programs such as CalFresh do not provide funds for non-food items nor is soap commonly found at food pantries (Department of Social Services 2018 Feeding America 2012) There is a clear nexus between handwashing and nutrition Long-term lack of handwashing among children causes intestinal dysfunction that limits their ability to absorb the full nutritional value in their food thus handwashing sanitation and nutrition are inextricably linked (Mbuya and Humphrey 2016 Syed Ali and Duggan 2016)
Source Thepalmer iStock
Measuring Progress Toward Universal Access to Water and Sanitation in California 12
The goal for safe drinking water sounds straightforward chemicals regulated by the state and federal SDWAs should be consistently below levels that pose a significant risk to health In practice however determining what constitutes safe water is complicated First although 96 of the population in California is served by a PWS not every person drinks water governed by the California SDWA (State Water Board 2013) Some people drink bottled water regulated by the Food and Drug Administration Others use water from domestic wells that are subject only to voluntary guidelines (State Water Board 2015b) And in some unusual circumstances a PWS can receive a temporary permit to use point-of-use treatment such as under-the-sink filters in lieu of centralized drinking water treatment1
Even for the majority of Californians who use and consume water governed under the California SDWA there are complexities to understanding who receives water that is ldquosaferdquo or ldquounsaferdquo There are several distinct legal standards encapsulated in Californiarsquos SDWA Public Health Goals (PHGs) Maximum Contaminant Levels (MCLs) and Treatment Techniques (TTs)2 Of these PHGs issued by the California Office of Environmental
1 Point-of-Use Treatment CCR Title 22 Article 25 httpswwwwaterboardscagovdrinking_watercertlicdrinkingwaterregulationsdocspou_poe_draft_reg_textpdf
2 California Safe Drinking Water Act California Health and Safety Code Division 104 Part 12 Chapter 4 sect116270 et seq
We address affordability of drinking water wastewater and sewer costs collectively in one combined performance measure A large proportion of households in California pay the costs for water wastewater and sewer on a single bill and inability to pay any substantial proportion of the total can result in a water service disconnection Since inability to pay any one of the costs results in losing access to the other services it is best to address the costs collectively whenever possible This is aligned with how current research on the topic recommends handling affordability (NAPA 2017 Teodoro 2018) There are cases when one might have information on the cost of drinking water for a region but not for wastewater and sewer in those cases we offer alternative measures that isolate the costs of each
Drinking Water Indicators and Performance Measures
SAFe DrInkInG WATer
Unsafe drinking water is perhaps the most pervasive problem in drinking water service provision in California and the problem affects every aspect of life in the affected communities (Box 3) Estimates for the number of Californians with unsafe drinking water vary widely because of uncertainties about the quality of water delivered by Very Small Systems and differing definitions of what constitutes ldquounsaferdquo One of the best indicators we have at this time of the number of Californians with unsafe water is the State Water Boardrsquos Human Right to Water Portal which records whether community water systems are in compliance with key requirements of the SDWA Of the approximately 38 million Californians served by a community water system 520000 Californians were served by a system that was out of compliance in January 2018 (State Water Board 2018a)
In January 2018 520000 Californians were served by a community water system that was out of compliance with the Safe Drinking Water Act
Measuring Progress Toward Universal Access to Water and Sanitation in California 13
bullDrinkingwaterqualityismeasuredatcentralized places in the water distribution system The water is often diluted or undergoes further treatment before delivery or may not be delivered to all connections served by a utility
bullTheCaliforniaSDWAregulatesthequalityofwater delivered by a PWS before it leaves the systemrsquos pipes to enter a service connection Similarly domestic well guidelines focus on the quality of water up to the time it enters the home There is scant information on the water quality problems that originate on private premises
bullQualitystandardssetbytheCaliforniaSDWAare intended to prioritize human health but they also must consider economic and technical feasibility Consequently water can meet SDWA requirements but fail to meet more rigorous standards set by the PHGs
bullTheprocessofidentifyingandsettingnewdrinking water quality regulations can be slow and lag behind the emergence of evidence that a contaminant of concern is found in drinking water For example OEHHA set a PHG for TCP 123 in 2009 the state did not adopt an associated MCL until July 2017 (State Water Board 2018c) Similarly there has been a PHG for hexavalent chromium since July 2011 but the final MCL has been delayed following an adverse court decision (State Water Board 2017)
Safe drinking water is the dimension of water and sanitation service with the most technical complexity given that there are approximately a hundred enforceable standards for clean drinking water The ladder we propose is based on the number of violations of primary California SDWA standards over the previous three years This offers a relatively simple way to translate compliance with laws governing safe drinking water to an indicator
Health Hazard Assessment (OEHHA) are the most rigorous standards PHGs for drinking water contaminants are set at levels that should pose no significant health risk if consumed for a lifetime PWSs however are not required to meet PHGs rather they are required to meet MCLs and TTs The State Water Board sets MCLs at a level that balances the primary objective of meeting the PHGs against technological and financial limitations In cases where there is no feasible method to measure contaminant levels the state may use a TT to limit exposure rather than an MCL A TT is a procedure that if followed should reduce the presence of a contaminant in drinking water to acceptable levels Lead and copper for example are governed by TTs rather than MCLs3
It is important to keep these caveats in mind when attempting to connect exceedances of PHGs MCLs and TTs to a measurement of populations with ldquosaferdquo and ldquounsaferdquo water
bullCaliforniaSDWAviolationsarerecordedasbinary yesno events but the degree and duration of elevated contaminant levels determines the health impact PHGs and MCLs are set to minimize the risk caused by consuming a contaminant over a human lifetime An exceedance that is modest in quantity or duration does not necessarily measurably increase human health risk
3 California Lead and Copper Rule CCR sect64670
The goal for safe water is that chemicals regulated by the state and federal Safe Drinking Water Act should be consistently below levels that pose a significant risk to health
Measuring Progress Toward Universal Access to Water and Sanitation in California 14
health impacts of those contaminants to model the risk of disease caused by consuming a given water supply California OEHHA took an approach that was not as exhaustive as a full quantitative risk assessment but did take into account the relative concentrations of different contaminants and whether multiple contaminants are present for their California Communities Environmental Health Screening Tool (CalEnviroScreen 30 OEHHA 2017) Our approach is more closely aligned with that of the State Water Boardrsquos Human Right to Water Portal (State Water Board 2018a) It allows a more rapid analysis of water quality lending itself to frequent updates and has the virtue of being clearly aligned with enforceable laws (or in the case of private wells with state-issued voluntary guidelines)
We consider a household receiving water from a PWS that has met California SDWA standards every monitoring period for three years to be Satisfactory in the safe water dimension
We define the Moderate rung as applying to households receiving water from a PWS that has had no more than one enforcement action for non-acute drinking water standards in the past three years The Moderate definition intends to acknowledge that a short-term violation of the SDWA for a chronic contaminant does not necessarily result in serious harm to human health In fact the Moderate standard still represents a rather high bar given the wide gap between a violation lasting less than a few months and the standard of harm caused by lifelong exposure set by the PHG
of whether a household is likely to receive safe drinking water The approach also has the benefit of relying on data in the Safe Drinking Water Information System that is updated multiple times a year We selected a three-year period because that is the length of one SDWA compliance period Systems are generally required to test for MCLs at least once per compliance period and usually more frequently although systems deemed lower-risk for specified contaminants can be granted intervals as long as nine years between testing (US EPA 2004) We also suggest treating violations for contaminants that are occasionally found at levels associated with acute health impacts more stringently than contaminants typically found far below the level at which they have immediate acute effects Specifically violations of MCLs and TTs pertaining to microorganisms nitrates and nitrites are occasionally found in California PWSs at levels high enough to cause serious harm in short time periods and we recommend treating even violations of these acute contaminants more stringently (US EPA 2007 Senate Office of Research 2015)
Given the caveats listed above while water meeting the definitions of Marginal Moderate and Satisfactory can reasonably be considered ldquosaferdquo water that does not meet these definitions should not be assumed to be ldquounsaferdquo Populations served by systems failing to reach at least the Marginal level should be characterized as being potentially exposed to unsafe water
We developed the rungs of the safe drinking water service ladder to be categories that can be informed with a relatively simple analyses of compliance with relevant statutes and regulations (Table 3) It would be more rigorous but more complex to categorize water quality using a quantitative risk assessment approach A quantitative risk assessment entails using measured concentrations of multiple chemicals along with data on the
ldquoThe pistachio trees have better water than we do They care a lot about the crops here Not the peoplerdquo- Maricela Mares-Alatorre
Measuring Progress Toward Universal Access to Water and Sanitation in California 15
Box 3
Living Without Safe Water Interview With Maricela Mares-Alatorre Community Organizer Kettleman City
ldquoIt is so ingrained in us now We just donrsquot drink the waterrdquo
Maricela Mares-Alatorre is a community leader in Kettleman City a small unincorporated community of 1500 people halfway between Los Angeles and San Francisco
ldquoWe are seen as disposable people and disposable people donrsquot need clean water We arenrsquot disposable people Wersquore hardworking people Maybe we donrsquot have high paying jobs but wersquore hardworking and we deserve dignity We deserve the dignity of clean water just like anyone elserdquo
In Kettleman City residents ndash along with organizations such as People for Clean Air and Water California Rural Legal Assistance and Greenaction ndash have been fighting for years for their right to water After a cluster of severe birth defects and infant deaths in 2008 and 2009 the state finally tested the water As residents already knew it wasnrsquot safe to drink
ldquoBut the state took their time in addressing the problemrdquo Maricela says ldquoThe pistachio trees have better water than we do They care a lot about the crops here Not the peoplerdquo
After years of delays a plan to finance a new water treatment plant with help from the waste management company is nearing completion The plant is now projected to be finished in early 2019 ndash nine years after the state recommended the water problem be fixed
Maricela says it was ldquonine years too longrdquo given the hardships unsafe drinking water imposes on her community ldquoWe get bottled water for drinking But we still have to bathe in the tap water brush our teeth with it cook with it People canrsquot afford to buy more bottled water for all those things
ldquoYou change your cooking and your diet Things that are going to be drained or not in water for a long time like pasta you can cook in tap water But things like beans that you boil for hours and then stay in the pot the whole week you have to cook in bottled water
ldquoI was over 40 the first time I heard lsquowater is a human rightrsquo Here it is a given that we donrsquot have clean waterrdquo
Maricela Mares-Alatorre is a Community Organizer and Policy Advocate with Greenaction for Health and Environmental Justice Maricela is also coordinator for El Pueblo Para el Aire y Agua LimpiaPeople for Clean Air and Water of Kettleman City
Source Bradley Angel Greenaction for Health and Environmental Justice
Maricela Mares-Alatorre a community organizer in Kettleman City California says her community has been fighting for years for their right to water
Measuring Progress Toward Universal Access to Water and Sanitation in California 16
correct for that be defining a constant time horizon of three years as the assessment window
We define the Marginal rung as applying to households that rely primarily on bottled water Very Small Systems or water from PWSs that do not have a centralized treatment facility Bottled water is regulated by the Food and Drug Administration with a less restrictive set of testing and treatment protocols than tap water from PWSs Very Small Systems are not regulated under the SDWA and are encouraged to follow Californiarsquos voluntary guidelines for domestic well owners (State Water Board 2015b) Last PWSs under specified circumstances can apply for a permit to use point-
The Satisfactory and Moderate rungs in Table 3 are similar to the State Water Boardrsquos definition of systems that are in compliance for the Human Right to Water Portal The key difference is the way the portal treats the duration and period of time without an enforcement action On the portal ldquoin compliancerdquo reflects a systemrsquos current status while ldquoreturned to compliancerdquo indicates a system is currently in compliance but had at least one enforcement action since January 2012 The problem with the portalrsquos categories is that they do not reflect consistent criteria over time as time passes the ldquoreturn to compliancerdquo group will grow while ldquoin compliancerdquo will shrink We attempt to
Table 3
Service Indicators and Performance Measures for Safe Drinking Water in California
Goal Chemicals regulated by state and federal SDWA standards should be consistently below levels that pose a significant risk to health
Household-Level Service Indicator Household-Level Performance Measure
Satisfactory Water has met state and federal SDWA standards for Public Water Systems for the past three years
Household served by Public Water System that has been without an enforcement action during the last three years for state or federal drinking water standards
Moderate Water has met state and federal SDWA standards for Public Water Systems for the vast majority of time in the past three years
Household served by Public Water System that 1) has been without an enforcement action for an acute drinking water standard during the last three years and 2) has been without an enforcement action lasting more than one monitoring period during the last three years for state or federal chronic drinking water standards
Marginal Water meets standards set by US Food and Drug Administration is treated by Point of UseEntry filter that meets California Title 22 regulations or meets voluntary domestic well guidelines
Household uses bottled water regulated by US Food and Drug Administration or water from a Public Water System that does not have a centralized treatment facility but is treated by a Point of EntryUse filter that meets State Water Board resolution 2016-0015 or water from well serving fewer than 15 connections that meets voluntary domestic well guidelines
Unacceptable Drinking water quality that is not regularly tested and verified as meeting at least the Marginal standard for safety
Any one of the characteristics of Marginal access to water is not met
Notes Acute contaminants are microorganisms nitrates and nitrites Californiarsquos voluntary guidelines for domestic well owners are described in A Guide for Private Domestic Well Owners (State Water Board 2015b) Regulations for point-of-use and point-of-entry water treatment devices are described in California Code of Regulations (CCR) Title 22 Article 25 SDWA ndash Safe Drinking Water Act
Serv
ice
Leve
l
Measuring Progress Toward Universal Access to Water and Sanitation in California 17
DATA SOurCeS FOr SAFe DrInkInG WATer
Table 4 describes data sources to inform the performance measures on safe drinking water The first three the two Safe Drinking Water Information Databases and the Human Right
of-entry or point-of-use water treatment devices which treat water at the point it enters a building or at a single tap in lieu of centralized treatment Any of these are unlikely to harm human health if used on a temporary basis but lack the extensive quality safeguards of the SDWA
Table 4
Data Sources for Safe Drinking Water Performance Measures
Description Collected By InformationGeographic Scale Significance
Safe Drinking Water Information System (SDWIS) State-Regulated Systems
California State Water Board
SDWA reports from Public Water Systems
Public Water System
Relevant for understanding water quality for the 95 of Californians served at home by a state-regulated Community Water System as well as water quality for non-community water systems
Safe Drinking Water Information System (SDWIS) Tribal Systems
US EPA Region 9 SDWA reports from federally regulated tribal Public Water Systems
Public Water System
Relevant for understanding water quality for the 1 of Californians served at home by a tribal Community Water System
Human Right to Water Portal
California State Water Board
A subset of SDWA enforcement actions
Community Water Systems and Non-Community Water Systems serving schools and daycares
Similar information to SDWIS simplified focused on priority SDWA violations and provided in spreadsheet and map format
Domestic Wells United States Geological Survey
Location and population served by domestic wells (Very Small Systems reliant on groundwater)
Census Tract Relevant for understanding surface location and population served by Very Small Systems
Domestic Well Completion Reports
California DWR and county well permitting agencies
Location and depth of domestic wells (Very Small Systems reliant on groundwater)
Public Land Survey System Sections
Relevant for understanding surface location and source water depth for Very Small Systems
Groundwater Ambient Monitoring and Assessment (GAMA) Program
California State Water Board
Groundwater quality monitoring
Groundwater basin
Quality of groundwater aquifers in California Relevant to quality of source water for Public Water Systems and Very Small Systems reliant on groundwater but does not necessarily reflect the quality of the water at point of use
CalEnviroScreen Drinking Water
California OEHHA
Indicator of likely exposure to drinking water contaminants
Census Tract Information on exposure to 13 drinking water contaminants for areas served by Public Water Systems and areas likely to be served by Very Small Systems using wells
Notes Additional details on data sources including links to online resources and update schedule are available in Online Appendix II OEHHA - Office of Environmental Health Hazard Assessment SDWA - Safe Drinking Water Act DWR - Department of Water Resources
Measuring Progress Toward Universal Access to Water and Sanitation in California 18
consumed On-premises problems are a poorly-understood source of potential contamination PWSs perform a limited set of tests at a handful of taps in their service area for lead and copper levels A more extensive sampling protocol would likely reveal water quality problems as has been demonstrated by the recent efforts to expand testing for lead at taps in schools (State Water Board 2018b) In addition we do not know the extent to which point-of-use and point-of-entry filters mitigate water quality problems
Affordable Drinking Water and Sanitation
The goal for affordable water and sanitation is that essential drinking wastewater and sewer needs should be inexpensive enough that cost does not prevent access nor interfere with other essential expenditures (Heller 2015) The Human Right to Water does not imply that it should be free Indeed to do so would endanger the financial sustainability of water and sanitation systems undermining quality of service for future generations However the Human Right to Water does imply that public entities have a responsibility to consider affordability for low-income customers and assist households who have difficulty paying for essential expenses
The affordability of water and sanitation should be measured together if the household is billed jointly as the cost of one impacts the affordability of the other For the many households paying combined drinking water and wastewater bills the inability to pay one part of the bill results in loss of both services For households receiving separate bills affordability for water and sanitation can be calculated separately
While the WASH sector has long identified affordability as a key factor in ensuring equitable water and sanitation service there is no
to Water Portal directly inform the Satisfactory and Moderate Safe Drinking Water performance measures The datasets on location and depth of drinking water wells coupled with information from the Groundwater Ambient Monitoring and Assessment (GAMA) Program could potentially be synthesized to generate estimates of drinking water wells reliant on contaminated aquifers (though the degree to which well-owners treat the water remains unknown) CalEnviroScreen provides a synthetic indicator of drinking water contaminants in California although their approach provides information that does not directly align with how we have constructed the safe drinking water service ladder
DATA GAPS AnD AnALyTICAL ChALLenGeS FOr SAFe DrInkInG WATer
A major challenge in obtaining comprehensive estimates of Californians with safe drinking water is a lack of information on systems too small to be regulated under the SDWA For PWSs while we have excellent information on the quality of water at centralized points in the distribution system this may differ from the quality of water at the point of use
Quality of water as delivered by Very Small Systems small systems are subject to highly variable local regulation on their water quality and private domestic wells have no mandatory requirements on management of water quality As such we have very little understanding of the quality of water delivered by Very Small Systems including the extent to which they are monitored and treated before use
Quality of water at point-of-use water quality tested at a central point in the distribution system of a PWS may differ from the quality of water at the tap The water can be further treated diluted or exposed to additional contaminants before it is
Measuring Progress Toward Universal Access to Water and Sanitation in California 19
clearly not intended to make a formal universal recommendation on water affordability It appears with no rationale or citation for the figure However it was likely derived from studies and government agencies that had consistently found that most households spent a proportion of their income that was in the low single digits A review of water expenditures for median-income households in mid- to high-income countries found they spent between 05 and 24 of their income on water (OECD 2003 Table 22) Households in the lower 20th percentile of incomes spent somewhat more ranging from 07 to 27 of income on water (OECD 2003 Table 23) The UNDP may also have based their rule of thumb on other institutional precedents For example the World Bank and United Kingdom have used thresholds of 3 to 5 of income as indicators of water cost burdens although in both cases these were intended to be used as approximate guides rather than categorical designations of whether water was or was not affordable (OECD 2003 p 43)
commonly-agreed upon performance indicator for affordability (WHO and UNICEF 2017a 20 Hutton 2012) A common instrument for measuring affordability is to calculate the percent of income spent on water and compare it to some designated threshold Some of the most commonly-cited thresholds for affordable water are 3 of household income (attributed to the United Nations Development Programme) 45 of median household income (attributed to the US EPA) and 15 of median household income (attributed to the California State Water Board) These thresholds for the proportion of income spent on water are commonly referenced in the literature as accepted rules for household water affordability (eg see Christian-Smith et al 2013 Feinstein et al 2017 Mack and Wrase 2017) However as described below these thresholds were not intended to provide institutional recommendations on the maximum an individual household should spend on water
In the international setting there have been attempts to develop guidelines on affordability but these are more back-of-the-envelope suggestions than firm standards For example the commonly referenced ldquoguidelinerdquo from the United Nations Development Programme (UNDP) on affordability originates from a brief mention in a single publication ldquoOne rule of thumb is that no household should be spending more than 3 of its income on water and sanitationrdquo (UNDP 2006) Viewed in context this passing statement was
Essential drinking wastewater and sewer needs should be inexpensive enough that cost does not prevent access nor interfere with other essential expenditures
Source J Carl Ganter Circle of Blue
Guillermina Andrade and Vicente Tapia filled five 55-gallon barrels twice a week from this water depot outside the Porterville fire station in winter 2016
Measuring Progress Toward Universal Access to Water and Sanitation in California 20
needs median household income rather than the full range of incomes in a community and accounting only for the cost of drinking water leaving out wastewater and sewer costs They also ignore the cost of other essential needs failing to indicate whether a household is likely to face a financial trade-off in paying for water Upon closer examination these commonly-used benchmarks are slender reeds to form the basis of major decisions on water rates and social assistance programs
Citing the lack of commonly agreed-upon metrics JMP did not include affordability in the service ladders in their 2017 progress report They noted that they are engaged in a collaborative process ldquoto develop and test indicators that will enable more systematic and consistent monitoring of affordability in the futurerdquo (WHO and UNICEF 2017a p 20)
A recent report by the National Academy of Public Administration concluded that the approach of calculating affordability as a percentage of mean household income was inadequate for assessing affordability making a set of six broad recommendations on how to develop better affordability metrics The report suggested several characteristics of an improved user affordability metric
bullWaterneedsshouldbedefinedbroadlytoinclude water and wastewater
bullThecostofotheressentialexpensesbesideswater should be factored into the analysis
bullVariabilityinhouseholdincomeandspecifically the impact of water costs on low-income households should be considered
bullThefocusshouldbeonessentialwaterneedsand not discretionary uses
bullThemetricshouldbeeasytocalculatefromreadily available data and
bullThemetricshouldbesimpletounderstand
Another set of commonly-referenced affordability thresholds are the US EPA cost benchmarks which are often applied outside of their intended scope The 45 benchmark originates from US EPA recommendations on assessing the cost of compliance with federal regulations (US EPA 1997 2006 1998) The EPArsquos benchmarks were intended to assess impacts of regulations on affordability as measured against average household incomes regionally or nationally they were not intended to be the target for individual household spending for water or wastewater (US Conference of Mayors American Water Works Association and Water Environment Federation 2013) The US EPA affordability metric of 25 of median household income for drinking water was developed to evaluate the impact of regulations on average water bills across the country The corresponding metric from US EPA for wastewater and combined sewer overflows was intended to evaluate an individual communityrsquos financial capacity to comply with regulatory mandates and schedules Both metrics are misapplied when they are used as targets for household-level spending (US Conference of Mayors American Water Works Association and Water Environment Federation 2013)
Finally in California it is common to reference 15 of median household income as an affordability benchmark (Christian-Smith et al 2013 Feinstein et al 2017) The figure appears in documentation from the California State Water Board on eligibility for particular funding streams However the 15 threshold used by the California State Water Board was only intended to evaluate affordability within low-income communities and to inform a specific set of funding decisions (State Water Board 2016c)
While the general approach of measuring the ratio of cost of water to income is sound the commonly-used indices often measure the wrong factors focusing on average water use rather than basic
Measuring Progress Toward Universal Access to Water and Sanitation in California 21
cost of 43 GPCD drinking waterand wastewater
discretionary incomeARhousehold =
Where discretionary income equals household gross income minus expenses on shelter health care transportation food laundry and cleaning telephone home energy and taxes
The cutoffs between Satisfactory Moderate Marginal and Unacceptable Affordability service indicators are more-or-less arbitrary It is clear that the cost of water should be less than 100 of discretionary income and more than 0 but there is no clear set of guidelines to determine precisely where to place affordability thresholds We suggest defining Satisfactory affordability as a household spending no more than 10 of their discretionary income on all water costs (or 5 on drinking water and 5 on wastewater if information on one is unavailable) We suggest a maximum of 20 of discretionary income as the cutoff for Moderate and 30 for Marginal (Table 6) We selected 10 of discretionary income for the Satisfactory standard because it aligned with the suggestion in Teodoro (2018) It seems reasonable to infer that a household spending more than 30 of discretionary income would face unreasonable tradeoffs with other necessary expenditures especially when unanticipated large expenses arise
At face value these thresholds seem higher than other affordability ratios such as the 15 of
Two recent papers (Davis and Teodoro 2014 Teodoro 2018) proposed calculating an Affordability Ratio (AR) as essential water needs divided by discretionary income Discretionary income is defined as income minus essential expenses apart from water They offer a ldquorule-of-thumbrdquo that AR should be no more than 10 for a four-person household with an income in the 20th percentile for the utility service area Their formula for calculating the affordability metric addresses some of the shortcomings of other definitions used in the past It calculates affordability for essential indoor water needs rather than average usage focuses on lower-income households rather than the median and makes an adjustment for the local cost of living The authors are clear that the offered 10 threshold is arbitrary and that it can and should be viewed as an expression of community values around water affordability and not regarded as a fixed immutable number
For household affordability we suggest calculating the percentage of discretionary income an individual household spends on essential indoor needs We recommend 43 gallons per capita per day (GPCD) as a reasonable volume of water to meet basic needs Detailed calculations for the volume of water required for household uses are described below in ldquoAccessible Drinking Waterrdquo The cost of water should be defined broadly to include drinking water and wastewater For areas with poor-quality domestic water the cost of water includes bottled water purchases For those reliant on private domestic wells and septic systems costs should include construction costs as well as operations and maintenance costs
Our recommendation for an affordability service indicator is to calculate an Affordability Ratio (AR) for a given household as the cost of 43 GPCD of drinking water and wastewater divided by discretionary income
Affordability should be calculated as the percentage of discretionary income an individual household spends on essential indoor needs
Measuring Progress Toward Universal Access to Water and Sanitation in California 22
$13 a month A satisfactory combined water and wastewater bill would be twice that or $26 For all 58 California Counties the Satisfactory Drinking Water standard sets a lower dollar limit on an ldquoaffordablerdquo bill than does 15 of gross income for a very low-income family
The data to inform this metric are typically available at the Census Tract scale or larger Consequently we also outline how to calculate an aggregate system-level analysis as a system-level affordability indicator For the System-Level Performance Measure described in Table 7 we consider a system in which half or more of its customers spend more than 10 of their discretionary income on water as Unacceptable When at least half the ratepayers are heavily burdened by the cost of water it is a strong indication that systemic reforms should be considered to bring the cost of water in line with what the community can afford to pay We suggest that a system in which 40 to 50 of households spend more than 10 of discretionary income on water would be considered Marginal 33 to 40 would be Moderate and less than 33 would be Satisfactory
MHI used in California This first impression is misleading The threshold for the proposed Affordability Service Indicator is set at a higher percentage than other metrics because the proposed indicator has a larger numerator and a smaller denominator The numerator incorporates water and wastewater while replacing gross or disposable income with discretionary income vastly reduces the denominator Consequently the dollar amount that would be considered ldquounaffordablerdquo is lower for the household-level performance measure than for 15 of MHI or even 15 of total income for a very low income family (Table 5)
For example in Tulare county where median household income was $43000 in 2017 (US Census Bureau 2017) a water bill would be considered unaffordable according to the State Water Board standard of 15 MHI if drinking water cost more than $53 a month For a family classified as Very Low Income for Tulare County earning $27000 annually 15 of monthly income equals $34 By contrast 5 of discretionary income for a very low-income family in Tulare County is only
Table 5
ldquoAffordablerdquo Drinking Water Bills According to Three Metrics for Three Representative Counties
Metric 1 Metric 2 Metric 3 (this report)
CA State Water Board definition le15 of MHI le15 of VLI
Satisfactory Drinking Water Cost le5 of DI
Moderate Drinking Water Cost gt5-10 of DI
Marginal Drinking Water Cost gt10 -15 of DI
Unacceptable Drinking Water Cost (gt15 of DI)
dollars ($)
Santa Clara County
le126 le67 le40 gt40 - 81 gt81 - 121 gt121
Tulare County le53 le34 le13 gt13 - 26 gt26 - 39 gt39
Trinity County le44 le34 le13 gt13 - 25 gt25 - 38 gt38
Notes Figures are for drinking water alone excluding wastewater All values in dollars Cost for non-water essentials based on US Housing and Urban Development Fair Market Rate for a 2-bedroom unit in 2018 other figures from US Census Bureau Customer Expenditure Survey results for households earning $20-29000 annually in the Western United States VLI ndash Very Low Income for a household of 3 according to US Housing and Urban Development (2017) DI ndash Discretionary Income for a VLI household
Measuring Progress Toward Universal Access to Water and Sanitation in California 23
The System-Level Performance Measure indicator could be used to evaluate the impact of management decisions Rate-setting investment decisions and conservation and efficiency programs can all be considered in the context of how they will impact the System-Level Performance Measure Every system is unique and the cost of service can vary greatly depending on factors such as the quality and reliability of the source water and the size of the ratepayer base Yet there are management decisions that can depending on circumstances lower the cost of essential water needs Options include consolidation and regionalization (Wolff and Hallstein 2005) rate structures that reduce the cost of indoor water use relative to outdoor use (Feinstein et al 2017 Donnelly and Christian-Smith 2013) accurate demand forecasting that does not drive overinvestment in new supplies (Heberger Kristina and Cooley 2016 Diringer et al in press) and prioritizing the lowest-cost sources of new supply (Cooley and Phurisamban 2017)
We caution that water priced too low to cover the long-term costs of maintaining the system may appear affordable but is merely deferring expenses until later Many water systems in the United States have consistently underinvested in infrastructure needs which leads eventually to failures to deliver safe and accessible water and in the long run are likely to result in rate hikes that make water unaffordable for future generations (Kane 2016) Truly affordable water is priced with a trade-off in mind revenue should be high enough that the service provider can maintain their system and make necessary infrastructure investments but household bills should be low enough that customers can afford their other essential expenses
To calculate discretionary income one can use a simple approach to identify a lower-limit estimate of essential expenses US Housing and Urban Development gives estimates of Fair Market Rents by county or metropolitan area for shelter For other items (healthcare transportation food at home laundry and cleaning telephone home energy and taxes) US Bureau of Labor Statisticsrsquo Customer Expenditure Surveys information on expenses for households earning $20000 to $30000 a year for the United States Western Region provides an approximation of a basic cost of living4 We selected expenses in the $20000 to $30000 annual income category as an indicator of a conservative basic cost of living because spending on essential expenses increases sharply up to this income bracket than gradually levels off for households in higher-earning categories There are limits to this approach to estimating cost of living first it does not account for fine-scale variation in cost of living and it leaves out childcare which is necessary for families that do not have a stay-at-home parent or other caregiver A sensitivity analysis could illuminate the degree to which these limitations impact the estimate of water affordability
4 The Western Region for the Customer Expenditure Survey is composed of Alaska Arizona California Colorado Hawaii Idaho Montana Nevada New Mexico Oregon Utah Washington and Wyoming
We caution that water priced too low to cover the long-term costs of maintaining the system may appear affordable but is merely deferring expenses until later
Measuring Progress Toward Universal Access to Water and Sanitation in California 24
Eligibility for Customer Assistance Program (ECAP) A persistent question in water affordability is who should qualify for a low-income customer assistance program The household-level metric we propose is challenging to calculate and would be difficult for customers to understand Ultimately if the goal of an affordability program is to prevent low-income families from being forced to make trade-offs to pay their water bill or do without sufficient water then it is unnecessary to construct an elaborate metric to determine who should qualify It is sufficient simply to identify households with very limited discretionary income and offer them customer assistance A simple eligibility standard for customer assistance programs is whether a household earns less than 200 of the Federal Poverty Line (FPL) or less than the US Housing and Urban Developmentrsquos Very Low Income (VLI) cutoff for the county whichever
It is important to note that spending 10 of discretionary income on water is only attainable for those with some discretionary income The most severely impoverished persons will be unable to cover any substantial portion of the costs of water service The goal of providing affordable water to all implies the need for customer assistance programs to ensure water is affordable for the poorest households who have little or no income remaining after meeting basic living expenses
AnCILLAry PerFOrMAnCe MeASureS FOr AFFOrDABLe DrInkInG WATer AnD SAnITATIOn
We propose two related metrics to consider when evaluating affordability at the system level These are intended to supplement the main affordability performance measures
Table 6
Household-Level Service Indicators and Performance Measures for Affordable Drinking Water and Sanitation in California
Goal Cost of essential water and sanitation needs should be inexpensive enough that cost does not prevent access nor interfere with other essential expenditures
Household-Level Service Indicator Household-Level Performance Measure
Satisfactory Household can afford safe accessible water and sanitation without facing tradeoffs with other essential expenditures
Household spends le10 of discretionary income on essential water and sanitation needs
Moderate
Household spends gt10 but le20 of discretionary income on essential water and sanitation needs
Marginal Household occasionally cannot afford safe accessible water and sanitation without facing tradeoffs with other essential expenditures
Household spends gt20 but le30 of discretionary income on essential water and sanitation needs
Unacceptable Household regularly cannot afford safe accessible water and sanitation without facing tradeoffs with other essential expenditures
Household spends gt30 of discretionary income on essential water and sanitation needs
Notes To provide the best indication of true cost burden per household these costs should be calculated after any applicable low-income bill discount is applied In many areas there is data available only for the cost of drinking water in which case we suggest halving the percentage of discretionary income (ie 5 of discretionary income would meet the Satisfactory standard for affordable water) Essential water and sanitation needs covers 43 GPCD of water and wastewater (Table 9)
Serv
ice
Leve
l
Measuring Progress Toward Universal Access to Water and Sanitation in California 25
Involuntary Shutoff Rate The involuntary shutoff rate calculated as the number of involuntary shutoffs for residential customers divided by the number of residential connections is a coarse but useful metric for gauging the affordability of water rates The number is an imperfect metric for households unable to pay for water because it may include involuntary service disconnections to households that choose not to pay along with those unable to pay5 Nonetheless it provides a useful relative index of affordability for example one
5 Ideally one would be able to measure disconnections for low-income households separately but at this time the State Water Board plans to collect information solely on total number of shutoffs ordered by each water utility
is greater Thus a relatively simple formula to determine whether a household in a given county qualifies for customer assistance would be
gross household income le 200 FPL or VLI whichever is greater
This standard can be calculated from readily-available data It has the advantages of scaling with household size (FPL and VLI account for the number of persons in a household) and also adjusting to some extent for local cost of living (VLI is higher than 200 FPL in high-earning counties) This approach also would facilitate cross-enrollment with other programs that use the 200 FPL and VLI standards
Table 7
System-Level Service Indicators and Performance Measures for Affordable Drinking Water and Sanitation in California
Goal Cost of essential water and sanitation needs should be inexpensive enough that cost does not prevent access nor interfere with other essential expenditures
System-Level Service Indicator System-Level Performance Measure
Satisfactory Most households spend a minority of their discretionary income on essential drinking and wastewater needs without financial assistance households with a high water cost burden receive financial assistance
More than 33 of households do not meet the Satisfactory standard for affordability disregarding low-income bill discount programs For those spending more a low-income bill discount program is available
Moderate
More than 40 of households do not meet the Satisfactory standard for affordability disregarding low-income bill discount programs For those spending more a low-income bill discount program is available
Marginal Nearly half of households spend a substantial proportion of their discretionary income on essential drinking and wastewater needs without financial assistance and financial assistance is not available
More than 50 of households do not meet the Satisfactory standard for affordability disregarding low-income bill discount programs
Unacceptable More than half of households spend a substantial proportion of their discretionary income on essential drinking and wastewater needs without financial assistance and financial assistance is not available
More than 50 of households do not meet the Satisfactory standard for affordability disregarding low-income bill discount programs
Serv
ice
Leve
l
Measuring Progress Toward Universal Access to Water and Sanitation in California 26
between households that are enrolled in a customer assistance program to similar households that are not enrolled
DATA SOurCeS FOr AFFOrDABLe DrInkInG WATer AnD SAnITATIOn
Table 8 describes data sources to inform the performance measures on affordable water and sanitation The Electronic Annual Reports California American Water Rate Survey and Wastewater User Charge Survey provide information on water rates for PWSs and centralized municipal wastewater systems The Electronic Annual Reports also began to collect information on service disconnections in 2018
would expect involuntary shutoffs to decline after instituting a customer assistance program Indeed when a group of customers with delinquent bills in St Petersburg Florida were randomly selected to receive debt restructuring and financial counseling they had a decreased rate of shutoffs relative to control groups (Moulton et al 2016) Most importantly measuring involuntary shutoffs should generate information on the degree to which affordability acts as a barrier to water access and whether existing affordability programs are sufficient to ensure that even very low-income customers can afford to consistently pay their water bill A related useful approach to measuring involuntary shutoffs would be to compare rates
Table 8
Data Sources for Affordable Water and Sanitation Performance Measures
Description Collected By InformationGeographic Scale Significance
Electronic Annual Reports
California State Water Board
Self-reported data on rate structures for Public Water Systems calculates residential bill at 6 12 and 24 CCF (4500 7500 and 1500 gals) Also collects information on service disconnections
Public Water System
Cost of drinking water for Public Water Systems In 2015 public version of report had information for ~650 large systems Rates information is not extensively screened for accuracy Also useful for estimating the Involuntary Shutoff Rate
California American Water Rate Survey
California American Water (private sector)
Rate structures for Public Water Systems calculates residential bill at 10 CCF (7500 gals)
Public Water System
Cost of drinking water for Public Water Systems of a variety of sizes mostly larger 2015 version had information for ~900 systems Detailed structure information allows user to calculate cost at any volume
Wastewater User Charge Survey
California State Water Board
Self-reported rate structures for ~650 wastewater systems gives estimate of average residential bill
Wastewater Agency
Gives an approximation of wastewater costs though few details are provided on how systems estimated the average bill
American Community Survey
US Census Bureau
Table S1901 gives number of households by income category B19080 gives income quintile limits S2501 gives household size
Census Tract Information on the income levels and household sizes for calculating the affordability ratio
Continued on Next Page
Measuring Progress Toward Universal Access to Water and Sanitation in California 27
DATA GAPS AnD AnALyTICAL ChALLenGeS FOr AFFOrDABLe DrInkInG WATer AnD SAnITATIOn
There are a number of topics relevant to affordability where information is unavailable data have not been compiled in a centralized dataset or important numbers are challenging to calculate
The American Community Survey US Customer Expenditure Survey Family Budget Calculator American Housing Survey and American Community Survey Public Use Microdata Samples provide information on household incomes and expenditures Federal Poverty Guidelines and Affordable Housing Income Thresholds and Fair Market Rents provide information on thresholds for poverty and baseline housing costs
Table 8 (Continued)
Data Sources for Affordable Water and Sanitation Performance Measures
Description Collected By InformationGeographic Scale Significance
US Customer Expenditure Survey
US Department of Labor Bureau of Labor Statistics
Information on household expenditures by income category
Aggregated for American West and large metro areas microdata for county and metro area
Information on non-water essential expenses for calculating the affordability indicator
Family Budget Calculator
Economic Policy Institute
Information on essential expenditures by category based on family size and composition
County and metropolitan area
Information on non-water essential expenses for calculating the affordability indicator
American Housing Survey (topics Income and Housing Costs)
US Census Bureau
Information on income and housing costs
Statewide and select metro areas full geographic data in classified version
Survey of income and housing costs including shelter and utilities
American Community Survey Public Use Microdata Samples
US Census Bureau
Self-reported information on income and the amount of money spent on water
Public Use Microdata area
Asks individual households to report their spending on water and income
Federal Poverty Guidelines
US HHS Threshold for poverty defined by income and household size
National Relevant for calculating Eligibilityfor Customer Assistance Program (ECAP) performance measure
Affordable Housing Income Thresholds and Fair Market Rents
US HUD Lists Area Median Incomes defines regional income categories (eg VLI) and lists Fair Market Rents for housing
County and metro area
Relevant for calculating Eligibilityfor Customer Assistance Program (ECAP) performance measure
Note Additional details on data sources including links to online resources and update schedule are available in Online Appendix II
Measuring Progress Toward Universal Access to Water and Sanitation in California 28
Valley in 2016 cost $25000 to $35000 which was prohibitively expensive for many households whose wells ran dry in the 2012-2016 drought (Feinstein et al 2017) Septic systems require routine maintenance every 2-5 years that costs a few hundred dollars (US EPA 2005)
Accessible Drinking Water
We describe standards for accessible drinking water in Table 10 as meeting defined requirements for volume location and reliability of drinking water access similar to the approach employed by JMP (WHO and UNICEF 2017b) The goal for accessible water should be available in the home in sufficient volumes to meet domestic needs at hot and cold temperatures twenty-four hours a day The goal has four components volume temperature physical proximity and temporal availability We generated estimates of sufficient volume both from existing literature and recent data collected in California and North America described in greater detail in the section on ldquoSufficient Volumerdquo The standards for temperature location and times available were derived from statutory guidelines
California statute expressly defines residences fit for habitation as including indoor hot and cold running water (California Civil Code sect1941 and Health and Safety Code sect179203)6 This standard also aligns with the best available dataset on access to water the American Community Survey which asks respondents whether they have hot and cold piped water in their dwelling unit (US
6 California Civil Code sect19411(a) deems dwellings ldquountenantablerdquo if they lack a water supply capable of producing hot and cold running water furnished to appropriate fixtures and connected to a sewage disposal system Likewise California Health and Safety Code sect179203 defines a substandard building as lacking hot and cold running water to plumbing fixtures in a dwelling unit or hotel
Sewer charges not billed by the utility Sewer charges are often levied through other means besides a utility bill such as through annual property taxes To our knowledge there is no centralized dataset of such charges
Fine-resolution method to calculate discretionary income The Customer Expenditure Survey provides fine-scale information on expenditures for the largest metropolitan areas For other areas the information is generally classified at the state or multi-state level It is possible to use regression models to account for regional variability (eg see Teodoro 2018) but this approach compromises the goal of ease of use and transparency
Data that disaggregate income and household size simultaneously Both income and household size impact affordability but American Community Survey data do not disaggregate both simultaneously preventing one from understanding the interaction between the two factors For example a household of one earning $30000 a year may not be burdened by the cost of water but a household earning a similar amount with seven members may be Generally analysts have looked at the variation in household income while assuming that all households are average or slightly above average size ignoring the interaction between income and household size
Costs to construct operate and maintain a Very Small System or septic system The capital costs of constructing operating and maintaining decentralized infrastructure are not often addressed in conversations around affordability nor are we aware of authoritative estimates of the costs The maintenance costs of decentralized systems while low on a per-month basis often arrive in lump sums that are difficult to pay for families with limited cash and credit For example drilling or deepening a well in the San Joaquin
Measuring Progress Toward Universal Access to Water and Sanitation in California 29
SuFFICIenT VOLuMe
There have been several attempts to quantify the amount of water required to meet basic human water needs in the international community One of the most commonly-cited figures is from Gleick (1996) which estimated that 13 GPCD was sufficient to provide a minimum standard for drinking sanitation bathing and food preparation The WHO (2015) suggests that a lesser amount (6-9 GPCD) is sufficient in the medium-term to meet basic needs Further UNDP (2006) recommends an additional 2 GPCD for personal consumption to account for the greater needs of lactating women We used a combination of Gleickrsquos estimates for sanitation bathing and food preparation plus the UNDPrsquos higher estimate for consumption to recommend 14 GPCD as meeting the Marginal standard for access to water in California These volumes while sufficient for survival nonetheless reflect an austere standard of living ndash for instance they would not accommodate the use of a flush toilet To develop the Moderate and Satisfactory standards for volume we looked to legal and observed precedents developed for indoor residential use in California
Various statutes regulations and government documents have suggested reasonable volumes for basic indoor use in California Specifically the State Water Boardrsquos resolution on the Human Right to Water (State Water Board 2016b) pointed to two precedents for estimating a reasonable maximum daily per capita human use the 55 GPCD ldquoprovisional indoor standardrdquo referred to in California Water Code sect1060820 and the 50 GPCD maximum for domestic use diversions filed in the California Code of Regulations (CCR) during the height of drought in 2014 (CCR sect8781)7 The 55 GPCD figure in the California Water Code was offered as a ldquoprovisional indoor standardrdquo when
7 CCR sect8781 was repealed in 2015
Census Bureau 2016) Consequently we defined Satisfactory water access as including hot and cold indoor piped water available 24 hours a day in sufficient volumes for an average Californian to use for drinking cooking cleaning and operating a flush toilet
For Moderate access we allow for hot and cold running water that is on the premises but either shared with other units or outdoors For example shared living situations such as SROs boat marinas and parks for vans and trailers typically offer shared access to piped hot and cold drinking water Moderate access should provide sufficient enough water to meet typical indoor needs for a house with indoor plumbing including a flush toilet Marginal access would constitute traveling some distance no more than half an hour round-trip to collect a minimum volume of water sufficient for cooking cleaning and modest sanitation needs such as flushing an efficient toilet two or three times a day
Estimating sufficient volume to meet essential indoor needs in a developed country was challenging We found that most existing estimates are based on volumes necessary for survival in short-term circumstances such as refugee camps On the other hand estimates of typical indoor use in California and the United States were generally not based on recent empirical data that separate leaks and outdoor irrigation from essential indoor uses of water In the following section we offer an empirical estimate of the amount of water needed for essential indoor uses In brief we recommend 43 GPCD as a reasonable volume of water to meet indoor needs in a building with indoor plumbing We incorporated the 43 GPCD figure into the Satisfactory and Moderate standards We suggest 14 GPCD as a volume sufficient to meet basic human needs in the short term and employ that figure for the Marginal standard
Measuring Progress Toward Universal Access to Water and Sanitation in California 30
basis for the volumes but 50 GPCD is a common benchmark for minimum indoor water use in the United States supported by US EPA work from the 1990s to estimate flows for sewer system design (Bowne Naret and Otis 1994)
We estimated a volume of water to meet Essential Indoor Uses (EIU) including to operate a shower or bath run a faucet wash dishes and clothes and flush a toilet We calculated indoor water requirements by determining the expected water use from each device in the home and summing the volumes We exclude water loss from household leaks The average water use for each appliance or fixture in California was based on data from the California Single Family Water Use Efficiency Study (DeOreo et al 2011) This study found that total indoor use (including leaks) was 58 GPCD although observed indoor use was highly variable with a standard deviation of 36 GPCD The study was conducted between 2006-2008 and we expect average indoor use to have declined since then as new high-efficiency devices have become more common in both new and existing homes Based on studies documenting a 09 annual decline in average indoor water use from the 2006-2008 period to 2016 (DeOreo et al 2016) we estimate that average indoor water use likely declined to slightly less than 10 from 2007 to 2018 from 47 to 43 GPCD (Table 9 detailed calculations in Appendix I Sufficient Water) Residents in California tend to use less water indoors than residents of other regions in North America For example residents of nine North American cities in the United States and Canada in 2016 still used slightly more water indoors than residents did a decade earlier in California (DeOreo et al 2016)
We also provide estimates of the water required to meet EIU for households with appliances that meet current state standards and leading-edge technology For these estimates we multiply
California adopted laws on water conservation in 2009 Based on an earlier study (Mayer et al 1999) California Department of Water Resources (DWR) estimated that baseline indoor use in California was 693 GPCD (DWR 2010a) A 20 reduction in per capita usage as required under Senate Bill 7x-7 would reduce indoor usage to 55 GPCD DWR recognized that the 55 GPCD indoor standard was arbitrary and committed to conduct a study to allow the legislature to re-evaluate the standard in 2016 (California Water Code sect1060820 DWR 2010b) To the best of our knowledge the eventual report to the legislature on the topic did not revisit the indoor standard (DWR 2017)
The 50 GPCD standard has a more enigmatic origin In their resolution adopting a maximum of 50 GPCD for domestic diversion the State Water Board noted that there were ldquodata indicating that basic human needs require between 37 and 50 gallons per person per dayrdquo (State Water Board 2015a) Without a citation it is difficult to infer the
Source Mshch iStock
A typical Californian requires 43 gallons a day for consumption cooking cleaning and to flush a toilet
Measuring Progress Toward Universal Access to Water and Sanitation in California 31
Table 9
Volume of Drinking Water to Meet Essential Indoor Uses
Use(s)
A B C D E
Adjusted Water Use in California Cities 2018
Observed Water Use in California Cities 2006-2008
California Standard Flow Rating
Leading Edge Technology Flow Rating
Observed Water Use in North American Cities 2016
Essential Indoor Use 43 47 37 24 49
Leaks 9 10 NA NA 8
Total Indoor Use 52 58 37 24 57
Notes Detailed calculations and additional estimates for average behavior are available in Online Appendix I worksheet ldquoSufficient Waterrdquo Tables B-D Units in gallons per capita day (GPCD) Observed Water Use for California and North American Cities (Cols B and E) are derived from residential end uses of water studies The Adjusted Water Use (Col A) is based on Col B with the assumption that per capita indoor water use declined by 9 annually from 2007-2018 Cols C and D are the product of observed water use behavior multiplied by California and leading-edge device flow ratings Numbers are rounded to the nearest whole number and may not sum to total because of rounding errors
Source Cols A and B from DeOreo et al 2016 Cols C and D are average indoor water use behavior from DeOreo et al 2011 multiplied by California 2018 flow rating standards and leading-edge technology flow ratings given in Online Appendix I Col E is observed residential end uses of water for cities in the United States and Canada
Table 10
Service Indicators and Performance Measures for Accessible Drinking Water in California
Goal Water should be available in sufficient volumes to meet domestic needs at hot and cold temperatures in a location near home at the times needed
Household-Level Service IndicatorHousehold-Level Performance Measure
Satisfactory Sufficient hot and cold indoor piped water reliably available 24 hours a day
At least 43 GPCD hot and cold indoor piped potable water available 24 hours a day
Moderate Sufficient hot and cold water from an improved source available on premises (indoors or outside) and reliably available 24 hours a day bottled or delivered water acceptable in some circumstances
At least 43 GPCD hot and cold piped potable water available on the premises 24 hours a day
Marginal Sufficient water from an improved source including bottled water or tanks of water delivered by truck provided collection time is not more than 30 minutes round-trip (including waiting time) and reliably available at least 12 hours a day
Improved potable water source providing at least 14 GPCD within 30 minutes round-trip of place of residence (including waiting time) available at least 12 hours a day
Unacceptable Water that does not meet at least the Marginal standards for access
Any one of the characteristics of Marginal access to water is not met
Notes The rationale for 43 GPCD as sufficient to meet Essential Indoor Uses is shown in Table 9 The figure of 14 GPCD for marginal access sums figures given in Gleick (1996) for sanitation services cooking and cleaning and bathing plus the figure given in UNDP (2006) as a minimum requirement for drinking Gleick states that 5 liters is a true minimum of drinking water to sustain life in moderate climatic conditions but UNDP (2006) states that the basic requirement for a lactating woman engaged in moderate physical activity is 75 liters a day We selected the higher number as a precaution
Serv
ice
Leve
l
Measuring Progress Toward Universal Access to Water and Sanitation in California 32
We recommend a number of ancillary metrics to consider not just current access to water but also long-term factors that may impact access
Water Supply Resilience While a household may have sufficient water in the short term its water supply may be vulnerable to drought and other natural disasters in the long term Indicators of supply resilience include
bullDrought Contingency Plan in Place Resilience for urban water suppliers can be evaluated based on the results of the Urban Water Management Plans submitted to California Department of Water Resources Urban water suppliers are defined as serving more than 3000 customers or supplying more than 3000 acre-feet of water annually Water systems below the size threshold to qualify as urban suppliers may develop drought contingency plans voluntarily DWR began a stakeholder process in 2015 to develop a county-wide drought contingency planning process to encompass small and medium water suppliers but this policy has not been finalized
bullHistory of Past Water Shortages Water shortages among public water systems have been tracked through several datasets Applications for Drought Assistance Funding (California State Water Board 2016e) Small Supplier Conservation Reports (California State Water Board 2016d) and Drought Vulnerability and Risk Assessments for Tribal Drinking Water Systems (Indian Health Services 2015) These three datasets were compiled for the 2012-2016 report Drought and Equity in California (Feinstein et al 2017) Water shortages in Very Small Systems have been tracked through voluntary reporting to counties and compiled statewide in the Household Water Supply Shortage Reporting System (State of California 2017)
average daily use rates for each device eg number of flushes per day from DeOreo et al (2011) by the flow rates of devices meeting current state standards and ultra-high efficiency devices Leaks in California households result in an average loss of 10 GPCD although we do not include leaks in the estimate of EIU Based on these assumptions we estimate that the water required for EIU is 37 GPCD and 24 GPCD for a household equipped with devices that meet current standards and cutting-edge technology respectively Upgraded devices could yield substantial improvements in water efficiency More efficient devices will continue to penetrate the market over time and new water-efficient technologies are regularly being developed
Based on available data we estimate that current EIU in California is 43 GPCD which is equivalent to 5 Centum Cubic Feet (CCF) per month for an average-sized household of 295 persons in California (US Census Bureau 2018) This is likely a somewhat generous estimate of EIU given that it is higher than what was observed for many cities during winter months in 2016 and 2017 (Outdoor irrigation is lower in the winter so residential usage during these months reflects mostly essential indoor uses plus leaks and winter outdoor irrigation) In February 2017 34 out of 409 urban water suppliers had a per capita residential usage of 43 GPCD or lower (Heberger 2018) This indicates that many Californians are already using 43 GPCD or less even when including leaks and some winter outdoor irrigation
AnCILLAry MeTrICS On ACCeSSIBLe DrInkInG WATer
One of the most challenging aspects of evaluating access to water is that it can fluctuate over time due to factors such as a shutoff for delinquent payment or long-term supply vulnerabilities
Measuring Progress Toward Universal Access to Water and Sanitation in California 33
home or rely on a very small water system that cannot consistently supply sufficient quantities of water Marginalized and disadvantaged communities are also typically the most difficult to count in surveys Persons with inadequate housing or water may avoid reporting problems because they fear repercussions such as eviction or deportation While American Community Survey and homeless Point-in-Time counts described in Table 10 provide a relatively robust overview of persons without adequate access to water by region of California they may undercount vulnerable persons
In terms of understanding water supply vulnerabilities we have information on shortages during the 2012-2016 drought which affected thousands of Very Small Systems and more than one hundred small to medium public water systems in the state (Feinstein et al 2017) The chief analytical challenge is projecting the likelihood of future supply shortages For Very Small Systems
bullGroundwater Levels and Trends Relative to Domestic Water Well Depth In over-drafted water basins groundwater levels are declining over the long term The trend may reverse during wet years but not enough to compensate for over drafting during dry periods Shallow domestic water wells are vulnerable to supply shortages as the groundwater level drops The Sustainable Groundwater Management Act should bring groundwater levels into equilibrium once the Groundwater Management Plans go into effect however it is unclear whether these plans will universally set groundwater levels above the depth of existing domestic wells An understanding of long-term trends in groundwater relative to the completion depths of domestic wells would provide an index of supply vulnerability by groundwater basin
bullUrban Water Supplier Reliability Urban water suppliers (water utilities serving more than 3000 customers or over 3000 acre-feet annually) report information on supply reliability under the California State Water Boardrsquos Emergency Urban Water Conservation Requirements as well as DWRrsquos Urban Water Management Plans
DATA SOurCeS On ACCeSSIBLe DrInkInG WATer
Table 11 describes data sources to inform the performance measures on accessible water Much of these data sources focus on the quality of housing which is a major determining factor in water access Other focus on water supply vulnerabilities either as reported in the past or projected in the future
DATA GAPS AnD AnALyTICAL ChALLenGeS FOr ACCeSSIBLe DrInkInG WATer
Persons with inadequate access to water typically reside in homes not built to code do not have a
Source InnaPoka iStock
Lack of indoor running water and toilets is closely linked to problems of poor-quality housing
Measuring Progress Toward Universal Access to Water and Sanitation in California 34
Table 11
Data Sources for Accessible Drinking Water Performance Measures
Description Collected By InformationGeographic Scale Significance
American Housing Survey (topics Equipment and Appliances Healthy Homes Housing Problems)
US Census Bureau
Source of water indoor plumbing fixtures water supply outages hot water availability
Statewide and select metro areas full geographic data in classified version
Household survey on source of water supply outages and nature of indoor plumbing fixtures
American Community Survey tables
US Census Bureau
Complete plumbing Census Tract Useful for understanding rates of housing with incomplete plumbing at a fairly fine geographic scale However results conflate lack of hot piped water lack of cold piped water lack of tub or shower and lack of toilet
American Community Survey Integrated Public Use Microdata Series
US Census Bureau
Hot and cold piped water bathshower toilet (discontinued in 2016)
Public Use Microdata Areas (103 counties)
Useful for understanding rates of housing units lacking hot and cold running water
Homeless point-in-time counts
US Housing and Urban Development
Annual counts of homeless persons
Continuums of Care (cities or counties)
Gives the number of homeless persons in an area
Household water shortages
California DWR Reports of household water shortages resulting from a dry well stream creek or other surface water supply
County Voluntary reporting of shortages for households supplied by very small systems
Water well completion reports
California DWR Well location completion depth perforation depth and intended use
Public Land Survey System sections (1 m2)
Perforated depths in conjunction with local groundwater level and trend can indicate likelihood of groundwater supply vulnerability
California Statewide Groundwater Elevation Monitoring
California DWR Groundwater depth over time Groundwater basin
In conjunction with well completion reports can indicate likelihood of groundwater supply vulnerability
Urban Water Management Plans
California DWR Projects future supply and demand describes drought contingency plan
Public Water System
Indicator of potential for future supply shortages
Safe Drinking Water Information System
California State Water Board
Type of water source (groundwater surface water) number of interties
Public Water System
Information on water sources for public water systems
Notes Additional details on data sources including links to online resources and update schedule are available in Online Appendix II
Measuring Progress Toward Universal Access to Water and Sanitation in California 35
incidence of water-borne diseases such as cholera bacillary dysentery Escherichia (E) coli infections viral hepatitis A and typhoid The advances made in the late 19th and early 20th centuries to remove bacteria from drinking water and provide access to sanitation systems are the principle reason that mortality rates dropped by around half in major cities in the United States during that period (Cutler and Miller 2005) Additionally improved sanitation and the associated reduction in disease burden is a prerequisite for humans to realize their full potential cognitive and physical development (Hammer and Spears 2016)
Today the public is often more preoccupied with drinking water contaminants stemming from industrial or agricultural pollution than from human waste Yet there is evidence of serious gaps and failures in Californiarsquos sanitation systems For example between September 2017 and January 2018 there was a Hepatitis A outbreak concentrated in San Diego and Los Angeles counties with 588 cases reported in San Diego and 42 in Los Angeles (County of Los Angeles Public Health 2018 San Diego County Health and Human Services Agency 2018)8 Hepatitis A is transmitted by oral contact with feces and is associated with a lack of proper sanitation and hygiene facilities or the failure to use those facilities properly such as not washing onersquos hands after changing a diaper or before preparing food (County of Los Angeles Department of Public Health 2017) The majority of those affected were homeless and transmission
8 By comparison 770 cases were reported annually in the state in 2013-2014 according to California Department of Public Healthrsquos database of infectious diseases
that are strictly reliant on groundwater it would be useful to bring together information on groundwater basin levels trends and well depths to predict locations where domestic wells are vulnerable to shortages For small and medium Public Water Systems too small to be required to develop Urban Water Management Plans and the associated drought contingency plans for DWR there is little information to understand and predict their supply resilience The Safe Drinking Water Information System offers some information about the primary type of water supply (ground versus surface water) and number of interties to other systems However this is insufficient to develop a strong understanding of the supply resilience of small- to medium-sized Public Water Systems
sanitatiOn indiCatOrs and PerFOrManCe Measures
The California Water Code states that ldquoevery human being has the right to safe clean affordable and accessible water adequate for human consumption cooking and sanitary purposesrdquo (California Water Code sect1063) The last phrase designates water for sanitary purposes ndash ie operating a toilet ndash as part of the Human Right to Water However the infrastructure required for sanitation ndash namely a toilet for hygienically separating a person from their waste and a system for safely treating and disposing of waste such as a connection to a centralized wastewater treatment plant or a functional septic tank ndash are not explicitly mentioned and have been treated as lower priorities by government programs and civil society organizations dedicated to improving access to water (see companion report by Cador and Salceda 2018 for more discussion on efforts to improve access to water and sanitation)
While the law is ambiguous sanitation and hygiene are essential to realizing the public health benefits of adequate water Sanitation reduces the
There is evidence of serious gaps and failures in Californiarsquos sanitation systems
Measuring Progress Toward Universal Access to Water and Sanitation in California 36
closely linked to inadequate housing conditions In 2015 there were 89000 Californians living in substandard housing without private indoor flush toilets (ACS 2015) Lack of indoor toilets is a particularly prevalent on Californiarsquos tribal lands (California Department of Housing and Community Development Rural Community Assistance Corporation and California Coalition for Rural Housing in press)
There are also problems with inadequate sanitation that arise at the stage of treatment and disposal Proper treatment and disposal (or reuse) of waste can be accomplished with onsite wastewater treatment systems such as septic tanks or by centralized municipal wastewater systems While there are no comprehensive data on the numbers or extent of inadequate treatment of human waste in California there are known incidents of improper treatment and leaks In 2014 and 2016 30 of 1967 California waterways were designated as impaired for fecal indicator bacteria under section 303(d) of the federal Clean Water Act (California State Water Board 2016a) Fecal indicator bacteria can originate from any warm-blooded animal and it is technically difficult to determine whether the source is human or another animal However at least some of the sources are human In the San Diego Bay watershed it has been established that humans are the main source of fecal indicator bacteria in the waterways though the precise leakage pathway is undetermined (Steele et al 2017) Sanitary sewer overflows ndash accidental releases of untreated or partially treated water from centralized wastewater systems ndash occur thousands of times each year in California with 3361 releases reported in 2017 (State Water Board 2018d) The City of Oakland has a particularly egregious history of large sewage spills accompanied by inadequate reporting and public notification (Canon 2018)
stemmed from open defecation and lack of handwashing facilities
Public health officials tend to prioritize water over sanitation and within the realm of sanitation to focus on the toilet to the exclusion of the waste treatment system However there is growing recognition that the benefits of improved drinking water are only fully realized when there is also access to improved sanitation (Lipson et al 2010) Additionally field studies have shown that toilets not connected to a treatment system offer little health benefit to the users (Null et al 2018 Luby et al 2018) Safe water a toilet a system for treating human waste and facilities and soap for handwashing are all necessary to reduce fecal pathogen contamination and a disease burden that limits human potential
Safe Sanitation
The goal for safe sanitation is that waste be separated from the person by a well-designed toilet and then safely transported treated and discharged to the environment Problems can arise at both stages if people lack clean and properly-designed toilets or because the toilet is not connected to a functioning sanitary system
Problems with unsafe sanitation stemming from the lack of a toilet or other improved facility (such as a latrine with a seat or platform) are
The goal for safe sanitation is that waste be separated from the person by a well-designed toilet and then safely transported treated and discharged to the environment
Measuring Progress Toward Universal Access to Water and Sanitation in California 37
reasonable estimates of the number of people with a satisfactory standard of service are available although gaps exist as is described further in the sections exploring data on clean sanitation below
Moderate sanitation is essentially the same as the Satisfactory standard but can be met by any improved facility including a pour-flush or non-flush toilet as long as the toilet separates a person from their waste and is connected to a system for treatment and disposal The Moderate standard is
The indicators for measuring safe sanitation are informed by variation in the quality of the toilet and the caliber of the treatment and disposal system (Table 12) Satisfactory sanitation consists of a flush toilet connected to a system that hygienically separates waste from human contact where waste is safely disposed of on-site or transported and treated off-site This is consistent with various California statutes and regulations California statutes on owner-occupied and rental housing require that residences have hot and cold water connected to ldquoappropriate fixturesrdquo and connected to a sewage disposal system (California Civil Code sect1941 Health and Safety Code sect179203) State plumbing regulations describe standards for flush toilets connected to a sanitary drainage system (CCR Title 24 Part 5) Data to make
Thirty percent of California waterways were impaired for fecal indicator bacteria in 2016
Table 12
Service Indicators and Performance Measures for Safe Sanitation in California
Goal A sanitation system should separate waste from human contact until it can be safely treated and released to the environment or reused
Household-Level Service IndicatorHousehold-Level Performance Measure
Satisfactory Flush toilet connected to a system that hygienically separates waste from human contact where waste is safely disposed of on-site or transported and treated off-site
Flush toilet connected to a well-maintained sewage system or an onsite wastewater treatment system
Moderate An improved facility that hygienically separates waste from human contact where waste is safely disposed of on-site or transported and treated off-site
Pit latrine improved pit latrine (pit latrine with a slab or ventilated pit latrine) or composting toilets connected to a sewage system or an onsite wastewater treatment system
Marginal An improved facility that hygienically separates waste from human contact
Flush toilet pit latrine improved pit latrine or composting toilet not connected to a functional sewage system or an onsite wastewater treatment system
Unacceptable Use of unimproved facilities or open defecation Pit latrines without a seat hanging latrines bucket latrines or open defecation
Notes Improved facilities safely separate a person from their waste and include flush toilets pour flush toilets and latrines with a platform or seat Unimproved facilities do not safely separate a person from their waste while using the toilet Septic systems are the most common type of Onsite Wastewater Treatment System (OWTS)
Serv
ice
Leve
l
Measuring Progress Toward Universal Access to Water and Sanitation in California 38
the State Water Board in their Interactive Sanitary System Overflow Report There is relatively little centralized information available on the maintenance and illegal discharges from OWTS There is no California statewide database of OWTS locations which are regulated by Local Area Monitoring Programs (LAMPs) Pursuant to the OWTS Policy adopted in 2012 the LAMPs are required to transmit information annually to the Regional Water Boards on complaints investigations and permit issues for new and replacement OWTSs (State Water Board 2012) Acquiring copies of this information requires filing requests with the Regional Water Boards we have not reviewed the data and have limited insight into the content of the datasets
DATA GAPS AnD AnALyTICAL ChALLenGeS FOr SAFe SAnITATIOn
Lack of granularity for information on quality of toilets in the home Both the American Community Survey and American Housing Survey collect information on toilets but there are some barriers to effective use of these data The principle challenge in evaluating information on the location and adequacy of OWTS is that the information is collected by LAMPs and transmitted to Regional Water Boards it is not aggregated for the state nor is it readily available online The information is far more decentralized and difficult to access than comparable information on safe drinking water Additionally the American Community Survey collected information on toilets in the home until 2015 but discontinued the question in 2016 due to privacy concerns
Accessible Sanitation
The goal for accessible sanitation is that toilets should be private located in the home safe to visit and available when needed Accessibility is tightly interrelated with questions of safety and
consistent with the JMP Safely Managed Standard Non-flush toilets are legal in California and standards for such ldquoalternate plumbing systemsrdquo are described in regulations (CCR Title 24 Part 5 Appendix C) but typically non-flush toilets are meant to supplement not replace an indoor flush toilet
Marginal sanitation is met by an improved facility not connected to a functional sewage system or Onsite Wastewater Treatment System (OWTS) such as a septic system Such systems separate the person from their waste in the moment but allow release of pathogens to the environment that raise the disease burden of the population Such sanitation systems are an improvement over open defecation but still represent an unacceptable risk to the environment
Unacceptable sanitation is characterized by the use of an unimproved facility such as a pit latrine without a seat or platform or open defecation While not common among persons with housing open defecation is a growing problem as the homeless population rises in California and has been a topic of vigorous debate in cities as diverse as Chico Sacramento San Francisco Los Angeles San Diego and Anaheim (Halverstadt 2017 Scharaga 2018 Street Sheet Staff 2017 Sacramento Bee Editorial Board 2018 Los Angeles Central Providers Collaborative 2017)
DATA SOurCeS FOr SAFe SAnITATIOn
Table 13 describes data sources to inform the performance measures on safe sanitation Households report whether they have a flush toilet in the home and information on whether they are connected to a centralized sewer or OWTS via the American Community Survey and American Housing Survey Information on discharges of inadequately treated wastewater from centralized municipal systems is tracked by
Measuring Progress Toward Universal Access to Water and Sanitation in California 39
According to the American Community Survey and the American Housing Survey between 995 and 100 of housing units in California had an indoor toilet in 2015 (US Census Bureau 2015b) Nonetheless there are some important regional differences in the rates of housing units without toilets with some counties reaching rates as high as 2 (Feinstein and Daiess in prep) Many of those reporting that they lack their own toilet likely have access to a shared facility
cleanliness addressed in the previous section But the focus in the access dimension is on the factors affecting usability of a toilet the number of people who share it its location and whether it is properly maintained and cleaned
As with the safety dimension of sanitation housing conditions are a major determining factor in access to sanitation The vast majority of homes in California have a flush toilet in the unit
Table 13
Data Sources for Safe Sanitation Performance Measures
Description Collected By InformationGeographic Scale Significance
American Housing Survey (topics Equipment and Appliances Healthy Homes Housing Problems)
US Census Bureau
Availability and functionality of indoor toilet type and functionality of sewer system
Statewide and select metro areas full geographic data in classified version
Household survey on nature of sanitation equipment sewage system (sanitary sewer OWTS or none) and recent breakdowns of the toilet and sewage system
American Community Survey tables
US Census Bureau
Complete plumbing Census Tract Useful for understanding number of housing units with incomplete plumbing at a fine geographic scale However results conflate lack of hot piped water lack of cold piped water lack of tub or shower and lack of toilet
American Community Survey Integrated Public Use Microdata Series
US Census Bureau
Hot and cold piped water bathshower toilet (discontinued in 2016)
Public Use Microdata Areas (vary from 1-3 counties)
Useful for understanding rates of housing units lacking indoor private flush toilets
Interactive Sanitary System Overflow Report
California State Water Board
Sanitary sewer overflows for permitted SSOs and private lateral sewage discharges
County Useful for identifying centralized sanitary sewers and private lateral connections that are discharging untreated human waste to the environment
Local Area Monitoring Programs (LAMPs) Onsite Wastewater Treatment System Permits
LAMPs and Regional Water Boards
Permits for Onsite Wastewater Treatment Systems (OWTS) impact of OWTSs on regional water quality
LAMP (usually a county)
Information on discharges to the environment of untreated wastewater from OWTS
Note Additional details on data sources including links to online resources and update schedule are available in Online Appendix II
Measuring Progress Toward Universal Access to Water and Sanitation in California 40
public agencies close public restrooms at night to reduce the potential that they will be used for illegal activity One report on access to toilets for the homeless living on Los Angelesrsquos Skid Row found that while there were 43 toilets open at peak daytime hours that number dropped to only 9 between the hours of 8 PM and 6 AM (Los Angeles Central Providers Collaborative 2017) Many of the open toilets were broken or lacked some basic feature such as a door or minimum cleanliness The same report also interviewed homeless women who avoided public bathrooms because approaching them made the women vulnerable to assault These problems are not restricted to Los Angeles For instance San Francisco touts the 22 restrooms Yet all the toilets close by 8 PM or earlier (San Francisco Public Works nd)
DATA SOurCeS FOr ACCeSSIBLe SAnITATIOn
Table 15 describes data sources to inform the performance measures on accessible sanitation For housing units with private toilets the American
For those who have a home problems arise either because the toilet breaks down or is shared with too many people and non-relatives (Box 4) In 2015 2 of households reported experiencing a period of at least six hours in the past three months when they had no working toilet (US Census Bureau 2015a see Housing Quality Table) Crowded living conditions and non-relatives sharing a home also present problems for access to sanitation Problems of inadequate numbers of toilets have been documented for low-income farmworkers in crowded housing and for inhabitants of SROs reliant on shared facilities (California Institute for Rural Studies 2018 SRO Families United Collaborative nd San Francisco DPH 2016)
While there are problems of access to sanitation facing some Californians with housing by far the most serious problems are experienced by the homeless community As noted above in the Safe Sanitation section homeless persons must regularly resort to using buckets or defecating in the open because of a lack of nearby public toilets (McGahan 2018 Green 2017 Walker 2017 Schneider 2018) There are also more subtle issues around access wherein a public toilet is available but is unusable for a multitude of reasons toilets become unusable or unclean because they are shared by many people are subject to careless treatment and vandalism lack doors for privacy or are insufficiently maintained But there are also problems that are unique to public toilets These include bathrooms occupied by people for unintended purposes or the problem that people especially women are physically vulnerable when they approach a public restroom Many
San Francisco touts its 22 public restrooms Yet all the toilets close by 8 PM or earlier
Source Diane Bentley Raymond iStock
Persons experiencing homelessness lack ready access to toilets which compromises their and the communityrsquos health
Measuring Progress Toward Universal Access to Water and Sanitation in California 41
Box 4
Shared Toilets Context and Controversies
Are shared toilet facilities an adequate solution for meeting the right to sanitation The answer depends on how well the facilities are managed Residences of group facilities such as dormitories with professional cleaning staff routinely share toilets without difficulties How well these facilities function depends on whether there are sufficient cleaning and maintenance resources and the number of people sharing a toilet Originally the JMP Sanitation Task Team recommended a benchmark which would consider households using facilities shared by no more than five families and no more than 30 people (taken as a proxy for adequate management) as having access to ldquobasicrdquo sanitation Ultimately JMP designated shared facilities as having ldquolimitedrdquo sanitation service due to a lack of data on households and people sharing facilities and insufficient evidence to demonstrate that there is a link between the number of people and households sharing a toilet and how well it is operated (Evans et al 2017)
Ultimately the question of whether a shared toilet is adequate for access to sanitation depends on whether it is hygienic well-maintained and available when needed Shared toilets do not always fail to meet these standards but regularly do In SROs and homeless shelters tenants routinely encounter toilets too dirty to use and must resort to chamber pots instead A 2016 survey by the San Francisco Department of Public Health of the cityrsquos SROs found more than 400 sanitation violations and 170 plumbing violations from 2008 to 2012 (SF DPH 2016) The department noted that exposure to diseases transmitted through feces are a ldquoreal hazardrdquo for SRO residents Local news media profiles vividly documented problems San Francisco residents of SROs and homeless shelters face when using the toilet
The Tan family ldquoThe Tans immigrated to San Francisco from Canton in 2011 They moved into this hotel a year later Life in the US is better than in China they say but life in the hotel isnrsquot easy Each of the two rooms in the apartment costs $900 per month There is one communal toilet per floor (shared by 15 families) and one communal kitchen In the morning itrsquos not uncommon to wait 20 minutes for the bathroom Sometimes the family uses a bucket in their room insteadrdquo (Lybarger 2014)
Clarence ldquoWith nowhere else to turn he got a bed in the Sanctuary a menrsquos shelter administered by Episcopal Community Services He describes it as lsquoa ward of broken men who coughed and cursed all night In the morning half a dozen would file into the bathroom and shit on everythingrsquordquo (Lybarger 2014)
Ivy Gao and her family ldquoTheir three-year-old son uses a chamber pot she says lsquoThe bathroom on our floor is too dirty so Irsquom reluctant to let him use it If we had our own house I could let him go to the bathroom without worryingrsquordquo (Kam 2015)
SROs and shelters can have clean safe shared toilets if they are well-maintained but given the well-documented shortfalls one cannot simply assume that physical access to a toilet ensures that it is in usable condition
Measuring Progress Toward Universal Access to Water and Sanitation in California 42
at very low frequency such as lack of a toilet However it does not contain the same level of detail on breakdowns and number of bathrooms per household as the American Housing Survey
DATA GAPS AnD AnALyTICAL ChALLenGeS FOr ACCeSSIBLe SAnITATIOn
Access to sanitation for homeless persons To our knowledge there is no centralized extensive dataset on sanitation access for this population San Francisco posts some disconnected datasets on the locations of public toilets operated by a variety of city agencies (San Francisco Public Works nd) but to the best of our knowledge most cities do not offer even that level of information A model for surveying availability of toilets for the homeless can be found in ldquoNo Place to Go An Audit of the Public Toilet Crisis in Skid Rowrdquo (Los Angeles Central Providers Collaborative 2017)
Housing Survey collects information on the number of toilets frequency of breakdowns and the number of people sharing a housing unit For units without their own toilet there is a follow-up question on the location of the toilet (under Interior Features variable ldquoBATHEXCLUrdquo) However the rate of households in California is so small ndash less than 05 - that the results do not report any units without a toilet in its sample of 12900 housing units statewide The dataset is useful for tracking more common problems such as the number of households that lacked a usable toilet recently because of breakdowns and the number of people sharing a bathroom
The American Community Survey is a larger survey reaching nearly 2 million California households over a 5-year period Consequently it is more useful for tracking problems that occur
Table 14
Service Indicators and Performance Measures for Accessible Sanitation in California
Goal Toilets should be private located in the home safe to visit and available when needed
Household-Level Service IndicatorHousehold-Level Performance Measure
Satisfactory Private secure well-maintained in-home facility not shared with other households available 24 hours a day
Household has 24-hour access to a functioning toilet not shared with other households
Moderate Private secure well-maintained on-site facility possibly shared with other households available 24 hours a day
Household has 24-hour access to a functioning toilet either in the structure (not necessarily in their unit for multi-unit buildings) or on the property with at least one toilet per 10 male residents plus one toilet per 8 female residents
Marginal Private secure well-maintained facility possibly shared with other households no more than 50 meters from home available 24 hours a day
Household has 24-hour access to a functioning toilet shared with no more than 20 people within 50 meters of their usual place of residence
Unacceptable Facility is more than 50 meters from home not available 24 hours a day or use of the facility compromises personal safety or privacy
Any one of the characteristics of Marginal access to sanitation is not met
Serv
ice
Leve
l
Measuring Progress Toward Universal Access to Water and Sanitation in California 43
Adequacy of shared toilets Given the format of data collection on group quarters and SROs with shared toilets we are left to assume that they are moderately accessible if they do not serve more than the appropriate number of people In practice that may be far from the case but we have little information on their condition outside of any Department of Public Health inspections that may have taken place
Table 15
Data Sources for Accessible Sanitation Performance Measures
Description Collected By InformationGeographic Scale Significance
American Housing Survey (topics Structural Demographics)
US Census Bureau
Number of persons bathrooms per household location of bathroom (in unit out of unit outdoors)
Statewide and select metro areas full geographic data in classified version
Useful for understanding number of persons per bathroom
American Community Survey microdata
US Census Bureau
Hot and cold piped water bathshower toilet (discontinued in 2016)
Public Use Microdata Areas (vary from 1-3 counties)
Useful for understanding rates of housing lacking hot and cold running water tubshower or toilet
American Community Survey tables
US Census Bureau
Complete plumbing Census Tract Useful for understanding rates of housing units with incomplete plumbing at a fine geographic scale However results conflate lack of hot piped water lack of cold piped water lack of tub or shower and lack of toilet
Note Additional details on data sources including links to online resources and update schedule are available in Online Appendix II
Source Phi2 iStock
Shared toilets should be used by no more than 20 people within 50 meters of their usual place of residence and available 24 hours a day
Measuring Progress Toward Universal Access to Water and Sanitation in California 44
bullAccessible Water Consider facets of location volume and availability over short and long time scales (ie both running 24 hours a day and resilient to drought and climate change) Update common assumptions about volumes of water used indoors to reflect declining use in California and recognize that this trend will continue as appliances and fixtures are replaced
bullSafe Sanitation Consider both the adequacy of the toilet facility as constructed and the functioning of the sanitary system which should include a centralized or on-site wastewater system that adequately treats and disposes of or recycles human waste
bullAccessible Sanitation Consider proximity privacy security cleanliness and maintenance If the toilet is shared consider whether the number of people using the toilet is below reasonable limits
recommendations on Developing a Unified Set of Metrics to Inform Policy
bullAdopt a single consistent set of indicators and performance measures and designate a single entity entrusted with regularly assessing those metrics Efforts by DWR to develop sustainable water management indicators as part of the California Water Plan the State Water Boardrsquos resolution directing staff to develop goals and performance measures as part of its Human Right to Water Portal and OEHHArsquos evaluation of the status of the Human Right to Water are all valuable efforts Each will be more useful if they are merged into a unified framework that is employed by all stakeholders in California The Governor should convene the appropriate cabinet secretaries to identify the lead responsible agency for assessing water and sanitation service
ConClUSIonS AnD reCoMMenDATIonS
This report offers a unified framework on how to measure progress toward universal access to water and sanitation in California The various indicators and performance measures are tightly linked and it is not useful to work toward any subset in isolation What use is affordable water if it is undrinkable What is the value of clean water if it is unreliable What benefit is it to provide a sanitation facility with no place to wash your hands or a toilet that is connected to a leaky sewage system But taken as a whole these service ladders offer a checklist of the many items that compose a fully-developed approach to adequate water and sanitation service at the household and individual level
The service ladders are themselves sets of recommendations for goals indicators and performance measures for the state to adopt Even for those who only use this report as a starting point rather than a template for their work there are general principles that can be used as guidelines for any attempt to measure water and sanitation in the state Below we make a series of recommendations on how to improve our understanding of water and sanitation service in California and use that knowledge to improve the quality of service
recommendations on Metrics
bullSafe Water When tracking compliance with the California SDWA consider duration and frequency of time out of compliance in a given time period
bullAffordable Water and Sanitation Consider water wastewater and the costs of basic non-water needs when calculating affordability and consider both regional- and household-scale metrics
Measuring Progress Toward Universal Access to Water and Sanitation in California 45
within service area boundaries that are not connected to centralized systems have an on-premises plumbing problem or lack shelter Regional-scale data are useful but it is important to acknowledge its limits and to supplement it with granular information at the individual and household level when available
bullRecognize sanitation as an essential component of the Human Right to Water Current statute recognizes a right to water for sanitary purposes but does not address the other components of sanitation a toilet for personal use and a system for safely treating and disposing of the waste Like safe and sufficient water sanitation is necessary to ensure human health prevent epidemics of water-borne diseases and safeguard the quality of drinking water resources Adequate water without sanitation is insufficient for meeting the overriding objective of preventing waterborne health threats from chemical contaminants and disease
bullMeasure water and sanitation services in non-residential settings Schools preschools and hospitals host high concentrations of people vulnerable to disease Ensuring the basics of clean water a functional sanitation facility and a place to wash onersquos hands are vital for the health and safety of children and the ill While this publication does not address institutional settings this is a clear next step for further investigation
recommendations on remedying key Data Gaps
bull Investigate quality of water delivered by Very Small Systems ie domestic wells Mapping these problems requires understanding the quality of source water as well as the treatment of the water by the well operator If the state
bullUse a unified set of water and sanitation performance measures to direct funds and resources to the most pressing problems The current approach to allocating funds to disadvantaged communities relies on local actors applying for resources it is unknown to what degree needs go unmet because local entities do not have the capacity to seek assistance Measuring a set of drinking water and sanitation performance measures regularly would yield detailed information on the number location and characteristics of those households with the greatest need for improved water and sanitation services Funds to address drinking water and sanitation problems such as the proposed Safe and Affordable Drinking Water Fund (SB 623 Monning) should use performance measure results to identify and reach out to communities that are likely eligible for assistance
recommendations on the Scope and Scale of Water and Sanitation Service Metrics
bullShift from using performance of centralized water and sanitation systems as exclusive proxies for the quality of service to also tally households and individuals that are not adequately served by large institutions The Human Right to Water implies the importance of considering water and sanitation for every person Yet for many indicators the best or only data available are collected at regional scales ndash often the Public Water System or centralized wastewater system While most people are served by these systems many of the people without adequate water and sanitation are not These are small disadvantaged and remote rural communities outside of service area boundaries or persons
Measuring Progress Toward Universal Access to Water and Sanitation in California 46
Medium and large community water systems should record when service disconnections are for units that are known to be occupied
bullCompile locally-held information on leaking septic systems or other onsite wastewater treatment systems Anecdotally community organizations working with disadvantaged communities report that they serve households with improperly maintained septic systems Information on permit violations is collected by local government entities and transmitted to the Regional Water Boards The State Water Board should compile this information in a single statewide electronic database to develop a greater understanding of wastewater problems in the state
bullRegional board stormwater permits should require municipalities to collect data on publicly-accessible toilets and handwashing facilities Given the well-established role of universal sanitation in preventing water pollution and disease public toilets and handwashing facilities should be regarded as a primary strategy to safeguard the quality of Californiarsquos waterways Yet resources to improve stormwater quality have focused on strategies to clean stormwater rather than prevent fecal matter from entering in the first place Regional Water Boards could alter this by placing greater emphasis on provision of public toilets to reduce fecal matter in stormwater The first step would be to systematically collect information on location usability hours of public toilets and proximity to homeless encampments
begins to offer more financial support for domestic well owners to test and treat their water the program may yield useful data
bull Identify Public Water Systems that persistently fail to deliver water that meets Safe Drinking Water Act standards In their present format it is difficult to use the Safe Drinking Water Information System and the Human Right to Water Portal to distinguish temporary one-time violations of the SDWA from long-term problems
bullMeasure how many Californians face trade-offs between paying their water bill and other necessary expenses and how often that trade-off results in long-term debt accumulation or service disconnections A regional-scale understanding of households likely to have difficulty paying their water bill can be gleaned from datasets on cost of living household income and local water rates though the data on water rates are not complete There is relatively little information however on the number of households who face difficulty paying their water bill and almost none on whether difficulties in paying water bills results in long-term debt accumulation or service disconnections
bullCollect information on service disconnections that distinguishes between occupied and unoccupied residences Community water systems typically track service disconnections but it is not possible to distinguish between occupied households that lose service for failure to pay and unoccupied households where residences simply neglected to notify the utility when they vacated their home Yet utilities are required to notify the occupants of a home before disconnecting service and also routinely receive communications from the occupants offering multiple opportunities to record whether the unit appears to be occupied
Measuring Progress Toward Universal Access to Water and Sanitation in California 47
eliminating these last inequities is long overdue mdash all the more so in comparison to the magnitude of the infrastructure we have constructed to transport and treat water for the vast majority of the statersquos residents But seen from another perspective the statersquos problems in ensuring universally adequate water and sanitation are surmountable We have the resources to bridge these last gaps in service With concerted effort the vision of universal water and sanitation for all Californians can be realized
recommendations for Policy Solutions to Address failures in Drinking Water and Sanitation Service
bullUse the Eligibility for Customer Assistance Program (ECAP) metric described in ldquoAncillary Performance Indicators for Affordable Water and Sanitationrdquo to qualify households for a water affordability assistance program The ECAP metric is relatively simple to calculate aligns with other well-established social service programs enrollment thresholds and addresses disparities in cost of living around the state
bullExpand CalFresh benefits to include soap for handwashing Lack of access to soap is a persistent problem among food-insecure families California has recently experimented with expanding CalFresh assistance by providing a supplementary drinking water benefit for customers of public water systems with unsafe drinking water (California 2017-18 Budget enacted June 2017) Adding soap to CalFresh benefits would be a relatively inexpensive way to ensure that low-income children obtain access to an essential component of hygiene
We live in a time of extraordinary progress toward reducing poverty worldwide Between 1990 and 2013 the number of extremely poor people globally fell by over a billion even as the worldrsquos population grew by more than one and a half billion (The World Bank nd) But the final steps of eradicating poverty are perennially plagued by the ldquolast mile problemrdquo the pace of progress slows as a society nears the goal of eliminating extreme poverty (Chandy et al 2015)
California is no exception Only a small percentage of Californiarsquos population lives without adequate water and sanitation yet progress toward
Measuring Progress Toward Universal Access to Water and Sanitation in California 48
American Community Survey (ACS) 2015 ldquo2011-2015 American Community Survey Public Use Microdata Samplesrdquo Downloaded from httpdoiorg1018128D010V60
Bowne William C Richard C Naret and Richard J Otis 1994 Alternative Wastewater Collection Systems Manual Washington DC EPA Office of Wastewater Enforcement and Compliance
Cador Kena C and Angeacutelica Salceda 2018 ldquoA Survey of Efforts to Achieve Universal Access to Water and Sanitation in Californiardquo American Civil Liberties Union (ACLU) of Northern California
California Building Standards Commission 2016 ldquoCalifornia Plumbing Coderdquo httpsupcodesviewercaliforniaca-plumbing-code-2016
California Department of Housing and Community Development Rural Community Assistance Corporation and California Coalition for Rural Housing in press ldquoTribal Housing Studyrdquo
California Institute for Rural Studies 2018 ldquoFarmworker Housing Study And Action Plan For Salinas Valley And Pajaro Valleyrdquo httpswwwcityofsalinasorgour-city-servicescommunity-developmentregional-farmworker-housing-study
Canon Gabrielle 2018 ldquoBroken Pipes Broken Systemrdquo httpswwweastbayexpresscomoaklandbroken-pipes-broken-systemContentoid=12464701
Chandy Laurence Hiroshi Kato and Homi Kharas ldquoThe Last Mile in Ending Extreme Povertyrdquo Brookings Institution Press July 20 2015 httpswwwbrookingsedubookthe-last-mile-in-ending-extreme-poverty
Code of Federal Regulations (CFR) 21 2017 httpswwwaccessdatafdagovscriptscdrhcfdocscfcfrCFRSearchcfmfr=165110
Christian-Smith J C Balazs Matthew Heberger and K Longley 2013 Assessing Water Affordability A Pilot Study in Two Regions of California Oakland Pacific Institute httpwwwpacinstorgwp-contentuploads201308assessing-water-affordabilitypdf
Cooley Heather and Rapichan Phurisamban 2017 ldquoThe Cost of Alternative Water Supply and Efficiency Options in Californiardquo httppacinstorgpublicationcost-alternative-water-supply-efficiency-options-california
County of Los Angeles Department of Public Health 2017 ldquoFrequently Asked Questions Hepatitis Ardquo httpwwwpublichealthlacountygovhealibrarytopicshepatitisCDCP-ACDC-0099-01pdf
County of Los Angeles Public Health 2018 ldquoHepatitis A Outbreakrdquo May 15 2018 httppublichealthlacountygovacdDiseasesHepAOBhtm
Cutler David and Grant Miller 2005 ldquoThe Role of Public Health Improvements in Health Advances The Twentieth-Century United Statesrdquo Demography 42 (1) 1ndash22
references
Measuring Progress Toward Universal Access to Water and Sanitation in California 49
Davis Jon P and Manuel P Teodoro 2014 ldquoFinancial Capability and Affordabilityrdquo In Water and Wastewater Finance and Pricing The Changing Landscape Fourth Edition edited by George Raftelis 443ndash66 CRC Press
DeOreo William B Peter Mayer Benedykt Dziegielewski and Jack Kiefer 2016 ldquoResidential End Uses of Water Version 2rdquo 4309 Water Research Foundation httpwwwwaterrforgPagesProjectsaspxPID=4309
DeOreo William B Peter W Mayer Leslie Martien Matthew Hayden Andrew Funk Michael Kramer-Duffield Renee Davis James Henderson Bob Raucher and Peter Gleick 2011 ldquoCalifornia Single-Family Water Use Efficiency Studyrdquo Aquacraft Water Engineering and Management Boulder Colorado USA httpwatercityofdavisorgMediaPublicWorksDocumentsPDFPWWaterDocumentsCalifornia-Single-Family-Home-Water-Use-Efficiency-Study-20110420pdf
Department of Social Services 2018 ldquoFrequently Asked Questions About CalFreshrdquo 2018 httpwwwcdsscagovinforesourcesCalFreshFAQs
Diringer Sarah Heather Cooley Matthew Heberger Rapichan Phurisamban Kristina Donnelly Andres Turner John McKibbin and Mary Ann Dickinson in press ldquoIntegrating Water Efficiency Standards and Codes into Long-Term Demand Forecastingrdquo Water Research Foundation Pacific Institute Institute for Sustainable Futures and Alliance for Water Efficiency
Donnelly K and J Christian-Smith 2013 An Overview of the ldquoNew Normalrdquo and Water Rates Basics Oakland Pacific Institute httpwwwpacinstorgpublicationwater-rates-series
Department of Water Resources (DWR) 2010a ldquoFourth Target Method Preliminary DWR Staff Assessment of Proposed Alternativesrdquo httpswatercagovLegacyFileswateruseefficiencysb7docsU420PreliminaryDWR20Staff20Assessment20Of20Proposed20Alternatives2011-16-10pdf
mdashmdashmdash 2010b ldquoMethodologies for Calculating Baseline and Compliance Urban Per Capita Water Use (For the Consistent Implementation of the Water Conservation Act of 2009)rdquo httpswwwwatercagovLegacyFileswateruseefficiencysb7docsmethodologies-urban-per-capita-water-use-10042010pdf
mdashmdashmdash 2014 ldquoCalifornians Without Safe Water and Sanitation California Water Plan Updaterdquo httpwwwwatercagovwaterplandocscwpu2013Finalvol4water_quality04Californians_Without_Safe_Water_Sanitationv2pdf
mdashmdashmdash 2017 ldquoStatus of 2015 Urban Water Management Plansrdquo httpwwwwatereducationorgsitesmainfilesfile-attachments2015_uwmp_leg_report_-_final_-9-22-17pdf
Editorial Board 2018 ldquoInaccessibility a Lawsuit in the Makingrdquo Chico News and Review May 10 2018
Evans Barbara Andreacutes Hueso Richard Johnston Guy Norman Eddy Peacuterez Tom Slaymaker and Sophie Treacutemolet 2017 ldquoLimited Services The Role of Shared Sanitation in the 2030 Agenda for Sustainable Developmentrdquo
Feeding America 2012 ldquoIn Short Supply American Families Struggle to Secure Everyday Essentialsrdquo httpwwwfeedingamericaorgresearchin-short-supply
Feinstein Laura and Gabriel Daiess in prep ldquoPlumbing the Depths An Analysis of Census Data on Running Water and Toilets in California 2011-2015rdquo
Feinstein Laura Rapichan Phurisamban and Amanda Ford 2017 ldquoDrought and Equity in Californiardquo Pacific Institute and Environmental Justice Coalition for Water httppacinstorgpublicationdrought-equity-california
Measuring Progress Toward Universal Access to Water and Sanitation in California 50
Gleick Peter H 1996 ldquoBasic Water Requirements for Human Activities Meeting Basic Needsrdquo Water International 21 (2) 83ndash92
Green Carla 2017 ldquoCalifornia City Confiscates Toilets from Homeless Residents ndash Forcing Them to Use Bucketsrdquo The Guardian September httpswwwtheguardiancomus-news2017sep08anaheim-homeless-toilets-confiscated-public-health-crisis
Halverstadt Lisa 2017 ldquoSan Diego Scrambles to Address Long-Festering Lack of Restroomsrdquo Voice of San Diego September 18 2017 httpswwwvoiceofsandiegoorgtopicsgovernmentsan-diego-scrambles-to-address-long-festering-lack-of-restrooms
Hammer Jeffrey and Dean Spears 2016 ldquoVillage Sanitation and Child Health Effects and External Validity in a Randomized Field Experiment in Rural Indiardquo Journal of Health Economics 48 135ndash48
Heberger Matthew 2018 ldquoCalifornia Urban Water Suppliers Water Use Map February 2017rdquo Pacific Institute January 2018
Heberger Matthew Donnelly Kristina and Heather Cooley 2016 ldquoA Community Guide for Evaluating Future Urban Water Demandrdquo Pacific Institute httppacinstorgwp-contentuploads201608A-Community-Guide-for-Evaluating-Future-Urban-Water-Demand-1pdf
Heller Leo 2015 ldquoAffordability of Water and Sanitation Services Report of the Special Rapporteur on the Human Right to Safe Drinking Water and Sanitationrdquo httpapohchrorgdocumentsdpage_easpxsi=AHRC3039
Hutton Guy 2012 ldquoMonitoring lsquoAffordabilityrsquo of Water and Sanitation Services After 2015 Review of Global Indicator Optionsrdquo Paper submitted to the United Nations Office of the High Commission for Human Rights httpswwwwssinfoorgfileadminuser_uploadresourcesEND-WASH-Affordability-Reviewpdf
Indian Health Services 2015 ldquoTribal Water Systems at High Risk Due to Drought Conditionsrdquo
Johnson TD and K Belitz 2015 ldquoLocation and Population Served by Domestic Wells in Californiardquo httpswwwsciencebasegovcatalogitem55ad2901e4b066a24924099b
Kam Katherine 2015 ldquoFamilies Live Jammed into Chinatown Rooms With No Hope of Leavingrdquo San Francisco Chronicle November 30 2015 httpwwwsfchroniclecombayareaarticleFamilies-live-jammed-into-Chinatown-rooms-with-6663902php
Kane Joseph 2016 ldquoInvesting in Water Comparing Utility Finances and Economic Concerns across US Citiesrdquo Brookings (blog) December 14 2016 httpswwwbrookingseduresearchinvesting-in-water-comparing-utility-finances-and-economic-concerns-across-u-s-cities
Karlamangla Soumya 2017 ldquoCaliforniarsquos Deadly Hepatitis A Outbreak Could Last Years Official Saysrdquo LA Times October 5 2017 httpwwwlatimescomlocalcaliforniala-me-ln-hepatitis-outbreaks-20171006-htmlstoryhtml
Lipson Jacob Leigh Anderson and Susan Bolton 2010 ldquoThe Public Health Benefits of Sanitation Interventionsrdquo Evans School of Public Affairs httpsevansuwedusitesdefaultfilesEvans_UW_Request_104_Public_Health_Benefits_of_Sanitation_November-10-2010_ft_0pdf
Los Angeles Central Providers Collaborative 2017 ldquoNo Place to Go An Audit of the Public Toilet Crisis in Skid Rowrdquo httpwwwinnercitylaworgwp-contentuploads201707No-Place-To-Go-finalpdf
Measuring Progress Toward Universal Access to Water and Sanitation in California 51
Luby Stephen P Mahbubur Rahman Benjamin F Arnold Leanne Unicomb Sania Ashraf Peter J Winch Christine P Stewart Farzana Begum Faruqe Hussain and Jade Benjamin-Chung 2018 ldquoEffects of Water Quality Sanitation Handwashing and Nutritional Interventions on Diarrhoea and Child Growth in Rural Bangladesh A Cluster Randomised Controlled Trialrdquo The Lancet Global Health 6 (3) e302ndash15
Lybarger Jeremy 2014 ldquoLife Inside SFrsquos Vanishing Single Resident Occupanciesrdquo July 9 2014 httpsthebolditaliccomlife-inside-sf-s-vanishing-single-resident-occupancies-the-bold-italic-san-francisco-20bf7aa0b3c8
Mack Elizabeth A and Sarah Wrase 2017 ldquoA Burgeoning Crisis A Nationwide Assessment of the Geography of Water Affordability in the United Statesrdquo PLoS ONE 12 (1) 1ndash19 httpsdoiorg101371journalpone0169488
Mayer Peter W William B DeOreo Eva M Opitz Jack C Kiefer William Y Davis Benedykt Dziegielewski and John Olaf Nelson 1999 ldquoResidential End Uses of Waterrdquo Subject Area Water Resources 241 AWWA Research Foundation and American Water Works Association
Mbuya M and J Humphrey 2016 ldquoPreventing Environmental Enteric Dysfunction through Improved Water Sanitation and Hygiene An Opportunity for Stunting Reduction in Developing Countriesrdquo httpswwwncbinlmnihgovpmcarticlesPMC5019251
McGahan Jason 2018 ldquoLiving Homeless in California Public Bathrooms and Other Miragesrdquo Capital and Main May 2018 httpscapitalandmaincomliving-homeless-in-california-public-bathrooms-and-other-mirages-0525
Moore Eli Eyal Matalon Carolina Balazs Jennifer Clary Laurel Firestone and Susana De Anda 2011 The Human Costs of Nitrate-Contaminated Drinking Water in the San Joaquin Valley Oakland California Pacific Institute httpwwwpacinstorgreportsnitrate_contamination
Moriarty Patrick Charles Batchelor Catarina Fonseca Amah Klutse Arjan Naafs Kwabena Nyarko Christelle Pezon Alana Potter Ratna Reddy and Mekala Snehalatha 2011 ldquoLadders for Assessing and Costing Water Service Deliveryrdquo IRC International Water and Sanitation Centre httpswwwresearchgatenetpublication228470692_Ladders_for_assessing_and_costing_water_service_delivery
Moulton Stephanie Danielle Harlow Olga Kondratjeva and Stephanie Casey Pierce 2016 ldquoImplementation and Impact Evaluation of Local Interventions for Financial Empowerment through Utility Payments (LIFT-UP)rdquo National League of Cities httpwwwnlcorgsitesdefaultfilesLIFT_UP20FINAL20REPORT_6-24-16pdf
NAPA 2017 ldquoDeveloping a New Framework for Community Affordability of Clean Water Servicesrdquo httpswwwnapawashorguploadsAcademy_StudiesNAPA_EPA_FINAL_REPORT_110117pdf
Null Clair Christine P Stewart Amy J Pickering Holly N Dentz Benjamin F Arnold Charles D Arnold Jade Benjamin-Chung Thomas Clasen Kathryn G Dewey and Lia CH Fernald 2018 ldquoEffects of Water Quality Sanitation Handwashing and Nutritional Interventions on Diarrhoea and Child Growth in Rural Kenya A Cluster-Randomised Controlled Trialrdquo The Lancet Global Health 6 (3) e316ndash29
Organization for Economic Co-operation and Development (OECD) 2003 ldquoSocial Issues in the Provision and Pricing of Water Servicesrdquo httpdxdoiorg1017879789264099890-en
Office of Environmental Health Hazard Assessment (OEHHA) 2017 ldquoCalEnviroScreen 30rdquo httpsoehhacagovmediadownloadscalenviroscreenreportces3reportpdf
Measuring Progress Toward Universal Access to Water and Sanitation in California 52
Organization of Economic Cooperation and Development (OECD) 2002 ldquoGlossary of Key Terms in Evaluation and Results Based Managementrdquo httpwwwoecdorgdevelopmentpeer-reviews2754804pdf
Sacramento Bee Editorial Board 2018 ldquoEverybody Poops Sacramento Must Make Sure Homeless People Can Do It in a Toiletrdquo March 19 2018 httpwwwsacbeecomopinioneditorialsarticle205930754html
San Diego County Health and Human Services Agency 2018 ldquoHepatitis A Outbreakrdquo January 2018 httpwwwsandiegocountygovcontentsdchhsaprogramsphscommunity_epidemiologydcHepatitis_Aoutbreakhtml
San Francisco Public Works nd ldquoSan Francisco Pit Stoprdquo Accessed August 8 2018 httpssfpublicworkswixsitecompitstop
Scharaga Ashiah 2018 ldquoLocked Outrdquo httpswwwnewsreviewcomchicolocked-outcontentoid=26224602
Schneider B 2018 ldquoThe Dirty Truth About San Franciscorsquos Sidewalksrdquo August 2018 httpswwwcitylabcomequity201808san-franciscos-sidewalk-poop-problem566621
Senate Office of Research 2015 ldquoThe Water We Drink Part I What Is California Doing To Ensure Its Water Is Saferdquo httpsorsenatecagovsitessorsenatecagovfilesFINAL20draft20Part20120Drinking20Waterpdf
San Francisco Department of Public Health (SF DPH) 2016 ldquoSingle Room Occupancy Hotels in San Francisco A Health Impact Assessment (Draft Version)rdquo httpswwwsfdphorgdphfilesoppSFDPH-SROHIA-FinalDraftv3pdf
SF Public Works nd ldquoPublic Toiletsrdquo Accessed April 6 2018 httpsfpublicworksorgservicespublic-toilets
SRO Families United Collaborative nd ldquo2015 SRO Families Report Living in the Margins An Analysis and Census of San Francisco Families Living in SROsrdquo httpwwwchinatowncdcorgimagesstoriesNewsEventsNewsletterssro_families_report_2015_pdf
State of California 2017 ldquoHousehold Water Supply Shortage Reporting Systemrdquo httpsmydrywatersupplywatercagovreportpublicpage
State Water Board 2012 ldquoOWTS Policy Water Quality Control Policy for Siting Design Operation and Maintenance of Insite Wastewater Treatment Systemsrdquo httpswwwwaterboardscagovwater_issuesprogramsowtsdocsowts_policypdf
mdashmdashmdash 2013 ldquoCommunities That Rely on a Contaminated Groundwater Source for Drinking Waterrdquo Report to the Legislature httpwwwwaterboardscagovgamaab2222docsab2222pdf
mdashmdashmdash 2015a ldquoResolution No 2015-0014rdquo httpswwwwaterboardscagovboard_decisionsadopted_ordersresolutions2015rs2015_0014pdf
mdashmdashmdash 2015b ldquoA Guide for Private Domestic Well Ownersrdquo httpswwwwaterboardscagovgamadocswellowner_guidepdf
mdashmdashmdash 2016a ldquoCalifornia 2014 and 2016 303(d) List - Excel Filerdquo httpswwwwaterboardscagovwater_issuesprogramstmdlintegrated2014_2016shtml
mdashmdashmdash 2016b ldquoResolution No 2016-0010 Adopting the Human Right to Water as a Core Value and Directing Its Implementation in Water Board Programs and Activitiesrdquo httpswwwwaterboardscagovboard_decisionsadopted_ordersresolutions2016rs2016_0010pdf
Measuring Progress Toward Universal Access to Water and Sanitation in California 53
mdashmdashmdash 2016c ldquoState of California Drinking Water State Revolving Fund and the Water Quality Supply and Infrastructure Improvement Act of 2014 Intended Use Planrdquo httpwwwwaterboardscagovboard_decisionsadopted_ordersresolutions2016final_dwsrf_iup_report_062116_with_coverpdf
mdashmdashmdash 2016d ldquoSmall Water Supplier Conservation Reportsrdquo httpdrinccagovdnnApplicationsDWPRepositoryaspx
mdashmdashmdash 2016e ldquoApplications for Drought Assistance Fundingrdquo httpwwwwaterboardscagovwater_issuesprogramsgrants_loanscaadw_droughtfund
mdashmdashmdash 2017 ldquoChromium-6 Drinking Water MCLrdquo httpswwwwaterboardscagovdrinking_watercertlicdrinkingwaterChromium6html
mdashmdashmdash 2018a ldquoHuman Right to Water Portalrdquo February 20 2018 httpswwwwaterboardscagovwater_issuesprogramshr2w
mdashmdashmdash 2018b ldquoLead Sampling of Drinking Water in California Schools Lab Resultsrdquo httpswwwwaterboardscagovdrinking_watercertlicdrinkingwaterleadsamplinginschoolshtml
mdashmdashmdash 2018c ldquo123-Trichloropropane (123 - TCP)rdquo httpswwwwaterboardscagovdrinking_watercertlicdrinkingwater123TCPhtml
mdashmdashmdash 2018d ldquoCIWQS Interactive Sanitary Sewer Overflows Reportrdquo httpsciwqswaterboardscagovciwqsreadOnlyPublicReportSSOServletreportAction=criteriaampreportId=sso_main
Steele Joshua John Griffith Rachel Noble and Kenneth Schiff 2017 ldquoTracking Human Fecal Sources In An Urban Watershed During Wet Weatherrdquo Southern California Coastal Water Research Project
Street Sheet Staff 2017 ldquoSan Francisco Needs to Provide Safe Dignified Bathrooms for Homeless Peoplerdquo httpwwwstreetsheetorgp=3323
Syed Sana Asad Ali and Christopher Duggan 2016 ldquoEnvironmental Enteric Dysfunction in Children A Reviewrdquo Journal of Pediatric Gastroenterology and Nutrition 63 (1) 6
Teodoro Manuel P 2018 ldquoMeasuring Household Affordability for Water and Sewer Utilitiesrdquo American Water Works Association 110 (1) httpsdoiorg105942jawwa20181100002
The World Bank nd ldquoPoverty Overviewrdquo 4112018 Accessed January 9 2018 httpwwwworldbankorgentopicpovertyoverview
UN General Assembly 2010 ldquoResolution 64292 The Human Right to Water and Sanitationrdquo httpwwwunorgescomundocssymbol=ARES64292amplang=E
United Nations Development Programme (UNDP) 2006 ldquoHuman Development Report 2006 Beyond Scarcity Power Poverty and the Global Water Crisisrdquo httpwwwundporgcontentdamundplibrarycorporateHDR200620Global20HDRHDR-2006-Beyond20scarcity-Power-poverty-and-the-global-water-crisispdf
United Nations High Commissioner for Refugees (UNHCR) 2018 ldquoEmergency Sanitation Standardrdquo httpsemergencyunhcrorgentry116007emergency-sanitation-standard
US Census Bureau 2015a ldquoAmerican Housing Surveyrdquo httpswwwcensusgovprograms-surveysahsdatainteractiveahstablecreatorhtmls_areas=a00006amps_year=s2015amps_tableName=Table15amps_byGroup1=a1amps_byGroup2=a1amps_filterGroup1=t1amps_filterGroup2=g1amps_show=SO
Measuring Progress Toward Universal Access to Water and Sanitation in California 54
mdashmdashmdash 2015b ldquoAmerican Housing Survey 2015 California Housing Qualityrdquo httpswwwcensusgovprograms-surveysahsdatainteractiveahstablecreatorhtmls_areas=a00006amps_year=s2015amps_tableName=Table5amps_byGroup1=a1amps_byGroup2=a1amps_filterGroup1=t1amps_filterGroup2=g1amps_show=S
mdashmdashmdash 2016 ldquoAmerican Community Survey 5-Year Estimates 2011 ndash 2015rdquo httpftp2censusgov
mdashmdashmdash 2017 ldquoQuick Facts Tulare County Californiardquo httpswwwcensusgovquickfactsfacttabletularecountycaliforniaPST045217
mdashmdashmdash 2018 ldquoQuickFacts Californiardquo httpswwwcensusgovquickfactsCA
US Conference of Mayors American Water Works Association and Water Environment Federation 2013 ldquoAssessing the Affordability of Federal Water Mandates An Issue Briefrdquo httpwwwawwaorgPortals0filesresourceswater20utility20managementaffordabilityAffordability-IssueBriefpdf
US Department of Housing and Urban Development 2016 ldquoThe 2016 Annual Homeless Assessment Report (AHAR) to Congressrdquo Office of Community Planning and Development httpswwwhudexchangeinforesourcesdocuments2016-AHAR-Part-1pdf
US Environmental Protection Agency (US EPA) 1997 ldquoGuidance for Financial Capability Assessment and Schedule Developmentrdquo httpswww3epagovnpdespubscsofcpdf
mdashmdashmdash 1998 ldquoVariance Technology Findings for Contaminants Regulated Before 1996rdquo httpsnepisepagovExeZyNETexe200021A9TXTZyActionD=ZyDocumentampClient=EPAampIndex =1995+Thru+1999ampDocs=ampQuery=ampTime=ampEndTime=ampSearchMethod=1ampTocRestrict=nampToc=ampTo cEntry=ampQField=ampQFieldYear=ampQFieldMonth=ampQFieldDay=ampIntQFieldOp=0ampExtQFieldOp=0ampXm lQuery=ampFile=D3A5Czyfiles5CIndex20Data5C95thru995CTxt5C000000125C200021A9txtampUs er=ANONYMOUSampPassword=anonymousampSortMethod=h7C-ampMaximumDocuments=1amp FuzzyDegree=0ampImageQuality=r75g8r75g8x150y150g16i425ampDisplay=hpframpDefSeekPage=xampSearch Back=ZyActionLampBack=ZyActionSampBackDesc=Results20pageampMaximumPages=1ampZyEntry=1ampSeek Page=xampZyPURL
mdashmdashmdash 2004 ldquoThe Standardized Monitoring Framework A Quick Reference Guiderdquo httpsnepisepagovExeZyPDFcgiDockey=3000667Ktxt
mdashmdashmdash 2005 ldquoHandbook for Managing Onsite and Clustered (Decentralized) Wastewater Treatment Systemsrdquo httpswwwepagovsitesproductionfiles2015-06documentsonsite_handbookpdf
mdashmdashmdash 2006 ldquoSmall Drinking Water Systems Variances ndash Revision of Existing National-Level Affordability Methodology and Methodology to Identify Variance Technologies That Are Protective of Public Healthrdquo Federal Register 71 (41)
mdashmdashmdash 2007 ldquoTalking to Your Customers About Chronic Contaminants in Drinking Water A Best Practices Guiderdquo httpsnepisepagovExeZyNETexe60000LWLTXTZyActionD=ZyDocumentampClient=EPAampIn dex=2006+Thru+2010ampDocs=ampQuery=ampTime=ampEndTime=ampSearchMethod=1ampTocRestrict=nampToc=ampTo cEntry=ampQField=ampQFieldYear=ampQFieldMonth=ampQFieldDay=ampIntQFieldOp=0ampExtQFieldOp=0ampXm lQuery=ampFile=D3A5Czyfiles5CIndex20Data5C06thru105CTxt5C000000015C60000LWLtxtampUs-er=ANONYMOUSampPassword=anonymousampSortMethod=h7C-ampMaximumDocuments=1amp FuzzyDegree=0ampImageQuality=r75g8r75g8x150y150g16i425ampDisplay=hpframpDefSeekPage=xampSearch Back=ZyActionLampBack=ZyActionSampBackDesc=Results20pageampMaximumPages=1ampZyEntry=1ampSeek Page=xampZyPURL
mdashmdashmdash 2016a ldquoNational Primary Drinking Water Regulationsrdquo httpswwwepagovsitesproductionfiles2016-06documentsnpwdr_complete_tablepdf
Measuring Progress Toward Universal Access to Water and Sanitation in California 55
mdashmdashmdash 2016b ldquoCalifornia Tribal Water Systems Datasetrdquo Dataset available upon request from US EPA Region 9
Walker Theresa 2017 ldquoPortable Toilets for Homeless Moved to Anaheim Site on Santa Ana River Trail but Likely to Be Moved Againrdquo May 16 2017 httpswwwocregistercom20170516non-permitted-portable-toilets-for-homeless-relocated-to-city-of-anaheim-site-at-santa-ana-river-trail-but-likely-to-be-moved-again-soon
World Health Organization (WHO) 2015 ldquoMinimum Water Quantity Needed for Domestic Usesrdquo httpeceuropaeuechofilesevaluationwatsan2005annex_filesWHOWHO520-20Minimum20water20quantity20needed20for20domestic20usepdf
WHO and United Nations Childrenrsquos Fund (UNICEF) 2017a Progress on Drinking Water Sanitation and Hygiene 2017 Update and SDG Baselines Geneva
mdashmdashmdash 2017b ldquoWASH in the 2030 Agenda New Global Indicators for Drinking Water Sanitation and Hygienerdquo httpwwwwhointwater_sanitation_healthmonitoringcoveragejmp-2017-wash-in-the-2030-agendapdfua=1
Wolff Gary and E Hallstein 2005 Beyond Privatization Restructuring Water Systems to Improve Performance Oakland CA Pacific Institute httppacinstorgpublicationwater-managers-must-look-beyond-privatization
Measuring Progress Toward Universal Access to Water and Sanitation in California 56
Appendices (online)
Appendix I California Service ladders for Measuring the human right to Water and Sanitation
Appendix II Data Sources for Performance Measures on Water and Sanitation
Appendices are available at httppacinstorgpublicationmeasuring-progress
PACIFICINSTITUTE
ISBN 978-1-893790-83-4
copy 2018 Pacific Institute All rights reserved
Pacific Institute 654 13th Street Preservation ParkOakland California 946125102511600 | infopacinstorgwwwpacinstorg