Embed Size (px)
Citation preview

This article was downloaded by: [Dartmouth College Library]On: 07 February 2012, At: 04:35Publisher: RoutledgeInforma Ltd Registered in England and Wales Registered Number: 1072954Registered office: Mortimer House, 37-41 Mortimer Street, London W1T 3JH,UK
Ethnic and Racial StudiesPublication details, including instructions for authorsand subscription information:http://www.tandfonline.com/loi/rers20
Measuring cultural diversity:ethnic, linguistic and religiousfractionalization in the OECDNatalka Patsiurko, John L. Campbell & John A. Hall
Available online: 11 Jul 2011
To cite this article: Natalka Patsiurko, John L. Campbell & John A. Hall (2012):Measuring cultural diversity: ethnic, linguistic and religious fractionalization in theOECD, Ethnic and Racial Studies, 35:2, 195-217
To link to this article: http://dx.doi.org/10.1080/01419870.2011.579136
PLEASE SCROLL DOWN FOR ARTICLE
Full terms and conditions of use: http://www.tandfonline.com/page/terms-and-conditions
This article may be used for research, teaching, and private study purposes.Any substantial or systematic reproduction, redistribution, reselling, loan, sub-licensing, systematic supply, or distribution in any form to anyone is expresslyforbidden.
The publisher does not give any warranty express or implied or make anyrepresentation that the contents will be complete or accurate or up todate. The accuracy of any instructions, formulae, and drug doses should beindependently verified with primary sources. The publisher shall not be liablefor any loss, actions, claims, proceedings, demand, or costs or damageswhatsoever or howsoever caused arising directly or indirectly in connectionwith or arising out of the use of this material.

Measuring cultural diversity: ethnic,
linguistic and religious fractionalization in
the OECD
Natalka Patsiurko, John L. Campbell and John A. Hall
(First submission May 2010: First published July 2011)
AbstractMany claim that national economic success depends upon culturalhomogeneity. We collect new time-series data and develop new measuresof ethnic, linguistic and religious fractionalization for the OECDcountries. We show that cultural diversity may vary by type acrosscountries and over short periods of time. We also show that our measureof ethnic fractionalization is a significant predictor of economicperformance in OECD countries despite the fact that they constitute aparticularly homogeneous and economically advantaged group.
Keywords: Ethnic categories; political economy; inter-ethnic social distances;
cross-national analyses; national identity; data collection.
A striking claim of contemporary social science is that nationaleconomic success depends upon cultural homogeneity (e.g. Alesinaet al. 1997; Levine 1997; Alesina, Baqir and Easterly 2003; Easterlyand Putnam 2007).1 The argument is that capitalism requires constantchange and that this is often best managed in societies that arecohesive and able to make sacrifices for the common good so as torespond flexibly to a changing external environment. The issue is alsoimportant because it could be used to justify homogenization practicesranging from restrictive immigration to ethnic genocide (McGarry andO’Leary 1993; Mann 2005).
The convention for measuring national homogeneity was initially touse an ethno-linguistic fractionalization index (ELF) based on datacompiled by Soviet ethnographers. Several researchers used it to assessthe relationship between homogeneity and economic performance
Ethnic and Racial Studies Vol. 35 No. 2 February 2012 pp. 195�217
# 2012 Taylor & FrancisISSN 0141-9870 print/1466-4356 onlinehttp://dx.doi.org/10.1080/01419870.2011.579136
Dow
nloa
ded
by [
Dar
tmou
th C
olle
ge L
ibra
ry]
at 0
4:35
07
Febr
uary
201
2

(e.g. Easterly and Levine 1997). Since then researchers have criticizedthis index and improved it (e.g. Posner 2004; Cederman and Girardin2007; Fearon, Kasara and Min 2007). One of the most ambitious andwidely used of these new indices was created by Alesina et al. (2003)who developed measures of ethnic, linguistic and religious fractiona-lization in 190 countries using more current data from theEncyclopaedia Britannica Book of the Year (2001), hereafter referredto in brief as Encyclopaedia Britannica, and other sources. But againscholars offered criticisms (e.g. Fearon 2003; Posner 2004). First, thereis inconsistency in terms of the years covered. For instance, theEncyclopaedia Britannica provides ethnicity data for only 124 of 190countries, so Alesina had to resort to other sources for the rest. Hence,his ethnicity data covered years ranging from 1979 to 2001, dependingon the country. Second, he offered one-time measures of fractionaliza-tion, thereby being unable to say anything about change over time � aproblem with the ELF data as well (Laitin and Posner 2001).
A few scholars addressed these problems by constructing improvedindices for subsets of countries, notably African and post-communistgroups. They corroborated that national homogeneity enhancedeconomic performance (Posner 2004; Campos and Kuzeyev 2007).However, almost no one tried to do this for the advanced industrialcountries � the OECD (but see Fearon 2003). We focus on the OECDbecause issues of diversity and economic performance are at the centreof political debate there. More important, research that has establishedthe relationship between fractionalization and economic performanceis typically based on datasets that include virtually all countries inthe world, some of which, notably several African countries, haveextremely high levels of cultural diversity and very poor economicperformance (e.g. Easterly and Levine 1997; Alesina et al. 2003). Butthe OECD countries are a more culturally homogeneous group byworld standards due to much twentieth-century nation-buildinginvolving the expulsion, coercive assimilation, population transferand genocide of certain groups (Mazower 2000). The OECD is alsothe most economically advanced group in the world. Given theseunique features, does the inverse relationship between fractionaliza-tion and economic performance hold for the OECD countries?
We offer new data for fractionalization in the OECD countries thathelps answer this question. Our data have advantages. Among otherthings, they measure fractionalization at two points in time � 1985 and2000. This allows us to explore whether fractionalization changedappreciably over a short period of time and whether such change wasassociated with recent national economic performance.
We limit our data to improving only the nominal measurement ofdiversity � the size of ethnic groups, but not the depth of divisions
196 Natalka Patsiurko et al.
Dow
nloa
ded
by [
Dar
tmou
th C
olle
ge L
ibra
ry]
at 0
4:35
07
Febr
uary
201
2

between them. Some scholars argue that not every nominal culturaldifference leads to problems (e.g. Posner 2004, 2005; Habyarimanaet al. 2009). Objective differences are not always perceived by citizensas being substantively meaningful. Hence, a few researchers havecombed through national ethnographies and consulted with areaspecialists to develop indices measuring politically salient differences(e.g. Posner 2004, 2005; Min, Cederman and Wimmer 2010). Somehave concluded that ethnic differences are not substantively relevant inseveral OECD countries (Min, Cederman and Wimmer 2010, p. 9).For this reason and because nominal measures continue to dominatethe field this paper concentrates on improving them.
We proceed as follows. First, we discuss our new fractionalizationdata. As far as we can tell, ours are the only data that do severalimportant things simultaneously. They allow for tracking three typesof fractionalization and thus for the possibility of assessing thestrengths and weaknesses of three main aspects of cultural diversitythat the literature suggests may impact on national economicperformance. They encompass two periods of time, thus permittinghistorical comparisons. And they cover the OECD countries. We willalso address challenges in constructing the dataset. This is importantinsofar as changes in national data-collection methodologies as wellas changes in population composition may affect fractionalizationindices � a point not always appreciated by those who construct oruse them. Second, we compare our indices to make two points:cultural diversity may vary significantly by type across countries andover short periods of time. Third, we deploy our index of ethnicfractionalization to see whether the inverse relationship betweenfractionalization and economic performance holds in the OECD.Using multiple regression techniques we find support for thisrelationship. Finally, we discuss the broader implications of ourfindings.
Among the indices on offer today, Alesina’s is the most comparableto ours. His data cover the OECD countries whereas some others donot (e.g. Posner 2004; Campos and Kuzeyev 2007). Furthermore,among those that do cover the OECD only Alesina provides measuresof the three types of fractionalization � ethnic, linguistic and religious �that cover the full array of cultural dimensions that others haveidentified as being relevant for economic performance (e.g. Gellner1983; Laitin 2007; Bates 2008). Others provide only one or two(e.g. Fearon 2003). For these reasons and because Alesina’s data havebeen used by and received extensive attention from several researchers(e.g. Fearon 2003; Posner 2004; Bjørnskof 2008) we occasionally referto his data to illustrate the advantages of ours.
Measuring cultural diversity 197
Dow
nloa
ded
by [
Dar
tmou
th C
olle
ge L
ibra
ry]
at 0
4:35
07
Febr
uary
201
2
Fractionalization data for the OECD
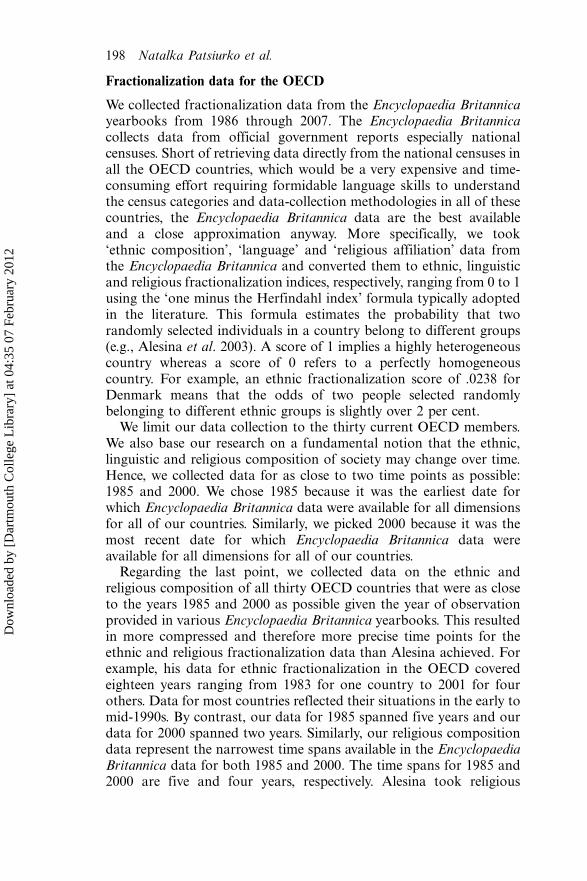
We collected fractionalization data from the Encyclopaedia Britannicayearbooks from 1986 through 2007. The Encyclopaedia Britannicacollects data from official government reports especially nationalcensuses. Short of retrieving data directly from the national censuses inall the OECD countries, which would be a very expensive and time-consuming effort requiring formidable language skills to understandthe census categories and data-collection methodologies in all of thesecountries, the Encyclopaedia Britannica data are the best availableand a close approximation anyway. More specifically, we took‘ethnic composition’, ‘language’ and ‘religious affiliation’ data fromthe Encyclopaedia Britannica and converted them to ethnic, linguisticand religious fractionalization indices, respectively, ranging from 0 to 1using the ‘one minus the Herfindahl index’ formula typically adoptedin the literature. This formula estimates the probability that tworandomly selected individuals in a country belong to different groups(e.g., Alesina et al. 2003). A score of 1 implies a highly heterogeneouscountry whereas a score of 0 refers to a perfectly homogeneouscountry. For example, an ethnic fractionalization score of .0238 forDenmark means that the odds of two people selected randomlybelonging to different ethnic groups is slightly over 2 per cent.
We limit our data collection to the thirty current OECD members.We also base our research on a fundamental notion that the ethnic,linguistic and religious composition of society may change over time.Hence, we collected data for as close to two time points as possible:1985 and 2000. We chose 1985 because it was the earliest date forwhich Encyclopaedia Britannica data were available for all dimensionsfor all of our countries. Similarly, we picked 2000 because it was themost recent date for which Encyclopaedia Britannica data wereavailable for all dimensions for all of our countries.
Regarding the last point, we collected data on the ethnic andreligious composition of all thirty OECD countries that were as closeto the years 1985 and 2000 as possible given the year of observationprovided in various Encyclopaedia Britannica yearbooks. This resultedin more compressed and therefore more precise time points for theethnic and religious fractionalization data than Alesina achieved. Forexample, his data for ethnic fractionalization in the OECD coveredeighteen years ranging from 1983 for one country to 2001 for fourothers. Data for most countries reflected their situations in the early tomid-1990s. By contrast, our data for 1985 spanned five years and ourdata for 2000 spanned two years. Similarly, our religious compositiondata represent the narrowest time spans available in the EncyclopaediaBritannica data for both 1985 and 2000. The time spans for 1985 and2000 are five and four years, respectively. Alesina took religious
198 Natalka Patsiurko et al.
Dow
nloa
ded
by [
Dar
tmou
th C
olle
ge L
ibra
ry]
at 0
4:35
07
Febr
uary
201
2

composition data only from the Encyclopaedia Britannica 2001 year-book so his data on religious fractionalization presumably refer onlyto years near 2000. Things were more difficult for the linguisticcomposition data. The Encyclopaedia Britannica does not provide theactual years of observation for these data so, similar to Alesina’sapproach, we assume that the linguistic data refer to the years close to1985 in the 1986 yearbook and to the years close to 2000 in the 2001yearbook. Constructing an index for each fractionalization typeinvolved additional challenges.
Consider ethnic fractionalization. For the most part, theEncyclopaedia Britannica provides the ‘ethnic composition’ for eachsociety in the form of the percentage distribution of ethnic groups forthe particular year of observation. The ethnic composition data aremost often based on ‘ethnic groups’ but sometimes on either ‘ethno-linguistic groups’ or ‘racial groups’. The particular label for eachcountry is determined by the categories that countries themselves usein their national statistics � that is, categories that they believe aresalient. The data are most often called ‘ethnic composition’ but insome cases they are conflated with language composition or politicaldefinitions of immigrants used within a country. For instance, for the2000 ethnic data, twenty-two out of thirty countries carry the ‘ethniccomposition’ label. However, for four countries (Japan, Germany,Luxembourg, Switzerland) the Encyclopaedia Britannica reports‘ethnic composition by nationality’ and for another four countries itreports ‘ethno-linguistic composition’ (Italy), ‘composition by raceand Hispanic origin’ (United States), ‘composition by ethnic origin’(Canada) and ‘composition by place of origin including secondgeneration’ (Holland).
Insofar as religious fractionalization is concerned, the EncyclopaediaBritannica provides ‘religious affiliation’ data for each country as thepercentage distribution of the religious groups for a particularobservation year. It automatically assigns the parents’ religion tochildren. Furthermore, it cautions that the listed religious groupsdescribe only nominal religious affiliations, regardless of whether theirmembers are practising or not. One way to remedy the situation is that‘non-religious’ and ‘non-practising’ people are often listed as aseparate category for a country. We treated all the categories of non-believers and the non-practising as separate religious groups. Thisslightly inflates the level of religious fractionalization. However, we feltthat such treatment better reflects the religious diversity of the societiesin question.2
The Encyclopaedia Britannica also presents the distribution ofreligious groups � that is, as the listing of absolute sizes of variousreligious groups in a given year. Alesina used this format to calculatethe religious fractionalization for 2000. In contrast, we used the
Measuring cultural diversity 199
Dow
nloa
ded
by [
Dar
tmou
th C
olle
ge L
ibra
ry]
at 0
4:35
07
Febr
uary
201
2

percentage distribution format because the exact year of observation isreported in the percentage format but not in the listing format.
As for linguistic fractionalization, the way that the EncyclopaediaBritannica reports linguistic divisions in societies is different from howit reports ethnic and religious divisions. It provides estimates of theabsolute size of the linguistic groups within each country. The sum ofthese linguistic groups corresponds approximately but not alwaysexactly to the overall population of the country. Based on the absolutenumber of speakers in each language group, we calculated thepercentage of speakers of major languages within the society andthen calculated the index of linguistic fractionalization.
Data on linguistic composition are based principally on two ways ofrecording linguistic composition in national statistics. The first way, asthe Encyclopaedia Britannica explains, is to use the mother tongue ofthe population reported in the national statistics. The second way �ethno-linguistic composition � is used for countries where the mother-tongue data are not recorded in the national statistics. In this case, thepercentage of the representatives of a given ethnic group in a countryis assumed to correspond to the percentage of speakers of its language.Hence, ethnic groups are equated to linguistic groups. This happensfor seventeen of the thirty countries in the 1986 yearbook and for fiveof the thirty countries in the 2001 yearbook.
There are additional challenges with these data. First, given theoccasional correspondence between language and ethnicity, the ethnicand linguistic fractionalization indices are likely to be correlated.Second, because the linguistic distributions are estimated inconsis-tently and reported in absolute numbers rather than as percentages theindex is probably less precise than the two others. Third, theEncyclopaedia Britannica does not report bilingualism in 1985 at alland limits bilingualism in 2000 by indicating the lingua franca forthose countries where one language serves as a common medium ofcommunication, such as English in the United States. Lingua franca isreported for Australia, Ireland, the Netherlands and the United Statesbut not for Canada or New Zealand. The problem is that including thenumber of speakers of the lingua franca pushes the number of peoplein all of the linguistic categories provided by the EncyclopaediaBritannica above 100 per cent of the national population. Therefore,we excluded the lingua franca bilingual groups when we calculated theindex of linguistic fractionalization because the index can only becalculated based on mutually exclusive categories. These problemsmake the linguistic fractionalization index the weakest of ourmeasures.
Three caveats are in order. First, virtually all of our data are only forthe mainland of each country. Overseas or remote territories ofcountries like France, the Netherlands and Denmark are not included.
200 Natalka Patsiurko et al.
Dow
nloa
ded
by [
Dar
tmou
th C
olle
ge L
ibra
ry]
at 0
4:35
07
Febr
uary
201
2

However, data for the United Kingdom include Northern Ireland andthe Scottish isles. Second, because the Czech Republic and Slovakiawere parts of the same country in 1985 the Encyclopaedia Britannicadoes not provide separate ethnic, religious or linguistic data for eachone. Put differently, only national not regional data are available forthat year. Third, Germany was a divided country in 1985 butsubsequently reunified. Hence, we present data for 1985 based onlyon the Federal Republic of Germany not the German DemocraticRepublic.
In sum, there are several challenges for gathering data for measuringfractionalization even in the OECD where official statistics are mostreadily available. Despite the challenges our data have advantagesrelative to those collected by others. Most important, we have data ontwo points of time rather than just one, thus providing us with anopportunity for historical analysis. Furthermore, with respect toAlesina, his measure of fractionalization covers a comparativelywide range of years whereas ours covers a narrower range for eachof our time points. Our indices, then, are more precise historically thanothers.
Fractionalization indices
We calculated three fractionalization indices for each country for the1985 and 2000 time periods. Results are displayed in Tables 1 and 2.For purposes of comparison later, we also present Alesina’s indices inTable 3.
Our data reveal that fractionalization in 1985 was rather low. Thelinguistic fractionalization mean was .1984 (.193).3 Ethnic fractiona-lization averaged .2073 (.203). Thus, a majority of OECD countrieswere linguistically and ethnically homogeneous in 1985. By contrast,religious fractionalization averaged .3828 (.256). These measures werecorrelated in varying degree.4 Ethnic and linguistic fractionalizationwere significantly correlated at the .808 level (p�.01). By contrast, thecorrelations between religious fractionalization, on the one hand, andethnic (.077) and linguistic fractionalization (�.049), on the other,were small and statistically insignificant.
In 2000, religious fractionalization was again the highest of the threemeasures with a mean of .4625 (.247). Linguistic fractionalization wasagain the lowest of the three with a mean of .1987 (.184). However,ethnic fractionalization, with a mean of .2867 (.204), was no longersimilar to linguistic fractionalization. These measures were correlatedmuch as they were for 1985. Ethnic and linguistic fractionalizationwere significantly correlated at the .718 level (p�.01). Again thecorrelations between religious fractionalization, on the one hand, and
Measuring cultural diversity 201
Dow
nloa
ded
by [
Dar
tmou
th C
olle
ge L
ibra
ry]
at 0
4:35
07
Febr
uary
201
2

ethnic (.046) and linguistic fractionalization (.135), on the other, weresmall and statistically insignificant.
Overall, average linguistic fractionalization did not change signifi-cantly. However, the increases in ethnic and religious fractionalizationwere statistically significant (p � .01). Average ethnic diversity in theOECD increased about 38 per cent; religious diversity increased about21 per cent; linguistic diversity increased less than 1 per cent.
We expected fractionalization of all types to have increased between1985 and 2000 because of immigration, which increased during thisperiod in many OECD countries (Held et al. 1999, pp. 318�21). So thelack of change in linguistic fractionalization is surprising. There couldbe several reasons for this. To begin with, people may migrate tocountries where they have or claim to have the dominant language,
Table 1. Ethnic, linguistic and religious fractionalization, 1985
Country Ethnic Linguistic Religious
Australia 0.1077 0.0239 0.8260Austria 0.0760 0.0477 0.2809Belgium 0.1683 0.5419 0.0768Canada 0.7463 0.6299 0.6079Czech Republic 0.4979 0.4968 0.5199Denmark 0.0238 0.0629 0.1567Finland 0.1201 0.1205 0.1932France 0.2428 0.3286 0.3947Germany 0.1378 0.1215 0.7035Greece 0.0874 0.0988 0.0472Hungary 0.0119 0.0204 0.6441Iceland 0.0547 0.0324 0.0604Ireland 0.1040 0.3541 0.1311Italy 0.1133 0.0454 0.2886Japan 0.0119 0.0114 0.4928Korea (South) 0.0020 0.0020 0.6027Luxembourg 0.4408 0.4037 0.1316Mexico 0.5909 0.1711 0.1975Netherlands 0.0760 0.0740 0.7082New Zealand 0.2545 0.1252 0.7340Norway 0.0473 0.0534 0.2223Poland 0.0257 0.0256 0.3078Portugal 0.0219 0.0199 0.1054Slovak Republic 0.4979 0.4968 0.5199Spain 0.4359 0.4360 0.0584Sweden 0.1641 0.1729 0.5280Switzerland 0.5322 0.5172 0.5711Turkey 0.2536 0.1811 0.0159United Kingdom 0.1082 0.1327 0.6433United States 0.2637 0.2047 0.7155Mean .2073 .1984 .3828Standard deviation .203 .193 .256
202 Natalka Patsiurko et al.
Dow
nloa
ded
by [
Dar
tmou
th C
olle
ge L
ibra
ry]
at 0
4:35
07
Febr
uary
201
2
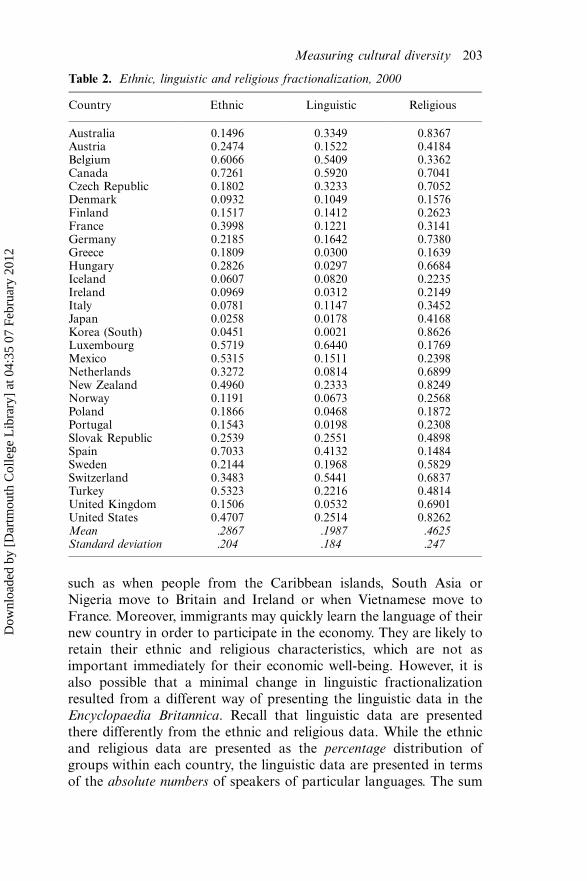
such as when people from the Caribbean islands, South Asia orNigeria move to Britain and Ireland or when Vietnamese move toFrance. Moreover, immigrants may quickly learn the language of theirnew country in order to participate in the economy. They are likely toretain their ethnic and religious characteristics, which are not asimportant immediately for their economic well-being. However, it isalso possible that a minimal change in linguistic fractionalizationresulted from a different way of presenting the linguistic data in theEncyclopaedia Britannica. Recall that linguistic data are presentedthere differently from the ethnic and religious data. While the ethnicand religious data are presented as the percentage distribution ofgroups within each country, the linguistic data are presented in termsof the absolute numbers of speakers of particular languages. The sum
Table 2. Ethnic, linguistic and religious fractionalization, 2000
Country Ethnic Linguistic Religious
Australia 0.1496 0.3349 0.8367Austria 0.2474 0.1522 0.4184Belgium 0.6066 0.5409 0.3362Canada 0.7261 0.5920 0.7041Czech Republic 0.1802 0.3233 0.7052Denmark 0.0932 0.1049 0.1576Finland 0.1517 0.1412 0.2623France 0.3998 0.1221 0.3141Germany 0.2185 0.1642 0.7380Greece 0.1809 0.0300 0.1639Hungary 0.2826 0.0297 0.6684Iceland 0.0607 0.0820 0.2235Ireland 0.0969 0.0312 0.2149Italy 0.0781 0.1147 0.3452Japan 0.0258 0.0178 0.4168Korea (South) 0.0451 0.0021 0.8626Luxembourg 0.5719 0.6440 0.1769Mexico 0.5315 0.1511 0.2398Netherlands 0.3272 0.0814 0.6899New Zealand 0.4960 0.2333 0.8249Norway 0.1191 0.0673 0.2568Poland 0.1866 0.0468 0.1872Portugal 0.1543 0.0198 0.2308Slovak Republic 0.2539 0.2551 0.4898Spain 0.7033 0.4132 0.1484Sweden 0.2144 0.1968 0.5829Switzerland 0.3483 0.5441 0.6837Turkey 0.5323 0.2216 0.4814United Kingdom 0.1506 0.0532 0.6901United States 0.4707 0.2514 0.8262Mean .2867 .1987 .4625Standard deviation .204 .184 .247
Measuring cultural diversity 203
Dow
nloa
ded
by [
Dar
tmou
th C
olle
ge L
ibra
ry]
at 0
4:35
07
Febr
uary
201
2

of these linguistic groups approximates the size of the population ineach country but is not exact, which suggests that the sizes of thelinguistic groups are only estimates and thus perhaps not as accurateor time-sensitive as our other measures of fractionalization.
Two points are evident. First, differentiating among types offractionalization makes sense insofar as the degree of fractionalizationvaries among types. This suggests that studies of the effect offractionalization on political and economic variables need to recognizethat results may vary depending on which type of fractionalization isbeing examined. Second, fractionalization may change over time �even short periods of time like our fifteen-year interval. Some types offractionalization may change more than others. And the relative
Table 3. Alesina’s ethnic, linguistic and religious fractionalization
Country Ethnic Linguistic Religious
Australia 0.0929 0.3349 0.8211Austria 0.1068 0.1522 0.4146Belgium 0.5554 0.5409 0.2127Canada 0.7124 0.5772 0.6958Czech Republic 0.3222 0.3233 0.6591Denmark 0.0819 0.1049 0.2333Finland 0.1315 0.1412 0.2531France 0.1032 0.1221 0.4029Germany 0.1682 0.1642 0.6571Greece 0.1576 0.0300 0.1530Hungary 0.1522 0.0297 0.5244Iceland 0.0798 0.0820 0.1913Ireland 0.1206 0.0312 0.1550Italy 0.1145 0.1147 0.3027Japan 0.0119 0.0178 0.5406Korea (South) 0.0020 0.0021 0.6604Luxembourg 0.5302 0.6440 0.0911Mexico 0.5418 0.1511 0.1796Netherlands 0.1054 0.5143 0.7222New Zealand 0.3969 0.1657 0.8110Norway 0.0586 0.0673 0.2048Poland 0.1183 0.0468 0.1712Portugal 0.0468 0.0198 0.1438Slovak Republic 0.2539 0.2551 0.5655Spain 0.4165 0.4132 0.4514Sweden 0.0600 0.1968 0.2342Switzerland 0.5314 0.5441 0.6083Turkey 0.3200 0.2216 0.0049United Kingdom 0.1211 0.0532 0.6944United States 0.4901 0.2514 0.8241Mean .2301 .2104 .4194Standard deviation .198 .191 .252
204 Natalka Patsiurko et al.
Dow
nloa
ded
by [
Dar
tmou
th C
olle
ge L
ibra
ry]
at 0
4:35
07
Febr
uary
201
2

position of countries vis-a-vis one another on a fractionalization scalemay change too.
Consider the ethnic fractionalization data, which we use nowbecause they seem to be the most reliable.5 Using the mean ethnicdiversity in each period as a dividing point, we can identify nineteenethnically homogeneous countries and eleven heterogeneous countriesin both 1985 and 2000 (see Figures 1 and 2). Some countries movedbetween the categories so defined. Thus, Belgium and the Netherlandsbecame ethnically diverse by 2000 while the Czech Republic andSlovakia became ethnically homogeneous by 2000 after the VelvetRevolution divided them into independent nation-states in 1992. Thethreshold dividing homogeneous and heterogeneous countries in 1985was located between Belgium and France but in 2000 it was betweenHungary and Netherlands.
Alesina’s one-time measurement of ethnic fractionalization alsogives nineteen homogeneous and eleven heterogeneous countries, buthe lists the Czech Republic and Slovakia as heterogeneous, more inline with the pre-1992 situation, and the Netherlands as homogeneous,again more similar to the late 1980s. The ability to observe change overtime and avoid such problems is an advantage of our data. Indeed,several countries changed their relative positions on ethnic fractiona-lization even over this short period of time. Ethnic fractionalizationscores for nine out of thirty countries changed by more than .2 points
Figure 1. Ethnic fractionalization in OECD countries, 1985
0.00
0.10
0.20
0.30
0.40
0.50
0.60
0.70
0.80
0.90
Ko
rea
(So
uth
)
Jap
an
Hu
ng
ary
Po
rtu
gal
Den
mar
k
Po
lan
d
No
rway
Icel
and
Net
her
lan
ds
Au
stri
a
Gre
ece
Irel
and
Au
stra
lia
Un
ited
Kin
gd
om
Ital
y
Fin
lan
d
Ger
man
y
Sw
eden
Bel
giu
m
Fra
nce
Tu
rkey
New
Zea
lan
d
Un
ited
Sta
tes
Sp
ain
Lu
xem
bo
urg
Slo
vak
Rep
ub
lic
Cze
ch R
epu
blic
Sw
itze
rlan
d
Mex
ico
Can
ada
Measuring cultural diversity 205
Dow
nloa
ded
by [
Dar
tmou
th C
olle
ge L
ibra
ry]
at 0
4:35
07
Febr
uary
201
2

between 1985 and 2000. The Czech Republic and Slovakia exhibitedthe greatest decline in heterogeneity � roughly .3 points � due to theirseparation. The greatest increase in ethnic fractionalization was inBelgium, which moved by more than .4 points from .1683 to .6066 orfrom the nineteenth to twenty-seventh place. We return to the Belgiancase later. Hungary, Turkey, Spain, the United States, New Zealandand the Netherlands also demonstrated substantial jumps in ethnicfractionalization of around.2. Hungary, which in 1985 was extremelyhomogeneous, moved from the second to the nineteenth mosthomogeneous country. The Netherlands moved from ninth totwentieth place. Many countries, however, changed their ethnicfractionalization very little. In ten countries the absolute change inethnic fractionalization did not exceed 0.05. Minimal changes wereobserved for Iceland, Ireland and Japan, all of whom remained veryhomogeneous in both periods, and for Canada, which remained veryheterogeneous.
Shifts in fractionalization scores may occur for various reasons.Substantive changes in populations may occur. We suspect thatimmigration has driven much of the rise in average fractionalizationfor the OECD countries. A case in point is Denmark, whichexperienced increased immigration particularly from Muslim nationsthat contributed to a rise in its ethnic fractionalization score from
Figure 2. Ethnic fractionalization in OECD countries, 2000
0.00
0.10
0.20
0.30
0.40
0.50
0.60
0.70
0.80
0.90
Jap
an
Ko
rea
(So
uth
)
Icel
and
Ital
y
Den
mar
k
Irel
and
No
rway
Au
stra
lia
Un
ited
Kin
gd
om
Fin
lan
d
Po
rtu
gal
Cze
ch R
epu
blic
Gre
ece
Po
lan
d
Sw
eden
Ger
man
y
Au
stri
a
Slo
vak
Rep
ub
lic
Hu
ng
ary
Net
her
lan
ds
Sw
itze
rlan
d
Fra
nce
Un
ited
Sta
tes
New
Zea
lan
d
Mex
ico
Tu
rkey
Lu
xem
bo
urg
Bel
giu
m
Sp
ain
Can
ada
206 Natalka Patsiurko et al.
Dow
nloa
ded
by [
Dar
tmou
th C
olle
ge L
ibra
ry]
at 0
4:35
07
Febr
uary
201
2

.0238 in 1985 to .0932 in 2000 (Hedetoft 2006). But changes in datacollection may occur too. The dramatic increase in Belgium’s ethnicdiversity score is partly due to the fact that for political reasonsgovernment statistics in 2000 but not in 1985 distinguished betweenFlemish and Walloon groups. Similarly, Hungary collected data on sixethnic groups in 2000 for which it did not collect data in 1985. As bestwe can tell, these are the only instances in our EncyclopaediaBritannica data where major shifts in fractionalization in the OECDwere due at least in part to changes in how countries categorizedgroups as well as changes in population composition. It would beinteresting to investigate whether shifts in national census categories aswell as changes in things like immigration policies were associatedstatistically with fractionalization measures over time across countries.But this would require a detailed historical analysis of censusmethodologies in each country, which is well beyond the scope ofthis paper (e.g. Kertzer and Arel 2002). Nevertheless, the point is thatresearchers must be careful when interpreting these changes.
To summarize, by our measures the OECD countries became moreculturally heterogeneous between 1985 and 2000. However, there wasconsiderable variation within this group such that several countriesbecame more heterogeneous while a few others became more homo-geneous. Our data permit such historical comparisons and thus are asignificant improvement over indices that do not measure fractiona-lization over time. And in some cases, notably the Czech Republic,Slovakia and the Netherlands, this leads us to draw differentconclusions than did Alesina about how homogeneous a country is.
Ethnic fractionalization and economic performance
The degree to which countries are culturally homogeneous is oftencited as a predictor of economic performance � typically operationa-lized in terms of GDP growth rates (e.g. Alesina et al. 1997, 2003;Easterly and Levine 1997; Min, Cederman and Wimmer 2010). To seewhether this relationship held up for the advanced capitalist countrieswe analysed the associations between our three measures of fractio-nalization and average annual GDP growth rates in the OECD.
First, we took data on GDP per capita growth rates from the WorldBank World Development Indicators (2009) database. We thencalculated the average annual GDP growth rate for the OECDcountries over two periods: 1989�99 and 2001�7.6 We selected theseperiods because they corresponded to the two business cycles mostclosely following the 1985 and 2000 years of our fractionalizationindices. We began by calculating the correlations between our 1985fractionalization indices and growth rates for 1989�99. The correla-tions for ethnic (�.327), linguistic (�.172) and religious (�.232)
Measuring cultural diversity 207
Dow
nloa
ded
by [
Dar
tmou
th C
olle
ge L
ibra
ry]
at 0
4:35
07
Febr
uary
201
2

fractionalization were inversely related to growth rates as much of theliterature would expect but none of these relationships was statisticallysignificant, although the correlation between ethnic fractionalizationand growth (p � .077) came close. We did the same for our 2000fractionalization indices and growth rates for 2001�7. Again, thecorrelations for ethnic (�.164) and linguistic (�.142) fractionaliza-tion were inversely related to growth rates. But now the correlationbetween religious fractionalization and GDP growth was positive(.046). None of these was significant statistically.
The statistically weak associations between fractionalization andeconomic growth suggest that if fractionalization affects growth theeffect may be indirect. For example, cultural diversity may affectnational economic performance by affecting the political-economicinstitutions that impact more directly on economic performance(Campos and Kuzeyev 2007, p. 621; Campbell and Hall 2009,Campbell and Hall 2010). Furthermore, the relationship betweenfractionalization and growth may change over time.
Second, to explore more closely the possibility of change weregressed average annual GDP growth rates on ethnic fractionalizationand generated scatter plots of countries around the regression lines.We focused on ethnic fractionalization because its association withgrowth in the preceding analysis was the strongest. Figures 3 and 4show the inverse and statistically insignificant relationship betweenethnic fractionalization and growth, but also reveal changes forindividual countries.
Figure 3 shows that during the 1989�99 years Ireland was anextreme case that did not fit the prediction of growth as related toethnic fractionalization.7 Because ethnic fractionalization in Irelandwas low its growth rate should have been high, but only on the order of2.23 per cent per year. Instead, Ireland’s growth rate was 6.39 per centper year. Other outliers, although not statistically significant, wereSouth Korea and Luxembourg, which out-performed expectations,and Hungary and the Czech Republic, which under-performedexpectations. Figure 4 repeats the exercise for 2001 through 2007.Slovakia was the only statistically significant outlier.8 Slovakiangrowth was predicted to increase by 2 per cent per year but reachedmore than 6 per cent per year.
Note that the position of countries around the regression linesshifted � sometimes dramatically. For instance, Ireland, South Koreaand Luxembourg all moved much closer to the regression line from thefirst to the second periods and were no longer outliers. Especiallyinteresting is the fact that some countries moved across the line byconsiderable amounts. Hungary, the Czech Republic and Slovakiamoved from notable under-performers to notable over-performers � a
208 Natalka Patsiurko et al.
Dow
nloa
ded
by [
Dar
tmou
th C
olle
ge L
ibra
ry]
at 0
4:35
07
Febr
uary
201
2

fact that surely reflects their change from communist to capitalisteconomic systems.
Third, to pursue things further we turned to multiple regressionanalysis. Much of the literature on the relationship between ethnicfractionalization and growth is based on a large number of countriesfrom around the world. It often incorporates numerous controlvariables into the regression models. We have a much smaller numberof countries than many other studies, which constrains our ability toadd a lot of controls (Green 1991). However, most of the controls usedin the literature are irrelevant for our purposes. For instance, followingEasterly and Levine (1997), most of Alesina’s controls involvedmeasures of government quality, political corruption and the likebecause developing countries comprised a sizeable portion of hissample. But variation among OECD countries on these dimensions isminimal. Hence, incorporating these variables into our analysis madelittle sense. We included only controls that both made sense for ourcountries and that Alesina had used.
We pooled our 1985 and 2000 data in order to increase the samplesize to sixty observations and permit the use of some control variables.Following Alesina, we included controls for GDP per capita at the
Figure 3. Ethnic fractionalization and average GDP growth, 1989�99
Measuring cultural diversity 209
Dow
nloa
ded
by [
Dar
tmou
th C
olle
ge L
ibra
ry]
at 0
4:35
07
Febr
uary
201
2

beginning of each time period and average schooling at the beginningof each period. The controls for initial GDP per capita included boththe log of initial income as well as the log of initial income squared toaccount for possible non-linear effects.9 The control for education wasa log of average educational attainment at the beginning of eachperiod.10 We also included a dummy variable for the 1980s becauseour initial correlations suggested that the relationship betweenfractionalization and growth may have been stronger in the 1980sthan the 2000s. Finally, we used dummy variables for the post-communist countries because many of them achieved remarkablyrapid growth in the 1990s after their communist regimes collapsed. Weused the Seemingly Unrelated Regression (SUR) technique asprovided by Stata statistical software to analyse the data. SUR isappropriate for analysing pooled data like ours where a singleregression model uses a number of linear equations in which theequation errors are likely to be correlated (Zellner 1962).
Results are reported in Table 4. For purposes of comparison wepresent models using both our and Alesina’s ethnic fractionalizationmeasures for the OECD countries. Models 1 and 2 estimate the directeffects of ethnic fractionalization on GDP growth rates in the OECD.Model 1, which uses our fractionalization measure, shows a small
Figure 4. Ethnic fractionalization and average GDP growth, 2001�7
210 Natalka Patsiurko et al.
Dow
nloa
ded
by [
Dar
tmou
th C
olle
ge L
ibra
ry]
at 0
4:35
07
Febr
uary
201
2

Table 4. SUR regression of economic growth on ethnic fractionalization
Model 1 Model 2 (Alesina) Model 3 Model 4 (Alesina) Model 5 Model 6 (Alesina)
Dummy for the 1980s �.0038 �.0025 �.0061 �.0042(�1.10) (�0.72) (�1.86) (�1.28)
Post �communist countries �.0126 �.0122(�1.58) (�1.48)
Log of initial income �.0457 �.0507(�0.31) (�0.33)
Log of initial income squared .0018 .0025(0.10) (0.14)
Log of schooling .0430 .0441(1.95) (1.92)
Ethnic fractionalization �.0146 �.0116 �.0169* �.0116 �.0199** �.0140(�1.77) (�1.31) (�1.97) (�1.32) (�2.63) (�1.74)
Number of observations 30;30 30;30 30;30 30;30 30;30 30;30
Overall R2 .05 .03 .07 .04 .26 .21R2 .11;.03 .05;.01 .11;.03 .05;.01 .31;.66 .28;.66
*p�.05, **p�.01, t-statistics are in parentheses.
Mea
surin
gcu
ltura
ld
iversity2
11
Dow
nloa
ded
by [
Dar
tmou
th C
olle
ge L
ibra
ry]
at 0
4:35
07
Febr
uary
201
2

negative association between fractionalization and growth that is notstatistically significant. Model 2 does the same thing but uses Alesina’sfractionalization measure. It also reveals a negative relationship butone that is even weaker statistically than that presented in model 1.
Models 3 and 4 add a time control for the 1980s. Model 3 uses ourfractionalization measure and finds that the inverse relationshipbetween ethnic fractionalization and economic growth is significantstatistically (p�.05). Model 4 uses Alesina’s fractionalization measureand does not reveal a statistically significant relationship. Models 5and 6 include all the controls. Model 5 shows that our measure offractionalization remains inversely related to growth and is statisticallysignificant (p � .01). An increase in ethnic fractionalization from 0 to1 is associated with a 1.99 per cent decline in growth. This is consistentwith what others have found world-wide (e.g. Easterly and Levine1997; Alesina et al. 2003). Model 6 shows that Alesina’s ethnicfractionalization measure is inversely related to economic growth butis not significant statistically.
Discussion and conclusion
Our indices have advantages relative to other popular fractionalizationindices. Most important, our indices cover two time periods and sopermit historical comparisons where others do not (e.g. Alesina et al.2003; Fearon 2003). And ours cover the OECD countries where othersdo not (e.g. Posner 2004; Campos and Kuzeyev 2007).
Nevertheless, our results support the findings of other researchers.First, we found that from 1985 to 2000 average religious diversity andto a lesser degree average ethnic diversity increased while averagelinguistic diversity remained quite stable. Second, we found that ethnicfractionalization was more closely associated with economic perfor-mance than other types of fractionalization. Both of these findings areconsistent with recent studies of other small groups of countries(e.g. Campos and Kuzeyev 2007). Third, in the multiple regressionanalysis we found an inverse and statistically significant relationshipbetween ethnic fractionalization and economic growth in the OECD.
Our ethnic fractionalization data were significant in these modelsand Alesina’s were not. We suspect that this reflects the fact that ourdata measure fractionalization at two times and his do not. That manyfractionalization indices do not account for change over time is ageneral problem in this literature (Laitin and Posner 2001; Posner2004; Wimmer 2008). Our data suggest that this is not a trivial concerninsofar as fractionalization scores for some of our countries changed alot and did so rather quickly. Others have discovered similarly rapidchange in fractionalization for post-communist countries (e.g. Camposand Kuzeyev 2007). Failure to recognize change can lead to
212 Natalka Patsiurko et al.
Dow
nloa
ded
by [
Dar
tmou
th C
olle
ge L
ibra
ry]
at 0
4:35
07
Febr
uary
201
2

misspecification of certain cases. For instance, as we have noted,Alesina’s specification of ethnic fractionalization in the CzechRepublic was rather different from ours. So was his specification ofethnic fractionalization in the United States (.4901), which was muchcloser to what we found for 2000 (.4707) than for 1985 (.2637).
Some have argued that things like geography and state history �deep-rooted factors � determine the degree of national ethnic diversity(e.g. Ahlerup and Olsson 2009; Michalopoulos 2008). If so, then wemight be accused of omitting potentially important independentvariables from our analysis. However, the unique advantage of havingmeasures of ethnic fractionalization at two points in time only fifteenyears apart enables us to show that short-term changes in fractiona-lization can still be profound enough to be significantly associatedwith economic growth. This suggests that ethnic fractionalization isdetermined in part by less deep-rooted and more immediate factors,such as changes in immigration policies or average income. Investiga-tion of the determinants of ethnic fractionalization is worthy of furtherstudy.
Finding a strong inverse relationship between ethnic fractionaliza-tion and economic growth in the OECD is especially important insofaras these countries as a group are rather homogeneous by worldstandards. One might have suspected that the impact of ethnicdiversity on economic performance in the OECD would be negligible.But it was significant. And this underscores how important thecultural composition of these countries still is for their performance.Nevertheless, the fact that our fully specified regression modelexplained only 26 per cent of the variance in growth reminds us thatethnic diversity may influence growth indirectly through the quality ofnational political and economic institutions. Indeed, national integra-tion policies and welfare states matter for how well culturally diversepopulations are assimilated into and perform in labour markets andother aspects of life in the OECD (Soysal 1994; Koopmans 2010).
Some of the challenges in constructing indices like ours stem fromnational politics. On the one hand, data collection methods varysomewhat across countries even though the Encyclopaedia Britannicastrives to achieve rigorous cross-national comparability. Countries donot always agree on the best ways to measure the various facets ofdifference. On the other hand, national data collection methodsoccasionally vary over time � and may do so for political reasons(Kertzer and Arel 2002). For instance, as noted earlier, Belgium nowdistinguishes between Flemish and Walloon whereas it did not in thepast. And measuring the language of daily use can be used to suggestthat minorities have been integrated into the larger society whereasmeasuring mother tongue can be used to suggest that a minority isthreatening the status of the majority. The point is that these
Measuring cultural diversity 213
Dow
nloa
ded
by [
Dar
tmou
th C
olle
ge L
ibra
ry]
at 0
4:35
07
Febr
uary
201
2

difficulties are unavoidable even if one were to go directly to nationalcensuses rather than the Encyclopaedia Britannica for data. Theproblem is that shifts in fractionalization as measured by nominalquantitative indices reflect substantive changes in populations as wellas methodological changes in national data collection. This suggeststhe need for combining this sort of quantitative analysis with in-depthcase studies to establish exactly what is happening.
Some researchers have criticized fractionalization indices for notreflecting the degree to which nominal fractionalization has realpolitical salience and whether this salience shifts over time (e.g. Fearon2003; Posner 2004). For instance, so-called ‘pillarization’ policies in theNetherlands diminished the political salience of the traditionalProtestant-Catholic divide. Catholics and Protestants were grantedseparate unions, political parties and the like in order to assuagereligious tensions. The issue of salience also underscores the need todisaggregate various dimensions of fractionalization as we have donebecause some dimensions may be politicized in some countries or atsome moments in time but not in others (Laitin and Posner 2001;Fearon 2003; Posner 2004, 2005). Posner (2005) suggests that one wayto get to the bottom of this is to develop in-depth qualitative casestudies. Case studies are also important for identifying the causalmechanisms underlying statistical relationships like those we haveexamined. This is especially so insofar as the processes ofhomogenization that underlie our measures in many OECD countriestook a long time to unfold. Denmark, for example, underwent acultural homogenization process that began at least as far back as themid-nineteenth century and that has had significant impacts on hereconomic performance ever since (Campbell and Hall 2009). Un-fortunately, good quantitative data on cultural diversity, which wouldbe necessary for statistical analysis of such a long period of history, arenot always available. Qualitative case studies are indispensable.
Of course, case selection is important in such a qualitativeendeavour. Our data can be used to improve the case selection process.Lieberman (2005) showed that quantitative analysis can be a usefultool for picking country cases for more in-depth qualitative scrutinylater. He argued that by calculating a regression line and thendisplaying a scatter plot of countries around it, as we have done,one can determine which cases to pursue qualitatively by selectingsome that conform to the model � that is, cases that fall close to theregression line � and others that are outliers both above and belowthat line. His point was that it is just as important to understand whysome cases do not fit the model as it is to understand why others do.Doing so helps to identify more systematically the causal mechanismsoperating, such as those by which ethnic fractionalization does or doesnot affect economic performance. Our analysis suggests that in
214 Natalka Patsiurko et al.
Dow
nloa
ded
by [
Dar
tmou
th C
olle
ge L
ibra
ry]
at 0
4:35
07
Febr
uary
201
2

addition to picking cases depending on how close to a regression linethey fall at one moment in time, one can also calculate the regressionline and scatter plots for two different time periods in order to pickcases whose locations relative to the line and each other movesignificantly over time, as Hungary, the Czech Republic, Slovakiaand Ireland did in our analyses. In addition to some countries whoselocations were more stable, a few of these would be good cases todevelop qualitatively if one were interested in understanding exactlyhow changes in ethnic fractionalization affected economic perfor-mance. But this cannot be done without historically sensitivefractionalization indicators, such as those offered here.
Acknowledgements
Thanks for comments on an earlier version of this paper go to MichaelAllen, Matthew Lange, Kathryn Lively, Kathy Sherrieb, Mike Smithand two reviewers.
Notes
1. Issues of cultural homogeneity are also of concern to students of nationalist insurgency
(Cederman and Girardin 2007), civil war (Fearon, Kasara and Laitin 2007; Wimmer,
Cederman and Min 2009), the provision of public goods (Habyarimana et al. 2009) and
more.
2. Japan presented a special case insofar as some people reported that they were both
Buddhist and Shintoist, which meant that the percentages totalled more than 100 per cent.
Because calculating a fractionalization index requires that percentages total 100 per cent we
adjusted the percentages accordingly by re-scaling them. That is, we kept the same
proportions among groups but reduced the percentages to add up to 100 per cent. This
slightly reduced religious diversity in Japan.
3. The standard deviation for each measure is presented in parentheses.
4. All correlations reported are Pearson correlations whose significance is tested with two-
tailed tests.
5. As noted above, the linguistic data are the weakest. And the data on religious
fractionalization are probably inflated by the inconsistent measurement across countries of
non-religious and atheist groups.
6. Growth rates are missing in 1989 and 1990 for Poland and the Czech Republic.
Therefore, their averages are for the years 1991�9 only.
7. Ireland’s standardized regression residual is greater than 3.
8. Slovakia’s standardized regression residual is greater than 2.5.
9. GDP per capita is in constant 2000 US dollars as reported in the World Bank World
Development Indicators (2009) for the beginning of each period, 1985 and 2000.
10. This is the log of (1 � average years of education) at the beginning of each period, 1985
and 2000. Educational data come from Barro and Lee (2001).
References
AHLERUP, PELLE and OLSSON, OLA 2009 ‘The roots of ethnic diversity’, Department
of Economics, University of Gothenburg
Measuring cultural diversity 215
Dow
nloa
ded
by [
Dar
tmou
th C
olle
ge L
ibra
ry]
at 0
4:35
07
Febr
uary
201
2

ALESINA, ALBERTO, BAQIR REZA and EASTERLY, WILLIAM 1997 ‘Public goods
and ethnic divisions’, Quarterly Journal of Economics, vol. 114, pp. 1243�84ALESINA, ALBERTO et al. 2003 ‘Fractionalization’, Journal of Economic Growth, vol. 8,
pp. 155�94BARRO, ROBERT J. and LEE, JONG-WHA 2001 ‘International data on educational
attainment: updates and implications’, Oxford Economic Papers, vol. 53, pp. 541�63, http://www.cid.harvard.edu/ciddata/ciddata.html
BATES, ROBERT 2008 When Things Fell Apart: State Failure in Late-Century Africa, New
York: Cambridge University Press
BJØRNSKOF, CHRISTIAN 2008 ‘Social trust and fractionalization: a possible reinterpre-
tation’, European Sociological Review, vol. 24, pp. 271�83CAMPBELL, JOHN L. and HALL, JOHN A. 2009 ‘National identity and the political
economy of small states’, Review of International Political Economy, vol. 16, no. 4, pp. 1�26*** 2010 ‘Defending the Gellnerian premise’, Nations and Nationalism, vol. 16, no. 1,
pp. 89�107CAMPOS, NAURO F. and KUZEYEV, VITALIY S. 2007 ‘On the dynamics of ethnic
fractionalization’, American Journal of Political Science, vol. 51, pp. 620�39CEDERMAN, LARS-ERIK and GIRARDIN, LUC 2007 ‘Beyond fractionalization:
mapping ethnicity onto nationalist insurgencies’, American Political Science Review, vol.
101, pp. 173�85EASTERLY, WILLIAM and LEVINE, ROSS 1997 ‘Africa’s growth tragedy: politics and
ethnic divisions’, Quarterly Journal of Economics, vol. 112, pp. 1203�50ENCYCLOPAEDIA BRITANNICA 2001 2000 Britannica Book of the Year. Chicago, IL:
Encyclopaedia Britannica.
FEARON, JAMES D. 2003 ‘Ethnic and cultural diversity by country’, Journal of Economic
Growth, vol. 8, pp. 195�222FEARON, JAMES D., KASARA, KIMULI and LAITIN, DAVID D. 2007 ‘Ethnic
minority rule and civil war onset’, American Political Science Review, vol. 101, pp. 187�93GELLNER, ERNEST 1983 Nations and Nationalism, Oxford: Blackwell
GREEN, SAMUEL 1991 ‘How many subjects does it take to do a regression analysis?’,
Multivariate Behavioral Research, vol. 26, no. 3, pp. 499�510HABYARIMANA, JAMES et al. 2009 Coethnicity, New York: Russell Sage Foundation
HEDETOFT, ULF 2006 ‘More than kin and less than kind’, in John L. Campbell, John A.
Hall and Ove K.Pedersen (eds) National Identity and the Varieties of Capitalism, Montreal:
McGill-Queen’s University Press, pp. 398�430
HELD, DAVID et al. (eds.) 1999 Global Transformations, Stanford, CA: Stanford University
Press
KERTZER, DAVID and AREL, DOMINIQUE 2002 Census and Identity, New York:
Cambridge University Press
KOOPMANS, RUUD 2010 ‘Trade-offs between equality and difference: immigrant
integration, multiculturalism and the welfare state in cross-national perspective’, Journal
of Ethnic and Migration Studies, vol. 36, no. 1, pp. 1�26
LAITIN, DAVID D. 2007 Nation, States, and Violence, New York: Oxford University Press
LAITIN, DAVID D. and POSNER, DANIEL N. 2001 ‘The implications of constructivism
for constructing ethnic fractionalization indices’, Newsletter of the Organized Section in
Comparative Politics of the American Political Science Association, vol. 12, pp. 13�7
LIEBERMAN, EVAN 2005 ‘Nested analysis as a mixed-method strategy for comparative
research’, American Political Science Review, vol. 99, no. 3, pp. 435�52
MANN, MICHAEL 2005 The Dark Side of Democracy, New York: Cambridge University
Press
MAZOWER, MARK 2000 Dark Continent, New York: Vintage
MCGARRY, JOHN and O’LEARY, BRENDAN (eds) 1993 The Politics of Ethnic Conflict
Regulation, London: Routledge
216 Natalka Patsiurko et al.
Dow
nloa
ded
by [
Dar
tmou
th C
olle
ge L
ibra
ry]
at 0
4:35
07
Febr
uary
201
2

MICHALOPOULOS, STELIOS 2008 ‘The origins of ethnolinguistic diversity’, Department
of Economics, Tufts University, Massachusetts
MIN, BRIAN, CEDERMAN, LARS-ERIK and WIMMER, ANDREAS 2010 ‘Ethnic
exclusion, economic growth, and civil war’. Department of Sociology, UCLA
POSNER, DANIEL N. 2004 ‘Measuring ethnic fractionalization in Africa’, American
Journal of Political Science, vol. 48, pp. 849�63
*** 2005 Institutions and Ethnic Politics in Africa, New York: Cambridge University Press
PUTNAM, ROBERT 2007 ‘E pluribus unum: diversity and community in the twenty-
first century � the 2006 Johan Skytte Prize’, Scandinavian Political Studies, vol. 30, no. 2,
pp. 137�74
SOYSAL, YASEMIN 1994 Limits of Citizenship, Chicago, IL: University of Chicago Press
WIMMER, ANDREAS 2008 ‘The making and unmaking of ethnic boundaries: a multilevel
process theory’, American Journal of Sociology, vol. 113, pp. 970�1022
WIMMER, ANDREAS, CEDERMAN, LARS-ERIK and MIN, BRIAN 2009 ‘Ethnic
politics and armed conflict’, American Sociological Review, vol. 74, pp. 316�37
WORLD BANK 2009 World Development Indicators, http://web.worldbank.org/
ZELLNER, ARNOLD 1962 ‘An efficient method of estimating seemingly unrelated
regression equations and tests for aggregation bias’, Journal of the American Statistical
Association, vol. 57, pp. 348�68
NATALKA PATSIURKO is Research Fellow in the Department ofSociology at the University of Aberdeen.ADDRESS: Department of Sociology, University of Aberdeen,Aberdeen AB24 3QY, UK.Email: [email protected]
JOHN L. CAMPBELL is Professor in the Department of Sociology atDartmouth College and Professor of Political Economy in theDepartment of Business and Politics at the Copenhagen BusinessSchool.ADDRESS: Department of Sociology, Dartmouth College, Hanover,NH 03755, USA.Email: [email protected]
JOHN A. HALL is Professor in the Department of Sociology atMcGill University.ADDRESS: Department of Sociology, McGill University, Montreal,Quebec, H3A 2T7, Canada.Email: [email protected]
Measuring cultural diversity 217
Dow
nloa
ded
by [
Dar
tmou
th C
olle
ge L
ibra
ry]
at 0
4:35
07
Febr
uary
201
2