Embed Size (px)
Citation preview

© 2015 FARIN & Associates Inc.
Liquidity BasicsMeasuring and Managing Liquidity
Urum Urumoglu
Senior [email protected]
800-236-3724 x4210
1

© 2015 FARIN & Associates Inc.
Course Agenda
• Understanding Nature of Liquidity
– Definition of Liquidity
– Traditional Regulatory Measures
– How to Classify Sources and Uses
– Causes of Liquidity Risk in FI’s
– Regulatory Actions and Expectations
• Building New Measurement Framework
– Liquidity Coverage Ratio (LCR)
– Net Stable Funding Ratio (NSFR)
– Cash Flow Liquidity Gap (Sources & Uses)
2

© 2015 FARIN & Associates Inc.
What is Liquidity & Where Does it
Come From?
3
© 2015 FARIN & Associates Inc.
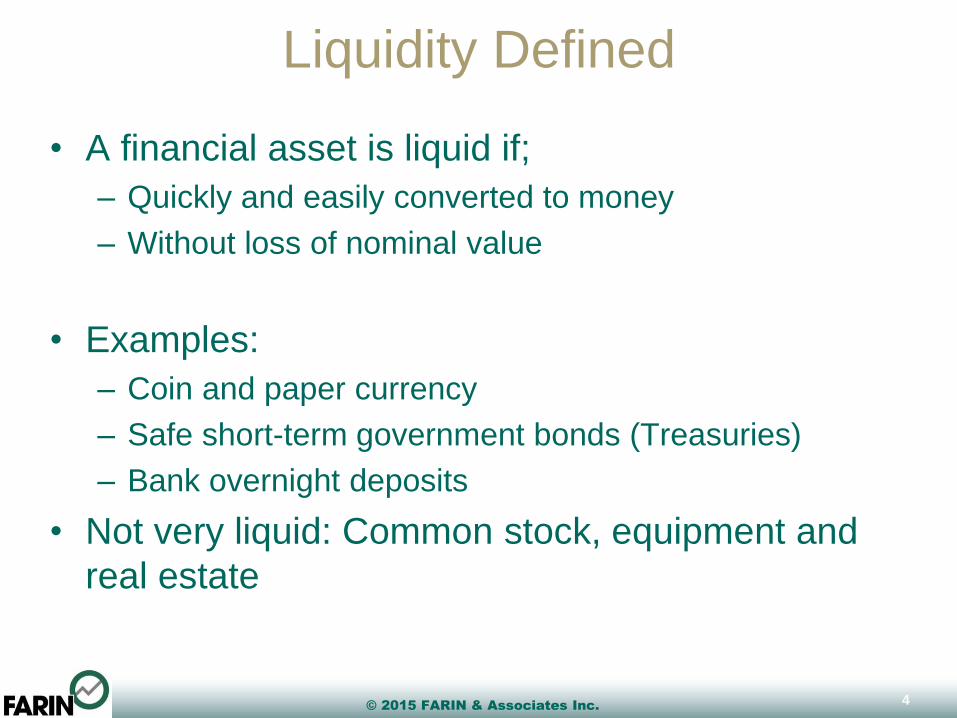
Liquidity Defined
• A financial asset is liquid if;
– Quickly and easily converted to money
– Without loss of nominal value
• Examples:
– Coin and paper currency
– Safe short-term government bonds (Treasuries)
– Bank overnight deposits
• Not very liquid: Common stock, equipment and
real estate
4
© 2015 FARIN & Associates Inc.
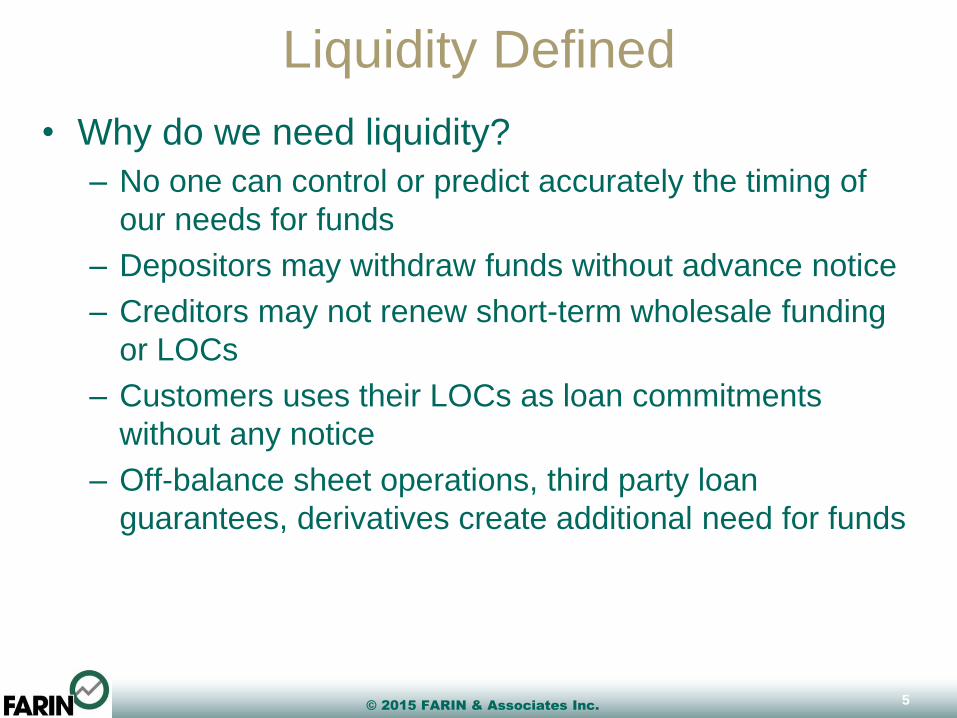
Liquidity Defined
• Why do we need liquidity?
– No one can control or predict accurately the timing of
our needs for funds
– Depositors may withdraw funds without advance notice
– Creditors may not renew short-term wholesale funding
or LOCs
– Customers uses their LOCs as loan commitments
without any notice
– Off-balance sheet operations, third party loan
guarantees, derivatives create additional need for funds
5

© 2015 FARIN & Associates Inc.
Liquidity Defined
• Liquidity is:
– The ability to meet demands for cash
at a reasonable cost.
• Liquidity Risk is:
– The risk that the institution may not
have sufficient sources of cash to
meet demands
• What would cause changes in
liquidity levels or needs
• ALM Process measures risks
taken versus returns derived.
– Risk is to be MANAGED, not
MITIGATED
6
Asset/Liability Management
Interest Rate Risk
Credit RiskRegulatory
Risk
Liquidity Risk

© 2015 FARIN & Associates Inc.
• FDIC/OCC/Federal Reserve Liquidity Definition:
– The capacity to readily meet cash and collateral
obligations at a reasonable cost.
– Maintaining Adequate levels depends on the institution’s
ability to meet expected and unexpected cash flow and
collateral needs without adversely affecting daily
operations or financial performance
– Sources
• Assets readily convertible to cash
• Net operating cash flows
• Ability to acquire funding through
– Deposits
– Borrowings
– Capital Injections
7
Liquidity Defined

© 2015 FARIN & Associates Inc.
• Mismatch Risk
– Insufficient cash to meet obligations in normal course
• Market Liquidity Risk
– Market constraints will affect the conversion of assets
into cash
• Contingent Liquidity Risk
– Risk from unexpected events
8
Types of Liquidity Risk

© 2015 FARIN & Associates Inc.
• Sources of Liquidity Risk :
– Funding Mismatches
• Not enough funding to meet withdrawal needs
– Market constraints on ability to convert assets into cash
or inability to access sources of funds (market illiquidity)
– Contingent Liability Events
• Line of Credit Usage
• Loan commitments
– Changes in Economic Conditions
– Exposure to credit, market, operational, legal, and
reputation risks
9
Liquidity Risk

© 2015 FARIN & Associates Inc.
Financial Institutions Risk Management
Financial & Business Risk Management
Financial Risks
Liquidity Risk
Maturity Mismatch
Asset/Liability Imbalance
Cash Flow
Credit Risk
Default
Downgrade
Counterparty
Interest Rate Risk
Commodity Prices
Equity Prices
Interest Rate Changes
Business Risks
Management Risks
Strategic Risk
Operational Risks
People Risks
Legal Risks
System Risks
External Risks
10

© 2015 FARIN & Associates Inc.
Financial Institutions Risk Management
• Prior Diagram Indicates “Silos” of Risk
– Liquidity Is Managed and Measured separate from Credit, Interest
Rate, etc.
• Reality is that the risks are interrelated
– Liquidity Risk may cause market and credit risk
– Credit and interest rate risk can cause liquidity risk
• In addition to cross risk measures within an area,
institutions must consider cross area risks
– How do staff relationships impact financial performance?
• Reputation risk?
• Legal risks?
– How are Business Risks related to Financial and Operational
Risks?
11

© 2015 FARIN & Associates Inc.
Factors Effecting Liquidity Risk
Internal Factors
• High levels of off balance
sheet exposure
• Heavy reliance on corporate,
brokered or wholesale funding
• Maturity mismatches
• Rapid asset growth in excess
of deposits
• Short term deposit
concentrations
• Lack of unencumbered,
marketable securities
External Factors
• Highly sensitive depositors
• Fragile financial markets
• Low economic performance
• Lack of trust in banking sector
12

© 2015 FARIN & Associates Inc.
Liquidity Risk Management
• Maintaining balance between
available sources vs. needs while
meeting capital planning goals for:
– Earnings
– Growth
– Capital
• Expected & potential scenarios
• Effective liquidity management
helps produce maximum levels of
earnings
– by investing excess funds
– While maintaining sufficient flows
and sources of funds
13

© 2015 FARIN & Associates Inc.
• Examination Consideration:
– Access to funding sources
– Overall Cost of Funds
– Undue reliance on wholesale or market based funding
(brokered CDs)
– Contingency Plan
• So, we now have the premise and scope of the
examination process, what do we need to do?
14
Liquidity Examination
© 2015 FARIN & Associates Inc.
Recent Regulatory Excerpt
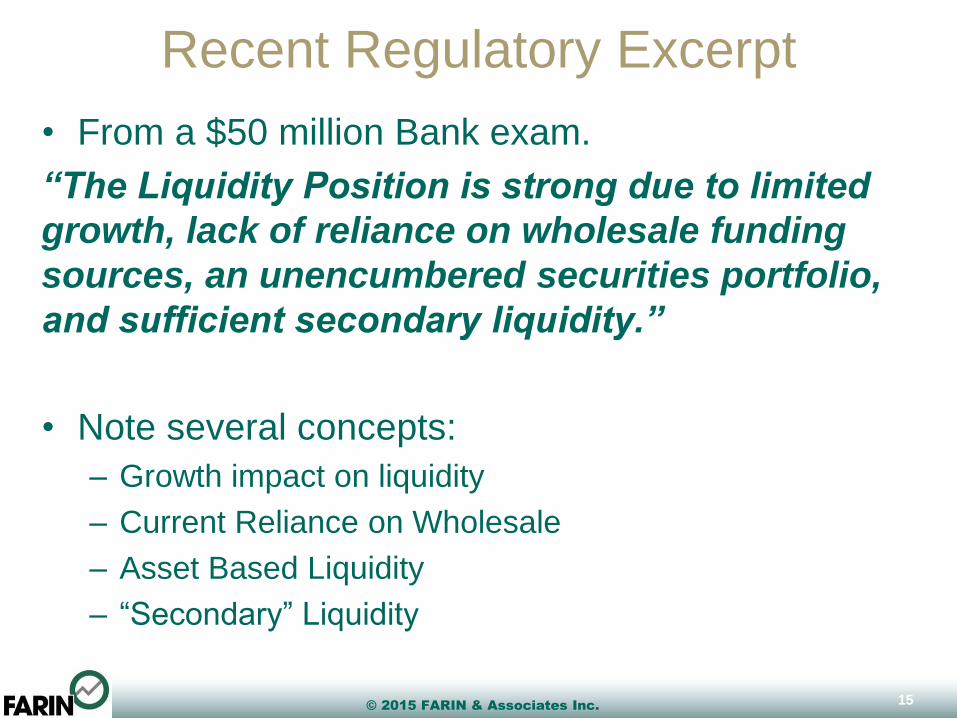
• From a $50 million Bank exam.
“The Liquidity Position is strong due to limited
growth, lack of reliance on wholesale funding
sources, an unencumbered securities portfolio,
and sufficient secondary liquidity.”
• Note several concepts:
– Growth impact on liquidity
– Current Reliance on Wholesale
– Asset Based Liquidity
– “Secondary” Liquidity
15

© 2015 FARIN & Associates Inc.
Recent Regulatory Excerpt
• From a $100 million Bank exam.
“On-balance sheet liquidity has declined due to
recent deposit withdrawals. Cash equivalents
declined from 17.29% of total assets to 13.36%
which is comparable to peer levels. The bank
does not have a securities portfolio to serve as a
secondary source of liquidity which has resulted
in a ratio of loans to deposits of 103% compared
to the peer median of 70.17%”
• This bank received a downgrade to a 2 rating
16

© 2015 FARIN & Associates Inc.
Recent Regulatory Initiatives
• 2010 - “Interagency Policy Statement –
Funding and Liquidity Risk Management”
– Issued 4/5/10 – FRB, OCC, FDIC, OTS, NCUA
Liquidity Requirements
• More asset based liquidity (cash & securities)
– No guidance on how much is enough!
– Why: It is the only form of liquidity you can absolutely count
on being there during a liquidity stress event
• Less reliance on wholesale funding for core growth
– What is your core funding plan?
– Where will you raise the funding needed to:
• Increase investments?
• Reduce non-core funding?
17

© 2015 FARIN & Associates Inc.
Impact of 2010 Liquidity Guidance
Liquidity Requirements
• Cash Flow Based Liquidity Measurement
– How do we to integrate with IRR measurements
• Stress Tests
– Like Rate Shocks in IRR?
– What kinds of stress tests do we have to run?
• Adverse and Severely Adverse scenarios
– How frequently do we run them?
18

© 2015 FARIN & Associates Inc.
Historical Measures of Liquidity
• Measurements Based on Balance Sheet Levels
– Static Measurements
– Historically Based
• Examples:
– Short Term Assets / Short Term Liabilities
• Measures coverage of possible loss of funding with assets
– Volatile Funds Ratio
– Borrowings / Total Assets
• Measures the level of non-market funding sources used to build the
balances sheet
• Total Loans / Total Assets
– Basic Surplus Ratio
• All Sources minus Uses within 30 days / Total Assets
• Target Ratio = 3-5% minimum
19

© 2015 FARIN & Associates Inc.
UBPR/FPR RatiosBank UBPR Ratios
• Net Non-Core funding ratio
• Loans/Assets
• Projection of Net Cash Flows
Credit Union FPR Ratios
• Net Long-term assets/Total Assets
• Total Loans / Total Shares
• Cash & ST Investments / Total Assets
• Total Shares, Deposits & Borrowings / Earning Assets
• Regular Shares & Share Drafts / Total Shares &
Borrowings
• Borrowings / Total Shares & Net Worth
20

© 2015 FARIN & Associates Inc.
Regulatory Ratio Definitions
• Net Non-Core Funding Ratio: Measures the extent
to which the bank if funding longer term assets (>
1 Yr.) with volatile funds.
– non-core liabilities, less short-term investments divided
by long-term assets
– Non-core funding is funding that can be very sensitive to
changes in interest rates such as brokered deposits,
CDs greater than $100,000, and borrowed money
• Loan/Assets: Measures the extent to which the
bank is likely to have liquidity
– Higher Loan/Asset ratios reduces liquidity levels
– Lower Loan/Asset ratios impacts earnings & capital
21

© 2015 FARIN & Associates Inc.
Regulatory Ratio Definitions
• Long term assets / Total Assets: Measures the
level of long term assets that are less liquid
– sum of real estate loans which will not refinance, reprice
or mature within 5 years, member business loans,
investments with remaining maturities of more than 3
years, NCUSIF deposit, land and building, and other
fixed assets divided by total assets.
• Loan/Share – Measures extent to which the CU is
relying on capital or borrowings to make loans
which are less liquid
• Cash & ST Investments /Total Assets: Measures
available short-term liquidity levels
22

© 2015 FARIN & Associates Inc.
Regulatory Ratio Definitions
• Total Shares, Deposits & Borrowings / Earning
Assets: This really measures the efficiency of use
of funding to generate earnings
– If it’s not in a loan or an investment, where is it? Are
buildings and fixed assets liquid?
• Regular Shares & Share Drafts / Total Shares &
Borrowings: Measures the level of “core” type
funding that is considered less volatile
– Really more of an ALM ratio than liquidity
– Higher levels are less volatile, requiring lower liquid
assets
23

© 2015 FARIN & Associates Inc.
Regulatory Ratio Definitions
• Borrowings / Total Shares & Net Worth: Measures
the reliance on non-member funding.
– Higher reliance posed liquidity concerns as the sources
may be unreliable
24

© 2015 FARIN & Associates Inc.
Trigger Ratios
• Definition – Ratios or events being monitored to
assess trends in performance
– UBPR or FPR Ratios
• Used as early warning indicators
• Allows for historical liquidity or call report ratios in
policy without them becoming primary measures.
• They are NOT policy limits
25

© 2015 FARIN & Associates Inc.
Liquidity Definitions vs. Ratios
• Definition: The capacity to readily meet cash and
collateral obligations at a reasonable cost.
• What is missing from all these UBPR/FPR Ratios
and Examination Review?
26

© 2015 FARIN & Associates Inc.
Triggers vs. Limits
• Triggers (Monitoring Ratios) Can be set to
watch for different possible changes to future
liquidity.
– Maturity Mismatch is an indicator of potential risk.
• Measurement of “maturity mismatch” can be an
early warning indicator of possible risks
– A/L Imbalance
• Measure of asset/liability mix vs. goals gives an
easy measure of possible problems
– Cash Flow projections tells more complete story
on potential needs
• Common for monthly ratios to be set on
individual risk components with quarterly
overall limit tests
27

© 2015 FARIN & Associates Inc.
Basic Liquidity Trap
• General Rule:
– The more liquid as asset or liability, the lower the rate
earned or paid
• Regulatory Pressure
– Increased levels of liquid assets
– Lower levels of volatile liabilities
• Large deposits, Brokered CDs
• Impact
– More liquid assets = lower yield on assets
• Downward Pressure on Earnings
– Less Volatile Liabilities = More Core Funding
• How do we raise more core funding?
28

© 2015 FARIN & Associates Inc.
Liquidity Regulations
Asset Side Liquidity Focus
• Excessive holding of asset classes
• Regulations to hold minimum
amount of liquid assets– Cash & deposits in central banks
– Short-term high quality government
bonds
• Losses of asset values, in turn,
depletes bank’s capital
• Market dislocations
Liability Side Liquidity Focus
• Dependency on volatile source of
funds– Uninsured deposits, brokered deposits
– Short-term wholesale borrowings
• Regulations require stable funding– Retail deposits protected by deposit
insurance
– Medium & long-term borrowings
– Capital
• Inability to raise new deposits
29

© 2015 FARIN & Associates Inc.
Minimizing Cost of Liquidity
• Goal of Liquidity Management:
– Ensure sufficient available funds at the lowest possible
cost.
• Requirements of Liquidity Risk Management
Program
– Set objectives around funding costs, funding
concentrations, and other financial ratios
– Establish Cash Flow Forecasting Model to measure
sources & uses in business plan
– Run Scenarios on various funding source cost/benefit
30

© 2015 FARIN & Associates Inc.
Liquidity Sources & Uses
• Asset Sources
– Cash and Cash Equivalents
– Securities or Loans available
for sale
– Maturing Loans & Securities
– Loan & Security repayments
• Liability Sources
– New Deposit Growth
– Borrowing Sources
• Asset Uses
– Loan Originations
– Investment Purchases
– Fixed Asset Purchases
– Draws on Lines of Credit
• Liability Uses
– Deposit Outflows
– Maturing Borrowings
31
Note: Majority of Sources and Uses are based on Cash Flows associated
with assets & liabilities

© 2015 FARIN & Associates Inc.
Major Cash Flow Assumptions
• Option Risk:
– The risk that the expected cash flows change due to
contract options
• Call Options
• Put Options
• Prepayment Options
• Bump Rate CD/Early Withdrawal Options
– Changes in Cash Flows Impact
• Liquidity Levels
• Income Levels
• Potentially Credit Risk Levels
– Lower repayment of loans an indicator of credit problems?
32

© 2015 FARIN & Associates Inc.
Major Cash Flow Assumptions
• Prepayment Speeds on Loans & Securities
– Determining Prepayment Levels
• Schedule Contractual Repayments
• Observe Actual Repayments
• Subtract Actual from Scheduled to arrive at prepayment $
• Convert to annual % prepayment by dividing by average
balance
• Compare to National Prepayment speeds to develop factor
– Example:
• National Bloomberg Prepayment Speeds = 12% CPR
• Calculated Speeds = 8% CPR
• Factor for ALM Model = Bloomberg speeds * 67%
– Use Bloomberg speeds for all changing rates
33

© 2015 FARIN & Associates Inc.
Liquidity Definitions
• Asset Based or Core Liquidity: Cash and other
financial assets that can be easily converted to
cash for operational needs
– Withdrawals
– Originations
• Total (Cash Flow Based) Liquidity : Does your
projection maintain sufficient sources to meet
financial obligations: withdrawals, loan demands
and other commitments.
– To what extent is liquidity changing level and/or form
– Should include measures of debt or borrowing
capacity.
34

© 2015 FARIN & Associates Inc.
Sound Liquidity Practices
• A Comprehensive method for cash flow
forecasting
• Reasonable and appropriate assumptions
• Integrated management information & reporting
system
• Customized reports
• Stress testing
• Ongoing monitoring
• Contingency funding plans
35

© 2015 FARIN & Associates Inc.
MEASURING ASSET BASED
LIQUIDITY
A Practical Approach to Liquidity
36
© 2015 FARIN & Associates Inc.
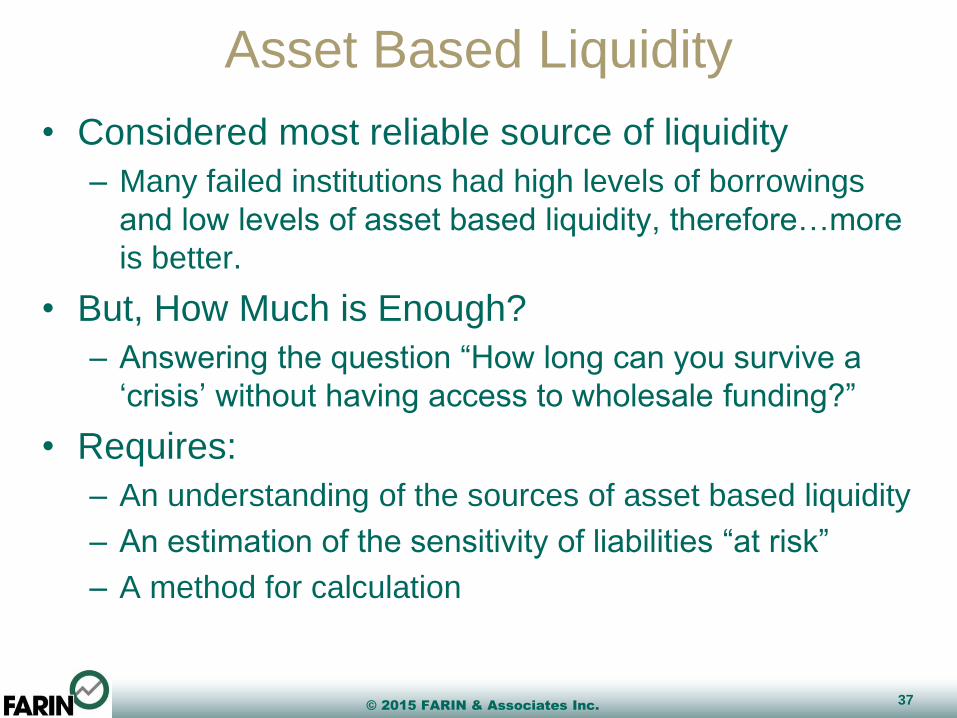
Asset Based Liquidity
• Considered most reliable source of liquidity
– Many failed institutions had high levels of borrowings
and low levels of asset based liquidity, therefore…more
is better.
• But, How Much is Enough?
– Answering the question “How long can you survive a
‘crisis’ without having access to wholesale funding?”
• Requires:
– An understanding of the sources of asset based liquidity
– An estimation of the sensitivity of liabilities “at risk”
– A method for calculation
37

© 2015 FARIN & Associates Inc.
Calculating Asset Based Liquidity
• Sources of Asset Based Liquidity
– Cash & Cash Equivalents (FF, MMA, etc.)
– Unpledged Securities (at market value or deeper discounts)
– Scheduled Investment cash flows and maturities
– Scheduled Loan cash flows and maturities
• Uses that you have to cover
– Firm Loan commitments
– Maturing Borrowings/Non-Core funding
– Maturing CDs
– Some amount of Non-maturity balances considered “at risk”
– Potential draw down on lines of credit
38

© 2015 FARIN & Associates Inc.
Basic Surplus
• Long time measure of 30 day need
39

© 2015 FARIN & Associates Inc.
Basic Surplus
• Add to the basic measure in step 2 – FHLB
availability
40

© 2015 FARIN & Associates Inc.
Basic Surplus
• Add in other non-core funding sources in Step 3
41

© 2015 FARIN & Associates Inc.
Basic Surplus
Advantages
• Easy measure of real
sources
• Quantifies level of sources
by type
• Provides a measure
consistent with policy
control limits
Disadvantages
• Usually used on historical
balance sheet
• Ignores primary source of
most community FI
liquidity
– Loan Repayments!
• Ignores Off Balance Sheet
Risks
– Lines of Credit
– Firm Commitments to
Originate
42
Compare Basic Surplus to New Liquidity Coverage Ratio

© 2015 FARIN & Associates Inc.
Asset Based Liquidity: LCR Ratio
• Basel Liquidity Coverage Ratio (LCR)
– Test – Can you survive a 30 day stress event with assets only?
– Numerator
• Cash & Due From
• Highly Liquid Unencumbered Marketable Securities
– Denominator
• Projected Deposit Runoff
• Loss of all Non-Core Funding renewing in time horizon
• Projected Increased Line Draw Downs
• Less Cash Inflows from loans (& securities?) - Limited amounts
included
– Note that this is the first Liquidity rate to consider loan
cash flows as a source!
43

© 2015 FARIN & Associates Inc.
Deposit Definitions – Stable/Less Stable
• Basel Says…Stable is
– Fully insured
– Meaningful business
relationship
– Applies to retail, small
business, large business
– Penalties adequate on CDs
– just count 30 day
maturities
– Penalties inadequate –
count all the balances
• Less Stable
– Deposits not meeting the
above definition
• Bank Regulators (Likely)
– Fully Insured – Call Reports
– Internal systems?
– Not sure how bank
regulators will deal with
penalty issue
44

© 2015 FARIN & Associates Inc.
Liquidity Coverage RatioNumerator (Basel Approach)
45
Available liquid assets in 30 days
We would add stressed cash flows coming off
loans and non-highly liquid securities.

© 2015 FARIN & Associates Inc.
Liquidity Coverage RatioFunding Outflows – Denominator
46
Sum of Outflows = Potential 30 day liquidity needs

© 2015 FARIN & Associates Inc.
Liquidity Coverage RatioNet Loan Outflows
47

© 2015 FARIN & Associates Inc.
Liquidity Coverage Ratio
48
Available
Needs
FARIN Suggested LCR Changes:
• Move Loan Cash Flows to the Numerator to track all Sources together
• Establish consistency on deposit outflow assumptions with core deposit study
info used in IRR Calculations
• Remove limit on amount of total loan flows counted (Move to numerator
eliminates negative denominator)
• Remove prepayment limitation assumptions on loan flows
• Consider calculating how much runoff would be necessary to “fail” assuming
sources are solid.

© 2015 FARIN & Associates Inc.
LCR Concept - Numerator
• Level 1 assets (0%
haircut)
– Generally Basel 1 0% risk
weight assets
– Broad stable markets
– Full government
guarantees
– Can be repo’d
– Everyone accepts as
collateral
• Level 2 Assets (15%
haircut)
– Generally Basel 1 20% risk
weight assets, but there
are exceptions
– Broad stable markets
markets
– Lack full government
guarantees
– Can be repo’d
– Everyone accepts as
collateral
• Non-Qualifying
– Everything else
49
Note that we work with market value rather than book value of assets.

© 2015 FARIN & Associates Inc.
Net Stable Funding Ratio
• Ratio Introduced in
Original Basel III Proposal
• Designed to look at 1 Year
Potential Funding Needs
– Numerator – stable funding
– Denominator – assets
needing stable funding
– Guideline - >=100%
• Not planned to phase-in
until 2019
• Why we choose not
incorporate into Liquidity
Calculations
– Static ratio
– Lots of clarification needed
– Late phase-in
– Unsure how US regulators
will interpret
• Adopting internal sources
and uses provides more
meaningful measurement
50
Regulatory Attempt at Sources & Uses – But Static!

© 2015 FARIN & Associates Inc.
Net Stable Funding Ratio
• Compares
Available
Liquidity Sources
• To Known
maturities & loan
renewal/payoffs
• Plus OBS
exposures
51

© 2015 FARIN & Associates Inc.
Net Stable Funding Ratio
Example shows institution short $34 million
• Options for Correcting?
– Lower reliance on assets with higher funding needs
• Fixed assets require $1 for every $1
• How fast can this be changed?
– Lower off balance sheet exposures
• Firm commitments
• Reduce outstanding lines of credit
– Change mix in deposit funding or terms or both
• High concentration of brokered deposits < 1 Yr which are not
given full credit
– Rely on Wholesale Funding
52

© 2015 FARIN & Associates Inc.
Net Stable Funding Ratio
Advantages
• Can be easily captured
from call report data
– Requires minimal new
changes
• Eliminates Assumption
Risk from Analysis
Disadvantages
• Removes all unused
wholesale sourcing from
calculation
• Not Effective in Examining
the Cost/Benefit of various
alternative strategies
– Rewards long-term
borrowing position without
regard to cost
53

© 2015 FARIN & Associates Inc.
OCC Liquid Assets – OCC Handbook
54

© 2015 FARIN & Associates Inc.
US Treasuries
55
Liquidity/Yield Relationship
Basel Criteria other than risk weight
Our judgment based on above criteria
We added as they are likely to be
additional US Regulatory factors
Nothing controversial about this security – clearly a Level 1, only potential issue
is adjustment for long-term Treasuries because of interest rate risk

© 2015 FARIN & Associates Inc.
Federal Reserve EBA
56
No controversy here, clearly a Level 1

© 2015 FARIN & Associates Inc.
Fed Funds Sold
57
We placed in level 2 if unsecured …

© 2015 FARIN & Associates Inc.
GSE Bullets
58
Under Basel definitions, this is a Level 2. Given 80% of US bank federal government
securities are GSAs, how will bank regulators treat? Other issue is interest rate risk
in long-term bullets.

© 2015 FARIN & Associates Inc.
Money Market Instruments
59
Under Basel definitions, this is a Level 2. Given 80% of US bank federal government
securities are GSAs, how will bank regulators treat?

© 2015 FARIN & Associates Inc.
Callable Agencies
60
Under Basel definitions, this is a Level 2. Given 80% of US bank federal government
securities are GSAs, how will bank regulators treat? Other issue is interest rate risk in
long-term bullets and option risk associated with call options.

© 2015 FARIN & Associates Inc.
Agency Asset-Backed
61
Under Basel definitions, this is a Level 2. Given 80% of US bank federal government
securities are GSAs, how will bank regulators treat? Other issue is interest rate risk
and option risk associated with prepayment options.

© 2015 FARIN & Associates Inc.
Agency Mortgage Obligations
62
Under Basel definitions, this is a Level 2. Given 80% of US bank federal government
securities are GSAs, how will bank regulators treat? Other issue is interest rate risk
and option risk associated with prepayment options and the structure of the classes.

© 2015 FARIN & Associates Inc.
Corporate Bonds
63
If credit grade is AA- or higher, qualifies as level 2 under Basel in spite of 100% risk
weight. Additional issue is interest rate risk on ling-term, and option risk if they
are callable.

© 2015 FARIN & Associates Inc.
Commercial Paper
64
Appears to meet Basel Level 2 tests in spite of 100% risk weight.

© 2015 FARIN & Associates Inc.
Bank Issued CDs
65
Will be controversial
• On one hand they are fully secured.
• On the other hand they generally are not accepted as collateral or in repo transactions
• We’re betting they won’t make the Level 2 cut – we could be wrong

© 2015 FARIN & Associates Inc.
Municipal Bonds
66
Not really dealt with by Basel. We applied same criteria as with corporate
bonds. Troubled market right now. Additional issues are potential interest
rate risk and option risk.

© 2015 FARIN & Associates Inc.
Revenue Bonds
67
Not really dealt with by Basel. We applied same criteria as with corporate
bonds. Troubled market right now. Additional issues are potential interest
rate risk and option risk. Could have more credit risk than general obligation bonds.

© 2015 FARIN & Associates Inc.
Asset-Backed Securities
68
Nobody’s favorite security now. Very unlikely to make the level 2 cut.

© 2015 FARIN & Associates Inc.
MEASURING CASH FLOW
BASED LIQUIDITY
A Practical Approach to Liquidity
69

© 2015 FARIN & Associates Inc.
Liquidity Gap Report
• Pro forma cash flow analysis:
– Projected sources and uses of funds over various scenarios
• Like rate movements or what-if plans
– Show exposures to variables and report to board and establish
contingencies
• What sources change and why (optionality, credit risk, performance
risk)
• What uses change and why (loan demand, potential deposit outflow,
etc.)
– Assumptions should be reasonable and appropriate.
– Institutions with reliance on securitization and sale for cash should
consider impact of conditions that may effect availability of funds.
70

© 2015 FARIN & Associates Inc.
Liquidity Gap Report
• Liquidity Gap Report
– Summary of Cash Flow sources and uses impact on
liquidity
• Use a forecast (Plan) for growth assumptions
• Use starting cash flows to project inflows and outflows
– Allows for Assessment of Contingency Funding Plan
Stress Tests to Determine Liquidity needs
• Impact of missing deposit growth by 10%
• What if loan repayments accelerate or slow?
• What happens to total ratio if access to key funding sources is
gone?
– Brokered CDs
– FHLB
71

© 2015 FARIN & Associates Inc.
Asset Sources/Uses
72
First two of forecast show
• Assets are a net drain of funds in years 1 & 2: $25.7 million
• Investments are providing sources of funds to fund loan growth
•$3.8 million over 2 years
• Loans using $29 million in funding by end of Yr. 2

© 2015 FARIN & Associates Inc.
Liability Sources/Uses
73
• Non-maturity funding providing $2.7 million over 2 years
• CDs expected to provide $6.9 million.
• Equity growth from earnings also contributing (not shown)
• Remainder is “borrowed” by model. Sources MUST = USES

© 2015 FARIN & Associates Inc.
Sources/Uses Summary
74
Sec 1
Sec 2
Sec 3
Section 1 – Net Cash flow sources/uses – Removing balancing accounts.
Section 2 – Adds in asset and liability adjustments
Section 3 – Recalculates Gap with adjustments and buffers
© 2015 FARIN & Associates Inc.
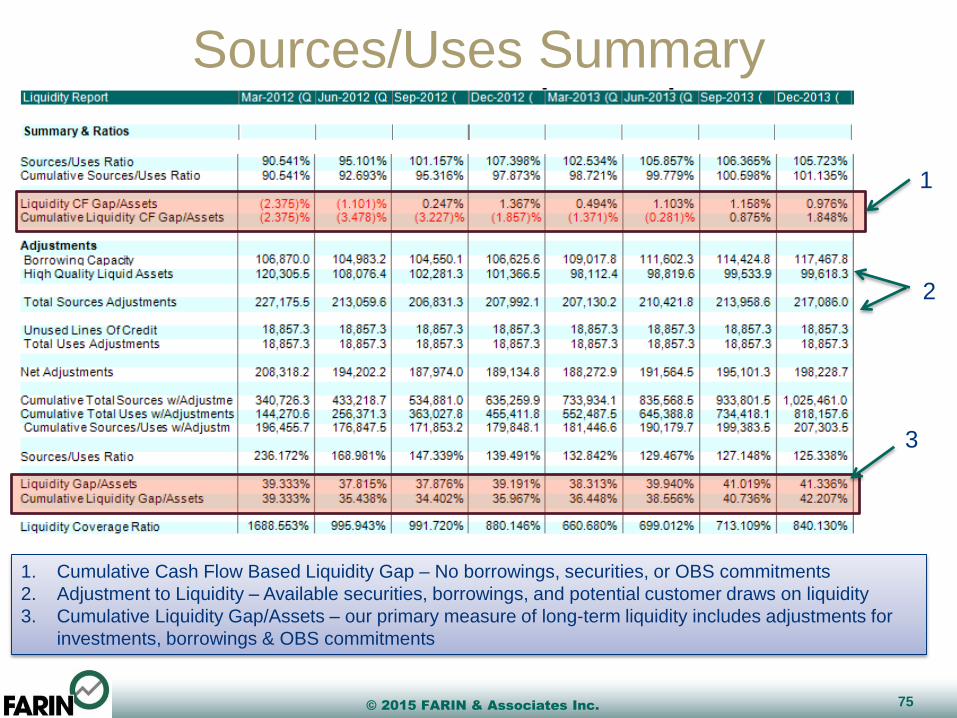
Sources/Uses Summary
75
1
2
3
1. Cumulative Cash Flow Based Liquidity Gap – No borrowings, securities, or OBS commitments
2. Adjustment to Liquidity – Available securities, borrowings, and potential customer draws on liquidity
3. Cumulative Liquidity Gap/Assets – our primary measure of long-term liquidity includes adjustments for
investments, borrowings & OBS commitments

© 2015 FARIN & Associates Inc.
Sources/Uses Summary
76
•Test passed because of wholesale and investments
available for liquidity, NOT CASH FLOW.
•Determining Adequacy of limits by applying realistic
stress tests and deciding how low you can go.

© 2015 FARIN & Associates Inc.
Using Liquidity Gap
• Advantages
– Dynamic measure derived
from business plan
– Considers sources and uses
of funds
– Gap between sources and
uses is liquidity buffer
– Buffer includes cash flow
mismatch, asset based
buffer (LCR), and liability
based buffer (unused
borrowing capacity)
– Liquidity gap/assets can be
used as control ratio
– Can be stress tested
• Recommendation
– Primary long-term measure
of liquidity in policy
statement
– Limits set on pre- and post-
stress ratios
77

© 2015 FARIN & Associates Inc.
Putting this to Work
• Review your existing Liquidity Management
Process
– Are you measuring triggers or real ratios?
– What Asset-Based Measures are you using?
– Do you run a cash flow based measure?
• Develop Your Revised Reports to Integrate with
ALCO Reporting
– Do you measure forward-looking ratios or only
historical?
• Develop Trends in Performance and compare to
projections….
78

© 2015 FARIN & Associates Inc.
How We Can Help
79
www.farin.com