Embed Size (px)
Citation preview

Measuring Ag-specific immuneresponses: understandingimmunopathogenesis and improvingdiagnostics in infectious disease,autoimmunity and cancerFlorian Kern1, Giuseppina LiPira2, Jan W. Gratama3, Fabrizio Manca2 and
Mario Roederer4
1Institut fur Medizinische Immunologie, Charite – Universitatsmedizin Berlin, Campus Mitte, 10098 Berlin, Germany2Laboratory of Clinical and Experimental Immunology, G. Gaslini Institute, 16148 Genoa, Italy3Laboratory for Clinical and Tumor Immunology, Department of Medical Oncology, Erasmus MC – Daniel den Hoed, 3075 EA,
Rotterdam, the Netherlands4Vaccine Research Center, NIAID, NIH, Bethesda, MD 20892-3015, USA
Characterization of antigen-specific immune responses
at the single-cell level has been made possible by recent
advancements in reagent and technology development,
combinedwith increasing knowledge ofmolecular mech-
anisms. Fluorescently labelled MHC–peptide multimers
and antigens identify directly specific T and B cells,
respectively, whereas dynamic assays exploit mediator
production or secretion, or the changes in surface expres-
sion of other proteins, to identify specific lymphocytes –
some techniques enabling the recovery of viable cells.
Meanwhile, multiparameter flow cytometry has emerged
as the most versatile platform for integrating most of
these methods. As the complexity of experimental data
increases, so does the level of technical sophistication
required for analysis and interpretation, both in terms of
basic research and modern medicine, with new appli-
cations for infectious diseases, autoimmunity and cancer.
Introduction
Cellular immune responses have an important role innumerous conditions, including infection, malignancy,autoimmune disease and transplantation. Recent tech-nologies for the identification, enumeration and charac-terization of antigen (Ag)-specific lymphocytes have greatpotential, not only for basic research but also for under-standing disease pathogenesis and the application tomedicine. The long-used bulk assays applied to quantifyAg-specific immune functions are now being replaced byfar more informative single-cell assays. Apart from thegreat potential for analyzing vaccine efficacy, these assaysprovide unprecedented detail about disease progression orremission, and the effects of therapeutic interventions.The complex technology used for single-cell assays can
Corresponding author: Kern, F. ([email protected]).Available online 20 July 2005
www.sciencedirect.com 1471-4906/$ - see front matter Q 2005 Elsevier Ltd. All rights reserved
address a wide array of issues, including Ag processingand presentation, epitope definition, subset differen-tiation, activation markers and effector functions. Thisreview describes the state-of-the art for this field, both interms of technology and application, as covered in thecurrent literature and during the first conference on themeasurement of Ag-specific immune responses (MASIR;www.masir.org), which was held in Courmayeur (Italy) inJanuary 2005.
From tuberculin skin test to peptide–MHC multimer
studies
The following section highlights the most importanttechnical developments in the area of antigen-specificlymphocyte detection over the last 20 years.
Principles of Ag-specific assays: evolution from bulk to
single cell
The first assay to measure cellular immunity was thetuberculin skin test (TST) a century ago, however, itsbiological significance was only understood when T cellsand their functions became known [1]. Failure to respondto TST or similar skin tests might originate both in theafferent or efferent arms of the underlying immuneresponse, involving Ag delivery, uptake, transport andpresentation, and T-cell activation, proliferation, migra-tion and effector function.
The first assays to measure Ag-specific immuneresponses were those studying proliferation by measuringthe incorporation of 3H-thymidine into the DNA ofproliferating cells [2]. This method is still in use andlends itself well to large-scale screening.
The first T-cell effector function to be tested in vitrowascytotoxicity, by labelling ‘target’ cells with 51Cr, incubatingthem with cytolytic ‘effector’ cells and measuring the
Review TRENDS in Immunology Vol.26 No.9 September 2005
. doi:10.1016/j.it.2005.07.005
Review TRENDS in Immunology Vol.26 No.9 September 2005478
release of radioactivity [3]. In many laboratories, thisassay is still the gold standard for measuring cytotoxicT-lymphocyte (CTL) function, although the use of non-radioactive labelling dyes is a viable alternative [4].In vivo CTL assays can be performed in laboratoryanimals by infusing peptide-pulsed and unpulsed targetcells (identifiable by different intensity fluorochromelabelling) into immunized and non-immunized animals.After the incubation period, specific killing can be deter-mined by analysing tissue samples in immunized andnon-immunized animals with regard to the ratio ofpulsed:unpulsed target cells [5].
Another way to measure cellular activation is throughthe quantification of secreted mediators (e.g. cytokines)by specific ligand assays (e.g. ELISA). Importantly, thenumber or type of effector cells in these assays is notknown: only the outcome of cellular activation is measured.They can be referred to as ‘bulk’ assays.
The ELISpot technology marked the transition frombulk to single-cell assays because it enables the enume-ration of mediator-secreting cells [6]. Using ELISpot,areas (‘spots’) of specific mediator secretion (‘footprints’ ofAg-activated lymphocytes) in a well are detected by aligand assay.
A more recent method, often referred to as intracellularcytokine staining (ICS), can ‘visualize’ secreted mediatorsin Ag-activated cells directly. Short ex vivo stimulationinduces T cells to produce a variety of mediators. Becauseof secretion inhibition, fixation and permeabilization ofcells, these can be detected intracellularly by specific,fluorochrome-labelled antibodies [7]. This assay, whichidentifies Ag-specific T cells in a multiparametric fashion[8], revolutionized Ag-specific immunology.
More recent assays combine single-cell detection withlive-cell recovery. The cytokine capture assay, for example,permits the detection, analysis and isolation of viablecytokine-secreting T cells. While a bi-specific antibodybinds CD45 on the leukocyte surface and catches thesecreted cytokine, a second phycoerythrin (PE)-conju-gated antibody identifies the ‘trapped’ cytokine. Anti-PEantibody coated paramagnetic microbeads can be used toenrich these cells in a magnetic column for furtherexperimentation [9].
A variation of this technology, selective for tumournecrosis factor-a (TNF-a), takes advantage of the uniquesecretion pathway of this cytokine: an inhibitor of theTNF-a-converting enzyme (TACE) prevents shedding ofnewly synthesized and surface expressed TNF-a, whichcan thus be detected without permeabilization [10,11].
Two very recent assays measure CD4 or CD8 T-cellfunctions, which broadly correlate with helper andcytotoxic activities, respectively, rather than cytokines orother mediators.
Upon helper cell activation, de novo synthesized CD154is expressed transiently on the cell surface, where itactivates Ag-presenting cells (APCs) through CD40. Anti-CD154 antibodies present during stimulation bind to,and are internalized with, the receptor [12]; alternatively,antibodies blocking the CD154–CD40 interaction can beincluded to inhibit signal-induced CD154 internalization,thus enabling its staining on the surface [13].
www.sciencedirect.com
For cytotoxicity, a similar assay measures the mobiliz-ation of CD107a/b to the cell surface [14]. When thecytolytic cell is stimulated to release perforin or granzyme,the granule-associated integral membrane proteins,CD107a/b, are exposed transiently on the cell surface. Atthis time, fluorescent anti-CD107a/b antibodies present inthe culture media will bind and be internalized, thusidentifying cells that have degranulated. Note that,although cytolytic activity is dependent on degranulation,such that CD107 mobilization can correlate highly withcytolytic activity [15], not all degranulating cells arecytolytic [16]. It is a particular advantage that boththe CD154 and the CD107a/b assays can be used toidentify and isolate viable cells that have a broadfunctional spectrum.
The analysis of cellular proliferation has been revolu-tionized by the advent of single-cell assays that permit thetracking of cell divisions. Instead of 3H-thymidine, cellscan, for example, be labelled with bromo-deoxy-uridine(BrdU), which is also incorporated into the DNA ofdividing cells [17]. Alternatively, cellular proteins can belabelled with the non-toxic, fluorescein-related dye, car-boxyfluoroscein diacetate succinimidyl ester (CFDA-SE,or CFSE in its intracellular, reduced form). On Ag acti-vation, proliferating cells can thus be detected by eitherincreased fluorescence (BrdU) or loss of staining as aresult of equal division of stained proteins betweendaughter cells at each mitosis (CFSE) [18]. BrdU canalso be used in pulse-chase experiments to follow in vivodivision and measure cellular turnover [19,20].
Finally, MHC–peptidemultimers are a class of reagentsthat can bind directly to the Ag receptor of the cognateepitope-specific Tcell. Unlike the assays listed earlier, thisone is not dependent on any specific T-cell function, onlyon the ability of the T-cell receptor (TCR) to recognize thepeptide–MHC complex. To raise the avidity, such thatbinding is stable during the assay, multimerization isrequired. Formats for MHC I molecules include dimers(Ig scaffolding) [21], tetramers (biotinylated MHCcomplexes, streptavidin backbone) [22], streptamers(biotinylated MHC complexes, ‘strep-tactin’ backbone)[23], pentamers (MHC complexes multimerized by a self-assembling coil–coil domain) [24] and dextramers (MHCcomplexes attached to a dextran backbone). Unlike otherformats, streptamers can be dissociated by adding freebiotin to the assay, resulting in the dissociation of the nowmonomeric MHC–peptide complexes from the TCR [23];this might be an advantage for functional analyses fol-lowing cell isolation or adoptive transfer.
The advent of MHC II multimers was announced inthe late 1990s; however, only a limited number of thesereagents are available to date [25,26]. MHC II moleculesare heterodimers of a and b chains, which together formthe binding groove. This is why the production of thesereagents is much more difficult. However, studies usingMHC II tetramers carrying, for example, HIV, influenza ormelanoma peptides, have been reported [27–29]. Never-theless, class II allele distribution, epitope identificationand Ag-specific T-cell frequencies are still responsiblefor the gap in clinical applications of MHC II versusMHC I multimers.

Review TRENDS in Immunology Vol.26 No.9 September 2005 479
Of note, identification of Ag-specific B cells at thesingle-cell level was accomplished nearly 10 years beforethe development of MHC multimers. The first proof-of-principle study used the fluorescent protein phycoerythrinas an immunogen and subsequent tool to identify B cellsthat expressed phycoerythrin-specific surface Ig [30].Since then, others have used fluorochrome-conjugatedAgs to identify B cells specific for haptens [31], hen egglysozyme [32] and even peptides [33]. ELISpot-assayswere first developed to enumerate B cells and were usedto track B-cell memory development [34]. Most recently,Baumgarth reported the enumeration and characteriz-ation of influenza-specific B cells following infectiouschallenge in the mouse model [35]. These technologiesare of great interest because B-cell responses areconsidered paramount in the development of anynew vaccine.
The basic principles, advantages and disadvantagesof these assays are summarized in Table 1. Figure 1 showsa schematic of the Ag-specific immune response andexplains which sections are exploited in the variousassays described.
Use and combinations of methods
A comprehensive analysis of T-cell responses to Ags mustencompass a broad variety of parameters:
(i) The magnitude of the response: how many (or whatpercent of) memory T cells are specific for the Ag?
(ii) The breadth of the response: how many differentepitopes from a given Ag are recognized by the Tcells in anindividual?
(iii) The clonality of the response: how many differentT-cell clones (receptors) are generated for each epitope?
(iv) The effectiveness of the response: what is theavidity with which T cells recognize the epitopes?
Table 1. Flow cytometrya-based assays for T cells
Method Main features (time required) A
MHC–peptide multimers Probe for specific TCR (1 h) P
Anti-TCR-idiotype antibody Antibody-specific for the unique
TCR (1 h)
S
Surface activation markers Upregulation of, for example,
CD25, CD69 on Ag-activated cells
(5–18 h)
V
s
Intracytoplasmic cytokine
staining assay
Detection of secretion-inhibited
cytokine (or other mediator)-
producing cells (5–18 h)
In
(c
Cytokine capture assay Detection and isolation of
cytokine-secreting cells (5–18 h)
A
TACE-inhibition assay Stabilization of TNF-a at the cell
surface (5–18 h)
S
s
CD154 assay Stabilization of de novo
synthesized CD154 at the CD4
T-cell surface (5–18 h)
In
CD107 assay Staining of CD107a/b at the cell
surface during exocytosis
(5–18 h)
C
CFSE-dilution assay Equal division of dye between
daughter cells 3–7 days
R
tr
BrdU-incorporation assay Detection of BrdU incorporated
into DNA (3–7 days)
Id
aFlow-cytometry is the only platform that can combine the detection of Ag specific T
phenotypic markers, intracellular molecules (e.g. cytokines, enzymes, receptors), function
these parameters simultaneously is implied each time that flow cytometry is mentioned
www.sciencedirect.com
(v) Response mechanisms: what are the functions of theAg-specific T cells (e.g. proliferation, cytotoxicity and thecytokine and chemokine profile)?
Fortunately, many of the technologies listed earliermight be combined to correlate distinct functionalmeasure-ments (Table 2). Table 3 shows important technicalrequirements and specific features of these assays.
A complete description of the response of an individualto an Ag requires the determination of all of these para-meters.Forexample, in theevaluationofavaccine response,it is hypothesized that the best vaccines will induce: (i) thegreatest number of specific Tcells; (ii) responses to multipledifferent epitopes for the immunogen; (iii) a broad clonalityof response; (iv) a responsewith high functional avidity; and(v) a broad functional repertoire, including proliferation,cytotoxic activity and Th1 cytokine production. We expectthat ‘correlates of protection’ or ‘correlates of pathogenesis’will be determinedwithin the next 5–10 years and are likelyto arise from a subset of these variables.
Importantly, many of the methods listed earlier arecompatible with other technologies that provide differentinformation. For example, using flow cytometric sorting,Tcells that recognize specific peptide–MHC complexes canbe isolated for the purpose of gene-chip array analysis(to quantify the expression of genetic programs), todetermine the rate of viral infection, such as of Ag-specificCD4 T cells by HIV [36], or other biochemical character-izations. Notably, the assays that require fixation aretypically not compatible with RNA-based assays (genechips); for this purpose, viable cells must be isolated.
Applications
The most common applications include the definition ofT-cell specificities, that is, the determination of T-cell
dvantages Limitations
recise, accurate Availability of recombinant MHC
alleles; knowledge of epitopes
imple Impractical; only mouse data
available
iable assay, positive or negative
orting
No clear-cut definition of specific
cells
formation on cell functions
ytokine profile)
Cells non-viable
nalysis can precede purification Carry-over of irrelevant cells
imultaneous measurement of
ecreted mediators
Selection by TNF-a production
dependent of cytokine profile Not applicable to CD8 T cells
lose correlate of CTL activity Limited to degranulating cells
epeated cell divisions can be
acked
Limited to dividing cells
entification of proliferating cells Limited to dividing cells
cells with multi-parametric analysis of these cells. Such analysis might include
(degranulation) and proliferation. The unique advantage of being able to include all
here.
TRENDS in Immunology
*
*
**
Static assays Dynamic assays
2.0
20.0
200.0
BrdU
Time scale (hrs)T-cell repertoire
T cellT cell
lT cell
T cell
Anti-id AbMHC–peptide multimer
0.2
Proliferation
APC
CytokinesCapture assay
ELISA
ELIspot
ICS, TACE
Activation markers
CTL function, 51Cr
CTL function, CD107
Helper function
Helper function, CD154
3H-thym uptake
CFSE dilution
MHC multimer
Antigenic peptide
MHC–peptide multimer
MHC–peptide
Specific T cell
Activation markers
Secreted cytokines
Retained cytokines
CD8 CTL function
CD4 helper function
Single cell assays
Bulk assays
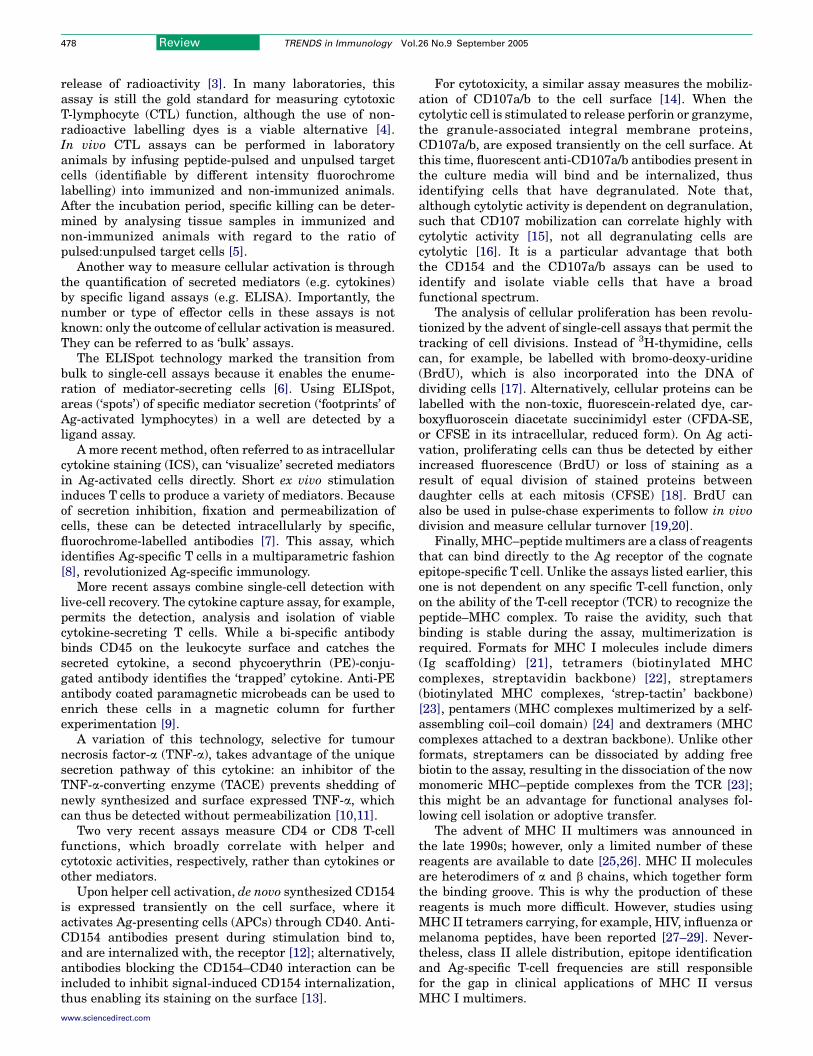
Figure 1. T-cell function assays (left) are defined as static because no cellular function is required for identification. They are based on reagents that directly and specifically
bind to the TCR on the relevant cell. Anti-idiotypic antibodies are clone-specific. Multimers, by contrast, often recognize several clones because different TCRs might
recognize the same MHC–peptide complex. Monoclonal antibodies for phenotyping can be used in static assays to characterize specific T cells. The readout functions of
dynamic assays (right) are T-cell functions. Early dynamic assays measure Ag-induced expression of activation markers (e.g. CD25, CD69), synthesis of cytokines, other
mediators or receptors or degranulation. Late dynamic assays estimate Ag-induced cell proliferation. Most assays can be used both for CD4 and CD8 T cells. Bulk assays can
be quantified as a ratio of the measured functions in either the presence or absence of Ag. Single-cell assays can be quantified as frequencies of Ag-responsive cells.
Table 2. T-cell assay compatibility matrix
MHC–multimer binding ICS Cytokine-capture assay CD154 CD107 TACE CFSE
ICS Yes
Cytokine-capture assay Yes No
CD154 Yes Yes Yes
CD107 Yes Yes Yes Yes
TACE Yes No Yes Yes Yes
CFSEa Yes Yes Yesa Yes Yes Yes
ELISpot No No No No No No No
Table 3. Specific assay requirements
Assay Cell preparationa Stimulation requirements Time (hrs) Recovery of
viable cellse
AgCAPC Co-stimulationb Golgi inhibitorsc Other reagentsd
Multimers WB, PBMCs Nf N N N 0 C
ICS WB, PBMCs Yf Of Y N 5–18 K
Cytokine capture WB, PBMCs Y O N N 5–18 C
CD154 PBMCs Y O N Y 5–18 C
CD107 PBMCs Y O Y Y 5–18 C
TACE WB, PBMCs Y O N Y 5–18 C
CFSE PBMCs Y O N N 72–144 C
ELISpot PBMCs Y O N N 5–18 KaWhole blood (WB) requires subsequent lysis. The PBMC number required for analytical assays ranges from 1 to 5!105 cells, depending on the expected frequency of
positive cells. For preparative assays, the PBMC number should be scaled up to 107–109.bCo-stimulation antibodies, usually CD28 and CD49d, are required typically for stimulation for (of) !12 h.cTypically, the Golgi inhibitors, such as Brefeldin A or Monensin, are used, whereas the TACE assay requires metalloproteinase inhibitors (MMPIs).dOther reagents needed during stimulation, for example, anti-CD107, anti-CD154 or anti-CD40.eIndicates whether live cells can be isolated based on the assay measurement.fY represents yes, N represents no and O represents optional.
Review TRENDS in Immunology Vol.26 No.9 September 2005480
www.sciencedirect.com

Review TRENDS in Immunology Vol.26 No.9 September 2005 481
epitopes and the analysis of the phenotypic differentiationand function of antigen-specific T cells.
Defining specificities
Several technological advances have been presentedrecently to facilitate the large-scale analysis of epitopes,to visualize peptide–MHC interactions and to identifyand select Ag-responsive T cells for more detailedcharacterization.
Epitope identification frequently requires large numbersof peptides to be synthesized, which is costly and laborious.Therefore, many groups use algorithms to predict whichpeptides from a selected protein would bind a given MHC[37–39]. However, although useful, these algorithms arestill imperfect. To provide multiple peptides at low cost forempirical testing, advanced highly parallel technologiesfor peptide synthesis have been developed, such as Spot orMulti-Pin synthesis [40,41]. Combinations of these tech-nologies with ICS or ELISpot have only been reportedrecently. These include the large-scale screening of acomprehensive library of 66 000 Spot peptides, coveringall possible 9 amino acid peptides in the whole cyto-megalovirus (CMV) proteome (F. Kern, unpublished), and,screeningO200 CMV protein-specific pools of overlappingMulti-pin peptides to identify numerous previouslyunidentified T-cell targets (L. Picker, unpublished).
Currently, little is known about the APCs that presenta given peptide in vivo; however, technologies are nowbeing devised to identify and track these cells. Kunkelet al. [42] recently reported an amplification system, basedon magneto-fluorescent liposomes, to visualize directly byflow cytometry as few as 100 peptide–MHC complexes perAPC, and to evaluate functional T-cell responses in vivo.Cells that initiate immune responses can be trackedin vivo following Ag uptake through the mucosal route.This technology will help us understand the traffickingof APCs between the mucosa and the central immuneorgans, identifying the routes, kinetics and other para-meters of the important innate processes that initiateAg-specific immune responses, either immunogenicor tolerogenic.
Following Ag presentation, activation of T cells can bemeasured as an early or late event. Phospho-specific anti-bodies enable the flow cytometric monitoring of proteinphosphorylation of unique residues at the single-cell level[43]. However, because T-cell stimulation following inter-action with the APC occurs asynchronously in the cellpopulation in a time frame of hours, whereas phosphoryl-ation and dephosphorylation occur within minutes, thismethod requires further refinements if it is to identifyAg-activated T cells. Nevertheless, this method has enor-mous potential in that it might identify all respondingcells (by virtue of the initiation of signalling cascades); thesimultaneous and independent measurement of differentsignalling pathways might enable the discrimination ofdifferential cellular response programs.
Recently, several groups have mapped the fine inter-action of the TCR with peptide–MHC by sequencing theTCRs from all T cells that respond to a single peptide. Thisnascent field has already yielded interesting results. Forexample, in B6 mice, after primary and secondary
www.sciencedirect.com
influenza virus challenge, a proportion of high-frequencyTCRb express ‘public’ complementarity-determiningregion 3b (CDR3b) sequences that are detected in everymouse and represent a ‘best fit’, whereas others areinvariably not present. ‘Public’ CDR3b sequences origin-ate from up to 10 different nucleic acid sequences, whereasunique (‘private’) sequences are always specified by asingle nucleotype [44]. Douek and Price demonstratedthat different types of TCR responses could dramaticallyimpact on the ability of SIV to escape CTL control.Specifically, an immunodominant peptide, which gene-rates a monomorphic TCR response (probably because ofstructural constraints), is quickly mutated during acuteSIV infection to render the specific CTL responseineffective; a different immunodominant peptide fromSIV generates a much broader TCR response and thevirus is unable to escape CTL control of that response(because mutant peptides are still recognized efficiently)[45]. These studies will influence not only our under-standing of how the structural interaction of TCR andpeptide–MHC complexes drive immune responses, theywill probably instruct us on how to modify vaccinationtechniques, for example, to best avoid the generation ofrapid escape mutations in HIV.
Phenotype differentiation and function
The ability to detect Ag-specific T cells by flow cytometryhas vastly extended our abilities to analyze the pheno-types and functional characteristics of Ag-specific T cells.Not surprisingly, in most published reports, Ag-specificT cells were analyzed with regards to those phenotypicmarkers of T-cell differentiation previously establishedusing fairly limited but well known models or bulkperipheral blood mononuclear cells (PBMCs) [46–48].A popular paradigm [46,49] postulates the existence ofdifferentiation ‘compartments’ termed ‘central’ and‘effector’ memory (TCM and TEM), which can be character-ized by the expression levels of CD45RA and CCR7 andare associated with certain migration patterns andfunctions. However, T-cell differentiation does not followthe same rules for all Ags and pathogens: certain charac-teristics, such as the ability to respond to Ag withoutco-stimulation, degranulation or specific migration pat-terns are frequently associated with specific phenotypes,although it is becoming increasingly obvious that thesephenotypes are not the same for T cells of differentspecificities [50,51].
In addition, the phenotypic markers used by differentgroups are not fully congruous, which makes it moredifficult to compare data. For example, some groups haveconsistently classified CMV-specific CD8 T cells into foursubsets, defined by the expression of CD45RA and CD27[52,53]; however, others have preferentially used combi-nations of the following markers: CD45RO, CD27, CD28or CD62L [54,55]. These, or similar divisions, intend todefine essentially the same subsets, that is, ‘naıve’, ‘earlyAg experienced’, ‘late Ag experienced’ and ‘terminallydifferentiated’. Recent work illustrates that these modelsmight in fact over-simplify the situation. When usingmany such parameters in combination (rather than two ata time), the number of subsets and different functions

Review TRENDS in Immunology Vol.26 No.9 September 2005482
increases dramatically because there is extensive overlapbetween the subsets defined on the basis of only twomarkers. The development of flow cytometric technologythat can quantify simultaneously the expression of asmany as 17 different molecules per cell [56] will enable thedetailed analysis of which of these functions or phenotypesis most likely to be relevant to disease processes. Forexample, recent data (M. Betts, pers. commun.) illustratesthat it might be necessary to measure five different func-tions on each CD8 T cell to identify functional differencesbetween HIV non-progressors and progressors. With thistechnology comes a commensurate level of complexity, inthe experimental design, data analysis and presentation.Overcoming these hurdles is an active field of develop-ment [56–58]; new tools to assist these efforts are urgentlyneeded. The analysis of isolated single Ag-specific T cells,for example, with respect to cytokine mRNA expression[59] or TCR CDR3 sequences [60], after identification ofthese cells by tetramer staining and following multi-parameter based sorting, is an elegant combinationof technologies.
Clinical usefulness
Currently, the clinical applications of Ag-specific measure-ments are focused on two major topics: monitoring ofresponses to vaccines and correlating ‘natural’ T-cellresponses with clinical outcomes. Among all vaccines,those against tumours and HIV are the most frequentlyinvestigated, whereas, with respect to natural responses,responsesagainstCMVandHIVdominate current research.
The induction of antitumour responses by peptide-based vaccines has been addressed recently [61,62].A paradox of this form of immunotherapy is that sub-stantial proportions of vaccinated patients developmeasurable tumour-specific T-cell responses but only asmall proportion of these responses appear to be effective(tumour regression). Stuge et al. recently applied MHCmultimer-based sorting, the CD107 degranulation assayand the classic chromium release assay to determiningthe recognition efficiency of vaccine-elicited responses andendogenous anti-melanoma responses. By combiningtechnologies, they revealed that the recognition efficiencyof vaccine-induced Tcells was predominantly low, whereasthat of endogenous tumour Ag-induced Tcells was usuallyhigh. These results show that looking at several para-meters by combining methods, rather than relying onsingle readouts, will be crucial in making use of thecurrently available tools.
With respect to HIV-specific T cells, functional andphenotypical differences between CD4 and CD8 T cellsresponding to viral Ags in HIV vaccinees versus naturallyinfected individuals were evaluated and correlated withthe clinical course of HIV infection. Using 12-color-analysis, Koup et al. found that vaccine-induced T-cellresponses were distinct from those found in naturallyinfected subjects, either progressors or long-term non-progressors (LTNPs). Interestingly, vaccine-inducedresponses matured during the first year and becamemore polyfunctional: a state that is more congruouswith the functionality of HIV-specific T cells in LTNPs(R. Koup, pers. commun.). Betts et al. were able to follow
www.sciencedirect.com
an HIV-Gag vaccinee who actually became infected withHIV: ICS, MHCmultimer binding and the CD107 degranu-lation assay were used to assess the T-cell response duringthe clinical course that rapidly developed the typicalfeatures of chronic HIV infection [63].
In terms of monitoring of HIV-specific Tcells induced bynatural infection, the numbers of CD4 and CD8 T cellsresponding to viral Ags in HIV-infected individuals wererecently evaluated and correlated with viral load anddisease progression. Thus, it was revealed that persis-tently low viral replication (!10 000 copies mlK1) duringantiretroviral therapy is associated with higher fre-quencies of HIV-specific CD4 and CD8 T cells thancomplete suppression of replication or therapy failure[64]. Along the same lines, ICS was used recently to studythe T-cell response to two important human CMV pro-teins, pp65 and IE-1, in heart-transplant recipients. Thelevels of CD8 T cells specific for the non-structural IE-1,rather than for pp65, correlate with protection fromCMV-disease [65].
A common theme seems to be emerging: ‘effective’ anti-viral T-cell responses, for example, those against CMV,Epstein–Barr virus (EBV) and HIV in non-progressors,constitute ‘polyfunctional’ T cells, that is, T cells thatexhibit at least four or five different functions simultane-ously. HIV progressors, by contrast, show a more restrictedfunctional profile [66]. With respect to HIV, this was in factsuspected previously: rather than just quantity or breadth,the quality (functional profile) of the CD8 T-cell responsemight be of paramount importance [67].
Outlook
The constantly growing array of tools for the analysis ofcellular parameters persistently adds to the complexityof the information that we have on the key factors inAg-specific immune responses. To generate biologicallyand clinically useful results from this ever-increasingwealth of information, we will eventually have to (re)definethe most relevant elements using a minimum of tech-nology, so as to enable widespread application. Forexample, the use of 17 fluorescence channels in flow cyto-metric lymphocyte analysis might lead to the identifi-cation of crucial subsets and functions that can then bemonitored using considerably fewer channels. Import-antly, flow cytometry-based assays are highly amenableto standardization [68]. Such standardized use shouldgreatly facilitate the generation of meaningful and com-parable information across the globe, pushing towardsunderstanding Ag-specific immune responses.
AcknowledgementsThis work was supported in part by grants from ISS (40F.50, 45F.26),CIPE, Ministry of Health PF, MIUR (RBNE01RB9B003), EU(QLK21999–01040) to FM and GLP.
References
1 Pearmain, G. et al. (1963) Tuberculin-induced mitosis in peripheralblood leucocytes. Lancet 1, 637–638
2 Bloom, B.R. (1971) In vitro methods in cell-mediated immunity inman. N. Engl. J. Med. 284, 1212–1213
Review TRENDS in Immunology Vol.26 No.9 September 2005 483
3 Brunner, K.T. et al. (1968) Quantitative assay of the lytic action ofimmune lymphoid cells on 51Cr-labelled allogeneic target cells in vitro;inhibition by isoantibody and by drugs. Immunology 14, 181–196
4 Roden, M.M. et al. (1999) A novel cytolysis assay using fluorescentlabeling and quantitative fluorescent scanning technology. J. Immunol.Methods 226, 29–41
5 Barber, D.L. et al. (2003) Cutting edge: rapid in vivo killing by memoryCD8 T cells. J. Immunol. 171, 27–31
6 Czerkinsky, C. et al. (1988) Reverse ELISPOTassay for clonal analysisof cytokine production. I. Enumeration of g-interferon-secreting cells.J. Immunol. Methods 110, 29–36
7 Picker, L.J. et al. (1995) Direct demonstration of cytokine synthesisheterogeneity among human memory/effector T cells by flow cyto-metry. Blood 86, 1408–1419
8 Waldrop, S.L. et al. (1997) Determination of antigen-specific memory/effector CD4CT cell frequencies by flow cytometry: evidence for anovel, antigen-specific homeostatic mechanism in HIV-associatedimmunodeficiency. J. Clin. Invest. 99, 1739–1750
9 Manz, R. et al. (1995) Analysis and sorting of live cells according tosecreted molecules, relocated to a cell-surface affinity matrix. Proc.Natl. Acad. Sci. U. S. A. 92, 1921–1925
10 Bueno, C. et al. (2002) A new method for detecting TNF-a-secretingcells using direct-immunofluorescence surface membrane stainings.J. Immunol. Methods 264, 77–87
11 Rodriguez-Caballero, A. et al. (2004) A new simple whole blood flowcytometry-based method for simultaneous identification of activatedcells and quantitative evaluation of cytokines released duringactivation. Lab. Invest. 84, 1387–1398
12 Chattopadhyay, P.K. et al. A live-cell assay to detect antigen-specificCD4 T cells with diverse cytokine profiles. Nat. Med. (in press)
13 Frentsch, M. et al. Direct access to CD4CT-cells specific for definedantigens according to CD154 expression. Nat. Med. (in press)
14 Betts, M.R. and Koup, R.A. (2004) Detection of T-cell degranulation:CD107a and b. Methods Cell Biol. 75, 497–512
15 Rubio, V. et al. (2003) Ex vivo identification, isolation and analysis oftumor-cytolytic T cells. Nat. Med. 9, 1377–1382
16 Catalfamo, M. et al. (2004) Human CD8CT cells store RANTES in aunique secretory compartment and release it rapidly after TcR stimu-lation. Immunity 20, 219–230
17 Houck, D.W. and Loken, M.R. (1985) Simultaneous analysis of cellsurface antigens, bromodeoxyuridine incorporation and DNA content.Cytometry 6, 531–538
18 Lyons, A.B. (2000) Analysing cell division in vivo and in vitro usingflow cytometric measurement of CFSE dye dilution. J. Immunol.Methods 243, 147–154
19 Tough, D.F. and Sprent, J. (1994) Turnover of naıve- and memory-phenotype T cells. J. Exp. Med. 179, 1127–1135
20 Flynn, K.J. et al. (1999) In vivo proliferation of naıve and memoryinfluenza-specific CD8CT cells. Proc. Natl. Acad. Sci. U. S. A. 96,8597–8602
21 Greten, T.F. et al. (1998) Direct visualization of antigen-specific Tcells:HTLV-1 Tax11-19- specific CD8CT cells are activated in peripheralblood and accumulate in cerebrospinal fluid from HAM/TSP patients.Proc. Natl. Acad. Sci. U. S. A. 95, 7568–7573
22 Altman, J.D. et al. (1996) Phenotypic analysis of antigen-specificT lymphocytes. Science 274, 94–96
23 Knabel, M. et al. (2002) Reversible MHC multimer staining forfunctional isolation of T-cell populations and effective adoptivetransfer. Nat. Med. 8, 631–637
24 Borg, N.A. et al. (2005) The CDR3 regions of an immunodominantT cell receptor dictate the ‘energetic landscape’ of peptide–MHCrecognition. Nat. Immunol. 6, 171–180
25 Novak, E.J. et al. (1999) MHC class II tetramers identify peptide-specific human CD4CT cells proliferating in response to influenza Aantigen. J. Clin. Invest. 104, R63–R67
26 McMichael, A.J. and Kelleher, A. (1999) The arrival of HLA class IItetramers. J. Clin. Invest. 104, 1669–1670
27 Scriba, T.J. et al. (2005) HIV-1-specific CD4CT lymphocyte turnoverand activation increase upon viral rebound. J. Clin. Invest. 115,443–450
28 Walker, M.R. et al. (2005) De novo generation of antigen-specificCD4CCD25C regulatory T cells from human CD4CCD25K cells. Proc.Natl. Acad. Sci. U. S. A. 102, 4103–4108
www.sciencedirect.com
29 Zhang, Y. et al. (2005) A polyclonal anti-vaccine CD4 T cell responsedetected with HLA-DP4 multimers in a melanoma patient vaccinatedwith MAGE-3.DP4-peptide-pulsed dendritic cells. Eur. J. Immunol.35, 1066–1075
30 Hayakawa, K. et al. (1987) Isolation of high-affinity memory B cells:phycoerythrin as a probe for antigen-binding cells. Proc. Natl. Acad.Sci. U. S. A. 84, 1379–1383
31 Lalor, P.A. et al. (1992) Functional and molecular characterization ofsingle, (4-hydroxy-3-nitrophenyl)acetyl (NP)-specific, IgG1CB cellsfrom antibody-secreting and memory B cell pathways in the C57BL/6immune response to NP. Eur. J. Immunol. 22, 3001–3011
32 Townsend, S.E. et al. (2001) Single epitope multiple staining to detectultralow frequency B cells. J. Immunol. Methods 249, 137–146
33 Newman, J. et al. (2003) Identification of an antigen-specific B cellpopulation. J. Immunol. Methods 272, 177–187
34 Crotty, S. et al. (2004) Tracking human antigen-specific memoryB cells: a sensitive and generalized ELISPOT system. J. Immunol.Methods 286, 111–122
35 Doucett, V.H. et al. Enumeration and characterization of virus-specificB cells by multicolor flow cytometry. J. Immuno. Meth. (in press)
36 Douek, D.C. et al. (2002) HIV preferentially infects HIV-specificCD4CT cells. Nature 417, 95–98
37 Rammensee, H.G. et al. (1997) MHC ligands and binding motifs,Landes Bioscience
38 Scheibenbogen, C. et al. (2002) Identification of known and novelimmunogenic T-cell epitopes from tumor antigens recognized byperipheral blood T cells from patients responding to IL-2-basedtreatment. Int. J. Cancer 98, 409–414
39 Elkington, R. et al. (2003)Ex vivo profiling of CD8C-T-cell responses tohuman cytomegalovirus reveals broad andmultispecific reactivities inhealthy virus carriers. J. Virol. 77, 5226–5240
40 Maeji, N.J. et al. (1990) Multi-pin peptide synthesis strategy for T celldeterminant analysis. J. Immunol. Methods 134, 23–33
41 Frank, R. (2002) The SPOT-synthesis technique. Synthetic peptidearrays onmembrane supports–principles and applications.J. Immunol.Methods 267, 13–26
42 Kunkel, D. et al. (2003) Visualization of peptide presentation followingoral application of antigen in normal and Peyer’s patches-deficientmice. Eur. J. Immunol. 33, 1292–1301
43 Krutzik, P.O. and Nolan, G.P. (2003) Intracellular phospho-proteinstaining techniques for flow cytometry: monitoring single cell signal-ing events. Cytometry A 55, 61–70
44 Kedzierska, K. et al. (2004) Conserved Tcell receptor usage in primaryand recall responses to an immunodominant influenza virus nucleo-protein epitope. Proc. Natl. Acad. Sci. U. S. A. 101, 4942–4947
45 Price, D.A. et al. (2004) T cell receptor recognition motifs governimmune escape patterns in acute SIV infection. Immunity 21, 796–803
46 Sallusto, F. et al. (1999) Two subsets of memory T lymphocytes withdistinct homing potentials and effector functions.Nature 401, 708–712
47 Picker, L.J. et al. (1993) Control of lymphocyte recirculation in man. I.Differential regulation of the peripheral lymph node homing receptorL-selectin on T cells during the virgin to memory cell transition.J. Immunol. 150, 1105–1121
48 Kern, F. et al. (1994) Discordant expression of LFA-1, VLA-4a,VLA-b1, CD45RO and CD28 on T-cell subsets: evidence for multiplesubsets of ‘memory’ T cells. Int. Arch. Allergy Immunol. 104, 17–26
49 Sallusto, F. et al. (2004) Central memory and effector memory T cellsubsets: function, generation, and maintenance. Annu. Rev. Immunol.22, 745–763
50 Appay, V. et al. (2002) Memory CD8CT cells vary in differentiationphenotype in different persistent virus infections.Nat. Med. 8, 379–385
51 van Leeuwen, E.M. et al. (2004) Emergence of a CD4CCD28K
granzyme BC, cytomegalovirus-specific T cell subset after recoveryof primary cytomegalovirus infection. J. Immunol. 173, 1834–1841
52 Hamann, D. et al. (1997) Phenotypic and functional separationof memory and effector human CD8CT cells. J. Exp. Med. 186,1407–1418
53 Hamann, D. et al. (1999) Faces and phases of human CD8 T-celldevelopment. Immunol. Today 20, 177–180
54 Tsegaye, A. et al. (2003) Immunophenotyping of blood lymphocytes atbirth, during childhood, and during adulthood in HIV-1-uninfectedEthiopians. Clin. Immunol. 109, 338–346

Review TRENDS in Immunology Vol.26 No.9 September 2005484
55 Wills, M.R. et al. (2002) Identification of naive or antigen-experiencedhuman CD8CT cells by expression of costimulation and chemokinereceptors: analysis of the human cytomegalovirus-specific CD8CT cellresponse. J. Immunol. 168, 5455–5464
56 Perfetto, S.P. et al. (2004) Seventeen-colour flow cytometry: unravel-ling the immune system. Nat. Rev. Immunol. 4, 648–655
57 De Rosa, S.C. et al. (2003) Beyond six colors: a new era in flowcytometry. Nat. Med. 9, 112–117
58 Baumgarth, N. and Roederer, M. (2000) A practical approach tomulticolor flow cytometry for immunophenotyping. J. Immunol.Methods 243, 77–97
59 Johnson, B.J. et al. (2003) Single-cell perforin and granzymeexpression reveals the anatomical localization of effector CD8C
T cells in influenza virus-infected mice. Proc. Natl. Acad. Sci.U. S. A. 100, 2657–2662
60 Panus, J.F. et al. (2000) Antigen-specific T helper cell function:differential cytokine expression in primary and memory responses.J. Exp. Med. 192, 1301–1316
61 Valmori, D. et al. (2002) Circulating tumor-reactive CD8CT cells inmelanoma patients contain a CD45RACCCR7K effector subsetexerting ex vivo tumor-specific cytolytic activity. Cancer Res. 62,1743–1750
Five things you might no
1.
Elsevier is a founder member of the WHO’s HINARI and AGORA ini
access to scientific literature. More than 1000 journals, including the T
at significantly re
2.
The online archive of Elsevier’s premier Cell Press journal collection w
recent archive, including Cell, Neuron, Immunity and Current Biology
sites 12 months after artic
3.
Have you contributed to an Elsevier journal, book or series? Did you kn
stand-alone CDs when ordered directly from us?
+1 800 782 4927 (US) or +1 800 460 3110
or +44 1865 474 010 (
4.
Elsevier has a long tradition of liberal copyright policies and for many y
and the posting of final papers on internal servers. Now, Elsevier has
the final text version of their papers on both their person
5.
The Elsevier Foundation is a knowledge-centered foundation making
culturally rich global organization, the Foundation has funded, for ex
Philadelphia, provided storybooks to children in Cape Town, sponsor
Brigham and Women’s Hospital and given funding to the 3rd Intern
www.sciencedirect.com
62 Pittet, M.J. et al. (2001) Ex vivo IFN-g secretion by circulatingCD8 T lymphocytes: implications of a novel approach for T cellmonitoring in infectious and malignant diseases. J. Immunol. 166,7634–7640
63 Betts, M.R. et al. (2005) Characterization of functional and phenotypicchanges in anti-Gag vaccine-induced T cell responses and their role inprotection after HIV-1 infection. Proc. Natl. Acad. Sci. U. S. A. 102,4512–4517
64 Alatrakchi, N. et al. (2005) Persistent low viral load on antiretroviraltherapy is associated with T cell-mediated control of HIV replication.AIDS 19, 25–33
65 Bunde, T. et al. (2005) Protection from cytomegalovirus aftertransplantation is correlated with immediate early 1-specific CD8T cells. J. Exp. Med. 201, 1031–1036
66 Pantaleo, G. and Koup, R.A. (2004) Correlates of immune protection inHIV-1 infection: what we know, what we don’t know, what we shouldknow. Nat. Med. 10, 806–810
67 Rowland-Jones, S.L. et al. (2001) How important is the ‘quality’ of thecytotoxic T lymphocyte (CTL) response in protection against HIVinfection? Immunol. Lett. 79, 15–20
68 Landay, A.L. et al. (2004) Performance of single cell immune responseassays; proposed guideline. NCCLS, 23 (www.clsi.org/)
t know about Elsevier
tiatives, which enable the world’s poorest countries to gain free
rends and Current Opinion collections, will be available for free or
duced prices.
ill become freely available from January 2005. Free access to the
, will be available on both ScienceDirect and the Cell Press journal
les are first published.
ow that all our authors are entitled to a 30% discount on books and
For more information, call our sales offices:
(Canada, South & Central America)
rest of the world)
ears has permitted both the posting of preprints on public servers
extended its author posting policy to allow authors to freely post
al websites and institutional repositories or websites.
grants and contributions throughout the world. A reflection of our
ample, the setting up of a video library to educate for children in
ed the creation of the Stanley L. Robbins Visiting Professorship at
ational Conference on Children’s Health and the Environment.