Embed Size (px)
Citation preview
C.P. No. 871
e
i.
MINISTRY OF AVIATION
AERONAUTICAL RESEARCH COUNCIL
CURRENT PAPERS
Measurements of Pressure Distribution and Shock-Wave
Shape on Power-Law Bodies at a Mach Number of 6.85
bY
D. H. Peckham
LONDON: HER MAJESTY’S STATIONERY OFFICE
1967
PRICE 6s 6d NET


U.D.C. No. 533.696.4 : 533.6.048.2 : 533.6.011.72 : 533.6.011.55
C.P. No.871
April 1965
MEASUREMENTS OF PRESSURE DISTRIBUTION AND SHOCK-WAVE SHAPE
ON POWER-LAW BODIES AT A MACH NUMBER OF 6-85
D.H. Peckham
Experiments on a family of power-law body shapes, y a xn, at a Mach number of 6.85 showed that for bodies of given fineness-ratio, minimum pressure drag is obtained at a value of the exponent n of about 0*7, the drag being approximately 2@ less than that of a cone of the same fineness-ratio. Comparisons of the experimental pressure distributions with values calculated from approximate theories, strictly applicable only at M = 00 and y + I, were made. It was con- w eluded that for low hypersonic Mach numbers (Mm h 7) a more fundamental under- standing of the flow field is required before reliable estimates of the pressure distributions on such body shapes can be obtained,
Replaces R.A,E. Teoh Report No.65075 - A.R.C. 27084

0 2
1
2
3 4
5
CONTENTS
INTRODUCTION THEORY 2.1 Geometry 2.2 Theoretical pressure distribution 2.3 Shock-wave shape DESCRIPTION OF TESTS DISCUSSION OF EXPERIMENTAL RESULTS 4.1 Pressure distributions
4.2 Shock-wave shape CONCLUSIONS
References
Appendix Illustrations Detachable abstract cards
m
3
3 3 5 8 8
9 9
12
13 14 16
Figures 1 - 18

1 INTRODUCTION
3
l i The problem of determining the shape of a non-lifting body of revolution of given fineness-ratio having minimum pressure drag at hypersonic speeds, has been the subject .of numerous theoretical investigations l-8
b . At low supersonic speeds, the assumption of small-perturbation potential flow can be made, but
n this assumption does not remain valid at high Mach numbers when perturbation velocities become of the same order as the speed of sound. So for hypersonic speeds, minimum-drag shapes have been calculated using the Newtonian impact approximation, hypersonic small-disturbance theory, and "piston" theory, the main requirement in sll these methods being that l/ML is sufficiently small. A
general characteristic of all such minimum-drag shapes, for the condition of given fineness-ratio 4/d, is that over the major part of the body the local slope is small compared with the slope near the nose; thus minimum drag is achieved by accepting high pressures on a relatively small area of large slope near the nose, with a consequent reduction in pressure on a relatively large area towards the base of tie body.
The body shape of minimum drag derived by Eggers et al' using the
. Newtonian impact approximation has a rather complicated formula, but it was found that it could be approximated closely by a power-law profile y cc x1' of
-. 4%
exponent n = 2, for sll but small values of fineness-ratio. V/hen the effects of centrifugal forces in the flow were accounted for, a fatter profile was obtained. The advantages of simple geometry are obvious, and later investiga- toi's have confined their attention mainly to power-law body shapes.
.
The aim of the tests described in this Report was to make pressure-plotting
measurements on a series of power-law bodies at low hypersonic speeds (14 c 7) for comparison with values calculated by the theories referred to above, which are strictly appropriate only at high hypersonic speeds, and slso to compare the
results with those for pointed cones so that an estimate can be made of the centrifugal-force effects on the pressure distributions, caused by the curvature of the bodies in their meridian.planes. In addition, measurements were made of shock-wave shape in order to check the fundamental assumptions of certain hypersonic flow theories.
c 2 THEORY
2.1 Geometry
The power-law body profile (Eig,l) is given by the equation
(1)

where y = radius at distance x from the nose e = overall length of body d = base diameter.
It follows that the volume and aspect ratio are given by:
Volume, V = R d2 4 ..-. -m- - 4(2n + 17
Aspect ratio, A = (n + I) d/4 . J
The local surface slope, 6, at a distance x from the nose is given by
(2)
Clearly for n = 1 (i.e. a cone) the surface slope is constant, but for n < I the slope at the nose is infinite. However, the radius of curvature at the nose, R,’ varies in the folloming way
For 0 c n < & R. is infinite
i n=* R. is finite (4)
$<n<l R. is zero .
From Fig.1 it can be seen that the area of a surface element, dS, is given by
dS dx d$
= YdsW = Y,,,~
where s J distance measured along the body profile _ .
9 = meridional angle. .~ .-r
The contribution to drag from the pressure on this surface element is .>-
dD = (p - pJ dS sin 6 .
Thus the total pressure drag is

5 ‘i-5
l
den D = 2
JS (P - P,) Y tan 6 dx d$
00
4 D = 2~
1 (P-PJYdY l
0
The drag coefficient CD referred to base area is then
1
CD = D
s, ~ (d/w2 = 2s cp?*a(*) l
0
2.2 Theoretical pressure distribution
To determine the shape of tho non-lifting body of revolution having i minimum pressure drag at hypersonic speeds, Eggers et al? made use of the
Newtonian approximation for the distribution of pressure coefficient, i.e. '.
*.
.2 C = 2 sin2 6 = A!-=-
P I + jr2
where $ $enotes the derivative dy/dx.
For the case of given length and base diameter (i.e. given fineness- ratio) they found that the shape of the minimum-drag body of revolution could be represented in parametric form by
2
Yl ( > 1 -I- y2
Y=& * Y3
(5)
(6)
(7)
the minimising curve not passing through the origin but having a forward termina- tion point at (0, y,) with 9, = 1.

6 0
It was found that the body shape given by equation (7) could be approxi- mated olosely by a simple power-law shape y 0: x" withn=$ Strain-gauge bal-
ance measurements were therefore made of drag on a series of bodies with n = 1,
49 9 ' and $, for a range of Mach numbers between 2*7 and 6*3. These showed that the lowest drag coefficient was given by the 3 power body shape, its drag being about 1% less than a cone (n = 1) of the same fineness-ratio. The experiments also showed that the drag of the & and $- power bodies was less than that pre- dicted by the Newtonian approximation, and this was attributed to the neglect of centrifugal-force effects in the flow past the highly-curved noses of these blunter bodies. (It must be noted ! though, that this conclusion is based on measurements of overall drag, and not from measurements of pressure distribution.)
Eggers et a? therefore considered the theory of Busemann', which gives the reduction in pressure coefficient due to centrifugal-force effects as
ac = x.$ p Roe
(8)
in the limit M + w and y + 1, as the shock layer becomes infinitely thin, where .
R = radius of curvature of body in meridian plane c
y cos 6 dy, the meen stream velocity in the shock layer
0
u = free stream velocity.
A comparison of values of C obtained from equations (6) and (8) with experimental distributions on at&ent ogive body of -3/d = 3, at a Mach number of 6, led Eggers et al' to conclude that the theory of Busemann 9 strongly over- estimates centrifugal-force effects at free-stream Mach numbers which are large, but for which y of the flow downstream of the bow shock is closer to I-4 than unity. They therefore proposed two modifications to the Busemann theory' for use under such conditions - firstly, since the mean radius of curvature of the flow in the shock layer would be expected to approach the body radius of curvature, R, only near the nose, while with increasing distance downstream of the nose it would be expected to become larger than R, it was suggested that a
better approximation to the mean radius of curvature, ii, of the flow in the shock layer would be

:5 7
ii 1 5 = 1 - y/@/2] l
(9)
i
. c
Secondly, it was suggested that a simple approximation to the mean velocity in the shock layer, i?, would be
Thus
AC = P
cl- d2 Y.- *I cos6 . (11)
The shape of the minimum-drag body of revolution determined by using
equations (6) and (11) was found to be somewhat more blunt in the region of the nose, and to have more curvature in the region downstream of the nose than the
$-power body shape. Calculation of its drag showed that it was only a few per cent less than that of the s-power body, but no wind tunnel tests were made at that time to check this estimate.
This description of the derivation of the shape of the minimum-drag body of revolution of given fineness-ratio by Eggers et a?, has been described in some detail since theirs was the first published work on the subject (I 956). Later, Cole2 showed, by using hypersonic small-disturbance theory, that the $- power and 2/3-pourer bodies are minimum-drag shapes for the cases of centrifugal- force effects neglected, and included, respectively. These results were obtained using the slender-body approxlimation
. . C P
= 2y2+? . ( )
Another approach by Grodzovskii andKrashohennikova',using "piston-theory",
gave n = 0.7 as the value of the exponent for a minimum-drag power-law body.
More recently, Miele and collaborators 5-7 have produced a series of reports
on minimum-drag shapes in both two- and three-dimensional flows, including also the effects of skin friction. Most recent of all, Boyd8 has extended the study
of minimum-drag shapes to include ducted bodies.
The drag variations with the power-law exponent n for the various theories
are illustrated in Fig.-/, the drag of a pointed cone (n = 1) of the same fineness- ratio being used as a basis for comparison,

Finally, it must be emphasised that the above discussion is limited to the theory of minimum-drag bodies of power-law profile, where dy/dx is continuous, and the surface pressure coefficient does not fall to zero. If theseoonsiraints . are removed, body shapes of lower drag than pori-er-law bodies can be derived theoretically. A detailed examination of the various optimum bodies of minimum drag, depending on theconstiaintsimposed, has been made by Hayes and Probstein4.
2
2.3 Shock-wave shape
In the theory 10 of asymptotic hypersonic flows, the theory states that for bodies of the form y oc xn, the shock-wave shape is given by y oc x" where
m = nfor& <n<l 04)
III = kforO<n<$ 05)
2 where k = - 3 + j’
with j = 0 for two-dimensional flow, and j = 1 for axisymmetric flow.
In the case cf equation (14), similarity solutions in the form suggested by Lees and Kubota II are available, and in the case of equation (15) the solution is
12 . given by the "blast-wave analogy" as postulated by Lees , and by Cheng and Pallone13.
Y A simple way to check the above theories is therefore to photograph the
shock-wave shape on a variety of power-law bodies.
3 DESCRIPTION OF TESTS
The tests were made in the RA,E. 7 in x 7 in hypersonic wind tunnel 14 at a Mach number of 6-85. All tests were mrde at a nominal stagnation pressure of 750 lb/in2 gauge, and a stagnation temperature sufficient to avoid liquefaction of the air in the test section (To fi 600'K). Under these conditions a Reynolds
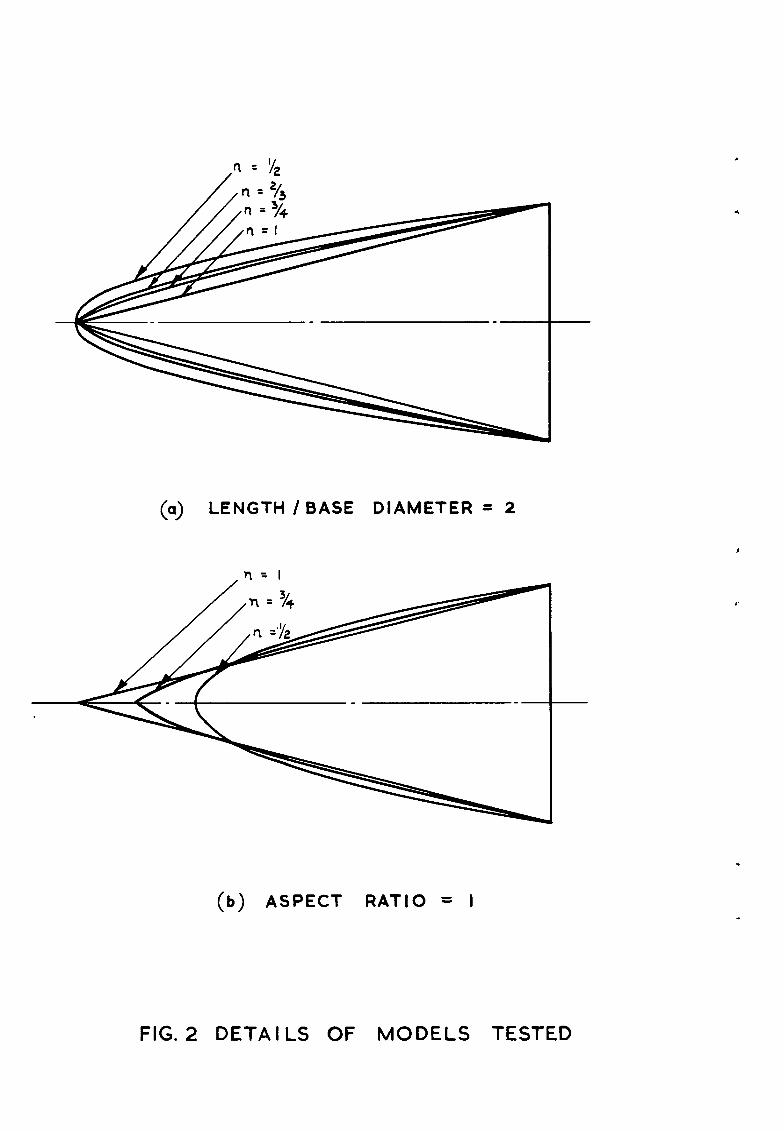
number of approximately O-5 million per inch was obtained. The models varied in length from 3.75 in to 5 in, details are given in Fig.2.
Pressures were measured on a conventional multi-tube mercury manometer bank,
with one tube referred to a vacuum reference, Steady readings were obtained after
seme 10 to 15 seconds running, when the manometer was clsmped and the tunnel shut
down. Pressure tappings on each model surface were concentrated along one generator, with a single tapping on an opposite generator to enable the symmetry of the flow to be checked. Pressure measurements were made at roll =angle, 9, of
O", 30°, 60°, VO", 135" and 180°0 In this way, the pressure distribution at zero
incidence was obtained as a mean from six separate tests.
t
1

9
Evidence suggests that manometer readings were measured to an accuracy of to-02 in of mercury, which with a similar error ;
in reading the reference pressure,
corresponds to to*003 error in pressure coefficient, C e P Errors in setting model
The possible P
incidence could amount to a further error in Cp of up to +0*002. total direct measuring error in C was therefore +0*005. Additional to this
P measuring error, was the error arising from the lack of flow uniformity in the test section, the variation of dynamic pressure in the region of the model being within ?I$.
On the basis of the above figures, the estimated maximum experimental errors, and R.M.S. experimental errors, are tabulated below:
52
0.1
O-3
0*5
Maximum error in C R.M.S. error in C P .s-
~0.006 20 l 004
+O -008 20 -005
40-010 to-006
But since the res*ults are means from six tests, the errors should be less than . those quoted above.
4 DISCUSSION OF EXFERIMENTAL RESULTS i
4.1 Pressure distributions
The pressure distributions measured at a Mach number of 6.85 on bodies of fineness-ratio 2 are plotted in Fig*3, and those for bodies of aspect ratio unity in Fig..& In both cases the results are compared with values &Lculated from the Newtonian approximation C = 2 sin2 6.. Also shown is the theoretical
P pressure coefficient for the comparable pointed cone, as calculated by the theory of Taylor and Maccoll 15 ; experiments on cones have shown excellent agreement with this thecry 16 .
For the 2/3 and-.&power bodies it is found that the Newtonian approximation underestimates &h.e.lprecsare coefficient over most of the body surface, vrhile for
i the $-power bodies it'.oserestimates the pressure coefficient - except towards the rear of the body of fineness-ratio 2.- Thus the inclusion:of an ,allowance for
* centrifugal-force effe@s'..on the--f-low-inthe~shock layer (as discussed in section 2.2) would increase the divergence-*between theoretical and experimental values in the case ofrthe 2/3 and $-power bodies, and might-decrease the
discrepancy between theoretical and experimental values in the case of the $- power bodies,' cnly for regions close to the noses of these bodies. Of course,

10
the Newtonian approximation may be as much at fault as the correction term for centrifugal-force effects; this possibility is discussed later.
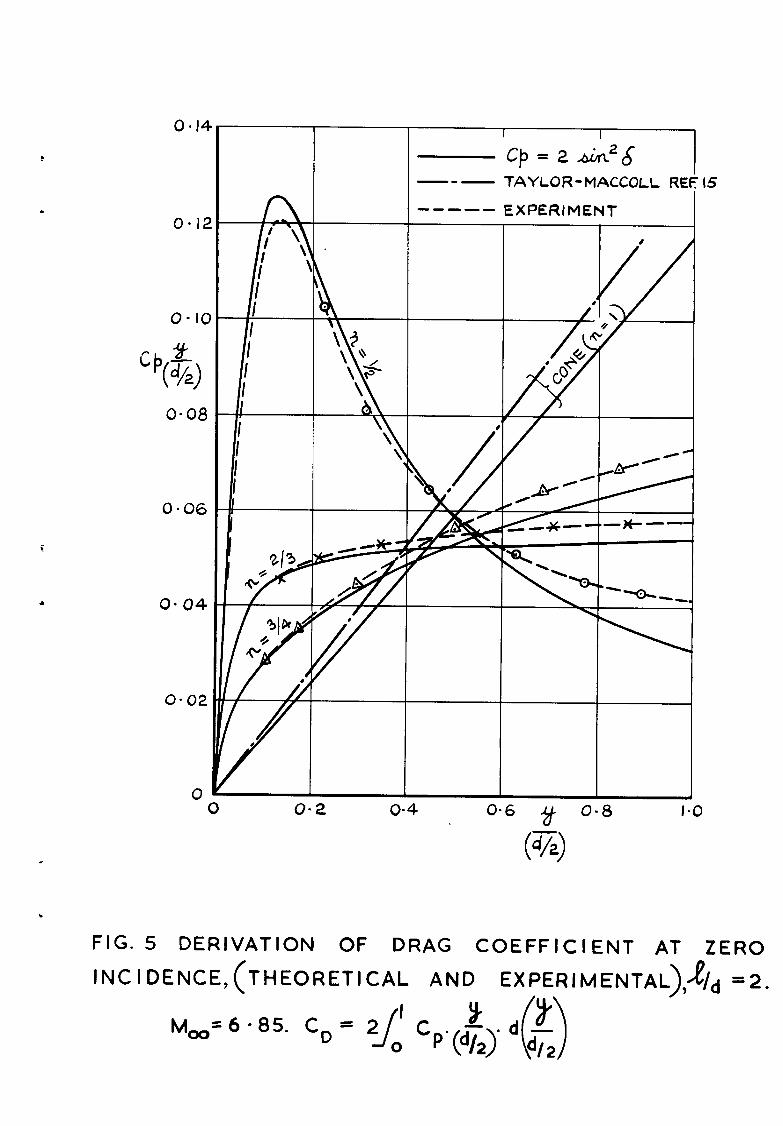
. The way in which these pressure distributions contribute to drag is shown
more clearly in Figs.5 and 6, where Cp y/(13/2) is plotted against y/(d/2), the drag coefficient being given by the expression:
Thus we find, for example, that in the case of the bodies of fineness- ratio 2 and n = l/2, 2/j and 3/4, the drag contribution from those parts of the body surface in the approximate range 0 < y/(d/2) < O-5 is greater than that for a cone (n = i), while for y/(d/2) > O-5 the drag contribution is less, with the net result that the overall drag of the 2/3 and j/&-power bodies is less than that Of' the cone, and for the l/2-power body about the same. Integration of the curves in Fig.5 gives:
cD n Experiment M = 6-85
l/2 0.136
2/3 0*105
3/4 0-106
1 0*131"
Fineness-ratio = 2 s-
cD cD Newtonian (M =CXJ 1 Taylor-Maccoll (IJ = 6.85)
0.127
O*lol
O*OYY
O-118 O-131
*See Ref.16.
The above values are plotted in Fig.7, together with estimates of drag
variation with n from Refs.2 and 3. It should be noted that although the
experimental values of drag coefficient are greater than that estimated from the Newtonian approximation, the measured percentage reduction in drag
coefficient relative to the cone value for the 2/3 and j/&-power bodies is more than that predicted by the Newtonian approximation. Also shown are two experi- mental results for a Mach number of 7*7 taken from Ref.17; these give rather higher values of drag coefficient relative to the cone than the present tests, but it is shown in Ref.17 that these values of drag coefficient are probably

high due to the effect of boundary-layer interaction, resulting from the 10~
. value of Reynolds number in these tests.
Thus experiments show that for bodies of given fineness-ratio, minimum pressure drag coefficient is obtained with a power-law body of exponent
n fi O-7, the drag being about ,203 less than that of the comparable cone0 This value of n is broadly in agreement with the various theoretical estimates (though these theories apply strictly only to $1 = 0~). The magnitude of the oc drag reduction is greater than that predicted by the Newtonian approximation, but less than that predicted by the theories of Refs.2 and 3.
Fig.8 gives the variation of volume and wetted area with the exponent n, and it can be seen that the power-law body of n = O-7 offers some 25:'o more stowage volume th?an the cone. However, the wetted area is also greater, so in practical cases where skin-friction drag must also be included, it can be expected that the body of minimum (pressure + skin friction) drag would have a value of n slightly greater than 0.7 (see Ref,7)-
The reason why the Newtonian approximation gives a fairly close estimate of the drag coefficient and the exponent n of the power-law body of minimum drag (for M, h 7), but not of the reduction in drag relative to that of the cone, is shown in Fig.9 where Cp/sin2 6 Cp/sin2 6
is plotted against the body slope 6 (a value of = 2 corresponding to the Newtonian approximation). It can be seen
that for the 2/J and j/&-power bodies most of the experimental results lie
within about ?j;, of the Newtonian value, while for the cone C /sin2 S varies P
between 2-l and 2.5 for 30" > 6 > loo. Fig;.9 also shoves the effect of body curvature on the pressure distribution, the pressure on the l/2-power body being more than lO$ less than those on bodies of zero longitudinal curvature
( i.e. n = 1). The apparent success of the Newtonian approximation in estimating pressures on the 2/3 and 3/L+-power bodies is therefore seen to be fortuitous, the underestimation of pressures due to the effect of body slope being balanced by the neglect of centrifugal-force effects on the flow past these curved bodies.
The decrease in pressure coefficient due to body curvature can be compared
with the Busemann estimate (equation (7)) and the modification to the Busemann estimate proposed by Eggers et al (equation (10)). Thus for example (from Fig.lO), with the l/2-power body of 4/d = 2 the slope at x/4 = 0.2 is 15*6', and the Cp at this point is O*lL+Lb; on a cone of the same slope the C is
P 0*164, giving the change in C
P due to body curvature as A C = - 0*02O in this
P case. (But bearing in mind the level of experimental accuracy, the inaccuracy inherent in deriving a small difference between two large numbers, and

12 0-
differences which could arise through boundary-layer growth effects, this value of A Cp must be considered as only very approximate.)
The Busemann expression (equation (8)) gives:
A C P = - $ cos 6 = - 0.125 x 0.963 T - 0.120
which is a gross over-estimate, even if all the possible experimental errors in A Cp are assumed to be cumulative,
The modification to the Busemann expression (equation (11)) gives:
A C = - $ P
cos 6 = - 0-120 x 0.553 = - 0=067
which is still a large over-estimate.
It appears therefore that neither of these ways of estimating the effect
of body curvature on pressure distribution is appropriate for low as 7, probably because over the rclati~ylarge distance wave and the body surface flow conditions vary significantly, "centrifugal-force effect" approach is not very meaningful.
4-.2 Shock-wave shape
The shock-wave shapes were obtained by measurement from
Mach numbers as between the shock and a simple
enlarged photo-
graphic prints of shadowgraph pictures of the flows past the models. The shock- wave shapes obtained from the various bodies are plotted in Figs.ll-14; Figs.ll- 13 give results for bodies of various fineness-ratios of exponent n = l/2, 2/3
and 3/4 respectively, while Fig.14 gives the results for bodies of fineness- ratio 3 and values of n ranging from l/IO to 3/4.
Since the figures are plotted on logarithmic scales, the slope of the curves gives the exponent m of the shock-wave shape directly, and it is found that there
is some variation of m with downstream distance from the nose of the bodies (m increasing with increase of x/4). This effect may be the result of boundary- layer growth. There is also a slight tendency for m to increase with increase of fineness-ratio, at a given value of n; this effect too may be due to boundary- layer effects.
The variation of the shock-wave exponent m with the body exponent n is given in Fig.15, and the results show that the shock-wave shapes change uniformly with n over the range l/IO < n < 3/4, with no discontinuity at n = l/2 as indicated in
the theory of asymptotic hypersonic flows. This is in agreement with the tests

13
made by Freeman IO et al at the N.P.L., and the theoretical implications of this . result are discussed in Ref.10,
5 CONCLUSIONS *
Experiments on a family of' power-law body shapes, y oc xn, at a Mach number of 6*85 have shown that:
(1) For bodies of given fineness-ratio (length/base diameter), minimum pressure drag is obtained at a value of the exponent n approximately equal to 0.7, thz drag in this case being about 2Q% less than the cone (n = I) of the same finaness-ratio. For n = O-7, the stozage volume is some 25% greater than
that of the cone, but its wetted area is also greater than that of the cone; SO in praotioal cases where skin friction drag must also be included the body of minimum (pressure + skin friction) drag wotld have a value of the exponent n slightly greater than 0.7.
(2) The Newtonian impact approximation gives a fairly close estimation
of the 3rag coefficient, and the exponent n, of the power-law body of minimum drag fcv Moo ti 7, but not qf the dr ag reduction relative to the cone shape. The experimental results show that the apparent success of the Newtonian approxima- tion in estimating the pressure distribution on the 2/j and j/4-power bodies of fineness-ratio 2 is largely fortuitous, the under-estimation of pressures due to the effect of body slope being balanced by the neglect of centrifugal-force effec cn the flow past these curved bcdies. Hypersonic small-disttirbance theory, and "piston-theory", alsn gave good estimates of the value af' the exponent n for the minimumd'rag body, but over-estimated the drag reduction relative to the cone.
ts
(3) The reduction in pressure coefficient due to body curvature was found to be much less than that given by the theory of Busemann for infinite Mach number, or by the modification to the Busemann theory proposed by Eggers et al,
(4) The variation of the shock-wave ahape exponent m with the body-shape exponent n is smooth, with no apparent discontinuity at n = l/2 as indicated in the theory of asymptotic hypersonic flcws.

REFERENCES
Jl& Author Title, etc.
1 A.J. Eggers, Jr. Bodies of revolution having minimum drag at high
M.M. Besnikoff supersonic airspeeds.
D.H. Dennis NACA Report 1306, 1957
2 J. D. Cole Newtonian flow theory for slender bodies. Jnl. Aero. Sci. 24 (6) June 1957, l&8-455
3 G.L. Grodzovskii Self-similar motions of a gas with shock waves
N.L. Krashchennikova spreading according to a power law into a gas at
rest. Translation from Russian in Jnl. Appl. Math.. &
Mech- .Q (5) 1959, 1328 - 1333
4 W.D. Hayes R.F. Probstein
5 A. Miele
6 A. Miele
7 A. Miele J. Cole
8 E-A. Boyd
9 A. Busemann
10 N.C. Freeman R.F. Cash
D. Beuder
Hypersonic flow theory. Academic Press, New York, 1959
Optimum slender bodies of revolution in Newtonian flow. Boeing Sci. Res. Lab. T.R ~0.56, April 1962
A study of the slender body of revolution of minimum drag using the Newton-Busemann pressure coefficient law. Boeing Sci. Res. Lab. T.R.No.62, August 1962
A study of optimum slender bodies in hypersonic
flow with a variable friction coefficient. Boeing Sci. Res. Lab. T.R.No. 66, January 1963
Cowl shapes of minimum drag in supersonic flow. Part 1. Jril. Royal Aero. Sot. 2 Jan. 1965,
46 -48 Part 2. Jnl. Royal Aero. Sot. 2 Feb. 1965, 121 -126
Fliissigkeits-und Garbewegung. Handwgrterbuch der Naturwissenschaften. Gustav Fischer, Zweite Auflage, Jena 1933
An experimental investigation of asymptotic hyper-
sonic flows.
N.P.L. Aero Report 1051, A.RC. 24429, Jan. I 963

!75
i
i
& Author
11 L. Lees T. Kubota
12 L. Lees Hypersonic flow.
13 H.K. Cheng A.J. Pallone
14 J.F.W. Crane L.F. Crabtree
i 15 G.I. Taylor J.W. Maccall
16 D.H. Peckham
17 T. Kubcta
I?D?ERENCES (CCNTD>
Title, etc.
Inviscid hypersonic flow over blunt-nosed slender bodies. Jnl. Aero. Soi. 2 (3) March 1957, 195-202
Proc. 5th. Int. Aero, Cod'., Los Angeles Inst. Aero. Sci., New York, i955,241-276
Inviscid leading-edge effect in hypersonic flow.
Jnl. Aero. Sci. 2 (7) July 1956, 700-702
The 7 in x 7 in hypersonic wind tunnel at R.A.E.
Farnborough. Parts I, II and III.
A.R.C. C.P. No.590, August 1961
Air pressure on a cone moving at high speeds.
Proc. Royal Sot. Au 1933, 278
Experiments at hypersonic speeds on circular cones at incidence.
A.R,C. CP 702, January 1963
Investigation of flom around simple bodies in hypersonic flow, GALCIT Hypersonic Research Project
Memo No .40, June 1957

Appendix
It has been pointed out by N.C. Freeman and H. Hornung of Imperial College
that the correlation of shock-wave shapes on power-law bodies is best performed as follows.
If the equation for the body is written as
where D is a non-dimensionalizing length scale, then the ordinates and abscissae of
the shock-wave shapes may also be non-dimensionalized by this length scale. If this is done, the shock-wave shapes for all values of 4/d and a particular value of n collapse onto a single curve for each Mach number. Moreover, for large Mach
numbers, the correlation is independent of M over a large range of x.
The results in Figs.11, 12 and 13 have been replotted in this way and are shown in Figs.16, 17 and 18 respectively.
A similar correlation of surface pressure distribution is also suggested by some work at Imperial College, that is, plotting the pressures as
P log - ( ) PJ2
versus log ; 0
rather than versus x/d or x/d. This has not been attempted for the present
results however.

0
we--
FIG. I GEOMETRY OF POWER - LAW BODIES
(a) LENGTH /BASE DIAMETER = 2
(b) ASPECT RATIO = I
FIG. 2 DETAI LS OF MODELS TESTED

I NEWTONIAN APPROXtMATlON
CP = 2 ti2d --- TAYLOR-MACCOLL REF. 15
0 n=)/2
x n= %
J
EXPERIMENT
A n= %
0 O-2 o-4 O-6 x O-8 I-O 5
FIG. 3 COMPARISON OF EXPERIMENTAL PRESSURE DISTRIBUTIONS ON BODIES OF e/d=2 AT ZERO INCIDENCE, WITH VALUES CALCULATED BY THE
NEWTONIAN APPROXIMATION. M,= 6.85

o-4
o-3
CP
o-2
0-I
0 0
I I NEWTONIAN APPROXI MATION
cp = 2 Aim26
o-2 o-4 O-6 g 0*8 e
I*0
FIG. 4 COMPARISON OF EXPERIMENTAL PRESSURE DISTRIBUTIONS ON BODIES OF A=1 AT ZERO INCIDENCE, WITH VALUES CALCULATED BY THE
NEWTONIAN APPROXIMATION. Mm= 6.85
0.14
O-08
O-06
o- I) 0 0.2 o-4 O-6 ?t O-8 I-0
s
I cp = 2Aik26
1 - B P TAYLOR-MACCOLL RE E - 15
----- EXPEI StMENT
I
4
.
FIG. 5 DERIVATION OF DRAG COEFFICIENT AT ZERO
INC I DENCE,(THEORETICAL AND EXPERIMENTAL),&- =2.

O-16
O-06
c/3= 2 AbL2J 1 --- TAYLOR- MACCOLL REE 15
------ EXPERIMENTAL I
FIG.6 DERIVATION OF DRAG COEFFICIENT AT ZERO
INCIDENCE (THEORETICAL AND EXPERIMENTAL). A = I.
M =6=85. C, =2 Cphx . d
(0 d2

C D CONE
0.8
o-5 O-6 o-7 0.8 n o-9 I.0
* FIG. 7 DRAG COEFFICIENTS OF TEST BODIES COMPARED WITH DRAG OF CONE OF SAME FINENESS RATIO
1-6
V
VCONE
1-4
S SCONE
1-2
I -0 O-5 O-6 o-7 0.8 q O-9
EXPERIMENT
EXPERIMENT, REE V,M,=7
FIG.8 VOLUME V, AND SURFACE AREA S, OF n-POWER BODY COMPARED WITH VALUES FOR A CONE OF SAME
FINENESS -RATIO

3-5
3.0
CP
0
\ t, . x 4 > .
I -t- +- n= _’ @EF. 16)
-+- 72= I A
x c
IO0 2o” J 3o” 4o”
FIG. 9 VARIATION OF IMPACT COEFFICIENT $/sin’s
WITH BODY SLOPE AND BODY CURVATURE
M,= 6 985 <=O”

s
o-5
0.4
9
o-3
0-E
O-I
0 0 IO0 2o” J 30” 40"
FIG. IO VARIATION OF PRESSURE COEFFICIENT WITH
BODY SLOPE- h&=6. 85, <= 0”.

R.A.E TESTS M, = 6.85
---- CALTECH TESTS M-=7-7
o- I5 o-2 X /e
o-3 o-4 O-5 O-6 O-7 O-8 o-9 I-0
FIG-II SHOCK-WAVE SHAPES FOR BODIES OF n = 92 AT MACH NUMBERS OF 6-85 AND 7.7
d I b T 6 ,

\ \ \ \
\ \
\ \
\\\ -a\ 0) G \
\ \ \ \
\ \ \
\ \ \ \
\ \
* \ \ 1, \
A -_ .A I

\ \
\
\ \
\
\ \
\ \
\ \
\ \
. ~- -. .A -

z
. -
\ \
\ .
\

O-8
m
O-6
o-4
0.2
0 0
.
.
FIG. 15 VARIATION OF SHOCK -WAVE EXPONENT m WITH
BODY - SHAPE EXPONENT n.
( VALUES MEASURED AT “le = o-5)
.
.’

cl
I
A
SHOCK WAVE
00 0
A
0 O-176 KUBOTA
FIG 16 CORRELATION OF SHOCK WAVE SHAPES ON AXISYMMETRIC POWER LAW BODY n=f (REPLOT of FIG II)

I 0
‘0 -
(3 ii

Pdnted in England for Rer Majesty’s Stationery Office by the Royal Aircraft Establishment, Pamborough. Dd.125875. K5.

A&C. C.P. No. @I Peckhzn, U.H. MEASUREMENTS OF PHESSURE DISTRIBUTION AND SHOCK-WAVE SHAPE ON POWER-IAW BODIES AT A MACH NLMBW OF 6.85
533.696.4 : 533.6.048.2 : 533.6.011.72 : 533.6.011.55
April 1%5
L.R.C. C.P. No. &7l Peckham, D.H. MEASUREMENTS OF PR!ZSSURE DISTRIBLPPION AND SHOCK-WAVE SLAPE ON Pm-LAW BODIES AT A MACH NUfBm OF 6.85
533.696.4 : 533.6.048.2 : 533.6.011.72 : 533.6.011.55
April 1965
Experiments on a family of powr-law body shapes, y a xn, at a Mach number Experiments on a Pamlly oP power-law body shapes, ya xn, at a Mach number of 6.85 showed that for bodies of given f lneneas-ratio, mlnlmum pressure of 6.85 showed that Por bodies of given Plneness-ratlo, mlnlmum pressure drag Is obtained at a value of the exponent n of about 0.7, the drag being drag is obtained at a value of the exponent n oP about 0.7, the drag being approximately 20% less than that of a cone of the same Plneness-xatlo. approximately fi less than that of a cone of the same fineness-ratio. Comparisons oP the experimental pressure dlstrlbutlons with values calcul- Comparisons of the experimental pressure distributions wlth values calcula- ted Prom approximate theories, strictly applicable only at M, =a~ and ted Prom approximate theories, str¶ctJy applicable only at G = 00 and y -, 1,were IItlde. It maa concluded that Por low hypersonic Mach numbers y + 1, were Fade. It vas concluded that for low hypersonic Mach numbers ob, fi 71 a more Pun-t&l understanding oP the Plow Pleld is required CM o. P 7) a more fundamental understanding oP th flow I leld 1s required beiom muale estbtes or the pressure dlstrlbutlons on such body shapes before reliable eetlnrates of the pI%sUl? distributions on such body shapes cm be obtaltted. can be obtained.
ARX. C.P. No. 8?l PeCkham, 3.H. MFABLTREMENTS OF PRESSURE DISTRIBUTION AND SHUCK-WAVE SHAPE ON POWER-IAW BODIES AT A MACH NUfBIR OF 6.85
533.696.4 : 533.6.048.2 : 533.6.011.72 : 533.6.011.55
April 1965
Expfrlments on a family of pour-law body shapes, ya x”, at a Mach number of 6.85 showed that for bodies of given Plneneas-z-atio, minimum pssure drag 1s obtained at a value of the exponent n of about 0.7, the drag being approximately 20% less than that 0r a cone 0r the ssme f lneness-ratlo. Comparisons of the experimental pressure dlstrlbutlona with values calcula- ted Prom approximate theories, strictly applicable only at I&, = on and y -, 1, were made. It we concluded that for low hypersonic Mach numbers k ti 7) a more fundamental understanding of the flow Pleld la required berore reliable estimates oP the pressure dlstribctlons on such body shapes can be obtained.


C.P. No. 871
o Crown Copyright 1967
Published by HER MAJESTY’S STATIONERY OFFICE
To be purchased from 49 High Holborn. London w.c.1 423 Oxford Street, London w.1 13~ Castle Street, Edinburgh 2
109 St. Mary Street, Cardiff Brazennose Street, Manchester 2
50 Fairfax Street, Bristol 1 35 Smallbrook, Ringway, Birmingham 5
80 Chichester Street, Belfast 1 or through any bookseller
C.P. No. 871 S.O. CODE No. 23-9016-71