Embed Size (px)
Citation preview

Measurement Systems Analysis:What is it and why should I care?
Dec. 11, 2012
Barry KulbackGlobal Lean Six Sigma LeaderTrane and Thermo King, brands of Ingersoll Rand

2
Agenda
• About Ingersoll Rand• Measurement systems and Measurement
System Error• What is Measurement System Analysis• Types of Measurement Systems Analysis
and examples• Lessons Learned
Feel free to ask questions at any time!

3
About Ingersoll Rand
• A $14 billion diversified industrial company
• Publicly-held; NYSE:IR
• Operations in every major geographic region
• Strategic brands are #1 or #2 in their markets
• Products and services for commercial, industrial and residential markets

4
What do you think about my measurement system?

5
We do a lot of measuring in our businesses and in any process improvement methodology…
• Running the business Monitor process performance
• Improving the business Baseline Set the levels of the adjustments Getting better or worse Validate improvement results
… and many of the measurement systems we use for this have similar problems as the one shown!

6
When not measuring well…• Current process performance may be
misjudged• Process improvement results may be
misinterpreted• Missed opportunities• Wasted effort, $

7
5 years of college in physics & chemistry labs….
• Not once was it ever discussed… how does your ability to measure influence the results you think you are seeing?

8
DMAIC process improvement methodology
• Define• Measure • Analyze• Improve• Control
My ‘aha’ moment came in my Six Sigma Black Belt Training
Measurement System Analysis
Collect data
Six Sigma practitioners are known as Green Belt, Black Belts and Master Black Belts

9
Premise for Six Sigma Methods
Sources of variation can be– Identified– Quantified– Eliminated by control or prevention
Y = f(x)Data driven decisions with a known level of confidence…
… we do a lot of measuring in Six Sigma

10
What is an MSA?
• When measuring there is always Measurement System Error
• An MSA is a procedure to assess a Measurement System– Quantifies the Measurement System Error– Acceptable? Yes or no
• If ‘no’ improve the measurement system– MSA output can tell you where to look

11
• For 2 of the 3 types of MSA’s we’ll cover today• Guidelines
– Trained Operator(s)– Proper Method– Representative Samples
• Generally two to three operators• Each unit is measured or assessed 2-3 times
by each operator• Results are then analyzed
• Often with statistical software like Minitab• Analytical and graphical outputs explain the results
Conducting an MSA

12
Types of Data
Continuous Data (Quantitative) – Decimal subdivisions are meaningful– Time (seconds)– Pressure (psi)– Conveyor Speed (ft/min)– Rate (inches)– Temperature (degrees)
Attribute Data (Qualitative) – Categories– Good / Bad– Inventory Classification Code A, B or C– Shift number– Counted things (# receipt errors, # units shipped, etc.)

13
Types of Measurement Systems Analysis
Continuous DataGage R&R
Attribute DataAttribute Agreement Analysis
Data Scrub MSA

14
12.412.212.011.811.61 board
Dotplot
… but first just a wee bit of ‘technical’
12.412.212.011.811.62 boards
Dotplot
12.3012.1512.0011.8511.7050 boards
Dotplot
12.3612.2412.1212.0011.8811.7611.64
18
16
14
12
10
8
6
4
2
0
50 boards
Frequency
Histogram
12.3612.2412.1212.0011.8811.7611.64
18
16
14
12
10
8
6
4
2
0
50 boards
Frequency
Histogram with fit
12.3612.2412.1212.0011.8811.7611.64
18
16
14
12
10
8
6
4
2
0
50 boards
Frequency
just the fitted curve

15
so…
12.3012.1512.0011.8511.7050 boards
Dotplot
12.3612.2412.1212.0011.8811.7611.64
18
16
14
12
10
8
6
4
2
0
50 boards
Frequency
just the fitted curve
12.3612.2412.1212.0011.8811.7611.64
18
16
14
12
10
8
6
4
2
0
50 boards
Frequency
Histogram
= =

16
Types of Measurement Systems Analysis
Continuous DataGage R&R
Attribute DataAttribute Agreement Analysis
Data Scrub MSA

17
How does measurement system error appear?
11010090807060504030
15
10
5
0
Observed
Fre
quen
cy
LSL USL
Actual process variation - No measurement error
Observed process variation - With measurement error
11010090807060504030
15
10
5
0
Process
Fre
quen
cy
LSL USL

18
Can’t really understand the true variation present! And if it isn’t understood, it can’t be fixed.
Why do we care?
LSL USL
Observed process variation - With measurement error
x xxx
A ‘bad’ part can measure
good
A ‘good’ part can measure
bad

19
Possible Sources of Process Variation
Observed Process Variation
Actual Process Variation
Long Term
Short Term
Within Sample
Measurement Variation
Due to instrument
Repeatability
Calibration
Stability
Linearity
Due to operators
11010090807060504030
15
10
5
0
Observed
Fre
quen
cy

20
Possible Sources of Process Variation
Observed Process Variation
Actual Process Variation
Long Term
Short Term
Within Sample
Measurement Variation
Due to instrument
Repeatability
Calibration
Stability
Linearity
Due to operators
11010090807060504030
15
10
5
0
Observed
Fre
quen
cy

21
Observed Process Variation
Actual Process Variation
Long Term
Short Term
Within Sample
Measurement Variation
Due to instrument
Repeatability
Calibration
Stability
Linearity
Due to operators
Possible Sources of Process Variation
11010090807060504030
15
10
5
0
Observed
Fre
quen
cy

22
Observed Process Variation
Actual Process Variation
Long Term
Short Term
Within Sample
Measurement Variation
Due to instrument
Repeatability
Calibration
Stability
Linearity
Due to operators
Possible Sources of Process Variation
‘Repeatability’ and ‘Reproducibility’ are the two main contributors to Measurement System Error – hence ‘Gage R&R’
11010090807060504030
15
10
5
0
Observed
Fre
quen
cy

23
If Measurement System Error always exists, when should we be concerned with it?
-- When it it too large.
Too large compared to what?
-- That depends on what you are using the measurement system for!

24
Gage R&R – case study
• Process: Compressor Machining
• Project: Six Sigma Black Belt ProjectScrap Reduction
$375,000 in scrap / year
Capacity bound
lost margins on lost sales
Considering $1M CAPX
to increase capacity

25
11010090807060504030
15
10
5
0
Observed
Fre
quen
cy
11010090807060504030
15
10
5
0
Process
Fre
quen
cy
LSL USL
Actual
Observed
machined casting
Inspection;CMM – measures to .000001 inch
assembly into compressor
• Define• Measure
• Analyze• Improve• Control
Measurement system improved project complete!

26
Types of Measurement Systems Analysis
Continuous DataGage R&R
Attribute DataAttribute Agreement Analysis
Data Scrub MSA

27
Attribute Measurement Systems
Assessing attribute data often involved judgment … sometimes a little
• “it’s broke / it isn’t” or “it fits / it doesn’t” … sometimes a lot
• “ it dented too bad, scrap it”

28
It all starts with an Operational Definition:
• The ‘spec’• Describes what the defects or categories are• Describes how to perform the appraisal assessment• Used to train those performing the assessment• Should be applied with a high degree of consistency
Attribute Measurement Systems

29
Attribute Agreement Analysis –
case study
• Process: 2” Copper Tube Bending
• Project: Six Sigma Green Belt Project
Scrap Reduction

30
Others
bent wrong
wrong bend program
burned ho
le
unknown
clamp adjustment
hard copper -
2 5/8
not out o
f collet
wrinkles
29 4 5 6 8 914166119.1 2.6 3.3 3.9 5.3 5.9 9.210.540.1
100.0 80.9 78.3 75.0 71.1 65.8 59.9 50.7 40.1
150
100
50
0
100
80
60
40
20
0
Defect
CountPercentCum %
Per
cent
Cou
ntBaseline MeasurementScrap Reason Pareto from

31
Spec = “No Wrinkles”
What’s a wrinkle? How bad is bad?

32
How good are our Operators at assessingif a tube is wrinkled and should not be used?
• Not wrinkled, use it.• Slight wrinkle, use it?• That’s not a wrinkle, it’s a tool mark! Use it?• Not a wrinkle, a stretch mark! Use it?• Wrinkled, scrap it.

33
An Attribute MSA was conducted:
30 Samples 4 Operators 1 ‘Expert’ 2 Trials

34
TedMichaelJimDannyAlbner
100
90
80
70
Appraiser
Pe
rc
en
t
Within Appraiser
Assessment AgreementDate of study:Reported by:Name of product:Misc:
[ , ] 95.0% CI
Percent
‘Expert’!
want 90% level of agreement or higher

35
Spec = “No Wrinkles” – OK!
Would useWould not use?

36
Visual Aid Added
Prep for future new employees...

37
Types of Measurement Systems Analysis
Continuous DataGage R&R
Attribute DataAttribute Agreement Analysis
Data Scrub MSA

38
Sometimes we get our data out of the ‘system’
… is it right?

39
Data Scrub MSA – case study
• Process: Cooling the office• Project: Six Sigma Green Belt Project Reduce Energy Consumption

40
Lessons Learned…

41
An expensive gage does not always
mean good measurements

42
Remember this?
Inspection;CMM – measures to .000001 inch
$145,000 used
Must operate in a environmentally controlled room
Strict procedures on part handling, cleanliness, controlling local conditions, controlling part temperature…

43
A measurement system is more than a gage or a
operational definition
(specification)

44
A continuous variable measurement system is composed of:
• the gage / measuring device• operator techniques• set-up and handling techniques• the environment in which the measurements
are being done (ex. lighting, access)• recording of measurement results

45
Operational Definition
Training of Operators
Application
The Attribute Measurement System
Problems in any of these areas can lead to too high a degree of inconsistent / incorrect assessments

46
Just because a measurement system
has been in use ‘forever’ doesn’t mean
it is very good

47
Attribute MSA – case study
• Process: Invoicing – Application of
appropriate tax
• Project: Six Sigma Black Belt Project Improve DSR
48
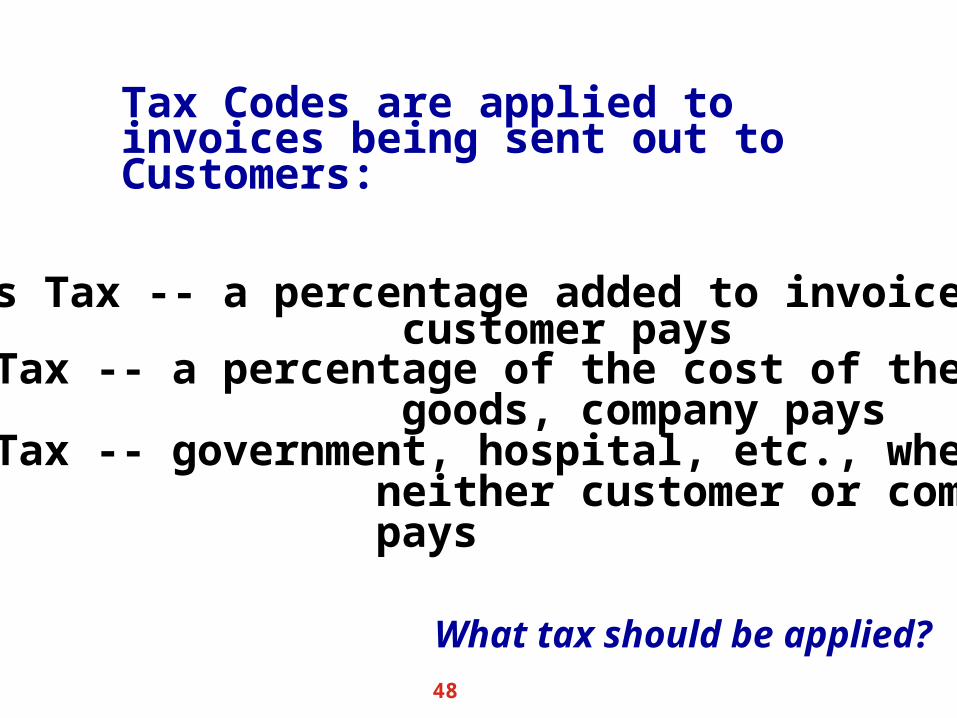
What tax should be applied?
Sales Tax -- a percentage added to invoice, customer paysUse Tax -- a percentage of the cost of the goods, company paysNon-Tax -- government, hospital, etc., where neither customer or company pays
Tax Codes are applied to invoices being sent out to Customers:

49
How good are the Accountants at applying the correct tax code?
(been doing it for years…)

50
An Attribute MSA was conducted:
10 Samples (more would be better) 3 Operators -- who do the job every day 1 ‘Expert’ 2 Trials

51
1 2 3
10
20
30
40
50
60
70
80
90
100
Appraiser
Per
cent
Within Appraiser
1 2 3
10
20
30
40
50
60
70
80
90
100
Appraiser
Per
cent
Appraiser vs Standard
Assessment AgreementDate of study:Reported by:Name of product:Misc:
[ , ] 95.0% CI
Percent

52
1 2 3
10
20
30
40
50
60
70
80
90
100
Appraiser
Per
cent
Within Appraiser
1 2 3
10
20
30
40
50
60
70
80
90
100
Appraiser
Per
cent
Appraiser vs Standard
Assessment AgreementDate of study:Reported by:Name of product:Misc:
[ , ] 95.0% CI
Percent

53
Just because a it came out of the computer doesn’t mean it is
accurate

54
Data Scrub MSA’s – case studies• Focused Management Team monthly
published results

55
Recap
• About Ingersoll Rand• Measurement systems and Measurement
System Error• What is Measurement System Analysis• Types of Measurement Systems Analysis
and examples• Lessons Learned

56

57
Final lesson:You cannot assume you are measuring
well

58
• Measurement error is always present
• You don’t know if it is small enough to ignore unless you assess it!

59
Addendum

60
LSL USL
If using the measurement system to see if the item being measured is within the spec, you want the Measurement System Error (MSE) to be small compared to that spec:
MSE
specification range, or tolerancesampleobservedmeasurements
This..
should be small when compared to this...
The P/T ratio quantifies this...A ratio of MSE to the tolerance range
x

61
LSL USL
If using the measurement system to analyze the variation present or control the process with Statistical Process Control, you want MSE to be small compared to that variation:
MSE
sampleobservedmeasurements
This..
should be small when compared to this...
The %R&R quantifies this...A ratio of MSE to process variation
x

62
Dec. 11, 2012 Professional Development Meeting
TOPIC AREA: MEASUREMENT SYSTEMS
Measurement System Analysis: What is it and why should I care?
SPEAKER – Barry Kulback, Master Black Belt, Six Sigma
For our December Professional Development Meeting we are pleased to have Barry Kulback, Master Black Belt.
Measurement System Analysis (MSA) is an often overlooked critical step in any process improvement process and is the linchpin of Six Sigma’s Measure phase in the DMAIC (Define, Measure, Analyze, Improve, and Control) methodology. This non-technical presentation will review what MSA’s are and why they are important. The major components of measurement error will be discussed along with how measurement error may color your perception of process performance. Examples of the three most common types of MSA’s will be shared along with some lessons learned. Come find out why you should assess your measurement systems the next time you embark on a process improvement journey.

63
Sound interesting? Come join us! We look forward to seeing you! Reserve your place today by clicking here or by emailing [email protected]. DATE: December 11, 2012 PLACE: Holiday Inn Select Opryland Airport/Briley Parkway 2200 Elm Hill Pike Nashville, TN 37214 (615) 883-9770 Click http://www.hinashville.com/directions.html for directions TIME: 5:30 to 8:00 PM COST: $20.00 for Dinner - Free if an unemployed member - bring your resume You do not need to be an APICS member to attend Remember! Attend Four (4) APICS Nashville Professional Development Meetings from September 2012 thru April 2013 (excluding Tours) and attend the 5th PDM free! New members to our chapter attend their first meeting at no charge when they bring their APICS welcome letter! Reserve your place today by clicking here or by emailing [email protected]. Stay Informed! Click to Join our LinkedIn group APICS Middle Tennessee Chapter Nashville

64
Speaker Bio:
Barry Kulback’s 33 year professional career has been entirely with Trane/American Standard now Ingersoll Rand. He is currently the Global Lean Six Sigma leader for the Climate Solutions Sector of Ingersoll Rand and very engaged in IR’s Lean Transformation. He gained his BS in 1979 at Austin Peay State University majoring in Physics and minoring in Computer Science. After spending 20 years in Information Technology Barry joined Operations as a Six Sigma Black Belt and progressed to a certified Six Sigma Master Black Belt in 2004. He was named Tennessee Academy of Science’s Industrial Scientist of the year in 2006 and is the holder of 4 patents related to algorithms for delivering to customer request by optimizing the match of demand to supply. He maintains his membership in the American Society for Quality as a Senior Member. Reserve your place today by clicking here or by emailing [email protected]. Stay Informed! Click to Join our LinkedIn group APICS Middle Tennessee Chapter Nashville Thank you for your support of APICS.

65
Bring
• 1 copper tube• 1 measuring tape• PC• Remote mouse• Backup – on data stick, on disk• Pad, pen to take notes re parking lot• 45-50 minutes, leaving 10-15 minutes at
the end for question/answer

66
Title
• Topic• Sub-topic
• Sub-sub-topic• Sub-topic
• Sub-sub-topic• Sub-sub-topic

67
SERVICES / CONTROLS TRANSPORT REFRIGERATION
Broad and Global Portfolio of HVAC Systems and Services Broad and Global Portfolio of HVAC Systems and Services
Vision To make building owner and transport customers more profitable and
efficient for life through innovative HVACR systems and services
Vision To make building owner and transport customers more profitable and
efficient for life through innovative HVACR systems and services