Embed Size (px)
Citation preview

Measurement Systems
Analysis

Since measurement systems represent a
subprocess within a process…
• They are subject to Variation.
• What could be the source of this variation?
• Why do Measurements Vary?
Possible Sources of Process Variation
Long-term
Process Variation
Short-term
Process Variation
Variation
w/i sample
Actual Process Variation
Stability LinearityRepeatability Accuracy
Variation due
to gage
Variation due
to operators
Measurement Variation
Observed Process Variation
Reproducibility
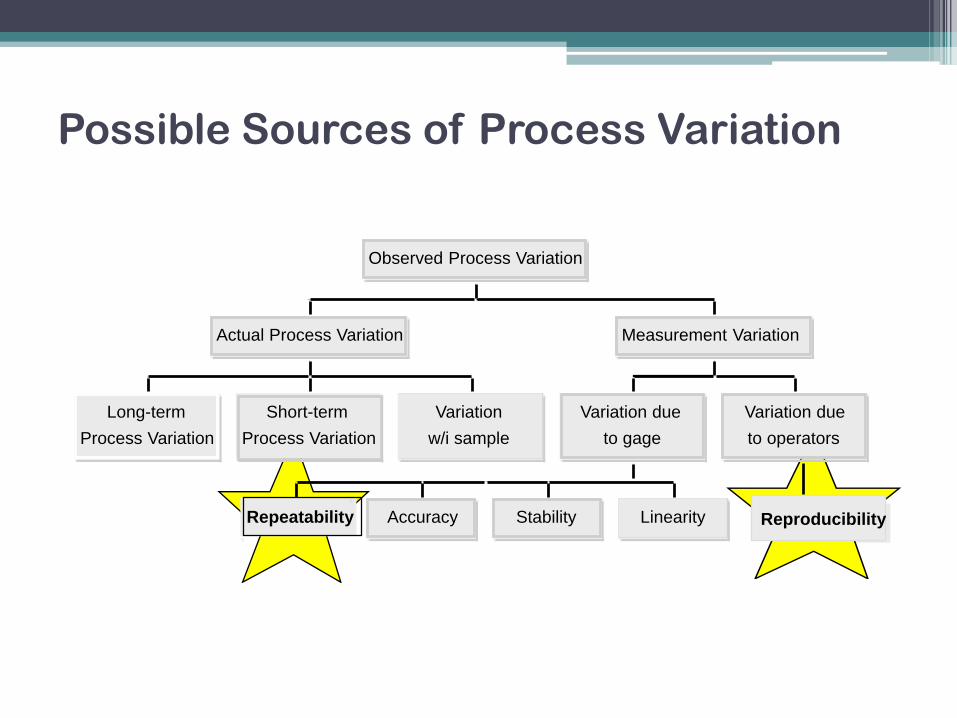
4Sources of Variation
Product Variability
(Actual variability)
Measurement
Variability
Total Variability
(Observed variability)

5Definitions
• Bias the difference between the average measured value
and a reference value
Reference value – agreed-upon standard, such as a
standard traceable to a national standards body
Attribute inspection: the ability of the attribute
inspection system to produce agreement on
inspection standards
Controlled by calibration - process of comparing
measurements to standards

Bias = accuracy
ObservedAverage Value
ReferenceValue

Some reasons for excessive bias:
• Instrument needs recalibrating
• Worn equipment
• Damaged master
• Improper calibration
• Temperature
• Humidity
• Cleanliness

8Example
• A standard with a known value of 25.4 is
checked 10 times by one mechanical inspector
using a dial caliper with a resolution of 0.025
mm. The readings obtained are:
25.425 25.425 25.400 25.400 25.375 25.400 25.425 25.400 25.425 25.375
If this measurement system were to be used on a
process with a tolerance of ±0.25mm, determine
and interpret the bias.

9Definitions
• Repeatability Variation in measurements obtained with one
measurement instrument when used several times by
one appraiser, while measuring the identical
characteristic on the same part
Variation obtained when the measurement system is
applied repeatedly under the same conditions is
usually caused by conditions inherent in the
measurement system
Similar to precision

10Definitions
• Reproducibility Variation in the average of the measurements made
by different appraisers using the same measuring
instrument when measuring the identical
characteristic on the same part
Appraiser variation

11Definitions
• Stability Total variation in the measurements obtained with a
measurement system on the same master or parts
when measuring a single characteristic over an
extended time period
A system is said to be stable if the results are the
same at different points in time
Also known as “drift”

12Definitions
• Linearity The difference in the bias values through the
expected operating range of the gage
measure of the consistency of Bias over the range of
the measurement device

13Measurement System Discrimination
• Discrimination/Resolution The ability of the measurement system to divide
measurements into “data categories”
Example: Resolution – 0.001 inch
1.0002, 1.0003, 0.9997
A measurement system should be able to divide the
region of interest into at least five data categories
When unacceptable discrimination exists, the range
chart shows discrete “jumps” or “steps”

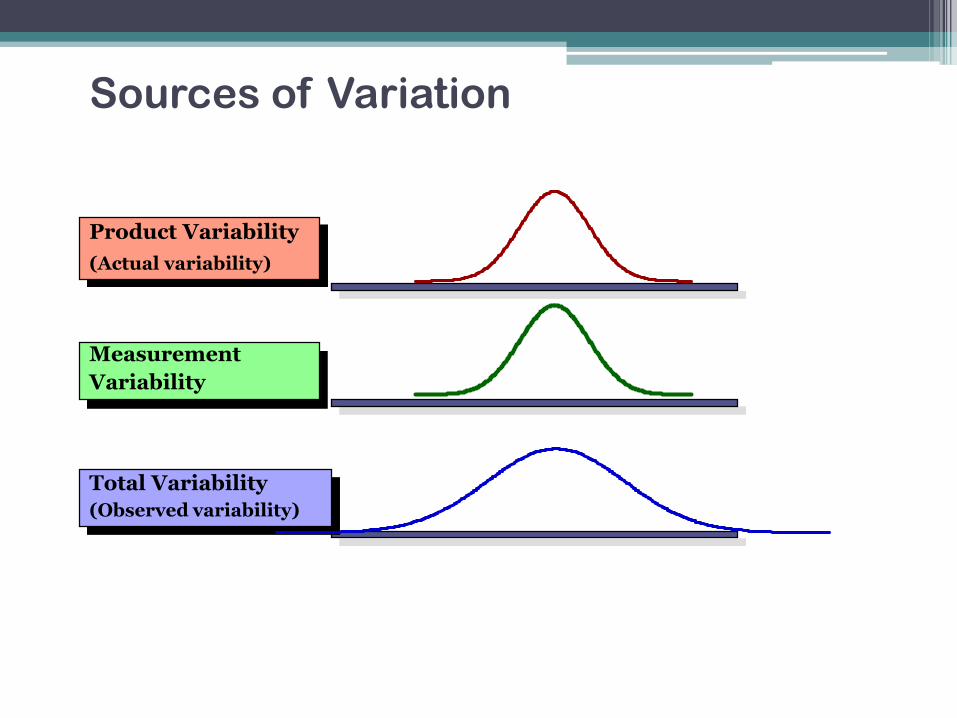
Gage and Measurement Systems Capability Analysis
Total Variability = Variability in the Product + Measurement Error
222
gageproducttotal
• Determine how much of the observed variability is due to the gauge
or measurement system
• Isolate the components of variability in the measurement system
• Assess whether the gauge is capable (suitable for the intended
application)

Gage and Measurement Systems Capability Analysis
Example:
An instrument is to be used as part of a proposed SPC
implementation. The quality improvement team involved in designing
the SPC system would like to get an assessment of gage capability.
Twenty units of the product are obtained, and the process operator
who will actually take the measurements for the control chart uses
the instrument to measure each unit of product twice.
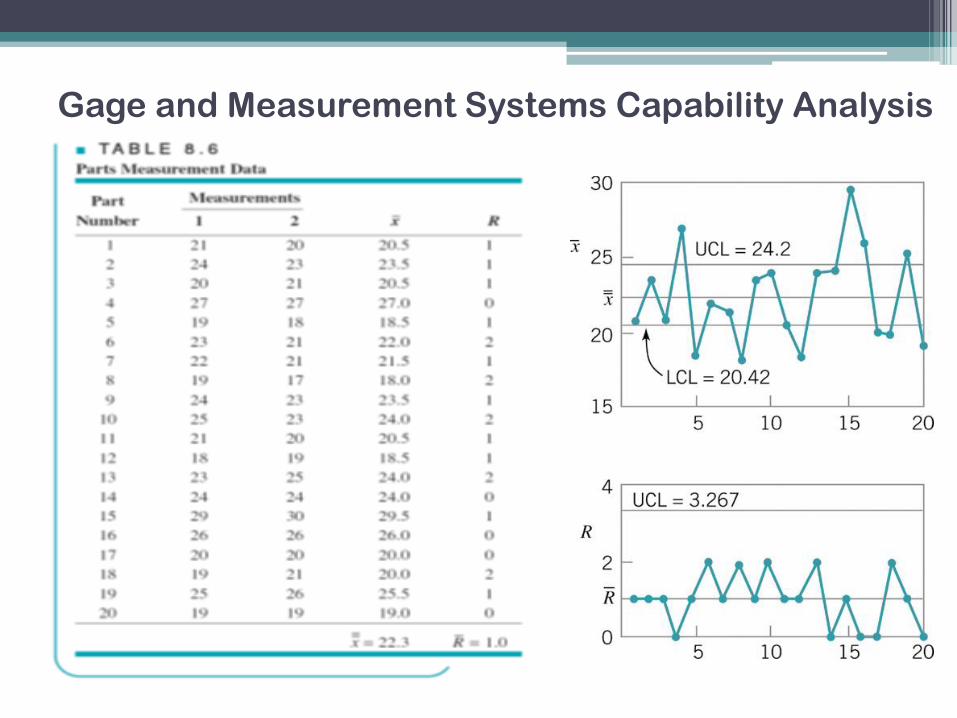
Gage and Measurement Systems Capability Analysis

Gage and Measurement Systems Capability Analysis
chartx Shows the discriminating power of the instrument,
that is, the ability of the gage to distinguish between
units of product
Rchart • Shows the magnitude of measurement error, gage
capability
• in control R chart – operator having no difficulty in
making consistent measurements
• out of control R chart – operator having difficulty
using the instrument
gage3 Range in the variation of the individual measurement
due to gage error

Gage and Measurement Systems Capability Analysis
• Estimating the Variance Components
• Other measures of Gage Capability
• Signal-to-Noise Ratio (>5, capable)
• Discrimination Ratio (>4, capable)
2
2
total
product
product
2
2
total
gage
M
p
pSNR
1
2
p
pDR
1
1

Gage and Measurement Systems Capability Analysis
• Other measures of Gage Capability
• P/T (<0.1, capable)
LSLUSLTP
gauge
6/

Gage Repeatability and Reproducibility (GR&R)
• Components of Measurement Error
• Reproducibility - variability due to different operators using the
gauge (or different time periods, or different environments, or in
general, different conditions)
• Repeatability - basic inherent precision of the gauge itself
2222
ilityreproducibityrepeatabilgaugeterrormeasuremen
• G R&R study - an experiment used to measure the components of
2
gauge

Gage Repeatability and Reproducibility (GR&R)
• G R&R Studies are usually conducted with Factorial Experiments
If there are a randomly selected parts and b randomly selected
operators, and each operator measures every part n time, then
the measurements ( i = part, j = operator, k = measurement) could
be represented by the model
nk
oj
pi
POOPy ijkijjiijk
,...,2,1
,...,2,1
,...,2,1
)(
Random effects
model of The
ANOVA
• Variance of any observations
2222)( POOPijkyV

Gage Repeatability and Reproducibility (GR&R)
ErrorPxOOPTotal SSSSSSSSSS
1
p
SSMS
p
P
1
o
SSMS o
o
)1(
npo
SSMS Error
Error
)1)(1(
op
SSMS PO
PO
i j k ijkT
N
GrandTotalxSS
22 )(
N
GrandTotal
on
xSS
p
i
o
j
n
k i
p
22
.. )(
N
GrandTotal
pn
xSS
p
i
o
j
n
k j
O
22
.. )(
N
GrandTotalSSSS
n
xSS OP
p
i
o
j
n
k ij
PO
22
. )(

Gage Repeatability and Reproducibility (GR&R)
• Estimation of the variance components
ErrorMS2̂
n
MSMS ErrorPOPO
2̂
pn
MSMS POOO
2̂
on
MSMS POPP
2̂

GR&R Example

GR&R Example

GR&R Example
• Reproducibility - sum of the operator and operator x part variance
components
• Repeatability - 2
)( 22
PxOO
2222
POOgauge
Evaluate the adequacy of the measuring instrument in the Thermal
Impedance Example if LSL = 18 and USL = 58.
Attribute Gauge Capability
• Sometimes the output of a gauge isn’t numerical – it’s just pass/fail
• Nominal or ordinal data is also common
• Occurs frequently in service businesses
• Common situation – do operating personnel consistently make the same decisions regarding the units they are inspecting or analyzing?
• Example – a bank uses manual underwriting of mortgage loans
• The underwriter uses information to classify the applicant into one of four categories; decline or category 1, 2, 3 – categories 2 & 3 are low-risk and 1 is high risk
• Compare underwriters performance relative to a “consensus” evaluation determined by a panel of “experts”

Attribute Gauge Capability
Thirty applicants,
three underwriters
Each underwriter
evaluates each
application twice
The applications
are “blinded” by
removing names,
SSNs, addresses,
and other
identifying
information

Attribute Gauge Capability
• Determine the proportion of time that the underwriter agrees with
him/herself – this measures repeatability
• Determine the proportion of time that the underwriter agrees with
the correct classification – this measures bias
• Determine the proportion of time that all the underwriters agree on
classification – this measures reproducibility
• Minitab performs the analysis – using the attribute agreement
analysis routine

Attribute Gauge Capability