Embed Size (px)
Citation preview
Implementing Expanded Gage R&R Studies to
Improve Quality and Productivity
ASQ & 5th Continual Improvement & Innovation Symposium 2013
Dubai, November 13 -14, 2013
Louis A. Johnson
Sr Training Specialist & Mentor
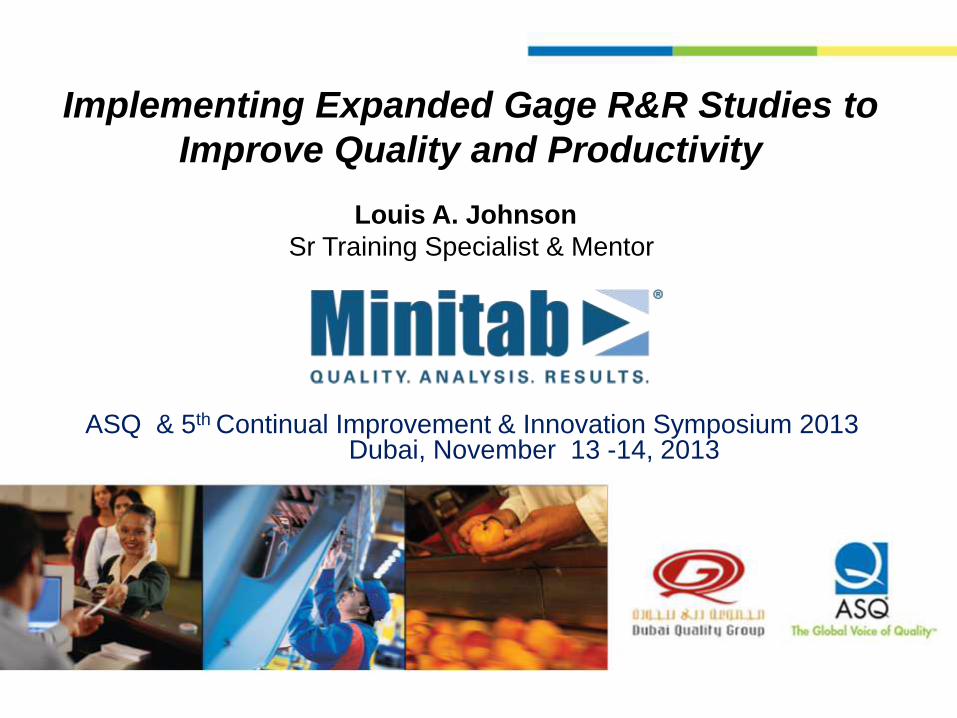
Implementation of Gage R&R at Sherwin-Williams
2
67%
82%
10 parts X 3 Operators X 2 Repeats
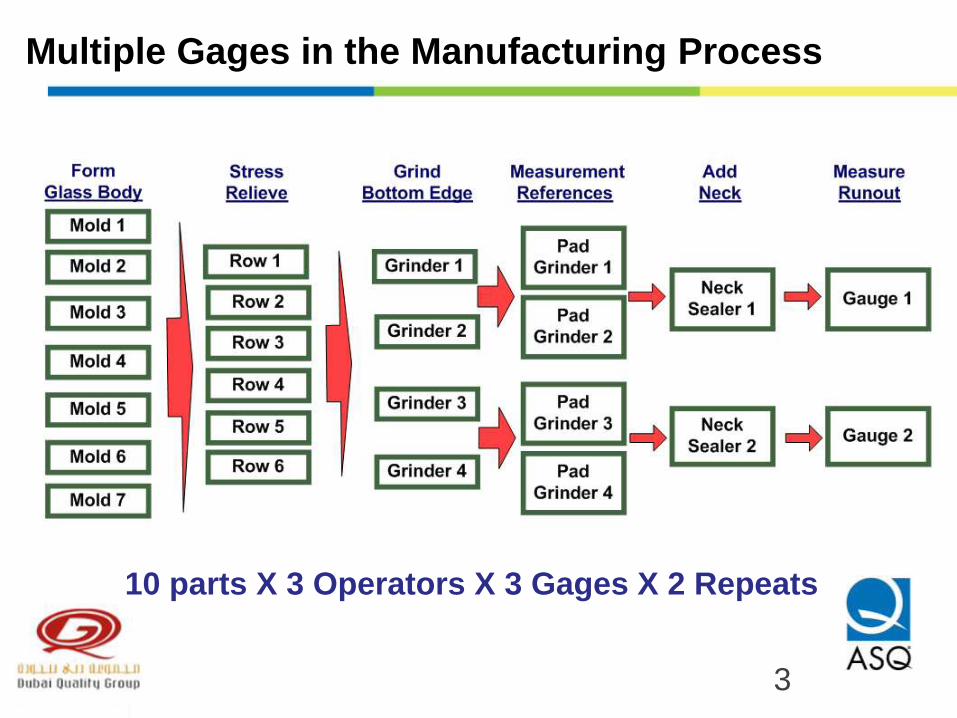
Multiple Gages in the Manufacturing Process
3
10 parts X 3 Operators X 3 Gages X 2 Repeats
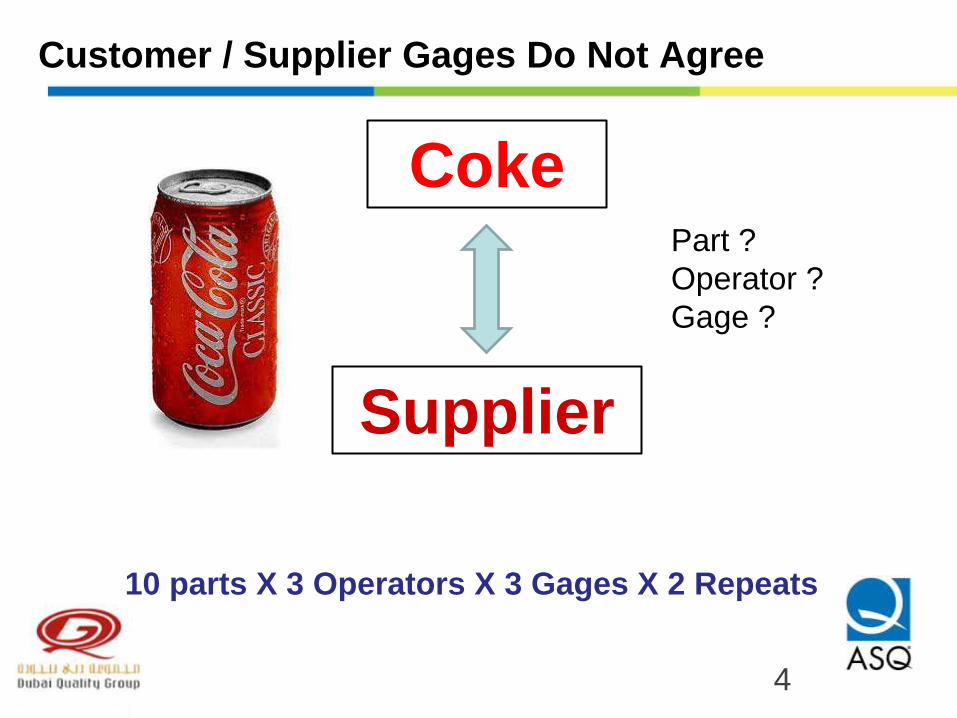
Customer / Supplier Gages Do Not Agree
4
10 parts X 3 Operators X 3 Gages X 2 Repeats
Coke
Supplier
Part ?
Operator ?
Gage ?
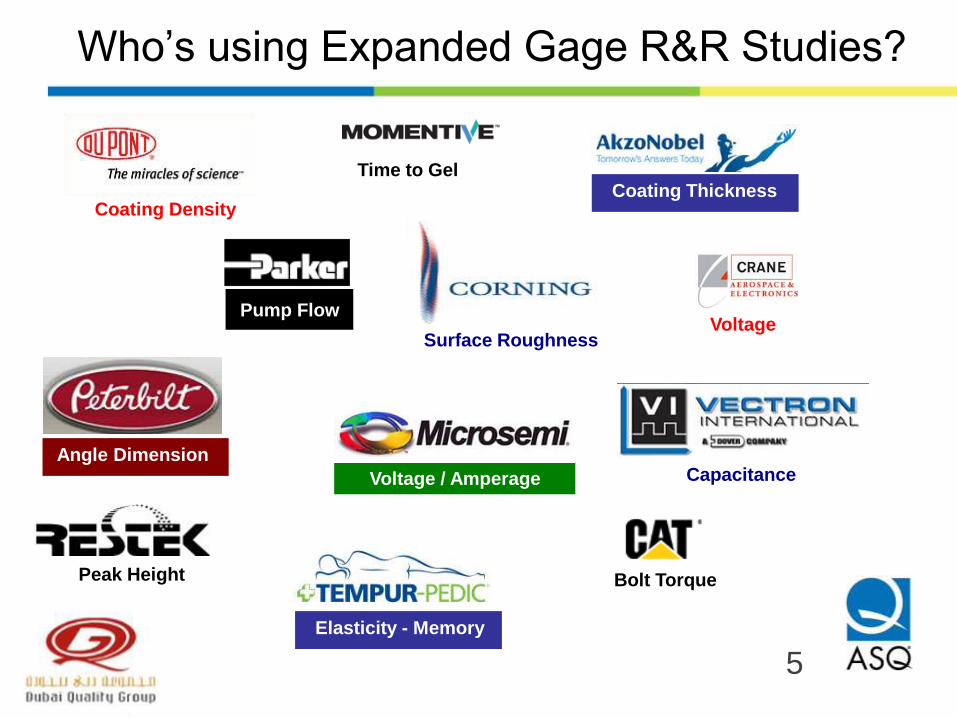
Surface Roughness
5
Coating Thickness
Voltage / Amperage
Time to Gel
Coating Density
Who’s using Expanded Gage R&R Studies?
Pump Flow Voltage
Bolt Torque
Capacitance
Peak Height
Elasticity - Memory
Angle Dimension
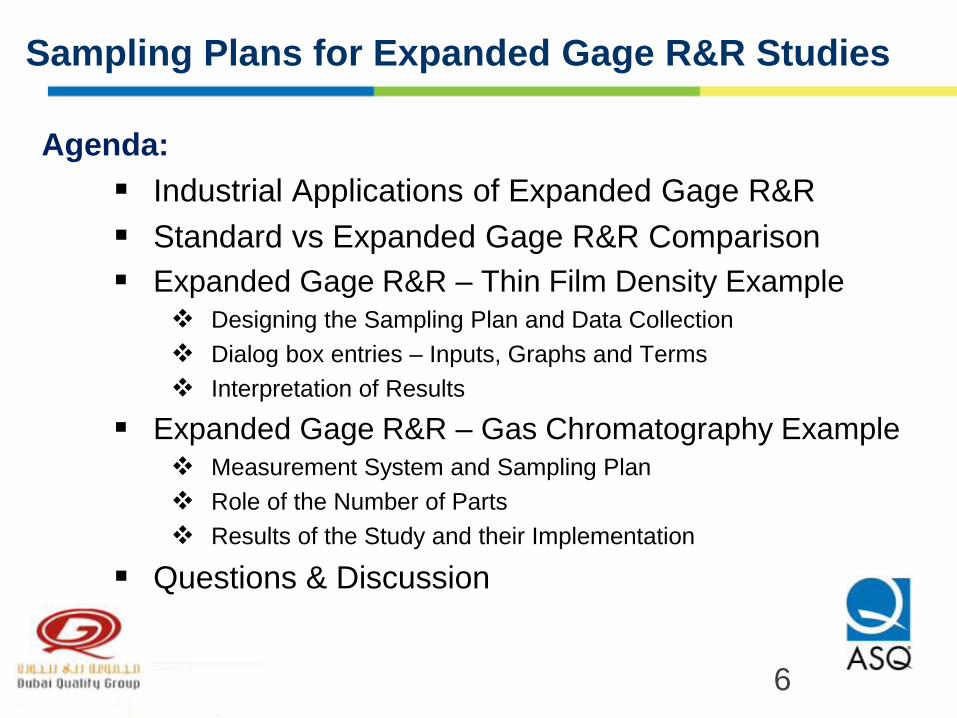
Sampling Plans for Expanded Gage R&R Studies
Agenda:
Industrial Applications of Expanded Gage R&R
Standard vs Expanded Gage R&R Comparison
Expanded Gage R&R – Thin Film Density Example
Designing the Sampling Plan and Data Collection
Dialog box entries – Inputs, Graphs and Terms
Interpretation of Results
Expanded Gage R&R – Gas Chromatography Example
Measurement System and Sampling Plan
Role of the Number of Parts
Results of the Study and their Implementation
Questions & Discussion
6
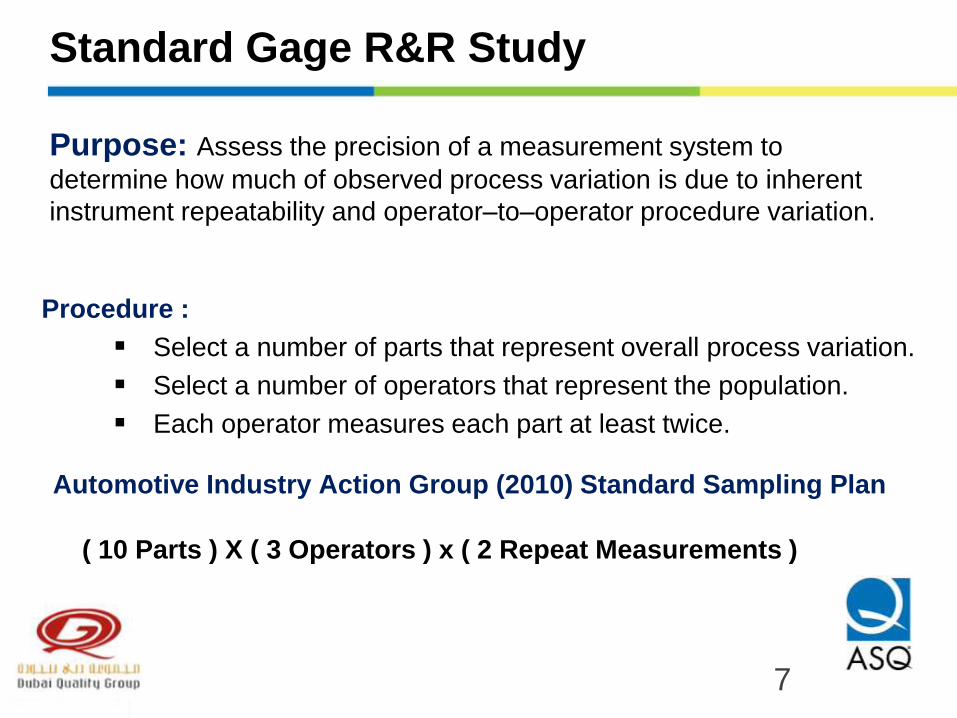
Standard Gage R&R Study
Procedure :
Select a number of parts that represent overall process variation.
Select a number of operators that represent the population.
Each operator measures each part at least twice.
Purpose: Assess the precision of a measurement system to
determine how much of observed process variation is due to inherent
instrument repeatability and operator–to–operator procedure variation.
Automotive Industry Action Group (2010) Standard Sampling Plan
( 10 Parts ) X ( 3 Operators ) x ( 2 Repeat Measurements )
7
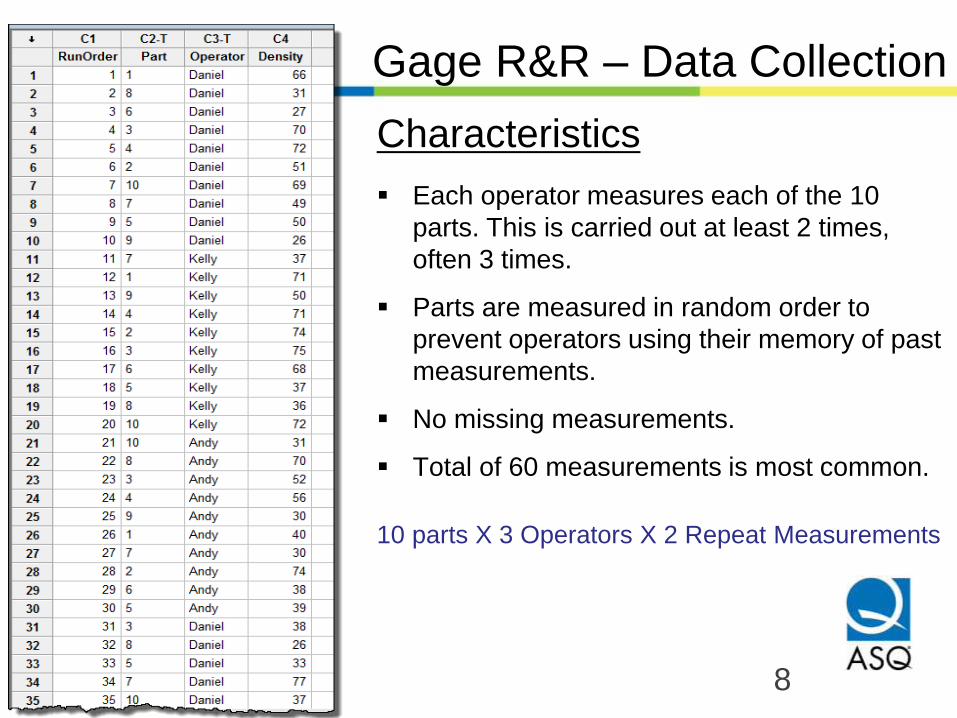
Gage R&R – Data Collection
Characteristics
Each operator measures each of the 10
parts. This is carried out at least 2 times,
often 3 times.
Parts are measured in random order to
prevent operators using their memory of past
measurements.
No missing measurements.
Total of 60 measurements is most common.
10 parts X 3 Operators X 2 Repeat Measurements
8
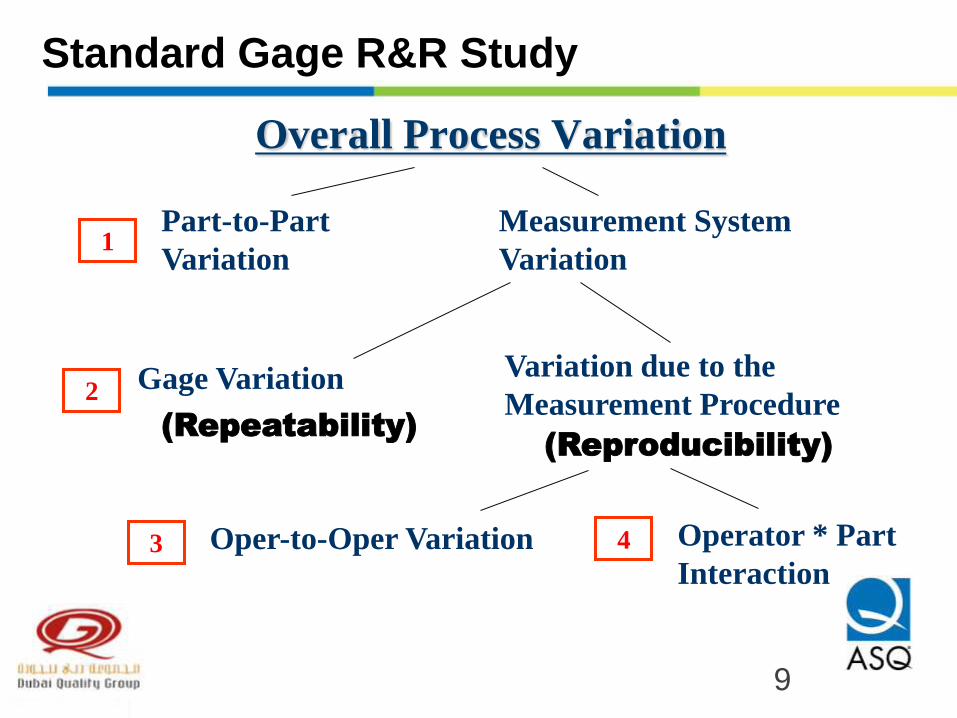
Overall Process Variation
Part-to-Part
Variation
Measurement System
Variation
Gage Variation Variation due to the
Measurement Procedure
Oper-to-Oper Variation Operator * Part
Interaction 3
2
1
4
(Repeatability) (Reproducibility)
Standard Gage R&R Study
9
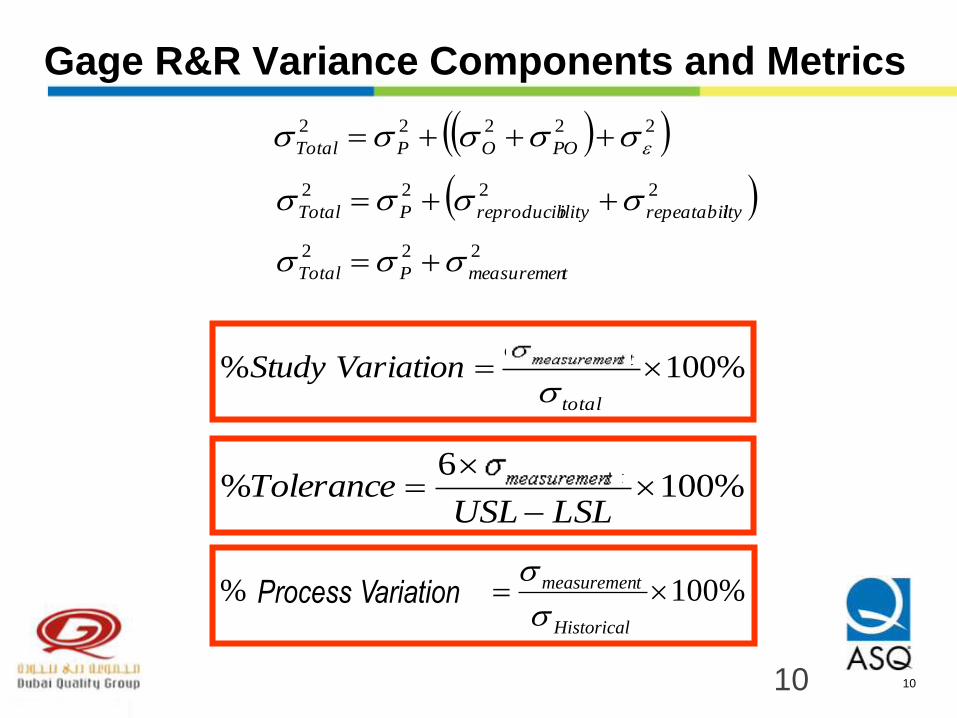
Gage R&R Variance Components and Metrics
222
tmeasuremenPTotal
2222
ityrepeatabililityreproducibPTotal
22222
POOPTotal
%100% total
tmeasuremenVariationStudy
%100 6
%
LSLUSLTolerance tmeasuremen
10
%100Pr% Historical
tmeasuremenVariationocess
10
Process Variation
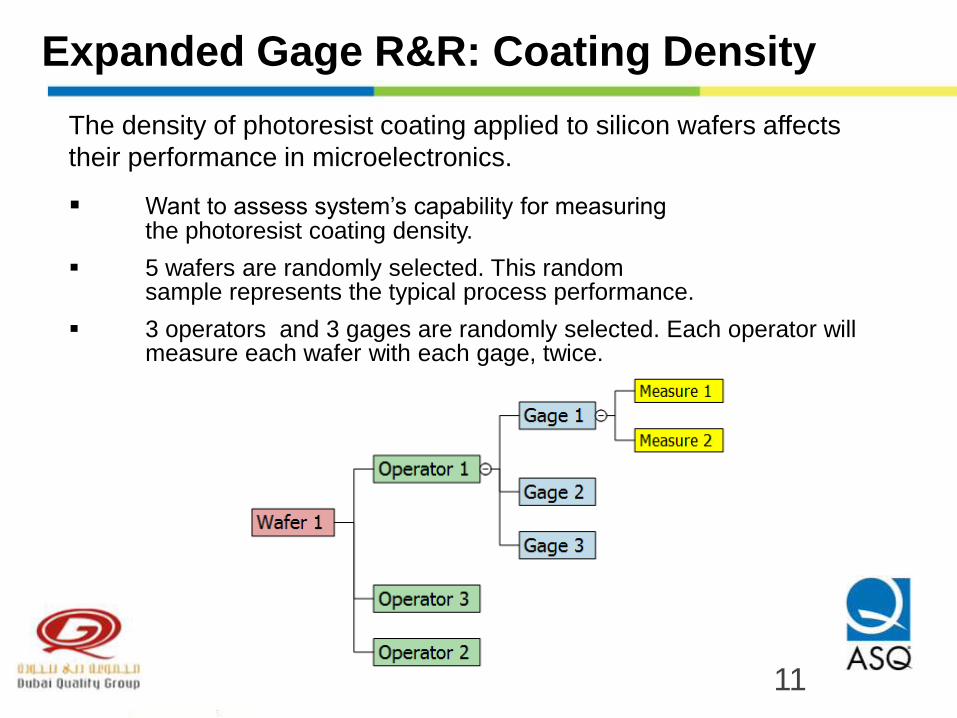
Expanded Gage R&R: Coating Density
The density of photoresist coating applied to silicon wafers affects
their performance in microelectronics. Want to assess system’s capability for measuring the photoresist coating density. 5 wafers are randomly selected. This random sample represents the typical process performance. 3 operators and 3 gages are randomly selected. Each operator will
measure each wafer with each gage, twice.
11
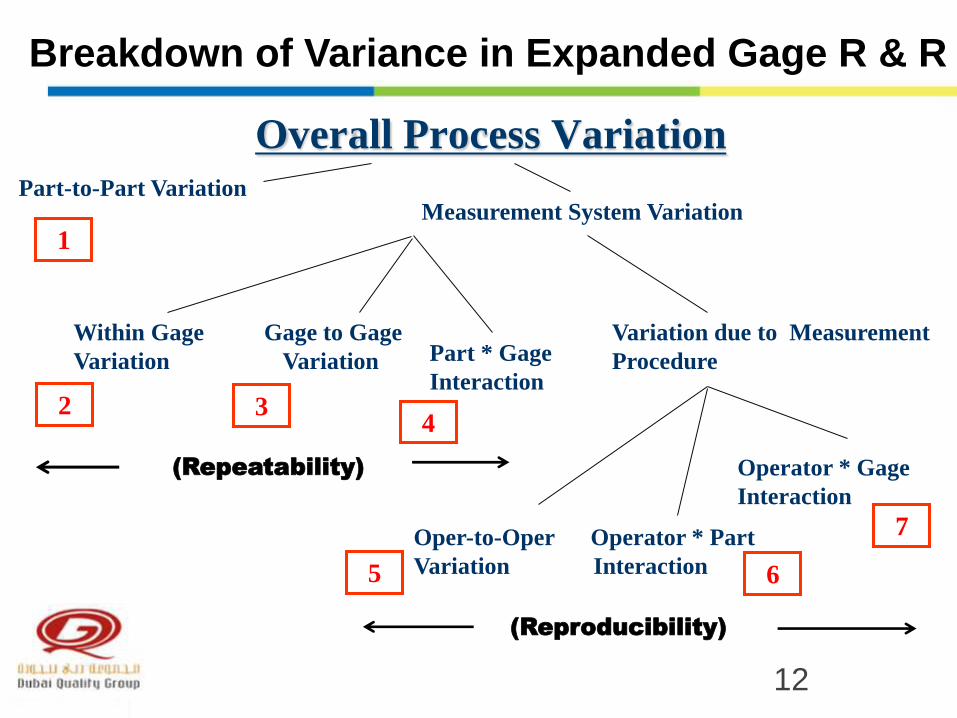
Overall Process Variation
Part-to-Part Variation Measurement System Variation
Within Gage Gage to Gage
Variation Variation
Variation due to Measurement
Procedure
Oper-to-Oper Operator * Part
Variation Interaction 5
2
1
3
(Repeatability)
(Reproducibility)
Breakdown of Variance in Expanded Gage R & R
6
Operator * Gage
Interaction
Part * Gage
Interaction
7
4
12
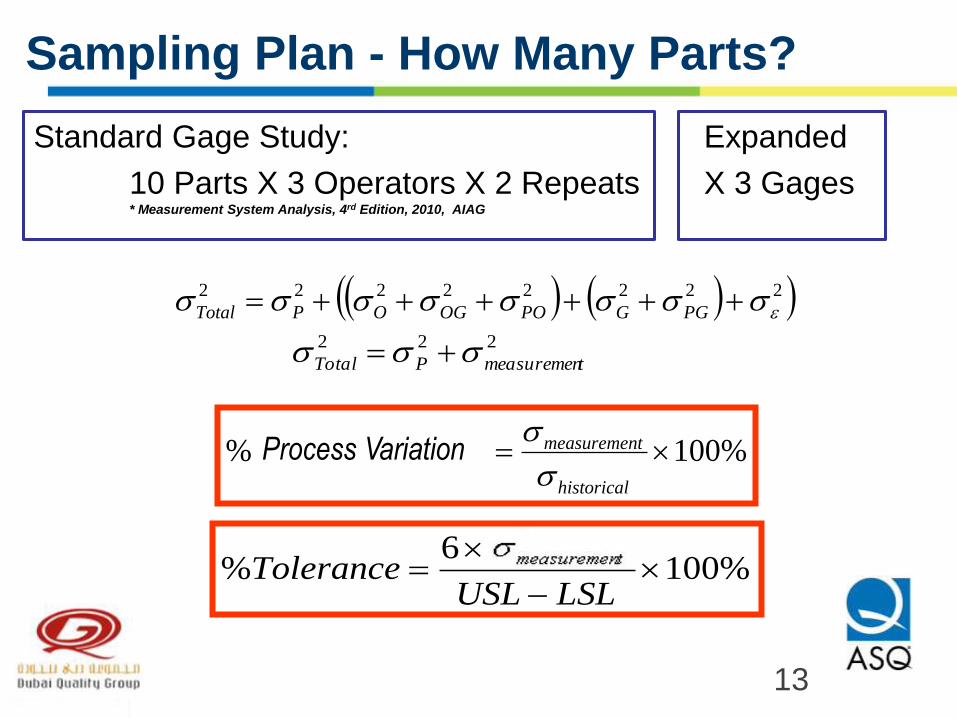
Sampling Plan - How Many Parts?
Standard Gage Study: Expanded
10 Parts X 3 Operators X 2 Repeats X 3 Gages * Measurement System Analysis, 4rd Edition, 2010, AIAG
22222222
PGGPOOGOPTotal
222
tmeasuremenPTotal
%100Pr% historical
tmeasuremenVariationocess
%100 6
%
LSLUSLTolerance tmeasuremen
13
Process Variation
Expanded Gage R&R allows additional factors such as
gage, laboratory or location to be evaluated.
Interactions of the additional factor(s) with Operator and
Part can be also be assessed.
The Expanded Gage R&R Study allows analysis of the
data even if there are missing data points.
The data collection plan will commonly be adjusted for
the Expanded Gage R&R because repeating the
standard plan for each level of the additional factors will
typically exceed the budget. Reducing the number of
Parts is common.
14
Standard vs Expanded Gage R&R

Expanded Gage R&R: Coating Density
The density of photoresist coating applied to silicon wafers affects
their performance in microelectronics. Want to assess system’s capability for measuring the photoresist coating density. 5 wafers are randomly selected. This random sample represents the typical process performance. 3 operators and 3 gages are randomly selected. Each operator will
measure each wafer with each gage, twice.
15
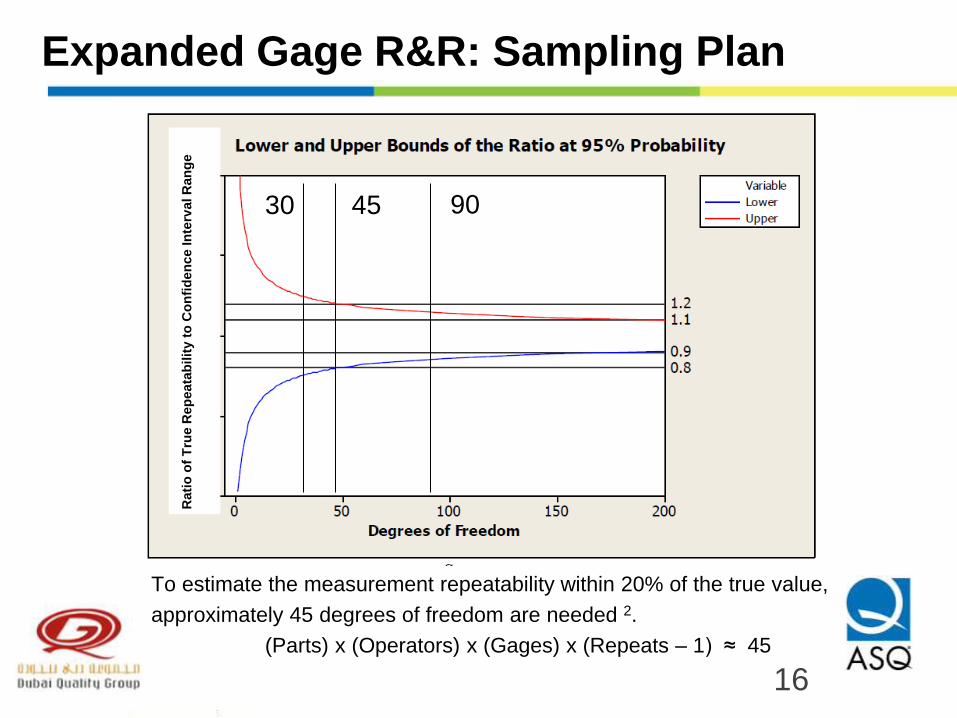
Expanded Gage R&R: Sampling Plan
To estimate the measurement repeatability within 20% of the true value,
approximately 45 degrees of freedom are needed 2.
(Parts) x (Operators) x (Gages) x (Repeats – 1) ≈ 45
Rati
o o
f T
rue R
ep
eata
bilit
y t
o C
on
fid
en
ce In
terv
al R
an
ge
30 45 90
16
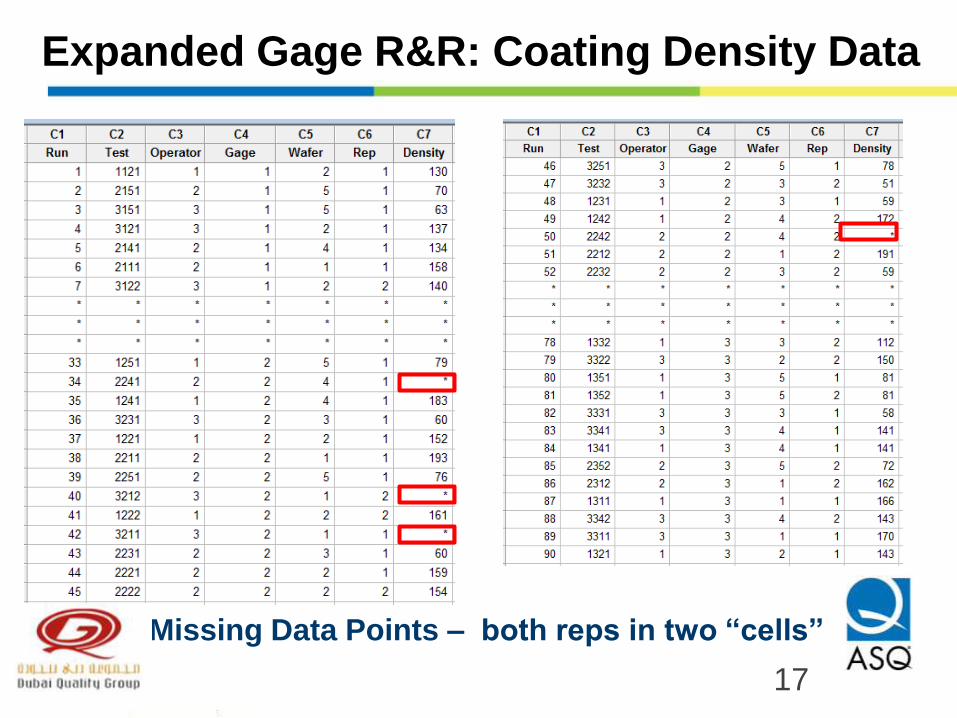
Expanded Gage R&R: Coating Density Data
4 Missing Data Points – both reps in two “cells”
17
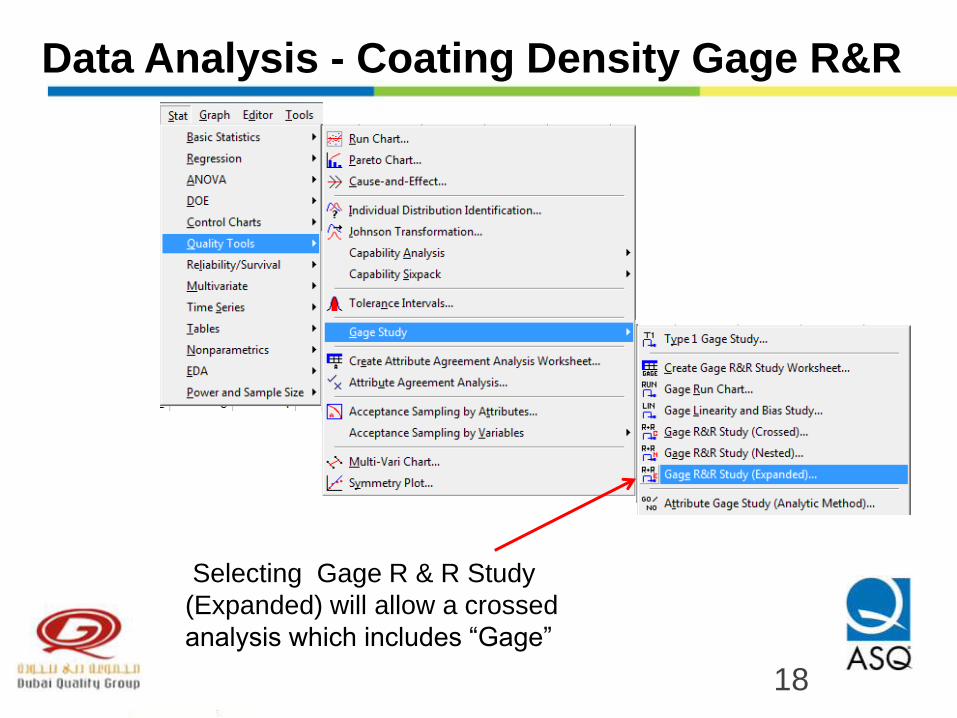
Data Analysis - Coating Density Gage R&R
Selecting Gage R & R Study
(Expanded) will allow a crossed
analysis which includes “Gage”
18
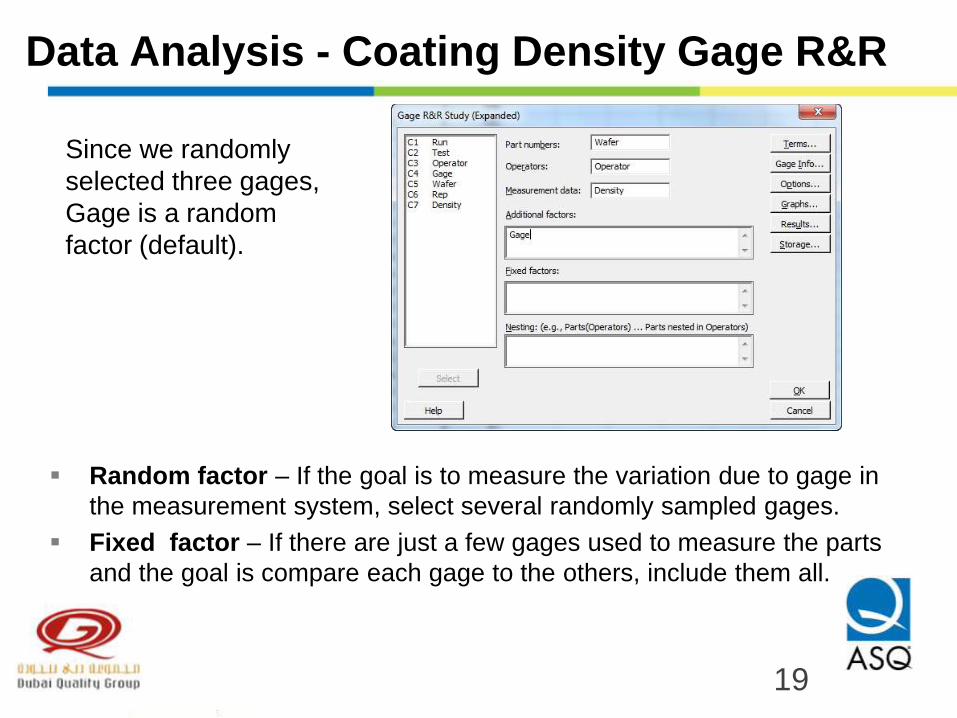
Data Analysis - Coating Density Gage R&R
Since we randomly
selected three gages,
Gage is a random
factor (default).
Random factor – If the goal is to measure the variation due to gage in
the measurement system, select several randomly sampled gages.
Fixed factor – If there are just a few gages used to measure the parts
and the goal is compare each gage to the others, include them all.
19
Data Analysis - Coating Density Gage R&R
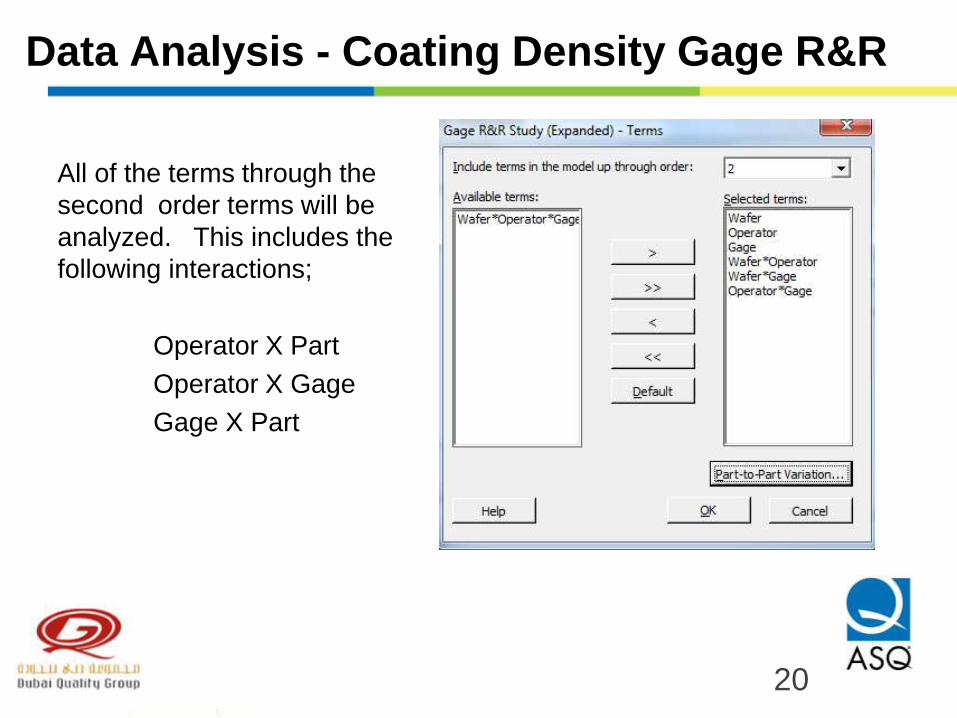
All of the terms through the
second order terms will be
analyzed. This includes the
following interactions;
Operator X Part
Operator X Gage
Gage X Part
20
Data Analysis - Coating Density Gage R&R
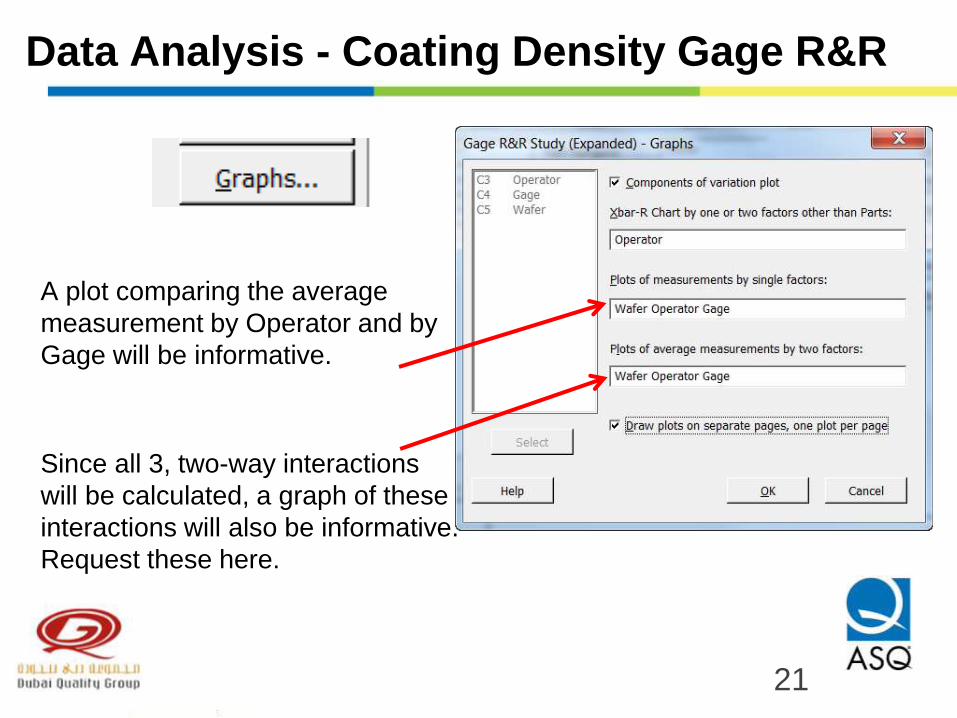
A plot comparing the average
measurement by Operator and by
Gage will be informative.
Since all 3, two-way interactions
will be calculated, a graph of these
interactions will also be informative.
Request these here.
21
Results - Coating Density Gage R&R
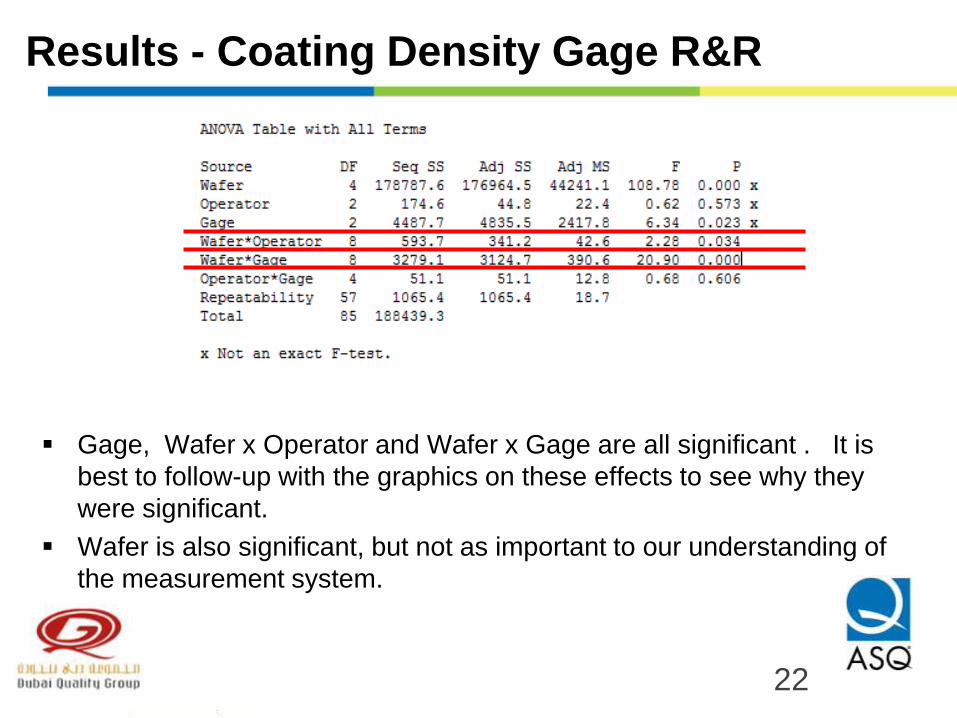
Gage, Wafer x Operator and Wafer x Gage are all significant . It is
best to follow-up with the graphics on these effects to see why they
were significant.
Wafer is also significant, but not as important to our understanding of
the measurement system.
22
Results - Coating Density Gage R&R
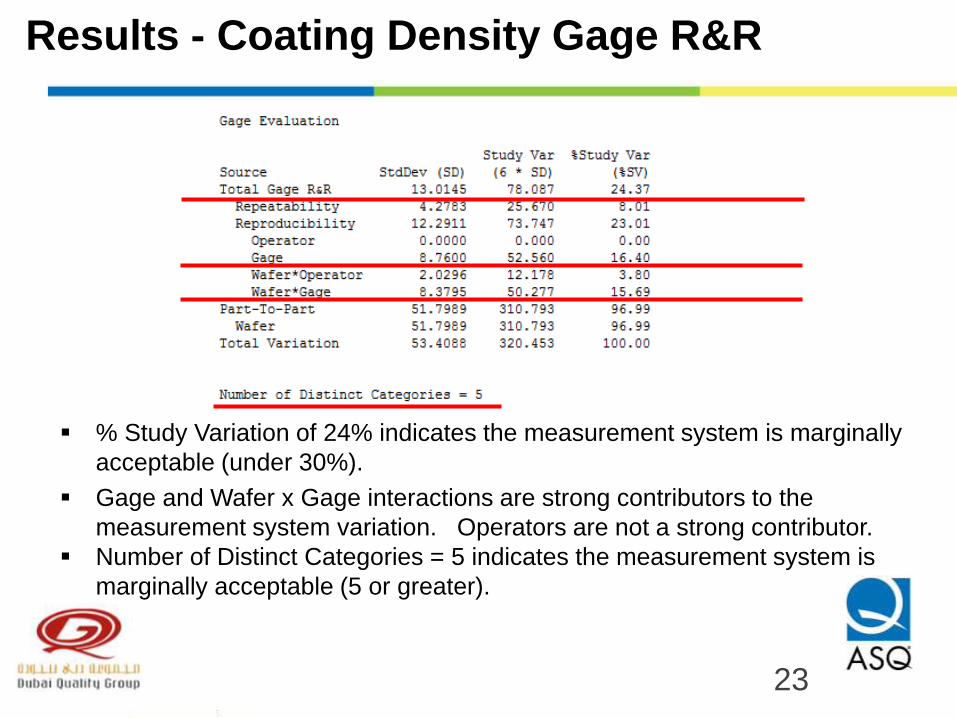
% Study Variation of 24% indicates the measurement system is marginally
acceptable (under 30%).
Gage and Wafer x Gage interactions are strong contributors to the
measurement system variation. Operators are not a strong contributor.
Number of Distinct Categories = 5 indicates the measurement system is
marginally acceptable (5 or greater).
23
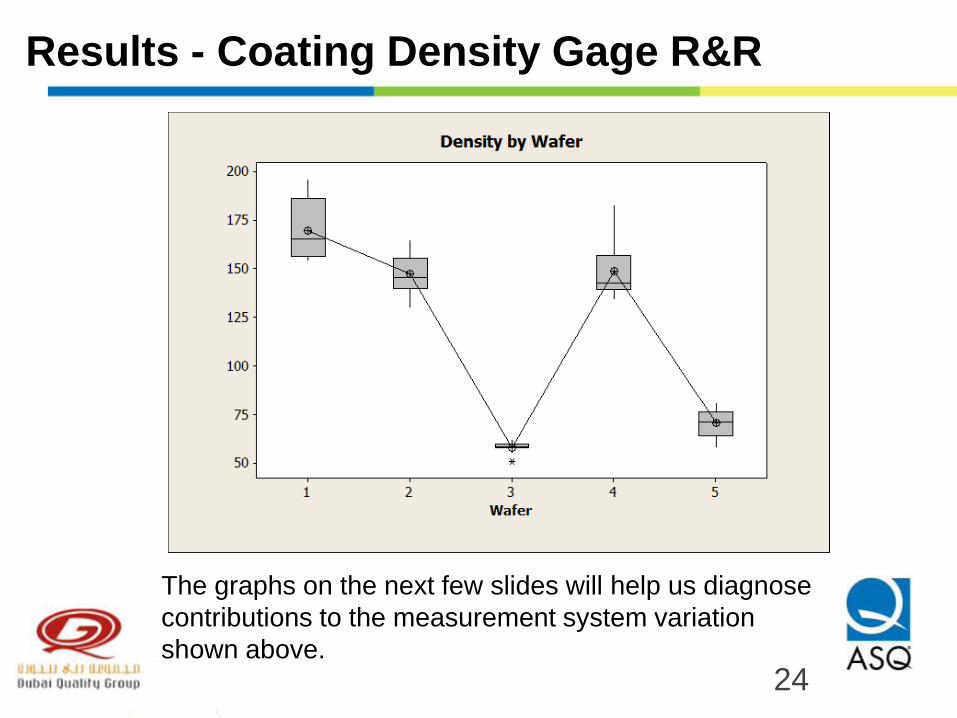
Results - Coating Density Gage R&R
The graphs on the next few slides will help us diagnose
contributions to the measurement system variation
shown above.
24
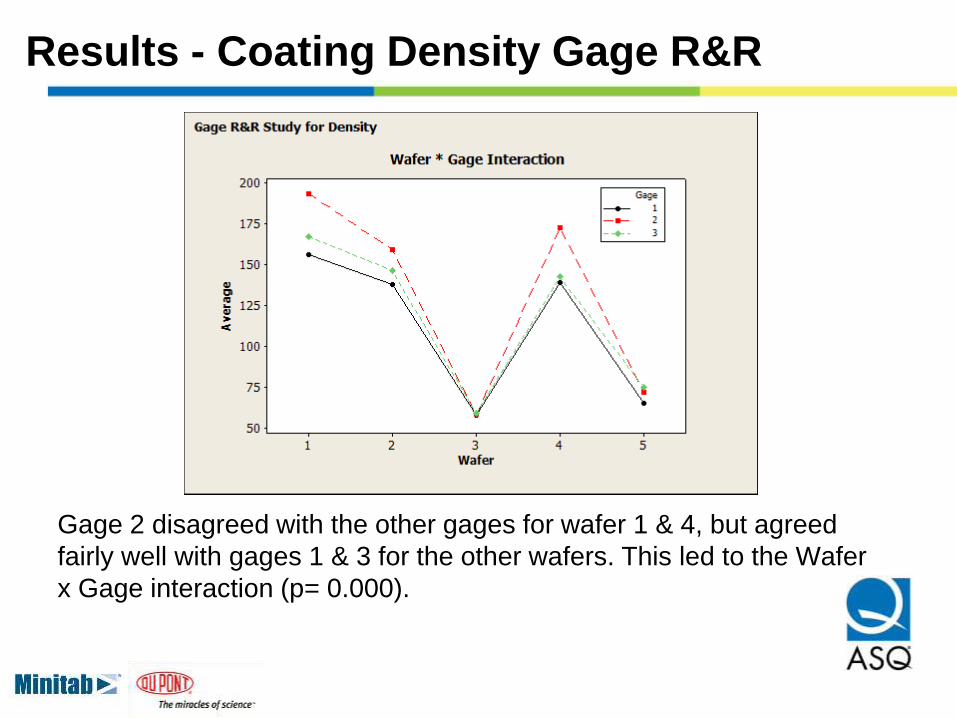
Results - Coating Density Gage R&R
Gage 2 disagreed with the other gages for wafer 1 & 4, but agreed
fairly well with gages 1 & 3 for the other wafers. This led to the Wafer
x Gage interaction (p= 0.000).
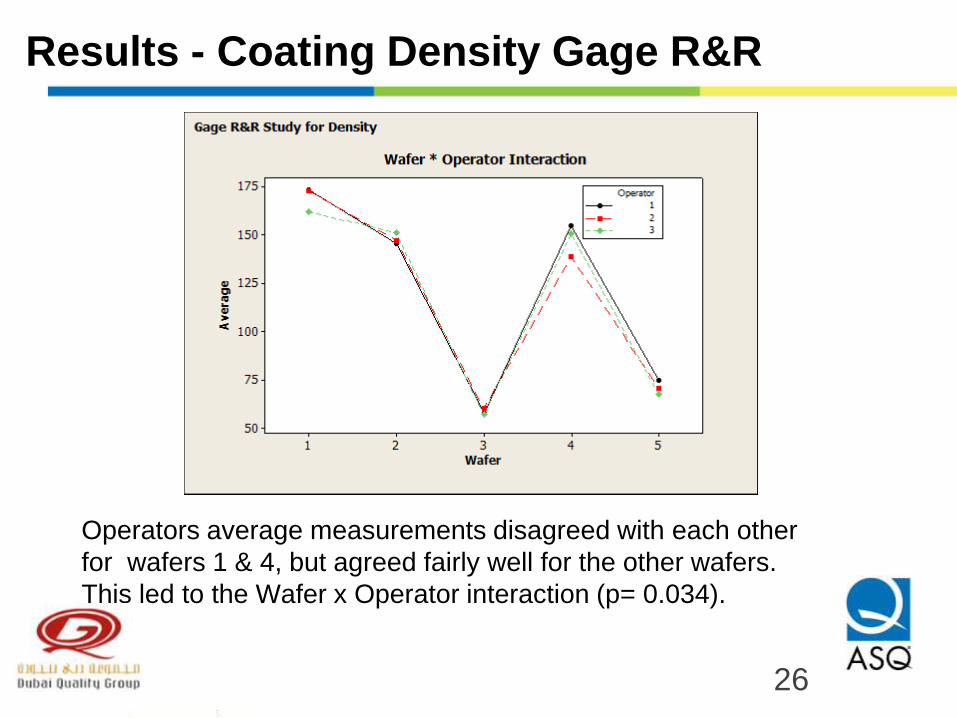
Results - Coating Density Gage R&R
Operators average measurements disagreed with each other
for wafers 1 & 4, but agreed fairly well for the other wafers.
This led to the Wafer x Operator interaction (p= 0.034).
26
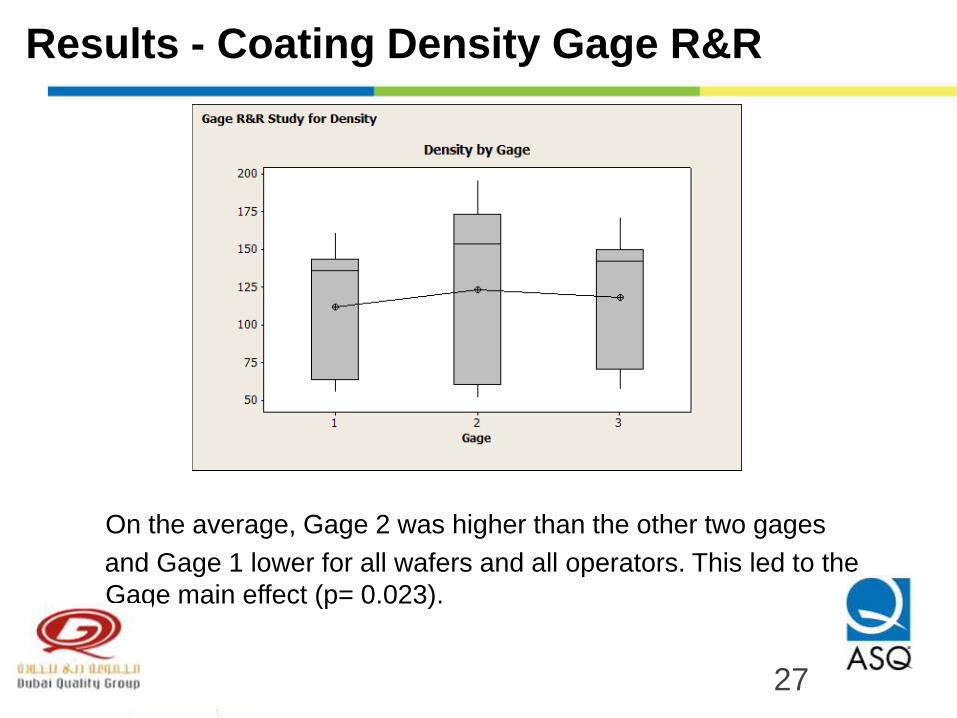
Results - Coating Density Gage R&R
On the average, Gage 2 was higher than the other two gages
and Gage 1 lower for all wafers and all operators. This led to the
Gage main effect (p= 0.023).
27
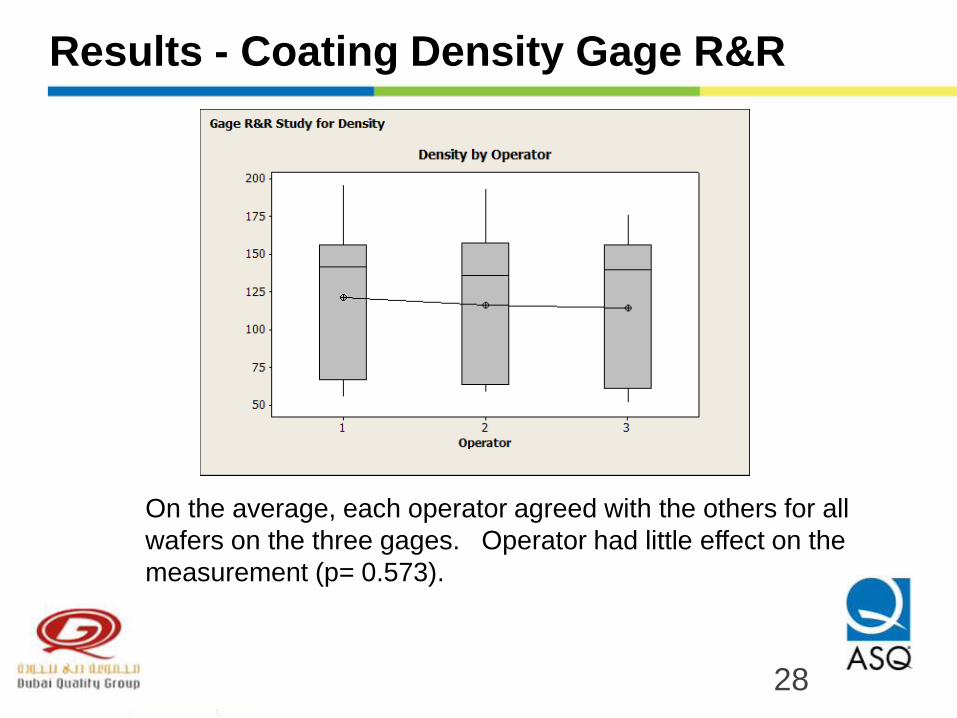
Results - Coating Density Gage R&R
On the average, each operator agreed with the others for all
wafers on the three gages. Operator had little effect on the
measurement (p= 0.573).
28
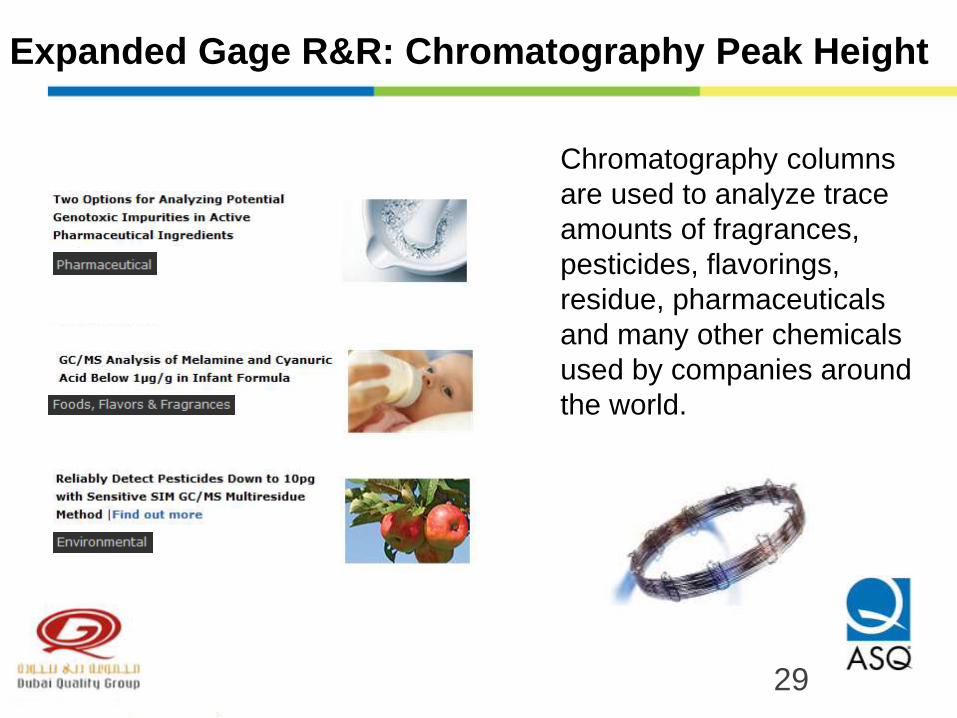
Chromatography columns
are used to analyze trace
amounts of fragrances,
pesticides, flavorings,
residue, pharmaceuticals
and many other chemicals
used by companies around
the world.
Expanded Gage R&R: Chromatography Peak Height
29
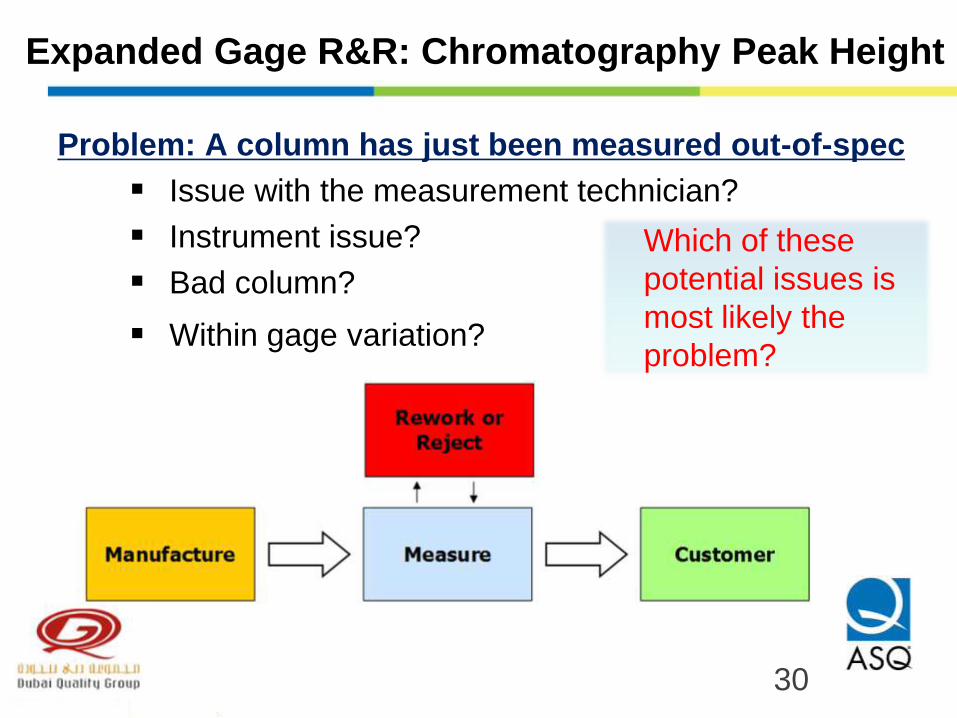
Expanded Gage R&R: Chromatography Peak Height
Problem: A column has just been measured out-of-spec
Issue with the measurement technician?
Instrument issue?
Bad column?
Within gage variation?
Which of these
potential issues is
most likely the
problem?
30
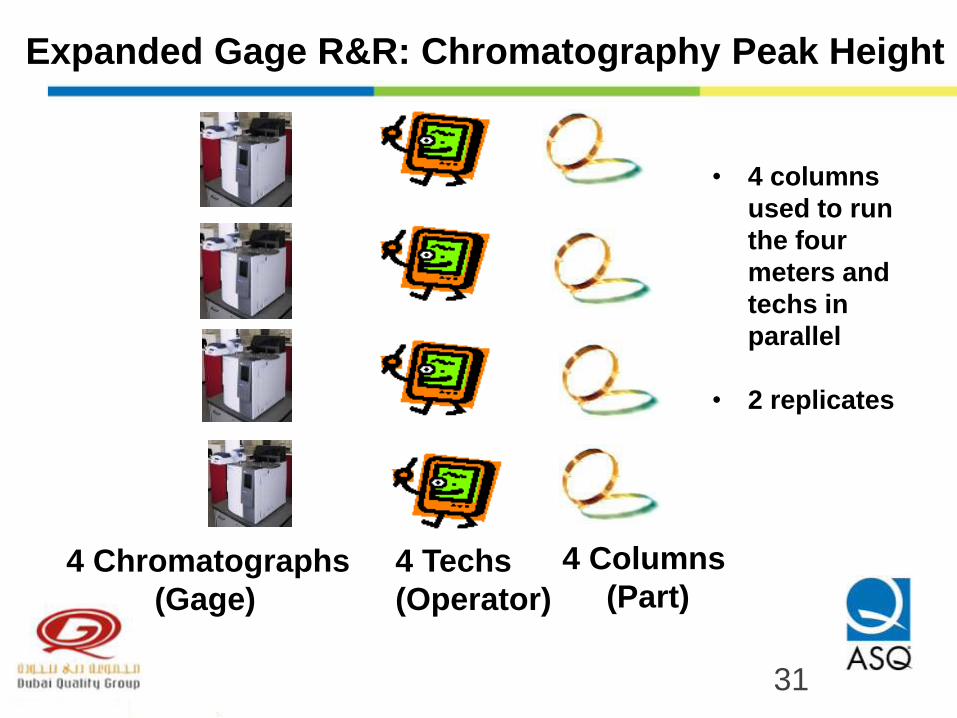
4 Columns
(Part) 4 Techs
(Operator)
4 Chromatographs
(Gage)
• 4 columns
used to run
the four
meters and
techs in
parallel
• 2 replicates
Expanded Gage R&R: Chromatography Peak Height
31
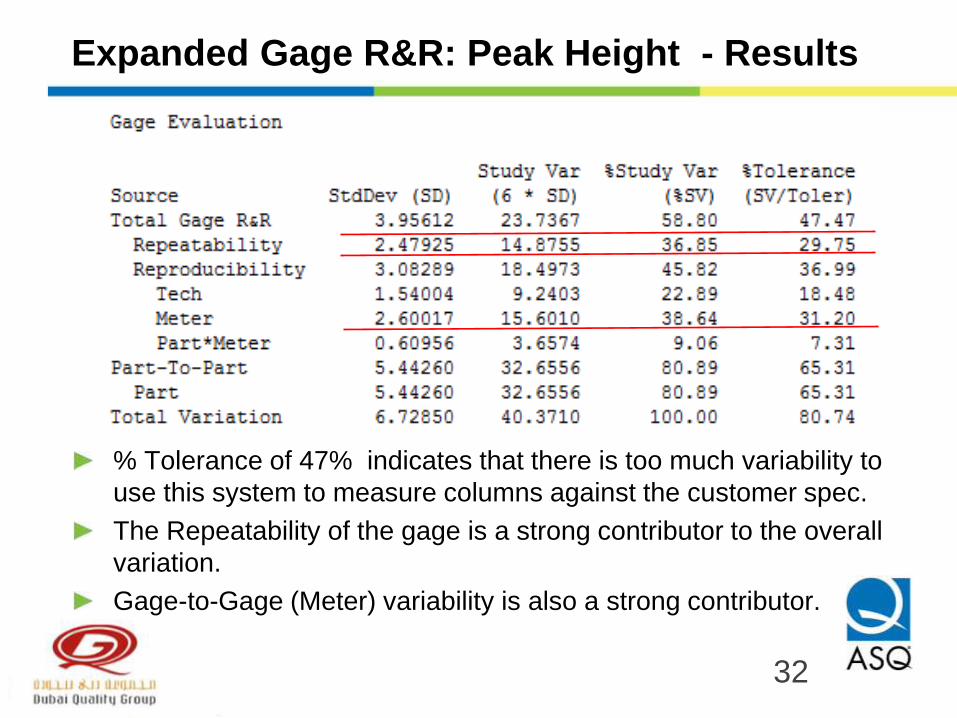
Expanded Gage R&R: Peak Height - Results
% Tolerance of 47% indicates that there is too much variability to
use this system to measure columns against the customer spec.
The Repeatability of the gage is a strong contributor to the overall
variation.
Gage-to-Gage (Meter) variability is also a strong contributor.
32 32
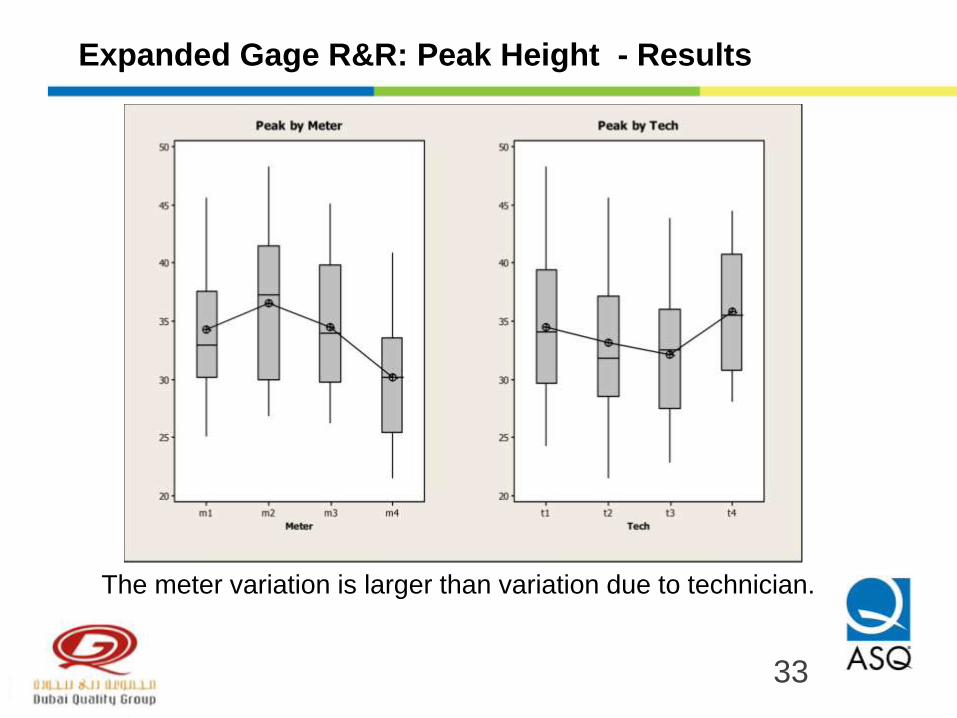
Expanded Gage R&R: Peak Height - Results
The meter variation is larger than variation due to technician.
33 33
Expanded Gage R&R: Peak Height - Implement Results
Based on the results of the Measurement Study
All gages calibrated to the same standard column.
Modifications to the instruments to improve
repeatability.
Automated injection was lowered in priority.
Project results:
60% drop in first pass reject columns
Increased QA capacity (previously a bottleneck)
Decreased measurement costs
34 34
Where Can I Learn More?
Johnson, L.A., Deaner, M. B. (2014). “When Measurement Control Means
Turbine Control; Expanded Gage R & R Implementation at NRG Systems.”,
accepted for publication. www.asq.org
Johnson, L.A., Griffith, D. (2013). “Sampling Plans for Expanded Gage R & R
Studies. “, ASQ World Conference on Quality and Improvement, May 19 -23,
Indianapolis, IN. Webinar: ASQ Statistics Division, www.asq.org
Johnson, L.A., Bailey, S. P. (2012). “Implementing an Expanded Gage
Repeatability and Reproducibility Study”, ASQ World Conference on Quality
and Improvement , Anaheim, CA , May 21 - 23, 2012.
Johnson, L.A., (2011). “Step by Step Design and Analysis of Expanded Gage
R & R Studies.”, Minitab white paper. www.minitab.com
35 35
References AIAG Measurement Systems Analysis, Reference Manual, 4rd ed. (2010). Automotive Industry Action
Group, Southfield, MI.
Burdick, R. K., Allen, A. E. , Larsen, G. A., (2002). Comparing Variability of Two Measurement
Processes Using R & R Studies, Journal of Quality Technology 34(1), 97 - 104.
Burdick, R.K., Borror, C.M., Montegomery, D.C. (2003). A Review of Methods for Measurement
Systems Capability Analysis, Journal of Quality Technology, Vol 35, No. 4, p342.
Burdick, R.K., Borror, C. M., and Montgomery, D.C. (2005). Design and Analysis of Gauge R&R
Studies: Making Decisions with Confidence Intervals in Random and Mixed ANOVA Models.
Philadelphia, PA: Society for Industrial Applied Mathematics (SIAM).
Dolezal, K.K., Burdick, R.K. , Birch, N.J., (1998) Analysis of a Two-Factor R & R Study with Fixed
Operators, Journal of Quality Technology, Vol 30, No. 2, p163.
Johnson, L.A., Crago, R. (2009). Non-standard Gage R&R in Chromotography Column
Manufacturing, ASA/ASQ 53rd Fall Technical Conference, October 7-10, 2009, Indianapolis, IN.
Montgomery, D.C. , Runger, G.C., (1993) Gauge Capability and Designed Experiments. Part I: Basic
Methods, Quality Engineering Vol. 6(1), p115 -135.
Vardeman, S.B. and VanValkenburg, E.S. (1999). Two-Way Random-Effects Analyses and Gage
R&R Studies. Technometrics, 41 (3), 202-211.
Zuo, Y., (2009). Effect of Sample Size on Variance Component Estimates in Gage R&R Studies,
Minitab Technical White Paper.
36 36
Implementing Expanded Gage R&R Studies
to Improve Quality and Productivity
Louis A. Johnson - [email protected]
Thank you for your time and participation.
Questions?


![Measurement system analysis in production processiim.ftn.uns.ac.rs/is17/papers/49.pdfnested gage R&R study [6]. Figure 3. Crossed gage R&R . Figure 4. Nested gage R&R . The three stated](https://img.dokumen.tips/doc/110x75/5e3e2cd9b7700655b42f7835/measurement-system-analysis-in-production-nested-gage-rr-study-6-figure.jpg)