Embed Size (px)
Citation preview

The INL is a U.S. Department of Energy National Laboratory operated by Battelle Energy Alliance
INL/EXT-08-15056
Measurement of Specific Heat Capacity Using Differential Scanning Calorimeter
J. E. Daw
November 2008

INL/EXT-08-15056
Measurement of Specific Heat Capacity Using Differential Scanning Calorimeter
J. E. Daw
November 2008
Idaho National Laboratory Idaho Falls, Idaho 83415
http://www.inl.gov
Prepared for the U.S. Department of Energy
Through the INL LDRD Program Under DOE Idaho Operations Office
Contract DE-AC07-05ID14517

iii INL/EXT-08-15056
CONTENTSFIGURES ...................................................................................................................................................... vTABLES .....................................................................................................................................................vii1 Introduction ........................................................................................................................................... 12 Approach ............................................................................................................................................... 13 Setup ...................................................................................................................................................... 44 Procedure ............................................................................................................................................... 5
4.1 Example Test ................................................................................................................................ 9

INL/EXT-08-15056 iv

v INL/EXT-08-15056
FIGURES1. Diagram of heating pattern and system geometry. .......................................................................... 12. A typical “Baseline” curve. ............................................................................................................. 23. Drift of several “Baseline” curves. .................................................................................................. 24. Raw data for sapphire reference and “unknown” sample material. ................................................ 35. Calculated Cp curves for sapphire and “unknown” samples compared with
imported sapphire data. .................................................................................................................... 36. Differential Scanning Calorimeter workstation at HTTL. .............................................................. 47. DSC furnace schematic diagram...................................................................................................... 58. Coolant Circulator. .......................................................................................................................... 99. Furnace hoist controls. .................................................................................................................. 1010. Crucibles and sample carrier adjustment micrometers. ................................................................ 1111. Correction test selection screen..................................................................................................... 1212. Test start window. ......................................................................................................................... 1313. Furnace program screen. ............................................................................................................... 1314. Purge gas controls. ........................................................................................................................ 1415. Vacuum valve and gauge behind DSC. ......................................................................................... 15
16. Data export options screen with material standard data curve shown and experimental curve highlighted. .......................................................................................................................... 16

INL/EXT-08-15056 vi

vii INL/EXT-08-15056
TABLES
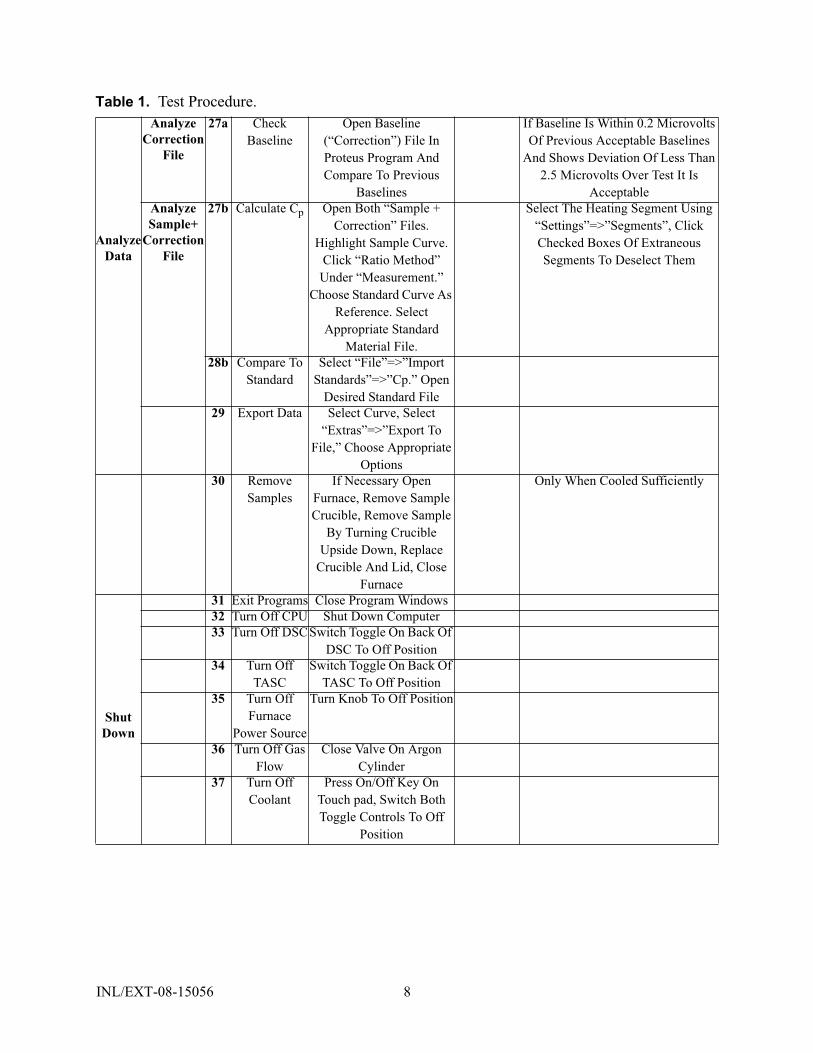
Table 1. Test Procedure. ........................................................................................... 5

INL/EXT-08-15056 viii

1 INL/EXT-08-15056
1. Introduction
This document describes the process used at the Idaho National Laboratory’s (INL) HighTemperature Test Laboratory (HTTL) for measuring specific heat capacity using a differentialscanning calorimeter (DSC). The document is divided into four sections: Approach, in which thetechnique is described; Setup, in which the physical system is described; Procedure, in which thetesting steps are listed and detailed; and Example Test, in which a typical test is outlinedfollowing the steps listed in the Procedure section.
2. Approach
Specific heat capacity (cp) is a material property describing the energy required to inducea certain change in the temperature of a unit mass of the material. To measure this quantity, adifferential scanning calorimeter (DSC) may be used. The DSC measures specific heat capacityby heating a sample and measuring the temperature difference between the sample and areference. The test setup is shown in Figure 1. Reference and sample crucibles are placed on asample carrier within a furnace of cylindric geometry which generates heat radially toward thecenter. Temperature is detected by thermocouples in contact with each crucible. Onethermoelement is shared between the crucibles (as seen in the Side Furnace View) allowing thetemperature difference to be measured as a voltage. Three measurements are necessary forcalculating specific heat. First a “Baseline” is recorded. This is the response with both cruciblesempty, yielding a signal bias inherent in the system. Next is a reference test, in which a samplewith a well defined specific heat is tested for comparison to an experimental sample. Finally, anexperimental sample is tested. The “Baseline” allows removal of system bias from the data, whilethe reference test allows calculation of the specific heat of the experimental sample as a ratio ofthe reference material specific heat.
Figure 1. Diagram of heating pattern and system geometry.
Top Furnace View Side Furnace View(Heating Elements In Red)(R = Reference, S = Sample)

INL/EXT-08-15056 2
As described previously, all DSC tests are performed as “triples.” For each test sample,three tests must be performed. The first test is a “Baseline.” The “Baseline” test records systemcharacteristics and (assuming the baseline is relatively consistent from test to test) allows removalof the system bias from experimental data. “Baseline” tests must be run before any samples can betested. The “Baseline” should be compared to other recent “Baselines” to make sure the system isrunning consistently. If the “Baselines” begin to drift (deviating by more than 0.2 microvolts froma previous test or exhibiting more than 2.5 microvolts in signal variance during a test), the sampleholder position should be adjusted. While adjusting the sample holder position, several“Baseline” tests should be performed to demonstrate consistency of the new sample holderposition. Figure 2 displays a typical “Baseline” curve with temperature displayed as a function oftime.
Figure 3 shows several “Baseline” curves with notable drift from curve to curve.
Figure 2. A typical “Baseline” curve.
Figure 3. Drift of several “Baseline” curves.

3 INL/EXT-08-15056
After a repeatable “Baseline” has been recorded, a reference material must be tested(procedure described in section 4). This reference (the second part of the “triple”) must be one ofthe Netzsch supplied samples, with a well defined curve pre-loaded into the software. Thereference curve will use the same program as the “Baseline” and is started by opening the“Baseline” file. The experimental sample (the third test in the “triple”) is tested in exactly thesame way as the reference. Figure 4 shows representative reference and sample material curves.
After using the ratio method to determine cp, the true value of a standard material may beimported for comparison. In this way confidence may be gained in the results of testing. Figure 5shows the imported standard curve for sapphire, as well as experimentally derived curves forsapphire and the “unknown” sample from Figure 4.
Figure 4. Raw data for sapphire reference and “unknown” sample material.
Figure 5. Calculated Cp curves for sapphire and “unknown” samples compared with imported sapphire data.
INL/EXT-08-15056 4
3. Setup
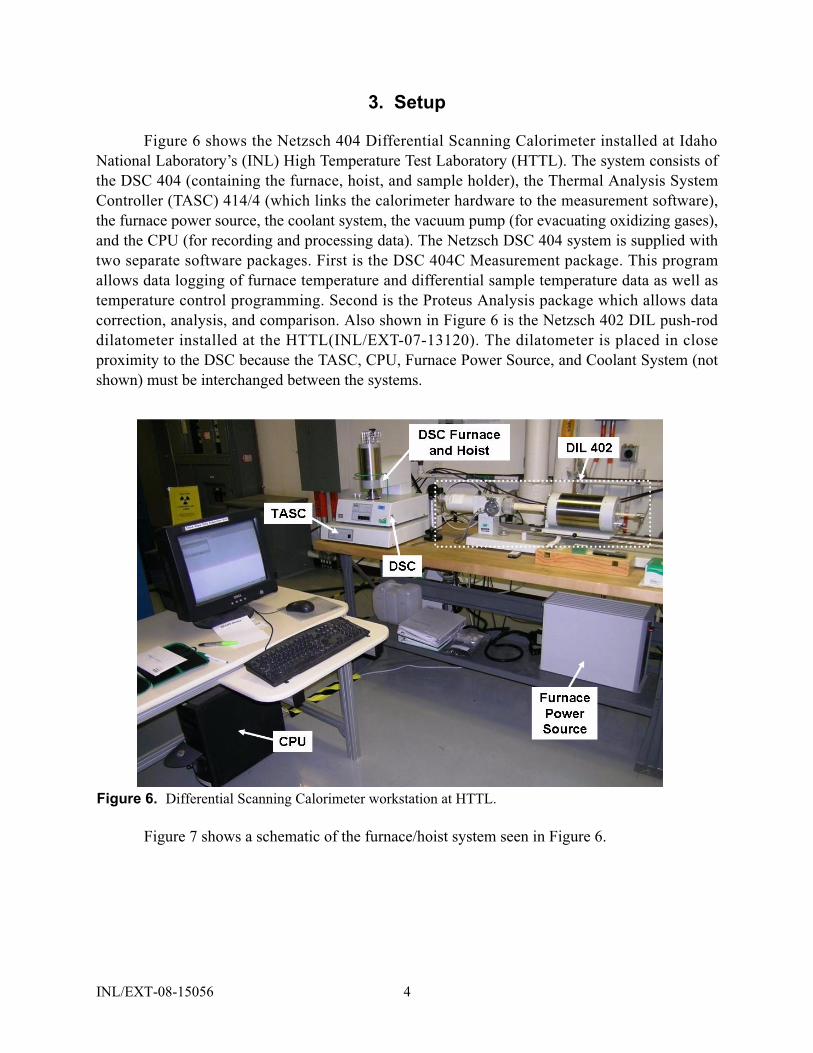
Figure 6 shows the Netzsch 404 Differential Scanning Calorimeter installed at IdahoNational Laboratory’s (INL) High Temperature Test Laboratory (HTTL). The system consists ofthe DSC 404 (containing the furnace, hoist, and sample holder), the Thermal Analysis SystemController (TASC) 414/4 (which links the calorimeter hardware to the measurement software),the furnace power source, the coolant system, the vacuum pump (for evacuating oxidizing gases),and the CPU (for recording and processing data). The Netzsch DSC 404 system is supplied withtwo separate software packages. First is the DSC 404C Measurement package. This programallows data logging of furnace temperature and differential sample temperature data as well astemperature control programming. Second is the Proteus Analysis package which allows datacorrection, analysis, and comparison. Also shown in Figure 6 is the Netzsch 402 DIL push-roddilatometer installed at the HTTL(INL/EXT-07-13120). The dilatometer is placed in closeproximity to the DSC because the TASC, CPU, Furnace Power Source, and Coolant System (notshown) must be interchanged between the systems.
Figure 7 shows a schematic of the furnace/hoist system seen in Figure 6.
Figure 6. Differential Scanning Calorimeter workstation at HTTL.

5 INL/EXT-08-15056
4. Procedure
Table 1 details the test procedure used.
Figure 7. DSC furnace schematic diagram.
Table 1. Test Procedure.Step Action Process Purpose Comments
Prepare System
1 Start Coolant Flow
Press Both Toggle Switches To On Position And Press On/Off Button
On Keypad2 Start Purge
GasOpen Valve On Argon
CylinderPurge Gas Will Need To Be Started
Later Using The Software3 Turn On
FurnacePower Source
Turn Red Switch On Furnace Power Source To
On Position4 Turn On
TASCSelect On Using Toggle
Switch On Back Of TASC5 Turn On DSC Select On Using Toggle
Switch On Back Of DSC6 Start CPU Press Button On Front Of
CPU

INL/EXT-08-15056 6
Prepare Sample
7 Clean Sample8 Measure
Sample Mass9 Open Furnace Press Safety Button On
Side Of DSC and Up Button On Front Of DSC
Simultaneously10 Loosen
CruciblesUsing Tweezers, Gently
Rock Crucibles Back And Forth Until They Come
Free
Not Necessary If Crucibles Are Not Loaded
11 Remove Sample Crucible
Using Tweezers, Gently Lift Crucible From Holder And Set On Flat Surface
Sample Crucible Is Nearest Front of DSC. Tip Crucible Over to Remove
Lid And Sample. Do Not Rotate Crucible!
12 Load Sample Using Tweezers, Drop Sample Into Crucible And Gently Shake Crucible To Center Sample, Replace
Lid13 Replace
Crucible In Sample Holder
Using Tweezers, Place Crucible Back Into Sample
Holder
Crucibles Should Be In Same Orientation And Position As Before Removal. Lids Should Be In Same Orientation. Tap Each Lid (Front Then Back) To Maintain Sample
Holder Position Consistency.14 Close Furnace Press The Safety And
Down Buttons Simultaneously
As Furnace Nears Sample Holder, Slowly Lower Furnace Making Sure
Furnace Will Not Contact Sample Holder
Table 1. Test Procedure.

7 INL/EXT-08-15056
Prepare Test
15 Open DSC 404 Software
Double Click Icon On Computer Desktop
Correction Test
16a Open New “Correction”
File
Click “New” Under “File,” Select “Correction,” Enter
Data
Sample And Reference Crucibles Are Empty
17a Program Test Follow Steps Select “TcalZero,” “SensZero,” Program Furnace Steps
Sample + Correction
Test
16b, 17b
Open “Sample + Correction”
Test
Click “Open” Under “File,” Choose
“Correction” file, Select “Sample +Correction,”
Follow Steps
Program Will Be Same As For “Correction” Test,
“Sample+Correction” Is Used For Standard And Sample Tests
18 Start Gas Flow
Under “Diagnosis” Select “Gases And Switches,”
Select “Purge 1”
Purge Prior To Starting Test Program, Allow Argon To Flow For
Several Minutes19 Stop Gas
FlowSelect “Purge 1”
20 Close Exit Valve At Top Of Furnace
Turn Valve 90 Degrees Close Valve Immediately After Stopping Gas Flow
21 Start Vacuum Purge
Start Pump By Switching Toggle Switch To On Position, Slowly Open
Vacuum Valve At Back Of DSC By Turning Counterclockwise
Vacuum Purge Must Be Slow To Avoid Moving Crucibles Or Lids, Allow Vacuum Purge To Continue Until Gauge Needle Stops Moving
22 Close Vacuum Valve
Turn Valve Knob Clockwise
23 Start Gas Flow
Select “Purge 1” Refill Furnace With Argon Until Atmospheric Pressure Is Reached
24 Open Exit Valve At Top Of Furnace
Turn Valve Back To Open Position
Pressure Must Be At Or Just Over Atmospheric (Zero On Gauge)
25 Continue Purge
Repeat Steps 19 Through 24
Turn Off Vacuum Pump After Purge Is Complete
26 Start Test Press “Start” Button In Program
Test Will Run Automatically
Table 1. Test Procedure.
INL/EXT-08-15056 8
Analyze Data
AnalyzeCorrection
File
27a CheckBaseline
Open Baseline (“Correction”) File In Proteus Program And Compare To Previous
Baselines
If Baseline Is Within 0.2 Microvolts Of Previous Acceptable Baselines
And Shows Deviation Of Less Than 2.5 Microvolts Over Test It Is
AcceptableAnalyzeSample+
Correction File
27b Calculate Cp Open Both “Sample + Correction” Files.
Highlight Sample Curve. Click “Ratio Method” Under “Measurement.”
Choose Standard Curve As Reference. Select
Appropriate Standard Material File.
Select The Heating Segment Using “Settings”=>”Segments”, Click Checked Boxes Of Extraneous Segments To Deselect Them
28b Compare To Standard
Select “File”=>”Import Standards”=>”Cp.” Open
Desired Standard File29 Export Data Select Curve, Select
“Extras”=>”Export To File,” Choose Appropriate
Options30 Remove
SamplesIf Necessary Open
Furnace, Remove Sample Crucible, Remove Sample
By Turning Crucible Upside Down, Replace
Crucible And Lid, Close Furnace
Only When Cooled Sufficiently
Shut Down
31 Exit Programs Close Program Windows32 Turn Off CPU Shut Down Computer33 Turn Off DSCSwitch Toggle On Back Of
DSC To Off Position34 Turn Off
TASCSwitch Toggle On Back Of
TASC To Off Position35 Turn Off
FurnacePower Source
Turn Knob To Off Position
36 Turn Off Gas Flow
Close Valve On Argon Cylinder
37 Turn Off Coolant
Press On/Off Key On Touch pad, Switch Both Toggle Controls To Off
Position
Table 1. Test Procedure.
9 INL/EXT-08-15056
4.1. Example Test
This section details an example test for the purpose of clarifying the testing process. Thesection will follow the procedure outlined in Table 1.
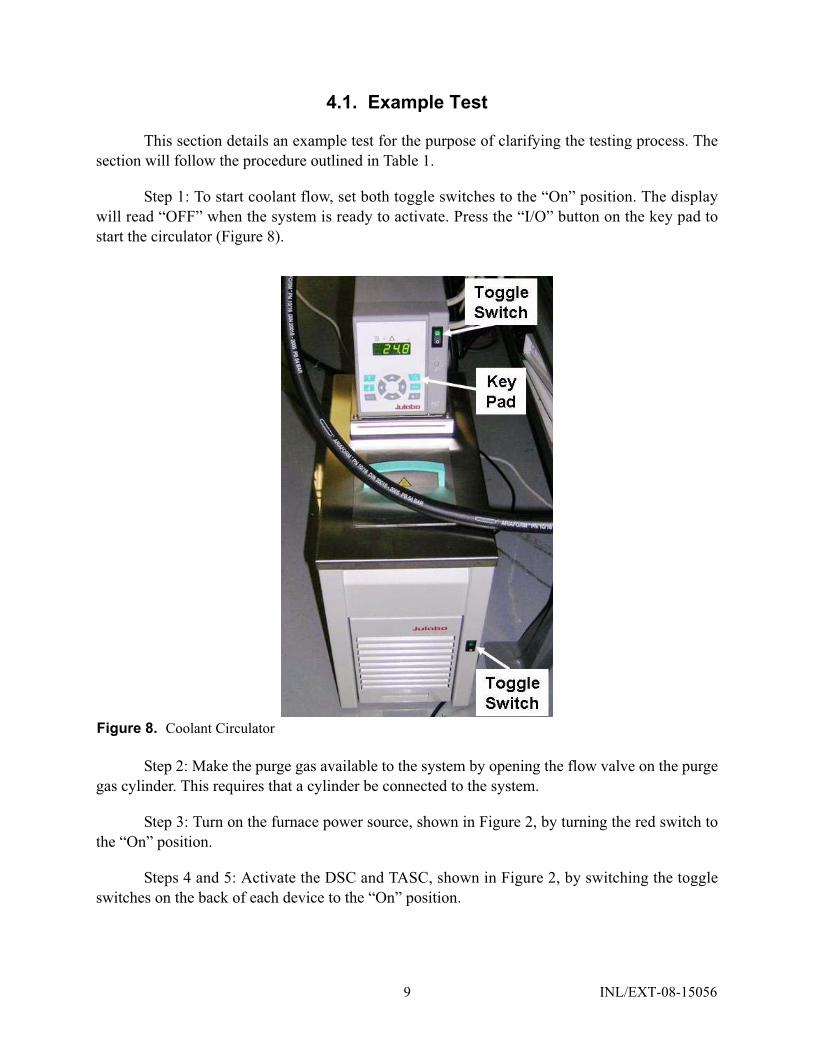
Step 1: To start coolant flow, set both toggle switches to the “On” position. The displaywill read “OFF” when the system is ready to activate. Press the “I/O” button on the key pad tostart the circulator (Figure 8).
Step 2: Make the purge gas available to the system by opening the flow valve on the purgegas cylinder. This requires that a cylinder be connected to the system.
Step 3: Turn on the furnace power source, shown in Figure 2, by turning the red switch tothe “On” position.
Steps 4 and 5: Activate the DSC and TASC, shown in Figure 2, by switching the toggleswitches on the back of each device to the “On” position.
Figure 8. Coolant Circulator
INL/EXT-08-15056 10
Step 6: Turn on the CPU, shown in Figure 2, by pressing the button on the front of theCPU.
Step 7: Clean sample as required using acetone or alcohol. Liquid cleaning solutions maybe inappropriate for porous samples. After cleaning, the sample should only be handled withforceps or gloved hands.
Step 8: The sample mass must be measured, in milligrams.
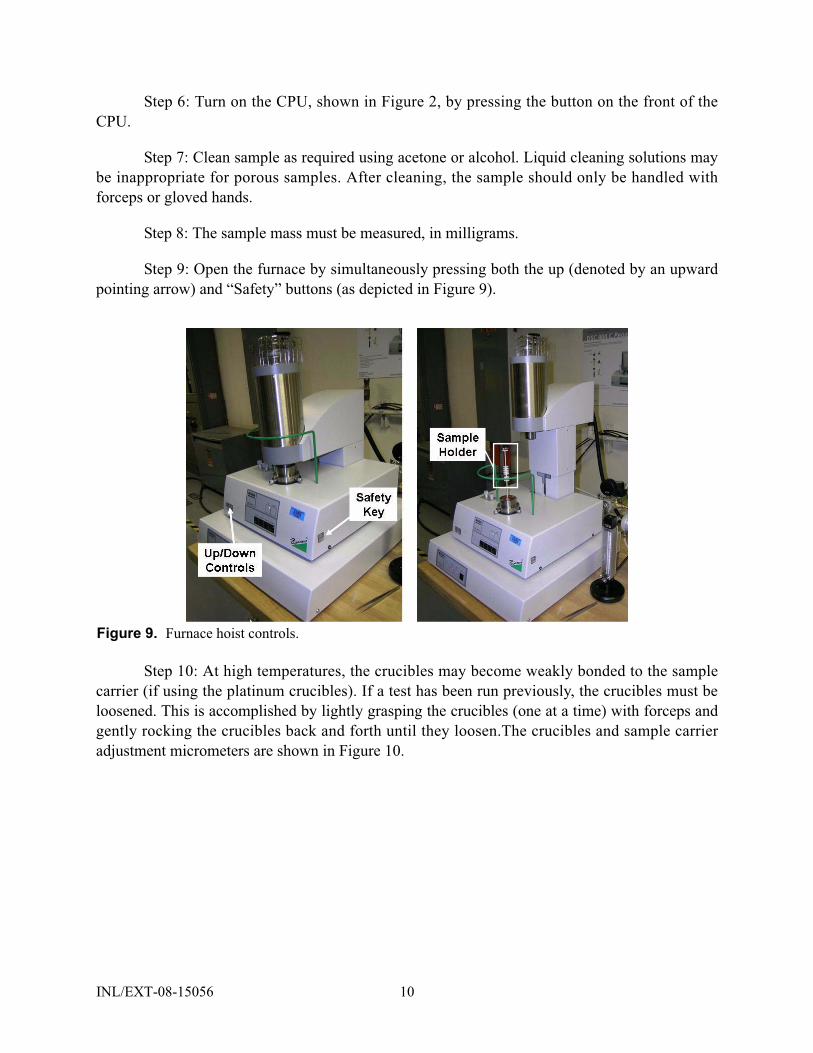
Step 9: Open the furnace by simultaneously pressing both the up (denoted by an upwardpointing arrow) and “Safety” buttons (as depicted in Figure 9).
Step 10: At high temperatures, the crucibles may become weakly bonded to the samplecarrier (if using the platinum crucibles). If a test has been run previously, the crucibles must beloosened. This is accomplished by lightly grasping the crucibles (one at a time) with forceps andgently rocking the crucibles back and forth until they loosen.The crucibles and sample carrieradjustment micrometers are shown in Figure 10.
Figure 9. Furnace hoist controls.

11 INL/EXT-08-15056
Step 11: If there is a sample in the “sample” crucible, it must be remove prior to running anew baseline test. Using forceps, gently grasp the “sample” crucible and lift it off the samplecarrier. Maintaining the orientation of the crucible, invert the crucible over a flat surface toremove the lid and sample. Still maintaining orientation, set the crucible down open side up.
Step 12: If necessary, place a new sample in the crucible and gently shake the crucible tocenter the sample. Replace the lid keeping the orientation of the lid as close as possible to what itwas before removal from the sample carrier.
Step 13: Maintaining orientation, place the crucible gently back into the sample carrier.The crucible should sit flat, and the lid should be level with the lid of the reference crucible. Bothcrucibles should be placed to the back of their carrier locations. This position is not critical, butconsistency in positioning is. The lids should be tapped, very lightly, with forceps. The samplecrucible is tapped first, and then the reference crucible. As the sample carrier ages it will becomeless stable. Tapping the crucibles, in order, will help keep the position of the carrier constant.
Step 14: Close the furnace by pressing the down (denoted with a downward pointingarrow) and the “Safety” buttons simultaneously. Move the carrier in small increments as theleading edge passes the sample carrier to ensure that there is no contact.
Figure 10. Crucibles and sample carrier adjustment micrometers.

INL/EXT-08-15056 12
Step 15: Double click the DSC 404 icon on the computer desktop to open the dilatometercontrol software.
Step 16a: Open a new “Correction” (baseline) file by selecting “File” from the toolbar andclicking “New.” When the screen shown in Figure 11 appears, select “Correction” and fill in theappropriate information. Be aware that the reference will always be empty and that the cruciblemasses are always set to zero. Click “Continue” when the information has been entered.
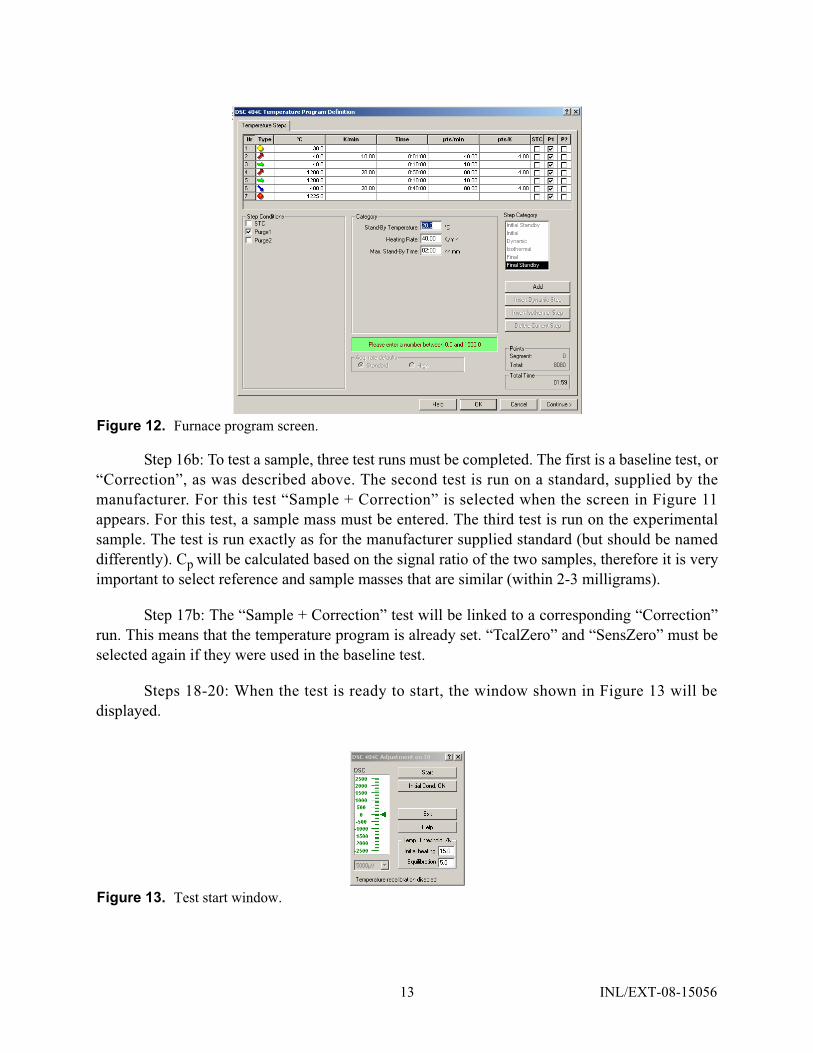
Step 17a: Program the furnace steps using the screen shown in Figure 12. First, a startingtemperature is entered under “Category.” This temperature should be slightly higher than themaximum expected ambient temperature. Purge gases and sample temperature control (STC) mayalso be selected for each temperature step. STC controls the furnace by reading the sampletemperature instead of the furnace temperature. STC is not generally used. Next click “Add” toadd another step. “Add” must be clicked after the addition of each step. Dynamic steps allow theaddition of a temperature rise or drop. If a dynamic step is added, final temperature and ramp ratemust also be selected under “Category.” Isothermal segments allow the temperature to equalizebetween dynamic steps. A duration must be programmed under “Category” if an isotherm isadded. Once all temperature steps are programmed, select “Final.” An emergency temperaturelimit will be added. This temperature should be about 25 C over the maximum test temperatureand will shut down the system if reached. Click “Add” to activate the “Continue” button, andclick when the program is ready.
Figure 11. Correction test selection screen.
13 INL/EXT-08-15056
Step 16b: To test a sample, three test runs must be completed. The first is a baseline test, or“Correction”, as was described above. The second test is run on a standard, supplied by themanufacturer. For this test “Sample + Correction” is selected when the screen in Figure 11appears. For this test, a sample mass must be entered. The third test is run on the experimentalsample. The test is run exactly as for the manufacturer supplied standard (but should be nameddifferently). Cp will be calculated based on the signal ratio of the two samples, therefore it is veryimportant to select reference and sample masses that are similar (within 2-3 milligrams).
Step 17b: The “Sample + Correction” test will be linked to a corresponding “Correction”run. This means that the temperature program is already set. “TcalZero” and “SensZero” must beselected again if they were used in the baseline test.
Steps 18-20: When the test is ready to start, the window shown in Figure 13 will bedisplayed.
Figure 12. Furnace program screen.
Figure 13. Test start window.

INL/EXT-08-15056 14
Before starting the test, the furnace chamber must be purged. On the toolbar, select“Diagnosis.” Click “Gases and Switches.” If a purge gas is flowing, the box next to the purge gasnumber will be checked. If there is no flow, check the appropriate box to start flow. Let the gasflow for several minutes. Check the box again to stop the flow. Turn the flow valve in Figure 1490 degrees to isolate the furnace chamber from the atmosphere.
Steps 21-25: Purge the system by switching on the small vacuum pump connected to thesystem. Slowly open (turn counter clockwise) the valve shown in Figure 10. The pressure readingon the gauge should slowly fall. Once the reading stabilizes, close the vacuum valve and restartpurge gas flow using the software. Watch the vacuum gauge. When the gauge reads a pressure ofjust greater than zero (atmospheric pressure), slowly open the exit valve at the top of the furnace.Repeat the purging cycle twice more.
Step 26: Once the purge has been completed and gas is flowing, press the on-screen“Start” button to begin the test.
Step 27a: Open the Proteus software package. Check the validity of the Baseline byopening the file, also open the most recently used Baseline. If baseline is within 0.2 microvolts ofprevious acceptable baselines and shows deviation of less than 2.5 microvolts over test it isacceptable. If no previous Baseline data exists, run two Baseline tests and compare these results.If, during the first Baseline test, the signal is rapidly rising or falling (such that the signal drift willexceed 2.5 microvolts), use the micrometers to fine tune the position of the sample carrier foroptimum stability. The micrometers are shown in Figure 11. The micrometer at the front of thesystem should be used for adjustment. Turning the micrometer clockwise will cause the Baseline
Figure 14. Purge gas controls.

15 INL/EXT-08-15056
signal to decrease, while turning the micrometer counter clockwise will increase the signal. Aclockwise adjustment moves the sample crucible away from the wall (and the heating elements)and the empty (reference) crucible toward the wall. This causes the relative temperature of thesample crucible to drop, decreasing the signal. A counter clockwise adjustment has the inverseeffect.
Step 27b: If all three tests have been performed for a sample, the specific heat as afunction of temperature may be calculated. Open both “Sample + Correction” files, one for thereference and one for the experimental sample. With both curves visible, select the sample curveto highlight it. From the toolbar, select “Measurement” and choose “Ratio Method” from the dropdown menu. A table will appear with the highlighted curve set as the sample, set the referencecurve as reference in the table and click “OK.” Choose the appropriate reference material filefrom the folder that opens, this file should match the reference material used (i.e. Sapp forsapphire). The specific heat will be displayed as a new curve.
Step 28b: By selecting “File,” “Import Standards,” and “Cp” the new specific heat curvemay be compared to standard data supplied by the manufacturer.
Step 29: To export data, highlight the desired curve and select “Extras” from the toolbar.Choose “Export To File” from the drop down menu and choose appropriate export options such asdata range, export file type, etc. as shown in Figure 16.
Figure 15. Vacuum valve and gauge behind DSC.

INL/EXT-08-15056 16
Step 30: Remove sample (if not performing a baseline test) by raising the furnace (onlyafter the furnace has cooled) and gently lifting out the sample crucible. Maintaining theorientation of the crucible (so that it may be replaced into the sample carrier in the same positionas before) turn over the crucible such that the lid and sample are both freed from the crucible. Setthe crucible down (still maintaining orientation) and, if desired, place a new sample within. Afterinserting the new sample, if doing so, replace the lid in the same orientation as before removal.Carefully replace the crucible into the sample carrier, in the same position and orientation as inprevious tests. Consistency in position and orientation of the crucibles is extremely important forconsistent test results.
Step 31: Exit the measurement and analysis programs by closing the program windows.
Steps 32 - 37: Shut down the system by reversing steps 1 through 6.
Figure 16. Data export options screen with material standard data curve shown and experimental curve highlighted.