Embed Size (px)
Citation preview
Causal Inference with Measurement Error:Nonparametric Identification and Sensitivity Analyses of a Field Experiment
on Democratic Deliberations
Kosuke Imai Teppei Yamamoto
Princeton University
April 28, 2008
Imai and Yamamoto (Princeton) Causal Inference with Measurement Error April 28, 2008 1 / 27
Measurement Error (ME) and Causal Inference
Political Science:Extensively studied in the context of survey researchAchen (1975), Zaller & Feldman (1992), Bartels (1993), etc.Mostly focused on classical ME in the regression frameworkRise of randomized survey experiments (e.g., TESS)How does ME affect causal inference?
Statistics:Long history of research on MEMostly focused on non-differential MEFast growing literature on causal inferenceLittle work on the impact of ME on causal estimation
Imai and Yamamoto (Princeton) Causal Inference with Measurement Error April 28, 2008 2 / 27
Differential Measurement Error in Political Science
Differential ME:
Survey respondents’ propensity to misreport causal variables isoften correlated with the outcome
Especially common in retrospective studies
Examples:1 Causal effects of political knowledge on voting behavior
Many election surveys (e.g. ANES and BES) ask knowledgequestions only after electionVoting could affect the level of political knowledgeRegressing voting on knowledge will induce bias!
2 Causal effects of implicit cues and racial predispositionsRacial attitudes are often measured after experimentJustification: asking attitudes could nullify implicit cuesDo implicit cues work only for those with strong racialpredispositions?
Imai and Yamamoto (Princeton) Causal Inference with Measurement Error April 28, 2008 3 / 27
Nonparametric Identification Analysis
Advocated by Manski and others
Few applications in political science
Question: What can we learn from the observed data alone?
Different from the identification of parametric models
Start with no modeling assumption
Consider additional assumptions
Bounds rather than point estimates
Goals:1 Establish the domain of consensus among researchers2 Highlight the limitations and advantages of research designs3 Characterize the roles of additional assumptions
Imai and Yamamoto (Princeton) Causal Inference with Measurement Error April 28, 2008 4 / 27
Nonparametric Sensitivity Analysis
Advocated by Rosenbaum and others
Few applications in political science
Question: How large a departure from the key assumption mustoccur for the conclusions to no longer hold?
Different from sensitivity analysis under parametric models
IDENTIFICATION ANALYSIS: Bounding conclusions given certainassumptions
SENSITIVITY ANALYSIS: Bounding the degree of violations ofassumptions given certain conclusions
Goals:1 Examine the sensitivity of conclusions to key assumptions2 Evaluate the robustness of conclusions
Imai and Yamamoto (Princeton) Causal Inference with Measurement Error April 28, 2008 5 / 27
Methodological Contributions
1 Study causal inference with differential ME2 Derive sharp (best possible) bounds of the average causal effect3 Incorporate qualitative knowledge into quantitative analysis4 Exploit auxiliary information5 Propose a new sensitivity analysis
Imai and Yamamoto (Princeton) Causal Inference with Measurement Error April 28, 2008 6 / 27
Motivating and Illustrative Example
Randomized field experiment on democratic deliberations in São Toméand Príncipe (Humphreys et al. 2006):
A national forum was held in 2004 after discovery of oil
Citizens deliberated spending priorities in small groups
Discussions were moderated by randomly assigned leaders
Units of observation = discussion groups (n = 148)
Group discussion outcomes were then recorded
Finally, leaders were asked their own preferences
Questions:
Can a deliberative process lead to better decision outcomes?
Can discussion leaders manipulate group discussion outcomes?
Imai and Yamamoto (Princeton) Causal Inference with Measurement Error April 28, 2008 7 / 27
Causal Quantities of Interest
Can discussion leaders manipulate group decisions towards theirown policy preferences?
Z ∗i ∈ {0,1}: leaders’ (pre-deliberation) preference
Zi ∈ {0,1}: leaders’ (post-deliberation) preference
Yi ∈ {0,1}: Group discussion outcome
Yi(Z ∗i ) ∈ {0,1}: potential outcomes
Average treatment effect (ATE): τ∗ ≡ E(Yi(1)− Yi(0))
Does NOT measure the causal effect of leaders’ preferences
The causal effect of having discussions moderated by a leaderwith particular preferences
Imai and Yamamoto (Princeton) Causal Inference with Measurement Error April 28, 2008 8 / 27
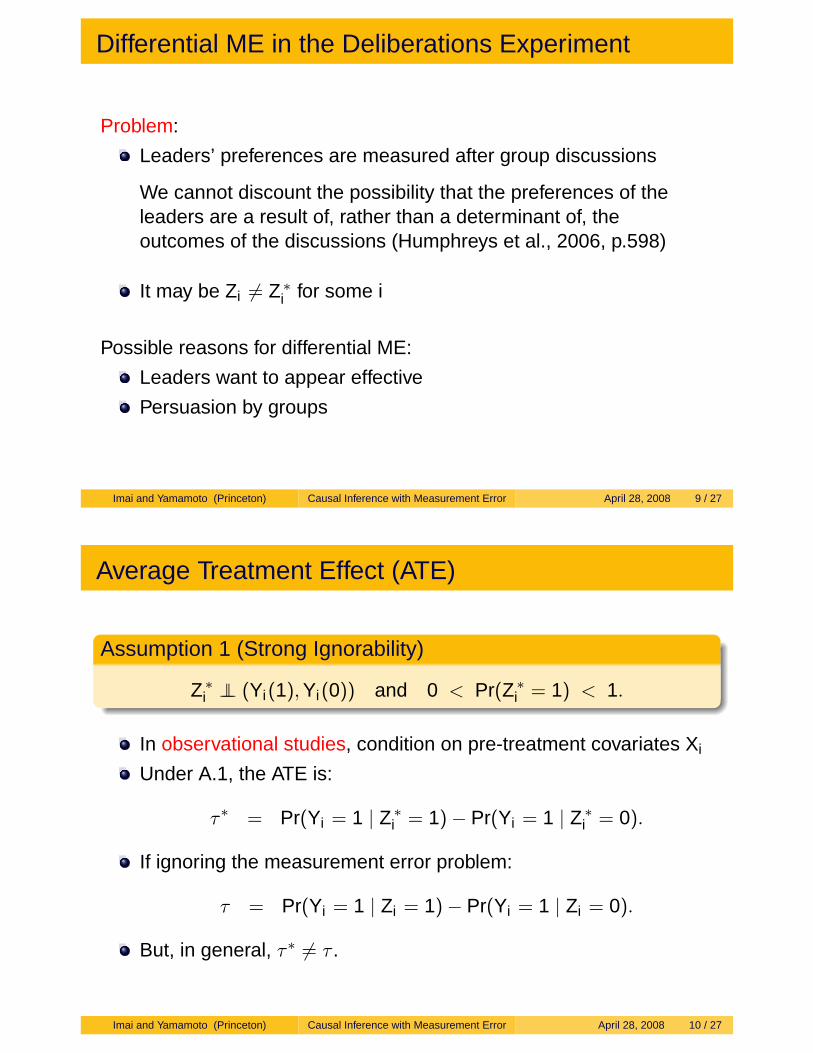
Differential ME in the Deliberations Experiment
Problem:
Leaders’ preferences are measured after group discussions
We cannot discount the possibility that the preferences of theleaders are a result of, rather than a determinant of, theoutcomes of the discussions (Humphreys et al., 2006, p.598)
It may be Zi 6= Z ∗i for some i
Possible reasons for differential ME:
Leaders want to appear effective
Persuasion by groups
Imai and Yamamoto (Princeton) Causal Inference with Measurement Error April 28, 2008 9 / 27
Average Treatment Effect (ATE)
Assumption 1 (Strong Ignorability)
Z ∗i ⊥⊥ (Yi(1),Yi(0)) and 0 < Pr(Z ∗
i = 1) < 1.
In observational studies, condition on pre-treatment covariates Xi
Under A.1, the ATE is:
τ∗ = Pr(Yi = 1 | Z ∗i = 1)− Pr(Yi = 1 | Z ∗
i = 0).
If ignoring the measurement error problem:
τ = Pr(Yi = 1 | Zi = 1)− Pr(Yi = 1 | Zi = 0).
But, in general, τ∗ 6= τ .
Imai and Yamamoto (Princeton) Causal Inference with Measurement Error April 28, 2008 10 / 27
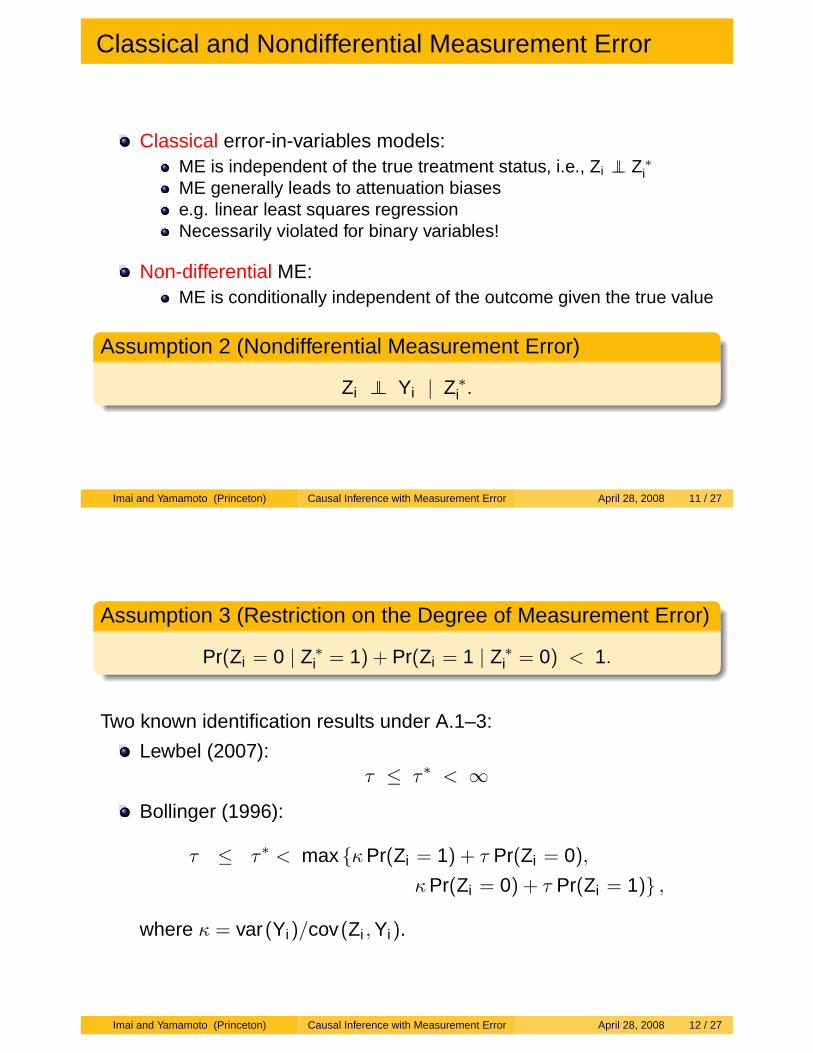
Classical and Nondifferential Measurement Error
Classical error-in-variables models:ME is independent of the true treatment status, i.e., Zi ⊥⊥ Z ∗
iME generally leads to attenuation biasese.g. linear least squares regressionNecessarily violated for binary variables!
Non-differential ME:ME is conditionally independent of the outcome given the true value
Assumption 2 (Nondifferential Measurement Error)
Zi ⊥⊥ Yi | Z ∗i .
Imai and Yamamoto (Princeton) Causal Inference with Measurement Error April 28, 2008 11 / 27
Assumption 3 (Restriction on the Degree of Measurement Error)
Pr(Zi = 0 | Z ∗i = 1) + Pr(Zi = 1 | Z ∗
i = 0) < 1.
Two known identification results under A.1–3:
Lewbel (2007):τ ≤ τ∗ < ∞
Bollinger (1996):
τ ≤ τ∗ < max {κPr(Zi = 1) + τ Pr(Zi = 0),
κPr(Zi = 0) + τ Pr(Zi = 1)} ,
where κ = var(Yi)/cov(Zi ,Yi).
Imai and Yamamoto (Princeton) Causal Inference with Measurement Error April 28, 2008 12 / 27

Limited Informativeness of Assumptions 1 and 3
ME is likely to be differential in the deliberation experiment
Under A.1 alone, the sharp bounds are [−1,1]
Assume A.3 as well as A.1 (but not A.2; i.e., allow differential ME)
Proposition 4Under A.1 & 3, the sharp bounds [α, β] have the following properties:
1 α = −1 if and only if Pr(Zi = 1 | Yi = 1) < Pr(Zi = 1 | Yi = 0),2 β = 1 if and only if Pr(Zi = 1 | Yi = 1) > Pr(Zi = 1 | Yi = 0).
The bounds on the ATE are always informative, but only on oneside (upper or lower).
Imai and Yamamoto (Princeton) Causal Inference with Measurement Error April 28, 2008 13 / 27
An Alternative Formulation
Assumption 4 (Positive Correlation between Z ∗i and Zi)
0 < Pr(Zi = 1) < 1, and corr(Zi ,Z∗i ) > 0.
Proposition 5Under A. 1 & 4,
1 α = −1 if and only if Pr(Yi = 1 | Zi = 1) < Pr(Yi = 1 | Zi = 0) orequivalently τ < 0,
2 β = 1 if and only if Pr(Yi = 1 | Zi = 1) > Pr(Yi = 1 | Zi = 0) orequivalently τ > 0.
Under a minimal set of assumptions, the bounds are informativebut wide when differential ME exists
Imai and Yamamoto (Princeton) Causal Inference with Measurement Error April 28, 2008 14 / 27
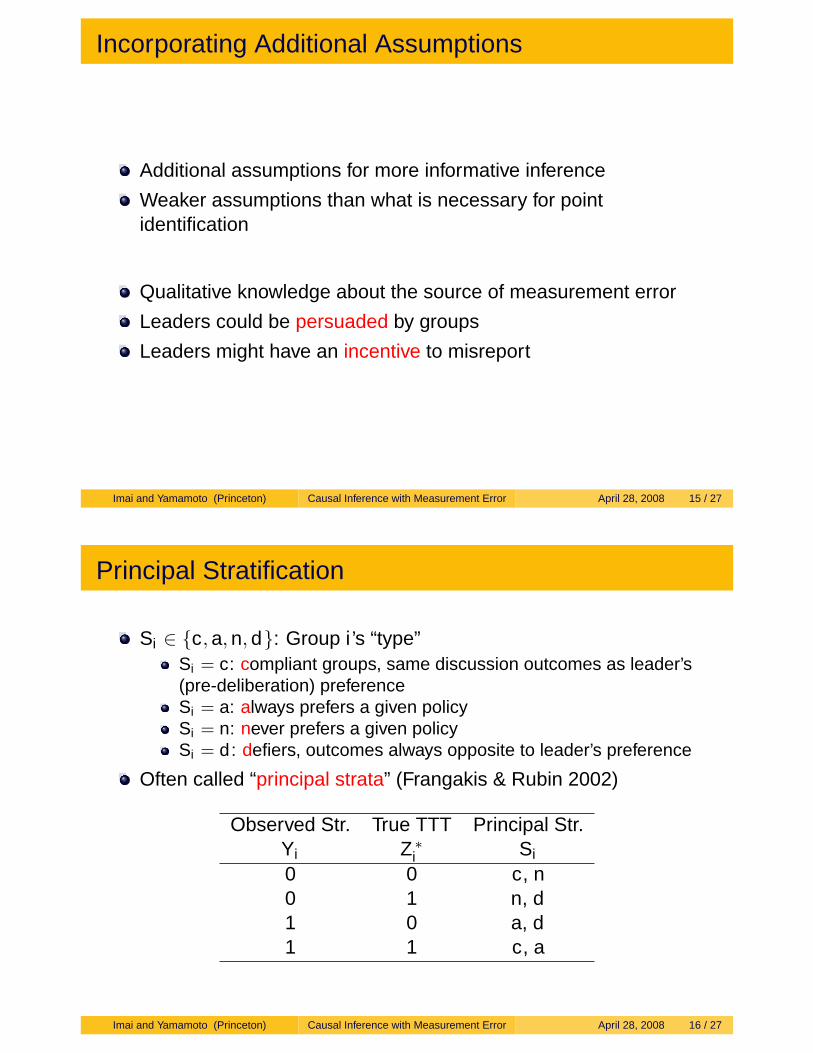
Incorporating Additional Assumptions
Additional assumptions for more informative inference
Weaker assumptions than what is necessary for pointidentification
Qualitative knowledge about the source of measurement error
Leaders could be persuaded by groups
Leaders might have an incentive to misreport
Imai and Yamamoto (Princeton) Causal Inference with Measurement Error April 28, 2008 15 / 27
Principal Stratification
Si ∈ {c,a,n,d}: Group i ’s “type”Si = c: compliant groups, same discussion outcomes as leader’s(pre-deliberation) preferenceSi = a: always prefers a given policySi = n: never prefers a given policySi = d : defiers, outcomes always opposite to leader’s preference
Often called “principal strata” (Frangakis & Rubin 2002)
Observed Str. True TTT Principal Str.Yi Z ∗
i Si
0 0 c, n0 1 n, d1 0 a, d1 1 c, a
Imai and Yamamoto (Princeton) Causal Inference with Measurement Error April 28, 2008 16 / 27
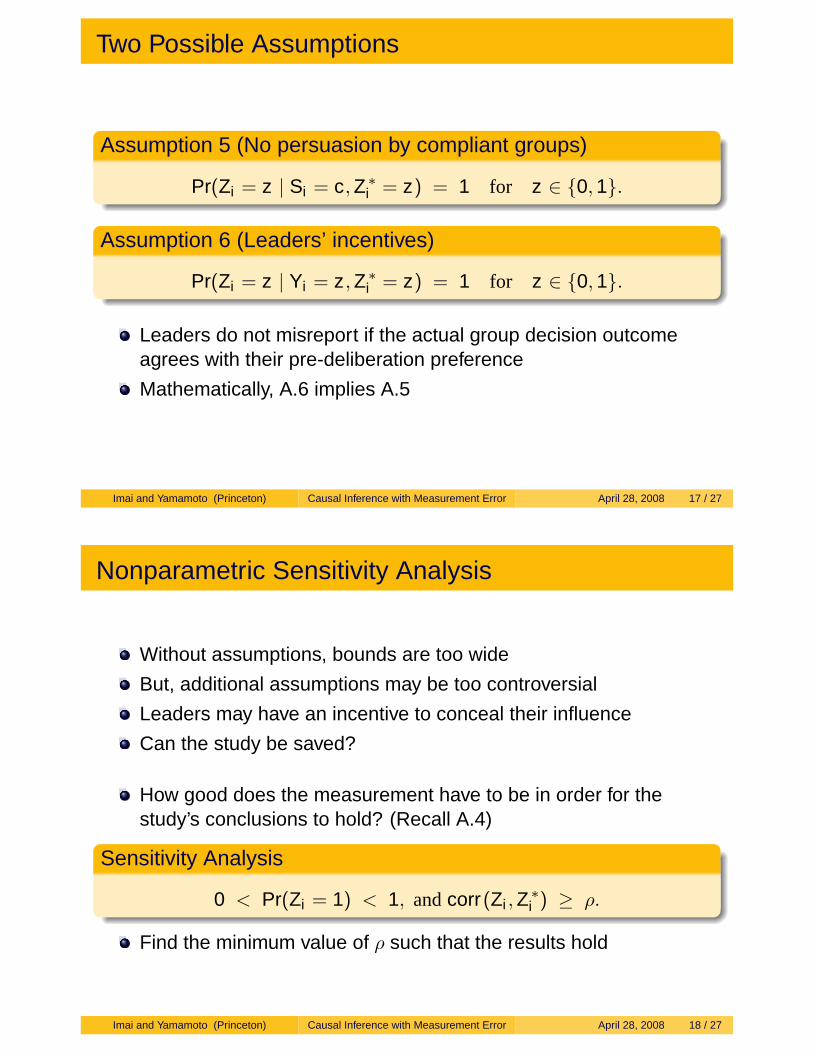
Two Possible Assumptions
Assumption 5 (No persuasion by compliant groups)
Pr(Zi = z | Si = c,Z ∗i = z) = 1 for z ∈ {0,1}.
Assumption 6 (Leaders’ incentives)
Pr(Zi = z | Yi = z,Z ∗i = z) = 1 for z ∈ {0,1}.
Leaders do not misreport if the actual group decision outcomeagrees with their pre-deliberation preference
Mathematically, A.6 implies A.5
Imai and Yamamoto (Princeton) Causal Inference with Measurement Error April 28, 2008 17 / 27
Nonparametric Sensitivity Analysis
Without assumptions, bounds are too wide
But, additional assumptions may be too controversial
Leaders may have an incentive to conceal their influence
Can the study be saved?
How good does the measurement have to be in order for thestudy’s conclusions to hold? (Recall A.4)
Sensitivity Analysis
0 < Pr(Zi = 1) < 1, andcorr(Zi ,Z∗i ) ≥ ρ.
Find the minimum value of ρ such that the results hold
Imai and Yamamoto (Princeton) Causal Inference with Measurement Error April 28, 2008 18 / 27
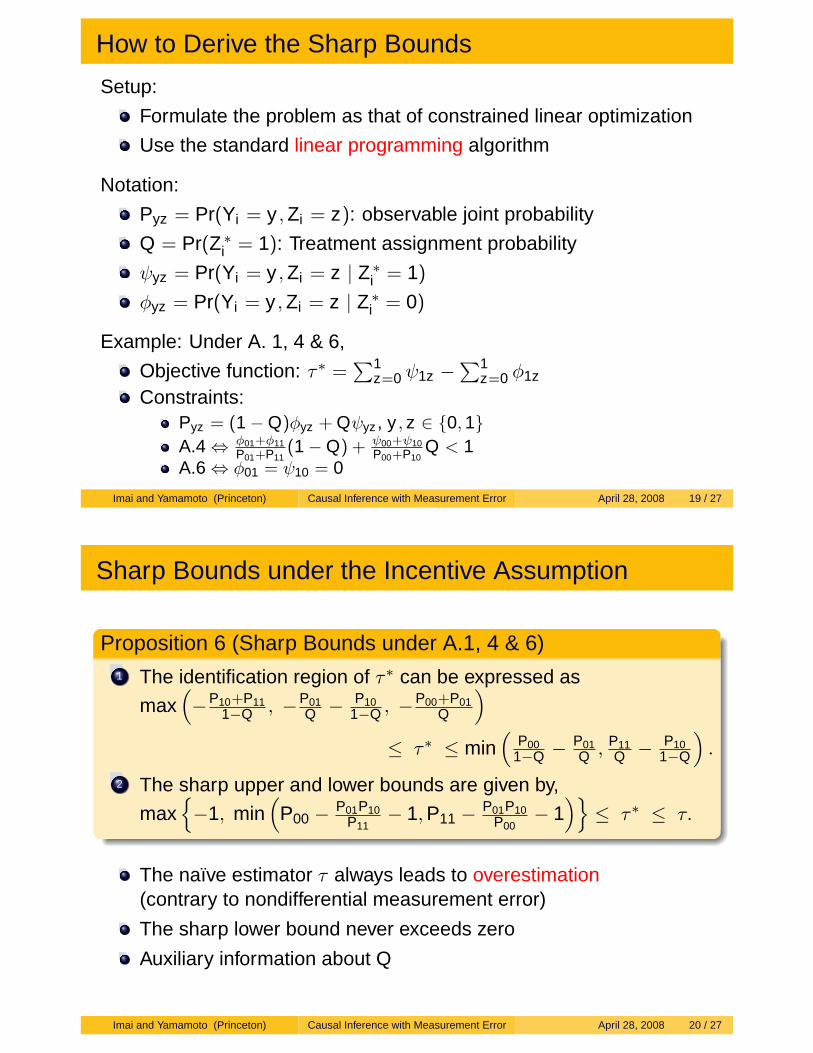
How to Derive the Sharp Bounds
Setup:
Formulate the problem as that of constrained linear optimization
Use the standard linear programming algorithm
Notation:
Pyz = Pr(Yi = y ,Zi = z): observable joint probability
Q = Pr(Z ∗i = 1): Treatment assignment probability
ψyz = Pr(Yi = y ,Zi = z | Z ∗i = 1)
φyz = Pr(Yi = y ,Zi = z | Z ∗i = 0)
Example: Under A. 1, 4 & 6,
Objective function: τ∗ =∑1
z=0 ψ1z −∑1
z=0 φ1z
Constraints:Pyz = (1−Q)φyz + Qψyz , y , z ∈ {0,1}A.4 ⇔ φ01+φ11
P01+P11(1−Q) + ψ00+ψ10
P00+P10Q < 1
A.6 ⇔ φ01 = ψ10 = 0
Imai and Yamamoto (Princeton) Causal Inference with Measurement Error April 28, 2008 19 / 27
Sharp Bounds under the Incentive Assumption
Proposition 6 (Sharp Bounds under A.1, 4 & 6)1 The identification region of τ∗ can be expressed as
max(−P10+P11
1−Q , −P01Q − P10
1−Q , −P00+P01
Q
)≤ τ∗ ≤ min
(P00
1−Q −P01Q , P11
Q − P101−Q
).
2 The sharp upper and lower bounds are given by,
max{−1, min
(P00 − P01P10
P11− 1,P11 − P01P10
P00− 1
)}≤ τ∗ ≤ τ.
The naïve estimator τ always leads to overestimation(contrary to nondifferential measurement error)
The sharp lower bound never exceeds zero
Auxiliary information about Q
Imai and Yamamoto (Princeton) Causal Inference with Measurement Error April 28, 2008 20 / 27
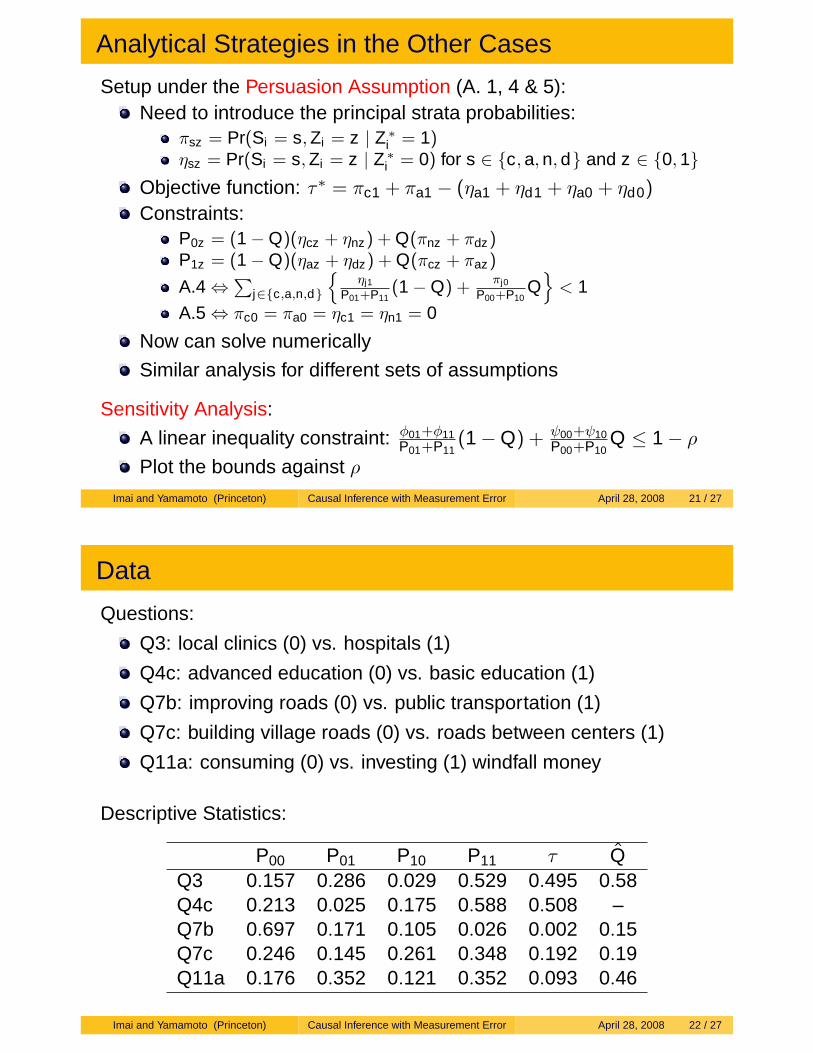
Analytical Strategies in the Other Cases
Setup under the Persuasion Assumption (A. 1, 4 & 5):Need to introduce the principal strata probabilities:
πsz = Pr(Si = s,Zi = z | Z ∗i = 1)
ηsz = Pr(Si = s,Zi = z | Z ∗i = 0) for s ∈ {c,a,n,d} and z ∈ {0,1}
Objective function: τ∗ = πc1 + πa1 − (ηa1 + ηd1 + ηa0 + ηd0)
Constraints:P0z = (1−Q)(ηcz + ηnz) + Q(πnz + πdz)P1z = (1−Q)(ηaz + ηdz) + Q(πcz + πaz)
A.4 ⇔∑
j∈{c,a,n,d}
{ηj1
P01+P11(1−Q) +
πj0
P00+P10Q
}< 1
A.5 ⇔ πc0 = πa0 = ηc1 = ηn1 = 0
Now can solve numerically
Similar analysis for different sets of assumptions
Sensitivity Analysis:
A linear inequality constraint: φ01+φ11P01+P11
(1−Q) + ψ00+ψ10P00+P10
Q ≤ 1− ρPlot the bounds against ρ
Imai and Yamamoto (Princeton) Causal Inference with Measurement Error April 28, 2008 21 / 27
Data
Questions:
Q3: local clinics (0) vs. hospitals (1)
Q4c: advanced education (0) vs. basic education (1)
Q7b: improving roads (0) vs. public transportation (1)
Q7c: building village roads (0) vs. roads between centers (1)
Q11a: consuming (0) vs. investing (1) windfall money
Descriptive Statistics:
P00 P01 P10 P11 τ Q̂Q3 0.157 0.286 0.029 0.529 0.495 0.58Q4c 0.213 0.025 0.175 0.588 0.508 –Q7b 0.697 0.171 0.105 0.026 0.002 0.15Q7c 0.246 0.145 0.261 0.348 0.192 0.19Q11a 0.176 0.352 0.121 0.352 0.093 0.46
Imai and Yamamoto (Princeton) Causal Inference with Measurement Error April 28, 2008 22 / 27
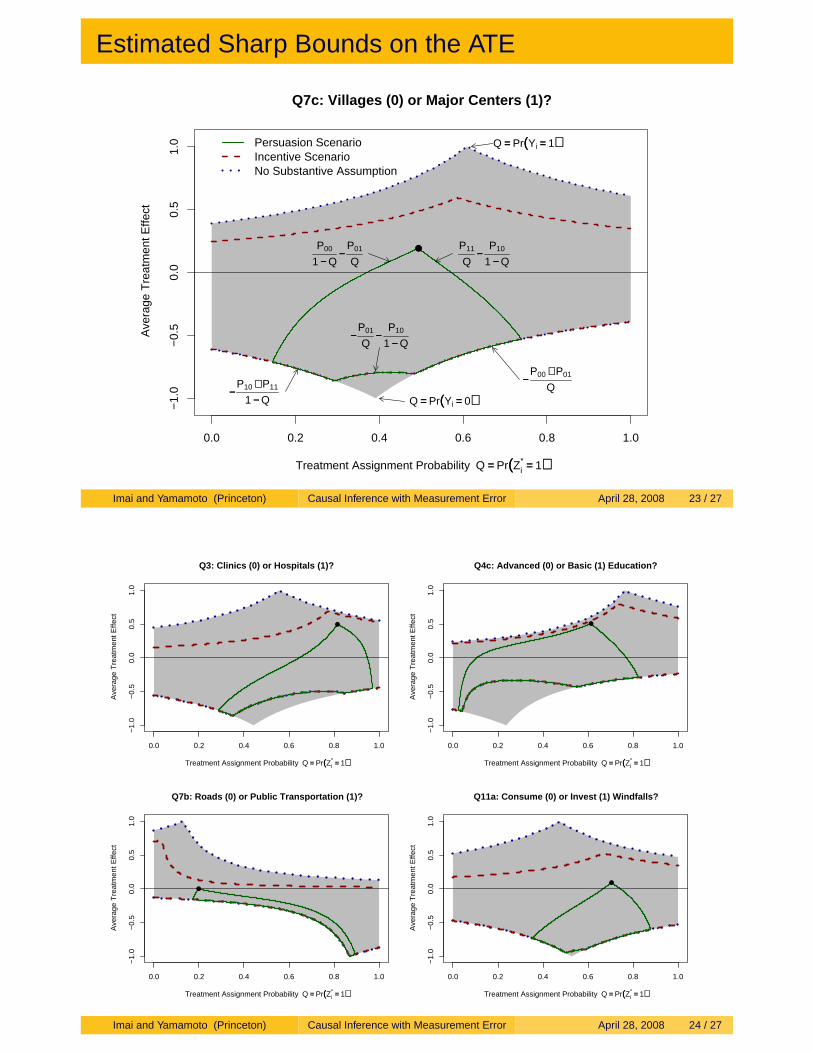
Estimated Sharp Bounds on the ATE
0.0 0.2 0.4 0.6 0.8 1.0
−1.
0−
0.5
0.0
0.5
1.0
Q7c: Villages (0) or Major Centers (1)?
Treatment Assignment Probability Q == Pr((Zi* == 1))
Ave
rage
Tre
atm
ent E
ffect
●
Persuasion ScenarioIncentive ScenarioNo Substantive Assumption
P00
1 −− Q−−
P01
Q
P11
Q−−
P10
1 −− Q
−−P10 ++ P11
1 −− Q
−−P01
Q−−
P10
1 −− Q
−−P00 ++ P01
Q
Q == Pr((Yi == 1))
Q == Pr((Yi == 0))
Imai and Yamamoto (Princeton) Causal Inference with Measurement Error April 28, 2008 23 / 27
0.0 0.2 0.4 0.6 0.8 1.0
−1.
0−
0.5
0.0
0.5
1.0
Q3: Clinics (0) or Hospitals (1)?
Treatment Assignment Probability Q == Pr((Zi* == 1))
Ave
rage
Tre
atm
ent E
ffect
●
0.0 0.2 0.4 0.6 0.8 1.0
−1.
0−
0.5
0.0
0.5
1.0
Q4c: Advanced (0) or Basic (1) Education?
Treatment Assignment Probability Q == Pr((Zi* == 1))
Ave
rage
Tre
atm
ent E
ffect
●
0.0 0.2 0.4 0.6 0.8 1.0
−1.
0−
0.5
0.0
0.5
1.0
Q7b: Roads (0) or Public Transportation (1)?
Treatment Assignment Probability Q == Pr((Zi* == 1))
Ave
rage
Tre
atm
ent E
ffect
●
0.0 0.2 0.4 0.6 0.8 1.0
−1.
0−
0.5
0.0
0.5
1.0
Q11a: Consume (0) or Invest (1) Windfalls?
Treatment Assignment Probability Q == Pr((Zi* == 1))
Ave
rage
Tre
atm
ent E
ffect
●
Imai and Yamamoto (Princeton) Causal Inference with Measurement Error April 28, 2008 24 / 27
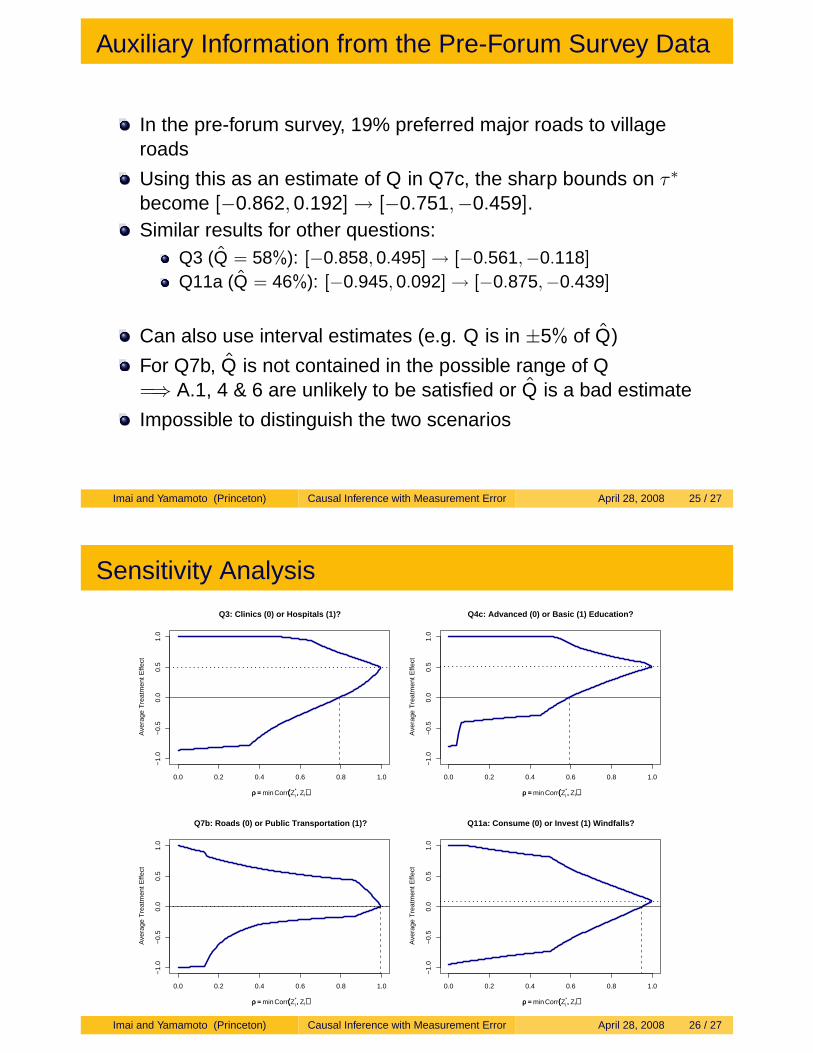
Auxiliary Information from the Pre-Forum Survey Data
In the pre-forum survey, 19% preferred major roads to villageroads
Using this as an estimate of Q in Q7c, the sharp bounds on τ∗
become [−0.862,0.192] → [−0.751,−0.459].Similar results for other questions:
Q3 (Q̂ = 58%): [−0.858,0.495] → [−0.561,−0.118]
Q11a (Q̂ = 46%): [−0.945,0.092] → [−0.875,−0.439]
Can also use interval estimates (e.g. Q is in ±5% of Q̂)
For Q7b, Q̂ is not contained in the possible range of Q=⇒ A.1, 4 & 6 are unlikely to be satisfied or Q̂ is a bad estimate
Impossible to distinguish the two scenarios
Imai and Yamamoto (Princeton) Causal Inference with Measurement Error April 28, 2008 25 / 27
Sensitivity Analysis
0.0 0.2 0.4 0.6 0.8 1.0
−1.
0−
0.5
0.0
0.5
1.0
Q3: Clinics (0) or Hospitals (1)?
ρρ == minCorr((Zi*,, Zi))
Ave
rage
Tre
atm
ent E
ffect
0.0 0.2 0.4 0.6 0.8 1.0
−1.
0−
0.5
0.0
0.5
1.0
Q4c: Advanced (0) or Basic (1) Education?
ρρ == minCorr((Zi*,, Zi))
Ave
rage
Tre
atm
ent E
ffect
0.0 0.2 0.4 0.6 0.8 1.0
−1.
0−
0.5
0.0
0.5
1.0
Q7b: Roads (0) or Public Transportation (1)?
ρρ == minCorr((Zi*,, Zi))
Ave
rage
Tre
atm
ent E
ffect
0.0 0.2 0.4 0.6 0.8 1.0
−1.
0−
0.5
0.0
0.5
1.0
Q11a: Consume (0) or Invest (1) Windfalls?
ρρ == minCorr((Zi*,, Zi))
Ave
rage
Tre
atm
ent E
ffect
Imai and Yamamoto (Princeton) Causal Inference with Measurement Error April 28, 2008 26 / 27
Concluding Remarks
Causal inference is difficult when differential ME is present
Bounds are informative but wide
No definitive conclusion about the influence of leaders
Avoid differential ME if possible!
Sensitivity analysis: Can the study be saved?
Additional assumptions based on qualitative knowledge
Nonparametric identification analysis as a starting point
Nonparametric sensitivity analysis for evaluating robustness
To what degree do debates and disagreements in the disciplinedepend on assumptions rather than empirical data?
Imai and Yamamoto (Princeton) Causal Inference with Measurement Error April 28, 2008 27 / 27