Embed Size (px)
Citation preview
Eur. Phys. J. C (2014) 74:2794DOI 10.1140/epjc/s10052-014-2794-6
123
Regular Article - Experimental Physics
Measurement of negatively charged pion spectra in inelastic p+pinteractions at plab = 20, 31, 40, 80 and 158 GeV/c
NA61/SHINE Collaboration
N. Abgrall1, A. Aduszkiewicz2,a, Y. Ali3, T. Anticic4, N. Antoniou5, B. Baatar6, F. Bay7, A. Blondel1, J. Blumer8,M. Bogomilov9, A. Bravar1, J. Brzychczyk3, S. A.Bunyatov6, O. Busygina10, P. Christakoglou5, T. Czopowicz11,N. Davis5, S. Debieux1, H. Dembinski8, F. Diakonos5, S. Di Luise7, W. Dominik2, T. Drozhzhova12, J. Dumarchez13,K. Dynowski11, R. Engel8, A. Ereditato14, G. A. Feofilov12, Z. Fodor15, A. Fulop15, M. Gazdzicki16,17,M. Golubeva10, K. Grebieszkow11, A. Grzeszczuk18, F. Guber10, A. Haesler1, T. Hasegawa19, M. Hierholzer14,R. Idczak20, S. Igolkin12, A. Ivashkin10, D. Jokovic21, K. Kadija4, A. Kapoyannis5, E. Kaptur18, D. Kiełczewska2,M. Kirejczyk2, J. Kisiel18, T. Kiss15, S. Kleinfelder22, T. Kobayashi19, V. I. Kolesnikov6, D. Kolev9, V. P. Kondratiev12,A. Korzenev1, P. Kovesarki20, S. Kowalski18, A. Krasnoperov6, A. Kurepin10, D. Larsen18, A. László15,V. V. Lyubushkin6, M. Mackowiak-Pawłowska17, Z. Majka3, B. Maksiak11, A. I. Malakhov6, D. Manic21,A. Marcinek3, V. Marin10, K. Marton15, H.-J. Mathes8, T. Matulewicz2, V. Matveev6,10, G. L. Melkumov6,St. Mrówczynski16, S. Murphy1, T. Nakadaira19, M. Nirkko14, K. Nishikawa19, T. Palczewski23, G. Palla15,A. D. Panagiotou5, T. Paul24, C. Pistillo14, W. Peryt11,b, O. Petukhov10, R. Płaneta3, J. Pluta 11, B. A. Popov6,13,M. Posiadała2, S. Puławski18, J. Puzovic21, W. Rauch25, M. Ravonel1, A. Redij14, R. Renfordt17, A. Robert13,D. Röhrich26, E. Rondio23, M. Roth8, A. Rubbia7, A. Rustamov17, M. Rybczynski16, A. Sadovsky10, K. Sakashita19,M. Savic21, K. Schmidt18, T. Sekiguchi19, P. Seyboth16, D. Sgalaberna7, M. Shibata19, R. Sipos15, E. Skrzypczak2,M. Słodkowski11, P. Staszel3, G. Stefanek16, J. Stepaniak23, H. Ströbele17, T. Šuša4, M. Szuba8, M. Tada19,V. Tereshchenko6, T. Tolyhi15, R. Tsenov9, L. Turko20, R. Ulrich8, M. Unger8, M. Vassiliou5, D. Veberic24,V. V. Vechernin12, G. Vesztergombi15, L. Vinogradov12, A. Wilczek18, Z. Włodarczyk16, A. Wojtaszek-Szwarc16,O. Wyszynski3, L. Zambelli13, W. Zipper18
1 University of Geneva, Geneva, Switzerland2 Faculty of Physics, University of Warsaw, Warsaw, Poland3 Jagiellonian University, Cracow, Poland4 Rudjer Boškovic Institute, Zagreb, Croatia5 University of Athens, Athens, Greece6 Joint Institute for Nuclear Research, Dubna, Russia7 ETH, Zurich, Switzerland8 Karlsruhe Institute of Technology, Karlsruhe, Germany9 Faculty of Physics, University of Sofia, Sofia, Bulgaria
10 Institute for Nuclear Research, Moscow, Russia11 Warsaw University of Technology, Warsaw, Poland12 St. Petersburg State University, St. Petersburg, Russia13 LPNHE, University of Paris VI and VII, Paris, France14 University of Bern, Bern, Switzerland15 KFKI Research Institute for Particle and Nuclear Physics, Budapest, Hungary16 Jan Kochanowski University in Kielce, Kielce, Poland17 University of Frankfurt, Frankfurt, Germany18 University of Silesia, Katowice, Poland19 High Energy Accelerator Research Organization (KEK), Tsukuba, Ibaraki 305-0801, Japan20 University of Wrocław, Wrocław, Poland21 University of Belgrade, Belgrade, Serbia22 University of California, Irvine, USA23 National Centre for Nuclear Research, Warsaw, Poland24 Laboratory of Astroparticle Physics, University Nova Gorica, Nova Gorica, Slovenia

2794 Page 2 of 22 Eur. Phys. J. C (2014) 74:2794
25 Fachhochschule Frankfurt, Frankfurt, Germany26 University of Bergen, Bergen, Norway
Received: 14 October 2013 / Accepted: 21 February 2014 / Published online: 15 March 2014© The Author(s) 2014. This article is published with open access at Springerlink.com
Abstract We present experimental results on inclusivespectra and mean multiplicities of negatively charged pionsproduced in inelastic p+p interactions at incident projectilemomenta of 20, 31, 40, 80 and 158 GeV/c (
√s = 6.3, 7.7,
8.8, 12.3 and 17.3 GeV, respectively). The measurementswere performed using the large acceptance NA61/SHINEhadron spectrometer at the CERN super proton synchrotron.Two-dimensional spectra are determined in terms of rapid-ity and transverse momentum. Their properties such as thewidth of rapidity distributions and the inverse slope parame-ter of transverse mass spectra are extracted and their collisionenergy dependences are presented. The results on inelasticp+p interactions are compared with the corresponding dataon central Pb+Pb collisions measured by the NA49 experi-ment at the CERN SPS. The results presented in this paper arepart of the NA61/SHINE ion program devoted to the studyof the properties of the onset of deconfinement and searchfor the critical point of strongly interacting matter. They arerequired for interpretation of results on nucleus–nucleus andproton–nucleus collisions.
1 Introduction
This paper presents experimental results on inclusive spectraand mean multiplicities of negatively charged pions producedin inelastic p+p interactions at 20, 31, 40, 80 and 158 GeV/c.The measurements were performed by the multi-purposeNA61/SHINE—the SPS Heavy Ion and Neutrino Experi-ment [1]—at the CERN Super Proton Synchrotron (SPS).They are part of the NA61/SHINE ion program devoted tothe study of the properties of the onset of deconfinement andsearch for the critical point of strongly interacting matter.Within this program data on p+p, Be+Be and p+Pb colli-sions were recorded and data on Ar+Ca and Xe+La colli-sions will be registered within the coming years. The startedtwo dimensional scan in collision energy and size of col-liding nuclei is mainly motivated by the observation of theonset of deconfinement [2,3] in central Pb+Pb collisions atabout 30A GeV/c by the NA49 experiment at the CERNSPS. Recently the NA49 results were confirmed by the RHICbeam energy scan programme and their interpretation by the
a e-mail: [email protected] Deceased
onset of deconfinement is supported by the LHC results (seeRef. [4] and references therein).
In addition to the ion programme, NA61/SHINE is con-ducting precise hadron production measurements for improv-ing calculations of the initial neutrino flux in long-baselineneutrino oscillation experiments [5–8] as well as for morereliable simulations of cosmic-ray air showers [9,10].
An interpretation of the rich experimental results onnucleus–nucleus collisions relies to a large extent on a com-parison to the corresponding data on p+p and p+A inter-actions. However, the available data concern mainly basicfeatures of unidentified charged hadron production and theyare sparse. Many needed results on hadron spectra, fluctua-tions and correlations are missing. Detailed measurements ofhadron spectra in a large acceptance in the beam momentumrange covered by the data presented in this paper exist onlyfor inelastic p+p interactions at 158 GeV/c [11–13]. Thusthe new high precision measurements of hadron productionproperties in p+p and p+A interactions are necessary andthey are performed in parallel with the corresponding mea-surements in nucleus–nucleus collisions. Among the manydifferent hadrons produced in high energy collisions pionsare the lightest and by far the most abundant ones. Thus, dataon pion production properties are crucial for constrainingbasic properties of models of strong interactions. In particu-lar, the most significant signals of the onset of deconfinement(the “kink” and “horn”) [14] require precise measurementsof the mean pion multiplicity at the same beam momentaper nucleon as the corresponding A+A data. Moreover, theNA61/SHINE data are taken with the same detector and thesame acceptance.
In the CERN SPS beam momentum range of 10–450 GeV/c the mean multiplicity of negatively charged pionsin inelastic p+p interactions increases from about 0.7 at10 GeV/c to about 3.5 at 450 GeV/c [15]. Among threecharged states of pions the most reliable measurements inthe largest phase–space are usually possible for π− mesons.Neutral pions decay electromagnetically into two photonsand thus measurements of their production properties requiremeasurements of both photons and then extraction of theπ0 signal from the two-photon mass spectra. Charged pionsare easy to detect by ionisation detectors as they decayweakly with a long lifetime (cτ = 7.8 m). A significantfraction of positively charged hadrons are protons (25 %)and kaons (5 %) [11–13]. Therefore measurements of π+mesons require their identification by measurements of the
123

Eur. Phys. J. C (2014) 74:2794 Page 3 of 22 2794
energy loss and/or time-of-flight (tof). This identification isnot as important for π− mesons because the contamination ofnegatively charged particles by K− mesons and anti-protonsis below 10 % [11–13] and can be subtracted reliably. Thelatter method is used in this paper and it allows to deriveπ− spectra in the broadest phase–space region in a uniformway. Results obtained using explicit pion identification areplanned in future NA61/SHINE publications.
The paper is organised as follows. In Sect. 2 the NA61/SHINE experimental set-up is described. Details on thebeam, trigger and event selection are given in Sect. 3.Data reconstruction, simulation and detector performance aredescribed in Sect. 4. Analysis techniques and final resultsare presented in Sects. 5 and 6, respectively. These resultsare compared with the corresponding data on central Pb+Pbcollisions in Sect. 7. A summary in Sect. 8 closes the paper.
The pion rapidity is calculated in the collision centre ofmass system: y = atanh(βL), where βL = pL/E is the lon-gitudinal component of the velocity, pL and E are pion lon-gitudinal momentum and energy given in the collision centreof mass system. The transverse component of the momen-tum is denoted as pT and the transverse mass mT is definedas mT = √
m2π + pT
2, where mπ is the charged pion mass.The nucleon mass and collision energy per nucleon pair inthe centre of mass system are denoted as mN and
√sNN,
respectively.
2 The NA61/SHINE facility
The NA61/SHINE experimental facility [20] consists of alarge acceptance hadron spectrometer located in the CERN
North Area Hall 887 (EHN1) and the H2 beam-line to whichbeams accelerated in the CERN accelerator complex aredelivered from the Super Proton Synchrotron. NA61/SHINEprofits from the long development of the CERN proton andion sources and the accelerator chain as well as the H2 beamline of the CERN North Area. The latter has recently beenmodified to also serve as a fragment separator as needed toproduce the Be beams for NA61/SHINE. Numerous com-ponents of the NA61/SHINE set-up were inherited from itspredecessor, the NA49 experiment [16].
The schematic layout of the NA61/SHINE detector isshown in Fig. 1.
A set of scintillation and Cherenkov counters as well asBeam Position Detectors (BPDs) upstream of the spectrome-ter provide timing reference, identification and position mea-surements of incoming beam particles. The trigger scintilla-tor counter S4 placed downstream of the target is used toselect events with collisions in the target area. Details on thissystem are presented in Sect. 3.
The main tracking devices of the spectrometer are largevolume Time Projection Chambers (TPCs). Two of them, thevertex TPCs (VTPC-1 and VTPC-2 in Fig. 1), are located inthe magnetic fields of two super-conducting dipole magnetswith a maximum combined bending power of 9 Tm whichcorresponds to about 1.5 and 1.1 T fields in the upstream anddownstream magnets, respectively. This field configurationwas used for data taking on p+p interactions at 158 GeV/c.In order to optimise the acceptance of the detector at lowercollision momenta, the field in both magnets was lowered inproportion to the beam momentum.
Fig. 1 The schematic layout of the NA61/SHINE experiment at theCERN SPS (horizontal cut, not to scale). The beam and trigger detectorconfiguration used for data taking on p+p interactions in 2009 is shown.Alignment of the chosen coordinate system is shown in the figure; its
origin lies in the middle of VTPC-2, on the beam axis. The nominalbeam direction is along the z axis. The magnetic field bends chargedparticle trajectories in the x–z (horizontal) plane. The drift direction inthe TPCs is along the y (vertical) axis
123

2794 Page 4 of 22 Eur. Phys. J. C (2014) 74:2794
Two large TPCs (MTPC-L and MTPC-R) are positioneddownstream of the magnets symmetrically to the beam line.The fifth small TPC (GAP-TPC) is placed between VTPC-1 and VTPC-2 directly on the beam line. It closes the gapbetween the beam axis and the sensitive volumes of the otherTPCs.
The TPCs are filled with Ar:CO2 gas mixtures in propor-tions 90:10 for the VTPCs and the GAP-TPC, and 95:5 forthe MTPCs.
The particle identification capability of the TPCs basedon measurements of the specific energy loss, dE/dx , is aug-mented by tof measurements using Time-of-Flight (ToF)detectors. The high resolution forward calorimeter, the Pro-jectile Spectator Detector (PSD), measures energy flowaround the beam direction, which in nucleus–nucleus col-lisions is primarily given by the projectile spectators.
NA61/SHINE uses various solid nuclear targets and a LHT(see Sect. 3 for details). The targets are positioned about80 cm upstream of the sensitive volume of VTPC-1.
The results presented in this paper were obtained usinginformation from the TPCs, the BPDs as well as from thebeam and trigger counters.
3 Beams, target, triggers and data samples
This section summarises basic information on the beams,target, triggers and recorded data samples which is relevantfor the results presented in this paper.
Secondary beams of positively charged hadrons at 20, 31,40, 80 and 158 GeV/c are produced from 400 GeV protonsextracted from the SPS in a slow extraction mode with aflat-top of 10 seconds. The secondary beam momentum andintensity is adjusted by proper setting of the H2 beam-linemagnet currents and collimators. The beam is transportedalong the H2 beam-line towards the experiment. The preci-sion of the setting of the beam magnet currents is approxi-mately 0.5 %. This was verified by a direct measurement ofthe beam momentum at 31 GeV/c by bending the incomingbeam particles into the TPCs with the maximum magneticfield [17]. The selected beam properties are given in Table 1.
The set-up of beam detectors is illustrated in the inset onFig. 1. Protons from the secondary hadron beam are iden-tified by two Cherenkov counters, a CEDAR [18] (eitherCEDAR-W or CEDAR-N) and a threshold counter (THC).The CEDAR counter, using a coincidence of six out of theeight photo-multipliers placed radially along the Cherenkovring, provides positive identification of protons, while theTHC, operated at pressure lower than the proton threshold, isused in anti-coincidence in the trigger logic. Due to their lim-ited range of operation two different CEDAR counters wereused, namely for beams at 20, 31, and 40 GeV/c the CEDAR-W counter and for beams at 80 and 158 GeV/c the CEDAR-N
Table 1 Basic beam properties and numbers of events recorded for p+pinteractions at 20, 31, 40, 80 and 158 GeV/c. The first column gives thebeam momentum. The second and third columns list typical numbersof beam particles at NA61/SHINE per spill (about 10 s) and the fractionof protons in the beam, respectively
pbeam (GeV/c) Particles per spill (k) Proton fraction (%)
20 1000 12
31 1000 14
40 1200 14
80 460 28
158 250 58
counter. The threshold counter was used for all beam ener-gies. A selection based on signals from the Cherenkov coun-ters allowed to identify beam protons with a purity of about99 %. A consistent value for the purity was found by bend-ing the beam into the TPCs with the full magnetic field andusing the dE/dx identification method [19]. The fraction ofprotons in the beams is given in Table 1.
Two scintillation counters, S1 and S2, provide beam def-inition, together with the three veto counters V0, V1 andV1p with a 1 cm diameter hole, which are defining the beambefore the target. The S1 counter provides also the timing(start time for all counters). Beam protons are then selectedby the coincidence S1∧S2∧V0∧V1∧V1p∧CEDAR∧THC.Trajectories of individual beam particles were measured in atelescope of BPDs placed along the beam line (BPD-1/2/3 inFig. 1). These counters are small (4.8×4.8 cm2) proportionalchambers with cathode strip readout, providing a resolutionof about 100 μm in two orthogonal directions, see Ref. [20]for more details. The beam profile and divergence obtainedfrom the BPD measurements are presented in Fig. 2. Dueto properties of the H2 beam line both the beam width anddivergence at the NA61/SHINE target increase with decreas-ing beam momentum.
For data taking on p+p interactions a LHT of 20.29 cmlength (2.8 % interaction length) and 3 cm diameter placed88.4 cm upstream of VTPC-1 was used. The Liquid Hydro-gen Target facility (LHT) filled the target cell with para-hydrogen obtained in a closed-loop liquefaction systemwhich was operated at 75 mbar overpressure with respect tothe atmosphere. At the atmospheric pressure of 965 mbarthe liquid hydrogen density is ρLH = 0.07 g/cm3. Theboiling rate in the liquid hydrogen was not monitored dur-ing the data taking and thus the liquid hydrogen densityis known only approximately. It has however no impacton the results presented in this paper as they are deter-mined from particle yields per selected event and thusthey are independent of the target density. Data takingwith inserted and removed liquid hydrogen in the LHTwas alternated in order to calculate a data-based correc-
123

Eur. Phys. J. C (2014) 74:2794 Page 5 of 22 2794
Fig. 2 Top The beam spot asmeasured by BPD-3 after the V1cut described in the text for20 GeV/c (left) and 158 GeV/c(right) beams. Bottom The beamdivergence in x and y for20 GeV/c (left) and 158 GeV/c(right) beams. All distributionswere arbitrarily scaled to the fullcolour scale. Widths of thedistributions are given in thelegend
x [cm]-0.5 0 0.5
y [c
m]
-0.8-0.6-0.4-0.2
00.20.40.60.8 20 GeV/c
= 0.55 cmyFWHM = 0.55 cmxFWHM
x [cm]-0.5 0 0.5
entr
ies
[arb
. un
its]
012345678910
158 GeV/c
= 0.25 cmyFWHM = 0.25 cmxFWHM
div x [mrad]
-1 0 1
div
y [
mra
d]
-1.5
-1
-0.5
0
0.5
1
1.5 20 GeV/c
= 0.90 mradyFWHM = 0.80 mradxFWHM
div x [mrad]
-1 0 1
entr
ies
[arb
. un
its]
012345678910
= 0.10 mradyFWHM = 0.20 mradxFWHM
158 GeV/c
tion for interactions with the material surrounding the liquidhydrogen.
Interactions in the target are selected by the trigger systemby an anti-coincidence of the incoming beam protons with asmall, 2 cm diameter, scintillation counter (S4) placed on thebeam trajectory between the two vertex magnets (see Fig. 1).This minimum bias trigger is based on the disappearance ofthe incident proton. In addition, unbiased proton beam eventswere recorded with a frequency typically by a factor of 10lower than the frequency of interaction events.
4 Data processing, simulation and detector performance
Detector parameters were optimised by a data-based calibra-tion procedure which also took into account their time depen-dences. Small adjustments were determined in consecutivesteps for:
(i) detector geometry, TPC drift velocities and distortionsdue to the magnetic field inhomogeneities in the cor-ners of VTPCs,
(ii) magnetic field setting,(iii) specific energy loss measurements,(iv) tof measurements.
Each step involved reconstruction of the data required to opti-mise a given set of calibration constants and time depen-dent corrections followed by verification procedures. Detailsof the procedure and quality assessment are presented in
Ref. [21]. The resulting performance in the measurementsof quantities relevant for this paper is discussed below.
The main steps of the data reconstruction procedure are:
(i) cluster finding in the TPC raw data, calculation of thecluster centre-of-gravity and total charge,
(ii) reconstruction of local track segments in each TPC sep-arately,
(iii) matching of track segments into global tracks,(iv) track fitting through the magnetic field and determi-
nation of track parameters at the first measured TPCcluster,
(v) determination of the interaction vertex using the beamtrajectory (x and y coordinates) fitted in the BPDs andthe trajectories of tracks reconstructed in the TPCs (zcoordinate),
(vi) refitting the particle trajectory using the interaction ver-tex as an additional point and determining the particlemomentum at the interaction vertex,
(vii) matching of ToF hits with the TPC tracks.
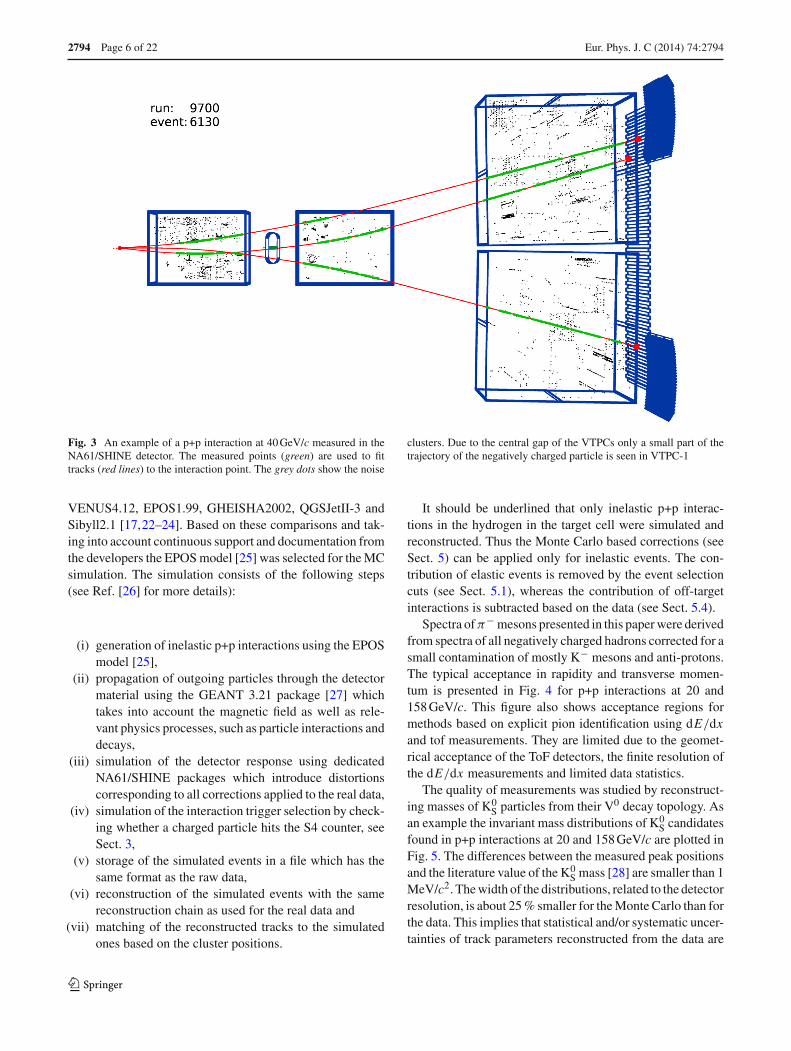
An example of a reconstructed p+p interaction at 40 GeV/cis shown in Fig. 3. Long tracks of one negatively charged andtwo positively charged particles are seen. All particles leavesignals in the ToF detectors.
A simulation of the NA61/SHINE detector response isused to correct the reconstructed data. Several MC mod-els were compared with the NA61/SHINE results on p+p,p+C and π+C interactions: FLUKA2008, URQMD1.3.1,
123
2794 Page 6 of 22 Eur. Phys. J. C (2014) 74:2794
Fig. 3 An example of a p+p interaction at 40 GeV/c measured in theNA61/SHINE detector. The measured points (green) are used to fittracks (red lines) to the interaction point. The grey dots show the noise
clusters. Due to the central gap of the VTPCs only a small part of thetrajectory of the negatively charged particle is seen in VTPC-1
VENUS4.12, EPOS1.99, GHEISHA2002, QGSJetII-3 andSibyll2.1 [17,22–24]. Based on these comparisons and tak-ing into account continuous support and documentation fromthe developers the EPOS model [25] was selected for the MCsimulation. The simulation consists of the following steps(see Ref. [26] for more details):
(i) generation of inelastic p+p interactions using the EPOSmodel [25],
(ii) propagation of outgoing particles through the detectormaterial using the GEANT 3.21 package [27] whichtakes into account the magnetic field as well as rele-vant physics processes, such as particle interactions anddecays,
(iii) simulation of the detector response using dedicatedNA61/SHINE packages which introduce distortionscorresponding to all corrections applied to the real data,
(iv) simulation of the interaction trigger selection by check-ing whether a charged particle hits the S4 counter, seeSect. 3,
(v) storage of the simulated events in a file which has thesame format as the raw data,
(vi) reconstruction of the simulated events with the samereconstruction chain as used for the real data and
(vii) matching of the reconstructed tracks to the simulatedones based on the cluster positions.
It should be underlined that only inelastic p+p interac-tions in the hydrogen in the target cell were simulated andreconstructed. Thus the Monte Carlo based corrections (seeSect. 5) can be applied only for inelastic events. The con-tribution of elastic events is removed by the event selectioncuts (see Sect. 5.1), whereas the contribution of off-targetinteractions is subtracted based on the data (see Sect. 5.4).
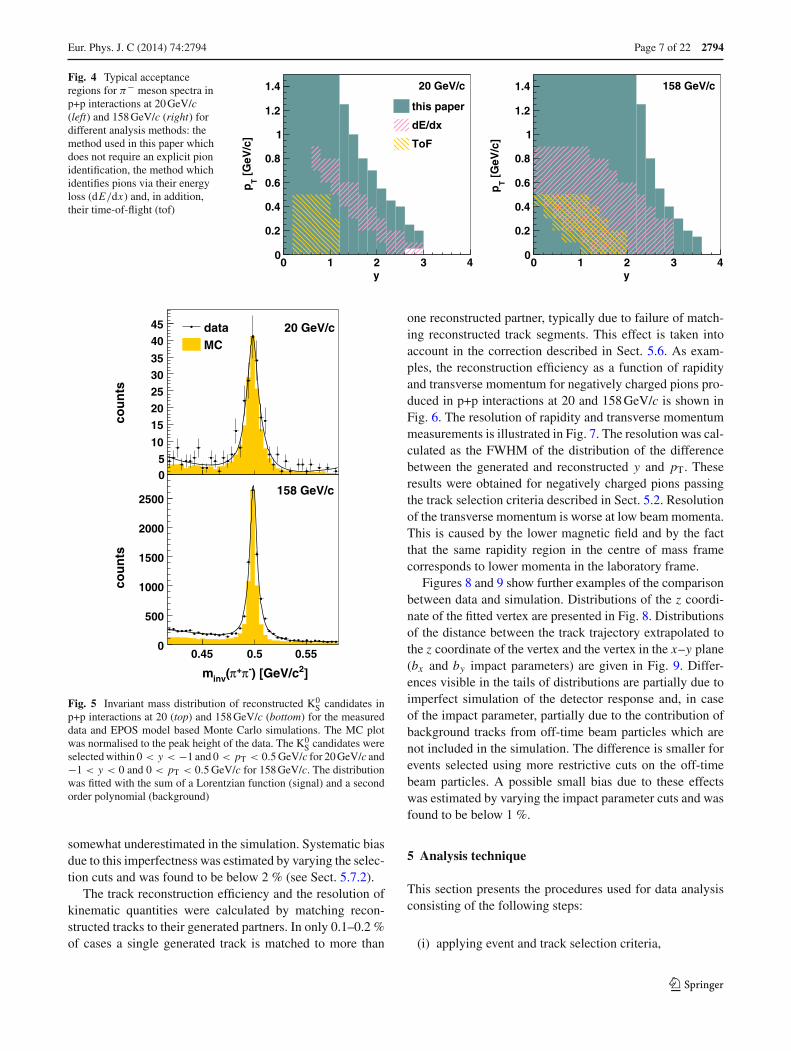
Spectra of π− mesons presented in this paper were derivedfrom spectra of all negatively charged hadrons corrected for asmall contamination of mostly K− mesons and anti-protons.The typical acceptance in rapidity and transverse momen-tum is presented in Fig. 4 for p+p interactions at 20 and158 GeV/c. This figure also shows acceptance regions formethods based on explicit pion identification using dE/dxand tof measurements. They are limited due to the geomet-rical acceptance of the ToF detectors, the finite resolution ofthe dE/dx measurements and limited data statistics.
The quality of measurements was studied by reconstruct-ing masses of K0
S particles from their V0 decay topology. Asan example the invariant mass distributions of K0
S candidatesfound in p+p interactions at 20 and 158 GeV/c are plotted inFig. 5. The differences between the measured peak positionsand the literature value of the K0
S mass [28] are smaller than 1MeV/c2. The width of the distributions, related to the detectorresolution, is about 25 % smaller for the Monte Carlo than forthe data. This implies that statistical and/or systematic uncer-tainties of track parameters reconstructed from the data are
123
Eur. Phys. J. C (2014) 74:2794 Page 7 of 22 2794
Fig. 4 Typical acceptanceregions for π− meson spectra inp+p interactions at 20 GeV/c(left) and 158 GeV/c (right) fordifferent analysis methods: themethod used in this paper whichdoes not require an explicit pionidentification, the method whichidentifies pions via their energyloss (dE/dx) and, in addition,their time-of-flight (tof)
y0 1 2 3 4
[G
eV/c
]T
p0
0.2
0.4
0.6
0.8
1
1.2
1.4
this paper
dE/dx
ToF
20 GeV/c
y0 1 2 3 4
[G
eV/c
]T
p
0
0.2
0.4
0.6
0.8
1
1.2
1.4 158 GeV/c
cou
nts
510
1520253035
4045 data
MC20 GeV/c
]2) [GeV/c-π+π(invm
0.45 0.5 0.55
cou
nts
0
500
1000
1500
2000
2500158 GeV/c
0
Fig. 5 Invariant mass distribution of reconstructed K0S candidates in
p+p interactions at 20 (top) and 158 GeV/c (bottom) for the measureddata and EPOS model based Monte Carlo simulations. The MC plotwas normalised to the peak height of the data. The K0
S candidates wereselected within 0 < y < −1 and 0 < pT < 0.5 GeV/c for 20 GeV/c and−1 < y < 0 and 0 < pT < 0.5 GeV/c for 158 GeV/c. The distributionwas fitted with the sum of a Lorentzian function (signal) and a secondorder polynomial (background)
somewhat underestimated in the simulation. Systematic biasdue to this imperfectness was estimated by varying the selec-tion cuts and was found to be below 2 % (see Sect. 5.7.2).
The track reconstruction efficiency and the resolution ofkinematic quantities were calculated by matching recon-structed tracks to their generated partners. In only 0.1–0.2 %of cases a single generated track is matched to more than
one reconstructed partner, typically due to failure of match-ing reconstructed track segments. This effect is taken intoaccount in the correction described in Sect. 5.6. As exam-ples, the reconstruction efficiency as a function of rapidityand transverse momentum for negatively charged pions pro-duced in p+p interactions at 20 and 158 GeV/c is shown inFig. 6. The resolution of rapidity and transverse momentummeasurements is illustrated in Fig. 7. The resolution was cal-culated as the FWHM of the distribution of the differencebetween the generated and reconstructed y and pT. Theseresults were obtained for negatively charged pions passingthe track selection criteria described in Sect. 5.2. Resolutionof the transverse momentum is worse at low beam momenta.This is caused by the lower magnetic field and by the factthat the same rapidity region in the centre of mass framecorresponds to lower momenta in the laboratory frame.
Figures 8 and 9 show further examples of the comparisonbetween data and simulation. Distributions of the z coordi-nate of the fitted vertex are presented in Fig. 8. Distributionsof the distance between the track trajectory extrapolated tothe z coordinate of the vertex and the vertex in the x–y plane(bx and by impact parameters) are given in Fig. 9. Differ-ences visible in the tails of distributions are partially due toimperfect simulation of the detector response and, in caseof the impact parameter, partially due to the contribution ofbackground tracks from off-time beam particles which arenot included in the simulation. The difference is smaller forevents selected using more restrictive cuts on the off-timebeam particles. A possible small bias due to these effectswas estimated by varying the impact parameter cuts and wasfound to be below 1 %.
5 Analysis technique
This section presents the procedures used for data analysisconsisting of the following steps:
(i) applying event and track selection criteria,
123

2794 Page 8 of 22 Eur. Phys. J. C (2014) 74:2794
y0 1 2 3
[G
eV/c
]T
p
0
0.5
1
1.5
98 98 97 97 98 98 9698 98 98 98 99 99 9999 99 99 98 99 99 9899 99 99 99 99 9999 99 99 99 9999 99 99 99 98
99 99 99 99
99 99 99 99
99 10020 GeV/c
effi
cien
cy [
%]
95
96
97
98
99
100
y1 2 3 4
100 100 97 98 99 98 98 98 9799 100 99 98 99 99 99 99 98
99 100 100 99 99 99 99 99 99 9699 100 99 99 99 99 99 99 9999 100 99 99 99 99 99 99 98100 99 99 99 99 99 99 99
100 99 99 99 99 99 99 99
96 100 99 99 99 99 99 99 97
97 99 99 99 99 99 100 98158 GeV/c
0
Fig. 6 Reconstruction efficiency of negatively charged pions producedin p+p interactions at 20 (left) and 158 GeV/c (right) as a function ofrapidity and transverse momentum. It was calculated by dividing the
number of tracks passing the track selection cuts specified in Sect. 5.2by the number of the generated tracks. The selection criteria include therequirement of at least 90 % reconstruction efficiency
[G
eV/c
]T
p 0.5
1
1.5
16 16 14 15 16 17 1314 13 13 12 15 18 15 88 11 9 10 12 22 206 10 8 8 11 285 8 8 7 7 175 7 6 6 8
5 6 6 5 7
4 5 5 4
4 4
20 GeV/c
y0 1 2 3
[G
eV/c
] T
p
0
0.5
1
3 4 3 4 4 6 55 5 5 5 6 8 7 410 10 7 7 8 18 1314 14 11 9 10 2423 19 13 11 15 2630 26 20 16 10
40 30 20 16 19
58 39 29 16
54 24
20 GeV/c
310×
(y r
eso
luti
on
)
05101520253035404550
1 28 8 9 10 10 14 16 18 1612 12 13 13 14 24 28 28 2412 13 12 12 20 36 33 3512 13 11 12 28 36 33 3610 10 9 12 34 33 4410 8 9 16 33 30 31
9 8 8 21 33 35
8 6 6 24 30 41
6 5 6 26 30
158 GeV/c
res
olu
tio
n [
MeV
/c]
Tp
051015202530354045
y1 2 3 4
2 3 3 3 3 5 7 6 63 3 4 3 4 7 9 8 64 4 4 4 6 12 11 145 5 4 5 11 15 13 127 6 5 7 19 18 238 6 6 11 22 20 21
10 8 7 18 26 32
12 8 8 26 34 47
16 10 10 38 57
158 GeV/c
0
0
Fig. 7 Resolution of rapidity (top, scaled by 103) and transversemomentum (bottom) measurements for negatively charged pions pro-duced in p+p interactions at 20 (left) and 158 GeV/c (right) as a function
of pion rapidity and transverse momentum. The results are obtainedusing the track selection cuts specified in Sect. 5.2
(ii) determination of spectra of negatively charged hadronsusing the selected events and tracks,
(iii) evaluation of corrections to the spectra based on exper-imental data and simulations,
(iv) calculation of the corrected spectra.
Corrections for the following biases were evaluated andapplied:
(i) geometrical acceptance,(ii) contribution of off-target interactions,
(iii) contribution of particles other than negatively chargedpions produced in inelastic p+p interactions,
(iv) losses of inelastic p+p interactions as well as of nega-tively charged pions produced in accepted interactionsdue to the trigger and the event and track selection cri-teria employed in the analysis.
These steps are described in the successive subsections.The final results refer to π− mesons produced in inelas-
tic p+p interactions by strong interaction processes and inelectromagnetic decays of produced hadrons. Such pions arereferred to as primary π−. The term primary will be used inthe above meaning also for other particles.
The analysis was performed independently in (y, pT) and(y, mT) bins. The bin sizes were selected taking into account
123

Eur. Phys. J. C (2014) 74:2794 Page 9 of 22 2794
even
ts/d
z [1
/cm
]
10
210
310
410
510
dataMC
20 GeV/c
fitted vertex z [cm]-700 -650 -600 -550 -500 -450
even
ts/d
z [1
/cm
]
10
210
310
410
158 GeV/c1
Fig. 8 Distribution of fitted vertex z coordinate for p+p interactions at20 (top) and 158 GeV/c (bottom). The black line shows the data aftertarget removed subtraction (see Sect. 5.4). The filled area shows thedistribution for the reconstructed Monte Carlo simulation. This distri-bution was normalised to the total integral of the data plot. The dashedvertical lines show the z vertex selection range
Table 2 Number of events recorded with the interaction trigger (all)and selected for the analysis (selected)
pbeam(GeV/c)
Target inserted Target removed
All (k) Selected (k) All (k) Selected (k)
20 1324 233 123 4
31 3145 843 332 15
40 5239 1578 529 44
80 4038 1543 429 54
158 3502 1650 427 51
the statistical uncertainties as well as the resolution of themomentum reconstruction. Corrections as well as statisticaland systematic uncertainties were calculated for each bin.
5.1 Event selection criteria
This section presents the event selection criteria. The num-ber of events selected by the trigger (see Sect. 3) and usedin the analysis is shown in Table 2. The fraction of eventsselected for the analysis increases with the interaction energy,mostly due to lower beam intensity (see Table 1) and resultingsmaller off-time particle contamination, and smaller fractionof the low multiplicity events for which no tracks are foundwithin the acceptance.
Fig. 9 Distribution of theimpact parameter in the x (left)and y (right) coordinate for p+pinteractions at 20 (top) and158 GeV/c (bottom). The blackline shows the data after targetremoved subtraction (seeSect. 5.4). The filled area showsthe reconstructed Monte Carlosimulation. The dashed verticallines show the accepted range(see Sect. 5.2). The dotted blueline in the 20 GeV/c plots showthe distribution obtained usingthe alternative event selection.Namely only events with nooff-time beam particles withinthe time window of ±6 μsaround the trigger particle timewere accepted
[cm]xb-4 -2 0 2 4
db
) [1
/cm
]⋅
trac
ks/(
even
ts
-610
-510
-410
-310
-210
-110
1
1020 GeV/c
[cm]yb-4 -2 0 2 4
data (alternative)
data
MC
[cm]xb-4 -2 0 2 4
db
) [1
/cm
]⋅
trac
ks/(
even
ts
-610
-510
-410
-310
-210
-110
1
10158 GeV/c
[cm]yb-4 -2 0 2 4
data
MC
123

2794 Page 10 of 22 Eur. Phys. J. C (2014) 74:2794
Table 3 Momentum thresholds used to reject elastic interactions (cut(v))
Beam momentum (GeV/c) 20 31 40 80 158
Threshold momentum (GeV/c) 17 28 35 74 –
The following event selection criteria were applied to theevents recorded with the interaction trigger:
(i) no off-time beam particle is detected within ±2 μsaround the trigger particle,
(ii) the beam particle trajectory is measured in at least oneof BPD-1 or BPD-2 and in the BPD-3 detector posi-tioned just in front of the LHT,
(iii) there is at least one track reconstructed in the TPCs andfitted to the interaction vertex,
(iv) the vertex z position (fitted using the beam and TPCtracks) is not farther away than 40 cm from the centreof the LHT,
(v) events with a single, well measured positively chargedtrack with absolute momentum close to the beammomentum are rejected. The momentum thresholds arelisted in Table 3.
The off-line (listed above) and on-line (the interaction trig-ger condition, see Sect. 3) event cuts select a large fractionof well measured (cuts (i) and (ii)) inelastic (cut (iii)) p+pinteractions. The cut (iii) removes part of elastic interac-tions. However in some elastic events at beam momenta upto 80 GeV/c the beam particle is deflected enough to be mea-sured in the detector. This is demonstrated in the momentumdistributions shown in Fig. 10. Such events are removed bycut (v).
Moreover cut (iv) significantly suppresses interactionsoutside the hydrogen in the target cell. The corrections forthe contribution of interactions outside the hydrogen in the
target cell and the loss of inelastic events are presented inSects. 5.4 and 5.6.
5.2 Track selection criteria
In order to select well-measured tracks of primary nega-tively charged hadrons as well as to reduce the contaminationof tracks from secondary interactions, weak decays and off-time interactions the following track selection criteria wereapplied:
(i) the track momentum fit at the interaction vertex shouldhave converged,
(ii) the fitted track charge is negative,(iii) the fitted track momentum component px is negative.
This selection minimises the angle between the tracktrajectory and the TPC pad direction for the chosenmagnetic field direction. This reduces statistical andsystematic uncertainties of the cluster position, energydeposit and track parameters,
(iv) the total number of reconstructed points on the trackshould be greater than 30,
(v) the sum of the number of reconstructed points in VTPC-1 and VTPC-2 should be greater than 15 or the num-ber of reconstructed points in the GAP-TPC should begreater than 4,
(vi) the distance between the track extrapolated to the inter-action plane and the interaction point (impact parame-ter) should be smaller than 4 cm in the horizontal (bend-ing) plane and 2 cm in the vertical (drift) plane,
(vii) the track should be measured in a high (≥90 %) TPCacceptance region (see Sect. 5.3),
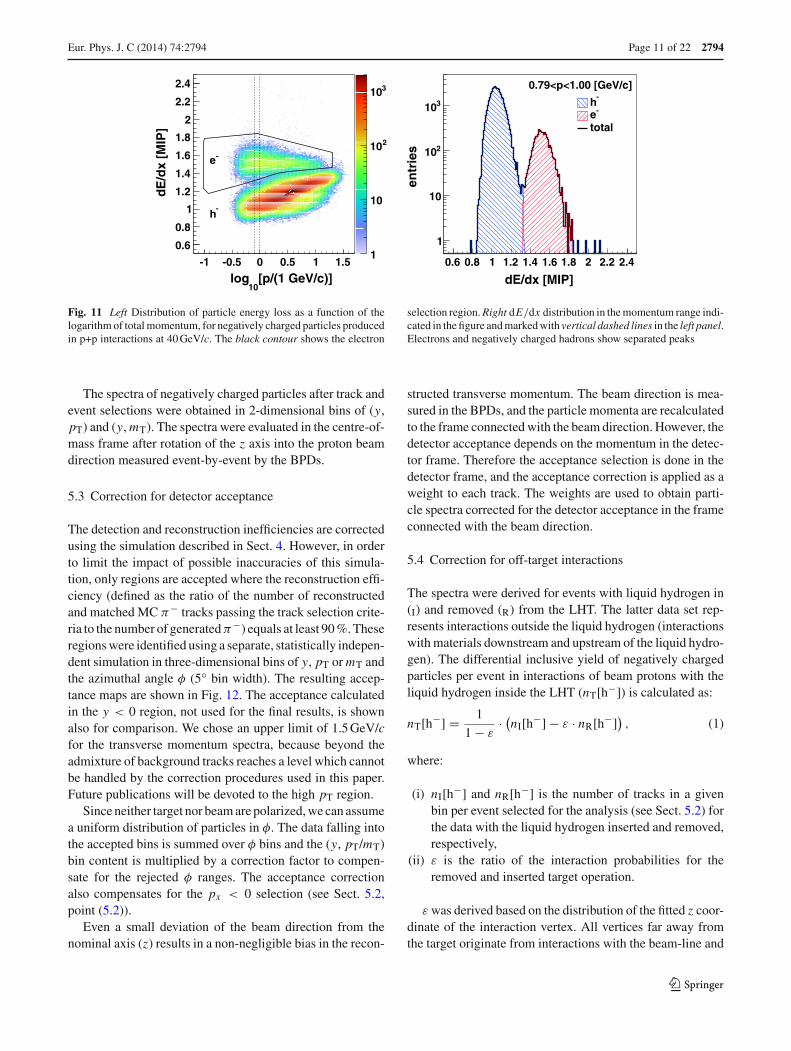
(viii) tracks with dE/dx and total momentum values char-acteristic for electrons are rejected. The electron con-tribution to particles with momenta above 20 GeV/c iscorrected using the simulation. The electron selectionprocedure is visualised in Fig. 11.
p [GeV/c]16 18 20 22 24
trac
ks/e
ven
ts
0
0.002
0.004
0.006
0.008 20 GeV/c
p [GeV/c]35 40 45
40 GeV/c
p [GeV/c]100 120 140 160
158 GeV/c
Fig. 10 Momentum distributions at 20 (left), 40 (middle) and158 GeV/c (right) of the positively charged tracks in events passingselection cuts (i)–(iv), containing a single track, which is positivelycharged and measured in the GAP TPC and MTPC. The distributions
were normalised to all events. The vertical dashed lines at 20 and40 GeV/c show the momentum threshold used to remove elastic events(cut (v))
123
Eur. Phys. J. C (2014) 74:2794 Page 11 of 22 2794
[p/(1 GeV/c)]10
log-1 -0.5 0 0.5 1 1.5
dE
/dx
[MIP
]
0.6
0.8
1
1.2
1.4
1.6
1.8
2
2.2
2.4
1
10
210
310
-e
-h
dE/dx [MIP]0.6 0.8 1 1.2 1.4 1.6 1.8 2 2.2 2.4
entr
ies
1
10
210
310-
h-e
total
0.79<p<1.00 [GeV/c]
Fig. 11 Left Distribution of particle energy loss as a function of thelogarithm of total momentum, for negatively charged particles producedin p+p interactions at 40 GeV/c. The black contour shows the electron
selection region. Right dE/dx distribution in the momentum range indi-cated in the figure and marked with vertical dashed lines in the left panel.Electrons and negatively charged hadrons show separated peaks
The spectra of negatively charged particles after track andevent selections were obtained in 2-dimensional bins of (y,pT) and (y, mT). The spectra were evaluated in the centre-of-mass frame after rotation of the z axis into the proton beamdirection measured event-by-event by the BPDs.
5.3 Correction for detector acceptance
The detection and reconstruction inefficiencies are correctedusing the simulation described in Sect. 4. However, in orderto limit the impact of possible inaccuracies of this simula-tion, only regions are accepted where the reconstruction effi-ciency (defined as the ratio of the number of reconstructedand matched MC π− tracks passing the track selection crite-ria to the number of generated π−) equals at least 90 %. Theseregions were identified using a separate, statistically indepen-dent simulation in three-dimensional bins of y, pT or mT andthe azimuthal angle φ (5◦ bin width). The resulting accep-tance maps are shown in Fig. 12. The acceptance calculatedin the y < 0 region, not used for the final results, is shownalso for comparison. We chose an upper limit of 1.5 GeV/cfor the transverse momentum spectra, because beyond theadmixture of background tracks reaches a level which cannotbe handled by the correction procedures used in this paper.Future publications will be devoted to the high pT region.
Since neither target nor beam are polarized, we can assumea uniform distribution of particles in φ. The data falling intothe accepted bins is summed over φ bins and the (y, pT/mT)bin content is multiplied by a correction factor to compen-sate for the rejected φ ranges. The acceptance correctionalso compensates for the px < 0 selection (see Sect. 5.2,point (5.2)).
Even a small deviation of the beam direction from thenominal axis (z) results in a non-negligible bias in the recon-
structed transverse momentum. The beam direction is mea-sured in the BPDs, and the particle momenta are recalculatedto the frame connected with the beam direction. However, thedetector acceptance depends on the momentum in the detec-tor frame. Therefore the acceptance selection is done in thedetector frame, and the acceptance correction is applied as aweight to each track. The weights are used to obtain parti-cle spectra corrected for the detector acceptance in the frameconnected with the beam direction.
5.4 Correction for off-target interactions
The spectra were derived for events with liquid hydrogen in(I) and removed (R) from the LHT. The latter data set rep-resents interactions outside the liquid hydrogen (interactionswith materials downstream and upstream of the liquid hydro-gen). The differential inclusive yield of negatively chargedparticles per event in interactions of beam protons with theliquid hydrogen inside the LHT (nT[h−]) is calculated as:
nT[h−] = 1
1 − ε· (
nI[h−] − ε · nR[h−]) , (1)
where:
(i) nI[h−] and nR[h−] is the number of tracks in a givenbin per event selected for the analysis (see Sect. 5.2) forthe data with the liquid hydrogen inserted and removed,respectively,
(ii) ε is the ratio of the interaction probabilities for theremoved and inserted target operation.
ε was derived based on the distribution of the fitted z coor-dinate of the interaction vertex. All vertices far away fromthe target originate from interactions with the beam-line and
123

2794 Page 12 of 22 Eur. Phys. J. C (2014) 74:2794
y-1 0 1 2 3 4
[G
eV/c
]T
p
0
0.2
0.4
0.6
0.8
1
1.2
1.4
bin
s ac
cep
ted
[%
]φ
frac
tio
n o
f
0
10
20
30
40
50
60
70
80
90
10020 GeV/c
y-1 0 1 2 3 4
[G
eV/c
]T
p
0
0.2
0.4
0.6
0.8
1
1.2
1.4
bin
s ac
cep
ted
[%
]φ
frac
tio
n o
f
0
10
20
30
40
50
60
70
80
90
100158 GeV/c
Fig. 12 Detector acceptance at 20 (left) and 158 GeV/c (right). The acceptance is calculated as fraction of (y, pT, φ) bins accepted for given yand pT for tracks with px < 0 selected for this analysis
Fig. 13 Distribution of fittedvertex z coordinate for data onp+p interactions at 40 GeV/c.The distribution for the datarecorded with the removedliquid hydrogen wasmultiplied by a factor ofNI[z > −450 cm]/NR[z > −450 cm]
fitted vertex z [cm]-700 -650 -600 -550 -500 -450 -400 -350 -300
even
ts
210
310
410
510
normalization region
target inserted
3.69)×target removed (
Table 4 The ratio of the interaction probabilities, ε, for the removedand inserted target operation for data taking on p+p interactions at 20,31, 40, 80 and 158 GeV/c
pbeam (GeV/c) ε (%)
20 8.0 ± 0.3
31 7.1 ± 0.1
40 10.4 ± 0.1
80 12.7 ± 0.1
158 12.6 ± 0.1
detector materials. Neglecting the beam attenuation in thetarget one gets:
ε = NR
NI· NI[z > −450 cm]
NR[z > −450 cm] , (2)
where N [z > −450 cm] is the number of events with fittedvertex z > −450 cm. Examples of distributions of z of thefitted vertex for events recorded with the liquid hydrogeninserted and removed are shown in Fig. 13. Values of ε arelisted in Table 4.
The correction for the off-target interactions changes theyields obtained from the target inserted data by less than±5 %, except in the regions where the statistical uncertaintyis high.
5.5 The correction for contamination of primaryπ− mesons
More than 90 % of primary negatively charged particles pro-duced in p+p interactions in the SPS energy range are π−mesons [11–13]. Thus π− meson spectra can be obtainedby subtracting the estimated non-pion contribution from thespectra of negatively charged particles and additional particleidentification is not required.
The simulation described in Sect. 4 was used to calculatecorrections for the admixture of particles other than primaryπ− mesons to the reconstructed negatively charged particles.The dominating contributions are primary K− and p, and sec-ondary π− from weak decays of and K0
S (feed-down) andfrom secondary interactions, incorrectly fitted to the primaryvertex.
123

Eur. Phys. J. C (2014) 74:2794 Page 13 of 22 2794
The EPOS spectra were adjusted based on the existingdata [24,29]. Preliminary NA61/SHINE results were used toscale double differential spectra of K−, and p [30]. EPOSspectra of π− were replaced by the preliminary NA61/SHINE results [31] normalised to the multiplicity from theworld data compilation [32]. Spectra of and K0
S were scaledby a constant factor derived at each energy using the worlddata compilation [33] of total multiplicities. The impact ofthe adjustments on the final spectra ranges from −2 % to+5 % in most regions, except of the low pT region at the lowbeam momenta, where it reaches +20 %.
As it was found in [24] the yields of K− and p are stronglycorrelated with the π− yield. Thus the correction for the con-tribution of primary hadrons is performed via the multiplica-tive factor cK. On the contrary the contribution due to weakdecays and secondary interactions is mostly located in thelow pT region, and it is weakly correlated with the primarypion yield in this region. Thus this feed-down contributionis corrected for using the additive correction cV. The totalcorrection is applied in as:
nprim[π−] = (nT[h−] − cV
) · cK, (3)
where
cV =(
n[π− ] + n[π−
K0S] + n[other]
)MC
sel, (4)
cK =(
n[π−]n[K−] + n[p] + n[π−]
)MC
sel. (5)
The spectrum of a particle x is denoted as n[x] whereasn[other] stands for all primary and secondary particles otherthan K−, p, π− and feed-down from and K0
S. The spec-trum n[other] of all other particles originates mostly fromsecondary interactions with >90 % occurring in the hydro-gen target. This contribution was taken from the simulationswithout an additional adjustment. The superscript MC marksadjusted EPOS spectra. The subscript sel indicates that theevent and track selection criteria were applied and then thecorrection for the detector acceptance was performed; thereconstructed tracks were identified by matching.
5.6 Correction for event as well as track lossesand migration
The multiplicative correction closs for losses of inelasticevents as well as losses and bin-to-bin migration of primaryπ− mesons emitted within the acceptance is calculated usingthe Monte Carlo simulation as:
closs = n[π−]MCgen / n[π−]MC
sel , (6)
where the subscript gen indicates the generated spectrumof primary π− mesons binned according to the generatedmomentum vector. Then the final, corrected π− meson spec-trum in inelastic p+p interactions is calculated as
n[π−] = closs · nprim[π−] . (7)
The dominating effects contributing to the closs correctionare
– losses of inelastic events due to the trigger and off-lineevent selection,
– the pion migration between analysis bins,– the pion reconstruction inefficiency.
5.7 Statistical and systematic uncertainties
5.7.1 Statistical uncertainties
Statistical errors receive contributions from the finite statis-tics of both the data as well as the simulated events used toobtain the correction factors. The dominating contribution isthe uncertainty of the data which is calculated assuming aPoisson probability distribution for the number of entries ina bin. The Monte Carlo statistics was higher than the datastatistics. Also the uncertainties of the Monte Carlo correc-tions are significantly smaller than the uncertainties of thenumber of entries in bins.
5.7.2 Systematic uncertainties
Systematic errors presented in this paper were calculated tak-ing into account contributions from the following effects.
(i) Possible biases due to event and track cuts which arenot corrected for. These are:
– a possible bias due to the dE/dx cut applied toremove electrons,
– a possible bias related to the removal of events withoff-time beam particles close in time to the triggerparticle.
The magnitude σi of possible biases was estimated byvarying values of the corresponding cuts. The dE/dxcut was changed by ±0.01 dE/dx units (where 1 cor-responds to a minimum ionising particle, and 0.04 is atypical width of a single particle distribution), and theoff-time interactions cut was varied from a ±1 μs toa ±3 μs time window. The assigned systematic uncer-tainty was calculated as the maximum of the absolutedifferences between the results obtained for both cutvalues. This contribution is drawn with a long-dashedred line in Fig. 14.
123

2794 Page 14 of 22 Eur. Phys. J. C (2014) 74:2794
Fig. 14 Statistical andsystematic uncertainties inselected bins of pT for 20 (left)and 158 GeV/c (right) p+p data.The shaded band shows thestatistical uncertainty. Thecoloured thin lines show thecontributions to the systematicuncertainty listed in Sect. 5.7.2.The thick black lines show thetotal systematic uncertainty,which was calculated by addingthe contributions in quadrature(continuous line) or linearly(dashed/dotted line, shown forcomparison) y
0 1 2 3 4
rela
tive
un
cert
ain
ty [
%]
0
5
10
15
20
25
30<0.05 [GeV/c]
T0.00<p20 GeV/c
y0 1 2 3 4
rela
tive
un
cert
ain
ty [
%]
0
5
10
15
20
25
30
Total (linear sum)Total (square sum)
iσiiσiiiσ
<0.05 [GeV/c]T
0.00<p158 GeV/c
y0 1 2 3 4
rela
tive
un
cert
ain
ty [
%]
0
5
10
15
20
25
30<0.25 [GeV/c]
T0.20<p20 GeV/c
y0 1 2 3 4
rela
tive
un
cert
ain
ty [
%]
0
5
10
15
20
25
30<0.25 [GeV/c]
T0.20<p158 GeV/c
y0 1 2 3 4
rela
tive
un
cert
ain
ty [
%]
0
5
10
15
20
25
30<0.70 [GeV/c]
T0.60<p20 GeV/c
y0 1 2 3 4
rela
tive
un
cert
ain
ty [
%]
0
5
10
15
20
25
30<0.70 [GeV/c]
T0.60<p158 GeV/c
(ii) Uncertainty of the correction for contamination of theprimary π− mesons. The systematic uncertainty σii
of this correction was assumed as 20 % (for 40, 80and 158 GeV/c) and 40 % (for 20 and 31 GeV/c) ofthe absolute value of the correction. At the low beammomenta there was less data available to adjust the sim-ulated spectra, which was the reason to increase theuncertainty. This contribution is drawn with a dashed-dotted blue line in Fig. 14. The absolute correction is
small thus the related systematic uncertainty is smallalso.
(iii) Uncertainty of the correction for the event losses. Theuncertainty was estimated using 20 % of the correc-tion magnitude and a comparison with the correctioncalculated using the VENUS [34,35] model:
σiii = 0.2 ·∣∣∣1 − cEPOS
loss
∣∣∣ +∣∣∣cEPOS
loss − cVENUSloss
∣∣∣ . (8)
123

Eur. Phys. J. C (2014) 74:2794 Page 15 of 22 2794
y-2 0 2
dy
dn
0
0.1
0.2
0.3
0.4
0.5
0.6
0.7
0.8
0.9NA61/SHINE (alternative)
NA61/SHINE
NA49
Fig. 15 Rapidity distribution of π− mesons produced in inelastic p+pinteractions at 158 GeV/c. The big blue points show the results obtainedwith an alternative method: without vertex fit requirement and rejectionof events with a single very high momentum positively charged track.The results of NA61/SHINE (this paper, red dots) are compared withthe NA49 measurements [11] (black squares). The open symbols showpoints reflected with respect to mid-rapidity. A single NA61/SHINEpoint measured at y < 0 is also shown for comparison. The shadedband shows the NA61/SHINE systematic uncertainty
This contribution is drawn with a short-dashed greenline in Fig. 14.
(iv) Uncertainty related to the track selection method. Itwas estimated by varying the track selection cuts:removing the impact parameter cut and decreasingthe minimum number of required points to 25 (total)and 10 (in VTPCs) and by checking symmetries withrespect to y = 0 and pT = 0. The potential biasis below 2 % and the corresponding contribution wasneglected.
The total systematic uncertainty was calculated by adding
in quadrature the contributions σsys =√
σ 2i + σ 2
ii + σ 2iii. This
uncertainty is listed in the tables including numerical valuesand it is visualised by a shaded band around the data points inplots presenting the results. Statistical and systematic uncer-tainties in selected example regions are shown in Fig. 14.Systematic biases in different bins are correlated, whereasstatistical fluctuations are almost independent.
Figure 15 presents a comparison of the rapidity spec-trum of π− mesons produced in inelastic p+p interactionsat 158 GeV/c (for details see Sect. 6) from the present analy-sis with the corresponding spectrum measured by NA49 [11].Statistical and systematic uncertainties of the NA49 spectrumare not explicitly given but the published information impliesthat the systematic uncertainty dominates and amounts toseveral %. The results agree within the systematic uncertain-ties of the NA61/SHINE spectra.
y-2 0 2
dy
dn
0
0.1
0.2
0.3
0.4
0.5
0.6
0.7NA61/SHINE (31 GeV/c)
MIRABELLE (32 GeV/c)
Fig. 16 Rapidity distribution of π− mesons produced in inelastic p+pinteractions. The NA61/SHINE results at 31 GeV/c (blue points) arecompared with the MIRABELLE measurement (parametrised by theblack line) at 32 GeV/c. The shaded band shows the NA61/SHINE sys-tematic uncertainty
The analysis method of p+p interactions at 158 GeV/c per-formed by NA49 [11] differed from the one used in this paper.In particular, pions were identified by dE/dx measurementand the NA49 event selection criteria did not include theselection according to the fitted z coordinate of the interac-tion vertex and the rejection of elastic interactions. Namely,all events passing the trigger selection and off-line qualitycuts were used for the analysis. For comparison, this eventselection procedure was applied to the NA61/SHINE data. Asa result 20 % more events were accepted. Approximately halfof them were unwanted elastic and off-target interactions andhalf were wanted inelastic interactions. Then the correctionscorresponding to the changed selection criteria were applied(the contribution of elastic events was subtracted using theestimate from Ref. [11]). The fully corrected rapidity spec-trum obtained using this alternative analysis is also shown inFig. 15. The differences between the results for the standardand alternative methods are below 0.5 % at y < 2 and below2 % at higher y.
Figure 16 shows a comparison of the rapidity distributionat 31 GeV/c with the MIRABELLE results at 32 GeV/c [36,37]. A parametrisation of the distribution and the total π−multiplicity are provided. As the parametrisation appears tobe incorrectly normalised, we normalised it to the total multi-plicity. The results agree within the NA61/SHINE systematicuncertainties.
The spectra measured in p+p interactions should obeyreflection symmetry with respect to mid-rapidity. As theNA61/SHINE acceptance extends somewhat below mid-rapidity a check of the reflection symmetry can be performedand used to validate the measurements. It was verified thatthe yields measured for y < 0 agree with those measuredfor y > 0 in the reflected acceptance within 1.5 %. A similar
123

2794 Page 16 of 22 Eur. Phys. J. C (2014) 74:2794
agreement was also found at lower beam momenta. The mea-surements above mid-rapidity are taken as the final results.Nevertheless, for comparison the points at y < 0 were addedin Figs. 15 and 20 in the regions where the pT acceptanceextends to zero.
6 Results
This section presents results on inclusive π− meson spectrain inelastic p+p interactions at beam momenta of 20, 31, 40,80 and 158 GeV/c. The spectra refer to pions produced bystrong interaction processes and in electromagnetic decaysof produced hadrons.
Numerical results corresponding to the plotted spectra aswell as their statistical and systematic uncertainties are givenin Ref. [38].
6.1 Double differential spectra
The double differential inclusive spectra of π− mesons inrapidity and transverse momentum produced in inelastic p+pinteractions at 20, 31, 40, 80 and 158 GeV/c are shown inFig. 17. The transverse momentum distributions at 20 and158 GeV/c are plotted in Fig. 18. Here d2n
dy d pTor d2n
dy dmTwere
calculated by dividing the fully corrected bin contents n[π−](see Sect. 5) by the bin size. The spectra in (y, mT) arenot shown here but they are given in the compilation of thenumerical values [38].
6.2 Transverse mass spectra
The transverse mass spectra at mid-rapidity (0 < y < 0.2)are shown in Fig. 19 (left). A function
dn
dmT= A · mT · exp
(−mT
T
)(9)
was fitted in the range 0.2 < mT − mπ < 0.7 GeV/c2 and isindicated by lines in Fig. 19 (left). The fitted parameters werethe normalisation A and the inverse slope T . They minimisethe χ2 function which was calculated using statistical errorsonly. In the χ2 calculation a measured bin content (dn/dmT)was compared with the integral of the fitted function in a bindivided by the bin width.
Similar fits were performed to spectra in other rapiditybins containing data in the fit range. The rapidity depen-dence of the fitted inverse slope parameter T is presentedin Fig. 19 (right). The T parameter decreases significantlywhen going from mid-rapidity to the projectile rapidity(ybeam = 1.877, 2.094, 2.223, 2.569 and 2.909 at 20, 31, 40,80 and 158 GeV/c, respectively).
6.3 Rapidity spectra
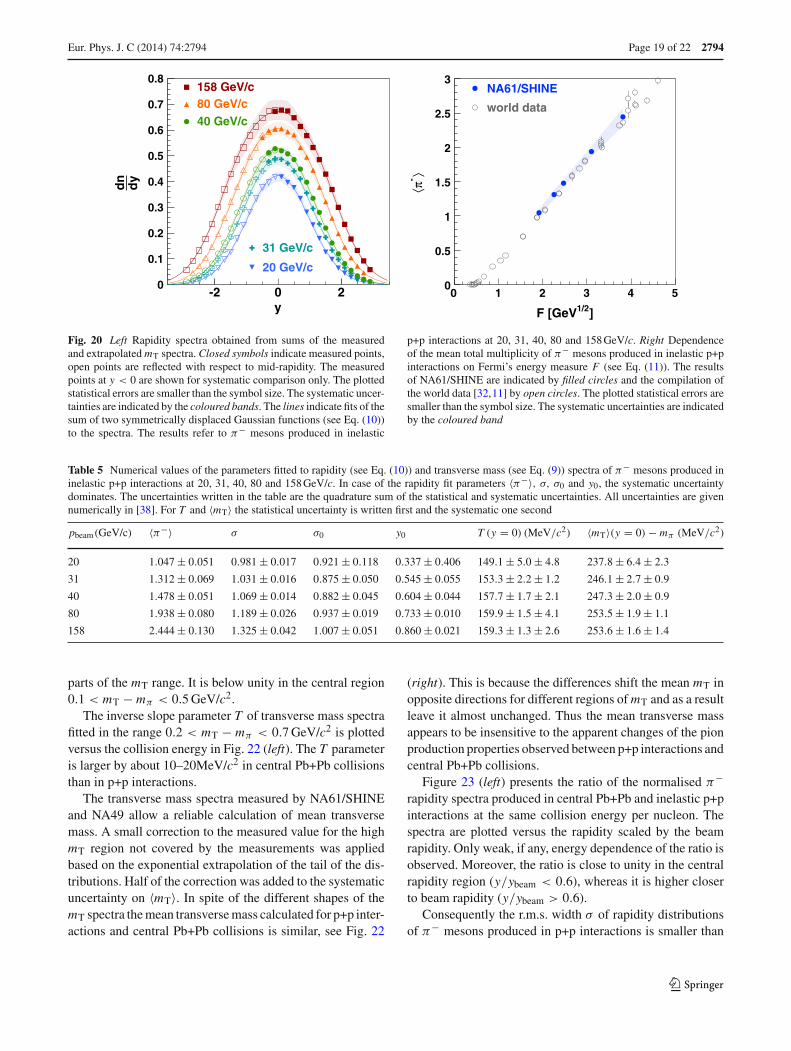
The rapidity spectra are shown in Fig. 20 (left). They wereobtained by summing the measured mT spectra and usingthe exponential function Eq. (9). The function was fitted inthe range ending at the maximum measured mT, and starting0.9 GeV/c2 below (note this is a different fit from the oneshown in Fig. 19). The correction is typically below 0.2 %and becomes significant (several %) only at y > 2.4. Halfof the correction is added in quadrature to the systematicuncertainty in order to take into account a potential imper-fectness of the exponential extrapolation. The pion yieldincreases with increasing collision energy at all measuredrapidities.
The rapidity spectra are parametrised by the sum of twoGaussian functions symmetrically displaced with respect tomid-rapidity:
dn
dy= 〈π−〉(y0, σ0)
2σ0√
2π·
·[
exp
(
− (y − y0)2
2σ 20
)
+ exp
(
− (y + y0)2
2σ 20
)]
,
(10)
where y0 and σ0 are fit parameters, and the total multiplic-ity 〈π−〉(y0, σ0) is calculated from the requirement that theintegral over the measured spectrum equals the integral of thefitted function Eq. (10) in the range covered by the measure-ments. The χ2 function was minimised in a similar way as incase of the mT spectra, namely using the integral of the func-tion in a given bin. The numerical values of the fitted param-
eters as well as the r.m.s. width σ =√
y20 + σ2
0 are given inTable 5.
6.4 Mean multiplicities
Mean multiplicities of π− mesons, 〈π−〉, produced in inelas-tic p+p interactions at 20, 31, 40, 80 and 158 GeV/c werecalculated as the integral of the fitted function Eq. (10). Theextrapolation into the unmeasured region at large y con-tributes about 1 %. Half of it is added in quadrature to thesystematic uncertainty.
The dependence of the produced average 〈π−〉 multiplic-ity per inelastic p+p collision on the Fermi’s energy mea-sure [39],
F ≡[(√
sNN − 2mN)3
√sNN
]1/4
(11)
is plotted in Fig. 20 (right). The results of NA61/SHINE arein agreement with a compilation of the world data [11,32].
123

Eur. Phys. J. C (2014) 74:2794 Page 17 of 22 2794
Fig. 17 Double differentialspectrad2n/(dy d pT)[(GeV/c)−1] ofπ− mesons produced ininelastic p+p interactions at 20,31, 40, 80 and 158 GeV/c
y0 1 2 3 4
[G
eV/c
]T
p0
0.2
0.4
0.6
0.8
1
1.2
1.4
0
0.2
0.4
0.6
0.8
1
1.2
1.420 GeV/c
y0 1 2 3 4
[G
eV/c
]T
p
0
0.2
0.4
0.6
0.8
1
1.2
1.4
0
0.2
0.4
0.6
0.8
1
1.2
1.431 GeV/c
y0 1 2 3 4
[G
eV/c
]T
p
0
0.2
0.4
0.6
0.8
1
1.2
1.4
0
0.2
0.4
0.6
0.8
1
1.2
1.440 GeV/c
y0 1 2 3 4
[G
eV/c
]T
p
0
0.2
0.4
0.6
0.8
1
1.2
1.4
0
0.2
0.4
0.6
0.8
1
1.2
1.480 GeV/c
y0 1 2 3 4
[G
eV/c
]T
p
0
0.2
0.4
0.6
0.8
1
1.2
1.4
0
0.2
0.4
0.6
0.8
1
1.2
1.4158 GeV/c
7 Comparison with central Pb+Pb collisions
In this section the NA61/SHINE results on inelastic p+p inter-actions are compared with the corresponding data on centralPb+Pb collisions published previously by NA49 [2,3]. Pionproduction properties which are different and similar in p+pinteractions and central Pb+Pb collisions are identified. Forcompleteness selected plots include the compilation of theworld data on inelastic p+p interactions [11,32], as well asresults on central Au+Au collisions from AGS [40,41] andRHIC [42–46], as processed in Ref. [3].
Figure 21 shows the ratio of transverse mass spectra ofπ− mesons produced at mid-rapidity (0 < y < 0.2) incentral Pb+Pb collisions and p+p interactions at the samecollision energy per nucleon. The spectra were normalisedto unity before dividing. First, one observes that the ratiois not constant implying that the spectral shapes are differ-ent in p+p interactions and central Pb+Pb collisions. Sec-ond, it is seen that the ratio depends weakly, if at all, oncollision energy. The ratio is higher than unity in the left(mT−mπ < 0.1 GeV/c2) and right (mT−mπ > 0.5 GeV/c2)
123

2794 Page 18 of 22 Eur. Phys. J. C (2014) 74:2794
Fig. 18 Transverse momentumspectra of π− mesons producedin inelastic p+p interactions at20 (left) and 158 GeV/c (right)in various rapidity ranges. Thelegend provides the centres ofthe rapidity bins, ybin and thescaling factor c used to separatethe spectra visually
[GeV/c]T
p0 0.5 1 1.5 2 2.5
]-1
[(G
eV/c
)d
yT
dp
n2d
-710
-610
-510
-410
-310
-210
-110
120 GeV/c
[GeV/c]T
p0 0.5 1 1.5 2 2.5
]-1
[(G
eV/c
)d
yT
dp
n2d
158 GeV/c
-710
-610
-510
-410
-310
-210
-110
1
]2 [GeV/cπ - mTm
0 0.5 1
]-2 )2
[(G
eV/c
Td
y d
mn2 dT
m1
-310
-210
-110
1
10
210
16×8×
4×2×
158 GeV/c80 GeV/c40 GeaV/c31 GeV/c20 GeV/c
beamy/y
0 0.2 0.4 0.6 0.8 1
]2
T [
MeV
/c
80
90
100
110
120
130
140
150
160
170
158 GeV/c80 GeV/c40 GeV/c
31 GeV/c20 GeV/c
Fig. 19 Left Transverse mass spectra at mid-rapidity (0 < y < 0.2).The fitted exponential function Eq. (9) is indicated by solid lines in thefit range 0.2 < mT − mπ < 0.7 GeV/c2 and dashed lines outside thefit range. The data points for different beam momenta were scaled forbetter readability. Right The inverse slope parameter T of the transverse
mass spectra as a function of rapidity divided by the projectile rapidity.The fit range is 0.2 < mT − mπ < 0.7 GeV/c2. The results refer toπ− mesons produced in inelastic p+p interactions at 20, 31, 40, 80 and158 GeV/c
123
Eur. Phys. J. C (2014) 74:2794 Page 19 of 22 2794
y-2 0 2
dy
dn
0
0.1
0.2
0.3
0.4
0.5
0.6
0.7
0.8158 GeV/c80 GeV/c40 GeV/c
31 GeV/c
20 GeV/c
]1/2F [GeV
0 1 2 3 4 5
⟩- π⟨
0
0.5
1
1.5
2
2.5
3NA61/SHINE
world data
Fig. 20 Left Rapidity spectra obtained from sums of the measuredand extrapolated mT spectra. Closed symbols indicate measured points,open points are reflected with respect to mid-rapidity. The measuredpoints at y < 0 are shown for systematic comparison only. The plottedstatistical errors are smaller than the symbol size. The systematic uncer-tainties are indicated by the coloured bands. The lines indicate fits of thesum of two symmetrically displaced Gaussian functions (see Eq. (10))to the spectra. The results refer to π− mesons produced in inelastic
p+p interactions at 20, 31, 40, 80 and 158 GeV/c. Right Dependenceof the mean total multiplicity of π− mesons produced in inelastic p+pinteractions on Fermi’s energy measure F (see Eq. (11)). The resultsof NA61/SHINE are indicated by filled circles and the compilation ofthe world data [32,11] by open circles. The plotted statistical errors aresmaller than the symbol size. The systematic uncertainties are indicatedby the coloured band
Table 5 Numerical values of the parameters fitted to rapidity (see Eq. (10)) and transverse mass (see Eq. (9)) spectra of π− mesons produced ininelastic p+p interactions at 20, 31, 40, 80 and 158 GeV/c. In case of the rapidity fit parameters 〈π−〉, σ, σ0 and y0, the systematic uncertaintydominates. The uncertainties written in the table are the quadrature sum of the statistical and systematic uncertainties. All uncertainties are givennumerically in [38]. For T and 〈mT〉 the statistical uncertainty is written first and the systematic one second
pbeam(GeV/c) 〈π−〉 σ σ0 y0 T (y = 0) (MeV/c2) 〈mT〉(y = 0) − mπ (MeV/c2)
20 1.047 ± 0.051 0.981 ± 0.017 0.921 ± 0.118 0.337 ± 0.406 149.1 ± 5.0 ± 4.8 237.8 ± 6.4 ± 2.3
31 1.312 ± 0.069 1.031 ± 0.016 0.875 ± 0.050 0.545 ± 0.055 153.3 ± 2.2 ± 1.2 246.1 ± 2.7 ± 0.9
40 1.478 ± 0.051 1.069 ± 0.014 0.882 ± 0.045 0.604 ± 0.044 157.7 ± 1.7 ± 2.1 247.3 ± 2.0 ± 0.9
80 1.938 ± 0.080 1.189 ± 0.026 0.937 ± 0.019 0.733 ± 0.010 159.9 ± 1.5 ± 4.1 253.5 ± 1.9 ± 1.1
158 2.444 ± 0.130 1.325 ± 0.042 1.007 ± 0.051 0.860 ± 0.021 159.3 ± 1.3 ± 2.6 253.6 ± 1.6 ± 1.4
parts of the mT range. It is below unity in the central region0.1 < mT − mπ < 0.5 GeV/c2.
The inverse slope parameter T of transverse mass spectrafitted in the range 0.2 < mT − mπ < 0.7 GeV/c2 is plottedversus the collision energy in Fig. 22 (left). The T parameteris larger by about 10–20MeV/c2 in central Pb+Pb collisionsthan in p+p interactions.
The transverse mass spectra measured by NA61/SHINEand NA49 allow a reliable calculation of mean transversemass. A small correction to the measured value for the highmT region not covered by the measurements was appliedbased on the exponential extrapolation of the tail of the dis-tributions. Half of the correction was added to the systematicuncertainty on 〈mT〉. In spite of the different shapes of themT spectra the mean transverse mass calculated for p+p inter-actions and central Pb+Pb collisions is similar, see Fig. 22
(right). This is because the differences shift the mean mT inopposite directions for different regions of mT and as a resultleave it almost unchanged. Thus the mean transverse massappears to be insensitive to the apparent changes of the pionproduction properties observed between p+p interactions andcentral Pb+Pb collisions.
Figure 23 (left) presents the ratio of the normalised π−rapidity spectra produced in central Pb+Pb and inelastic p+pinteractions at the same collision energy per nucleon. Thespectra are plotted versus the rapidity scaled by the beamrapidity. Only weak, if any, energy dependence of the ratio isobserved. Moreover, the ratio is close to unity in the centralrapidity region (y/ybeam < 0.6), whereas it is higher closerto beam rapidity (y/ybeam > 0.6).
Consequently the r.m.s. width σ of rapidity distributionsof π− mesons produced in p+p interactions is smaller than
123

2794 Page 20 of 22 Eur. Phys. J. C (2014) 74:2794
]2 [GeV/cπ - mTm0 0.2 0.4 0.6 0.8 1
(Pb
+Pb
)/(p
+p)
0
0.2
0.4
0.6
0.8
1
1.2
1.4
1.6
1.8
2
GeV/cA158
GeV/cA80
GeV/cA40
GeV/cA31
GeV/cA20
Fig. 21 The ratio of the normalised transverse mass spectra of π−mesons at mid-rapidity produced in central Pb+Pb collisions and inelas-tic p+p interactions at the same collision energy per nucleon. Thecoloured bands represent the systematic uncertainty of the p+p data
the width in central Pb+Pb collisions. This is seen in Fig. 23(right) where the energy dependence of σ is plotted. Addi-tionally, p+p data from [11,36,37,47] are shown; they agreewith the NA61/SHINE results.
Note, that when interpreting differences between resultsobtained for inelastic p+p interactions and central Pb+Pbcollisions the isospin effects should be taken into account.This concerns both the spectra as well as the total multiplic-ities [11].
In order to reduce their influence the mean multiplicity ofpions is obtained from a sum of mean multiplicities of neg-atively and positively charged pions using the phenomeno-
logical formula [15]:
〈π〉 = 3
2
(〈π+〉 + 〈π−〉) . (12)
The results divided by the mean number of wounded nucle-ons (NW = 2 for p+p) are shown in Fig. 24 as a func-tion of the Fermi energy measure F . The value of 〈π+〉 forthe NA61/SHINE results on inelastic p+p interactions wasestimated from the measured 〈π−〉 multiplicity assuming〈π+〉 = 〈π−〉+2/3. This assumption is based on the compi-lation of the world data presented in Ref. [15] and the modelpresented therein. At beam momenta lower than 40A GeV/cthe 〈π〉/〈NW〉 ratio is higher in p+p interactions than in cen-tral Pb+Pb collisions. The opposite relation holds for beammomenta higher than 40A GeV/c. The energy dependence forinelastic p+p interactions crosses the one for central Pb+Pb(Au+Au) collisions at about 40A GeV/c.
8 Summary
We presented experimental results on inclusive spectra andmean multiplicities of negatively charged pions produced ininelastic p+p interactions at 20, 31, 40, 80 and 158 GeV/c.Two dimensional spectra in transverse momentum and rapid-ity and parameters characterizing them were given. Theresults agree with existing sparse measurements, extend theirrange, accuracy and depth of detail.
The results on inelastic p+p interactions were comparedwith the corresponding data on central Pb+Pb collisionsobtained by NA49. The spectra in p+p interactions are nar-rower both in rapidity and in transverse mass, which might be
[GeV]NNs
6 7 8 9 10 20
]2
T [
MeV
/c
140
150
160
170
180
190
200p+p (SPS - NA61/SHINE)
Pb+Pb (SPS)
[GeV]NNs1 10 210
]2 [
GeV
/cπ
- m
⟩T
m⟨
0
0.05
0.1
0.15
0.2
0.25
0.3
0.35
0.4
p+p (SPS - NA61/SHINE)
Au+Au (AGS)
Pb+Pb (SPS)
Au+Au (RHIC)
Fig. 22 Left Inverse slope parameter T of the transverse mass spectraat mid-rapidity (0 < y < 0.2) plotted against the collision energy pernucleon. The parameter T was fitted in the range 0.2 < mT − mπ <
0.7 GeV/c2. The systematic uncertainty for the two lowest energy pointsfor Pb+Pb, not given in [3] is assumed to be the same as for the
higher energies [2]. Right Mean transverse mass 〈mT〉 at mid-rapidity(0 < y < 0.2) versus the collision energy. The results on inelastic p+pinteractions are compared with the corresponding data on central Pb+Pb(Au+Au) collisions
123

Eur. Phys. J. C (2014) 74:2794 Page 21 of 22 2794
beamy/y
0 0.5 1 1.5
(Pb
+Pb
)/(p
+p)
0.6
0.8
1
1.2
1.4
GeV/cA158
GeV/cA80
GeV/cA40
GeV/cA31
GeV/cA20
[GeV]NNs6 7 8 9 10 20
σ
0.9
1
1.1
1.2
1.3
1.4
1.5p+p (SPS - NA61/SHINE)
p+p (world)
Pb+Pb (SPS)
Fig. 23 Left The ratio of normalised rapidity spectra of π− mesonsproduced in central Pb+Pb collisions and inelastic p+p interactions atthe same collision energy per nucleon plotted versus the rapidity scaledby the beam rapidity. The coloured bands represent the NA61/SHINE
systematic uncertainty. Right Energy dependence of the width of therapidity distribution of π− mesons produced in p+p interactions andcentral Pb+Pb collisions. The systematic uncertainty for the Pb+Pbpoints is not given
]1/2F [GeV
0 1 2 3 4 5
⟩W
N⟨/⟩π⟨
0
1
2
3
4
5
6
7
8p+p (SPS - NA61/SHINE)
p+p (world)
Au+Au (AGS)
Pb+Pb (SPS)
Au+Au (RHIC)
Fig. 24 Mean multiplicity of all pions per wounded nucleon producedin inelastic p+p interactions and central Pb+Pb (Au+Au) collisions. Thevertical lines show the total uncertainty
attributed to isospin effects. The mean pion multiplicity perwounded nucleon in p+p interactions increases more slowlywith energy in the SPS range and crosses the correspond-ing dependence measured in the Pb+Pb collisions at about40A GeV/c.
Acknowledgments This work was supported by the Hungarian Scien-tific Research Fund (Grants OTKA 68506 and 71989), the Polish Min-istry of Science and Higher Education (Grants 667/N-CERN/2010/0,NN 202 48 4339 and NN 202 23 1837), the National Science Cen-ter of Poland (Grant UMO-2012/04/M/ST2/00816), the Foundation forPolish Science—MPD program, co-financed by the European Unionwithin the European Regional Development Fund, the Federal Agencyof Education of the Ministry of Education and Science of the Rus-sian Federation (Grant RNP 2.2.2.2.1547), the Russian Academy ofScience and the Russian Foundation for Basic Research (Grants 08-02-
00018, 09-02-00664, and 12-02-91503-CERN), the Ministry of Educa-tion, Culture, Sports, Science and Technology, Japan, Grant-in-Aid forScientific Research (Grants 18071005, 19034011, 19740162, 20740160and 20039012), the German Research Foundation (Grants GA 1480/2-1,GA 1480/2-2), Bulgarian National Scientific Foundation (Grant DDVU02/19/2010), Ministry of Education and Science of the Republic of Ser-bia (Grant OI171002), Swiss Nationalfonds Foundation (Grant 200020-117913/1) and ETH Research Grant TH-01 07-3. Finally, it is a pleasureto thank the European Organization for Nuclear Research for a strongsupport and hospitality and, in particular, the operating crews of theCERN SPS accelerator and beam lines who made the measurementspossible.
Open Access This article is distributed under the terms of the CreativeCommons Attribution License which permits any use, distribution, andreproduction in any medium, provided the original author(s) and thesource are credited.Funded by SCOAP3 / License Version CC BY 4.0.
References
1. N. Antoniou et al. (NA49-future Collaboration), CERN-SPSC-2006-034 (2006)
2. S.V. Afanasiev et al., (NA49 Collaboration). Phys. Rev. C 66,054902 (2002). [arXiv:0205002 [nucl-ex]]
3. C. Alt et al., (NA49 Collaboration), Phys. Rev. C 77, 024903(2008). [arXiv:0710.0118 [nucl-ex]]
4. A. Rustamov, Central Eur. J. Phys. 10, 1267 (2012). [arXiv:1201.4520 [nucl-ex]]
5. Y. Itow et al., (T2K Collaboration), arXiv:0106019 [hep-ex] (2001)6. K. Abe et al., (T2K Collaboration), Nucl. Instrum. Meth. A 659,
106–135 (2011)7. N. Abgrall et al., (NA61/SHINE Collaboration), CERN-SPSC-
2012-022; SPSC-P-330-ADD-68. K. Abe et al., (T2K Collaboration), Phys. Rev. D 87, 012001 (2013)9. J. Abraham et al., (Pierre Auger Collaboration), Nucl. Instrum.
Meth. A 523, 50 (2004)10. T. Antoni et al., (KASCADE Collaboration), Nucl. Instrum. Meth.
A 513, 490 (2003)
123

2794 Page 22 of 22 Eur. Phys. J. C (2014) 74:2794
11. C. Alt et al., (NA49 Collaboration), Eur. Phys. J. C 45, 343–381(2006). [arXiv:0510009 [hep-ex]]
12. T. Anticic et al., (NA49 Collaboration), Eur. Phys. J. C 65, 9 (2010).[arXiv:0904.2708 [hep-ex]]
13. T. Anticic et al., (NA49 Collaboration), Eur. Phys. J. C 68, 1 (2010).[arXiv:1004.1889 [hep-ex]]
14. M. Gazdzicki, M. Gorenstein, P. Seyboth, Acta Phys. Polon. B 42,307 (2011). [arXiv:1006.1765 [hep-ph]]
15. A.I. Golokhvastov, Phys. Atom. Nucl. 64, 1841 (2001). [Yad. Fiz.64, 1924 (2001)]
16. S. Afanasiev et al., (NA49 Collaboration), Nucl. Instrum. Meth. A430, 257 (1999)
17. N. Abgrall et al., (NA61/SHINE Collaboration), Phys. Rev. C 84,034604 (2011). [arXiv:1102.0983 [hep-ex]]
18. C. Bovet, R. Maleyran, L. Piemontese et al., CERN-YELLOW-82-13
19. C. Strabel, Ph.D. Thesis, ETH, Zurich, Switzerland (2011). https://edms.cern.ch/document/1136130/1
20. N. Abgrall et al., (NA61/SHINE Collaboration), J. Instrum. (sub-mitted). [arXiv:1401.4699 [physics.ins-det]]
21. N. Abgrall et al., (NA61/SHINE Collaboration), Report No.CERN-SPSC-2008-018 (2008)
22. M. Unger, for the NA61/SHINE Collaboration, EPJ Web Conf. 52,01009 (2013). [arXiv:1305.5281 [nucl-ex]]
23. M. Unger et al., (NA61/SHINE Collaboration), PoS ICHEP 2010,449 (2010). arXiv:1012.2604 [nucl-ex]
24. A. Ilnicka, Master Thesis, University of Warsaw, Poland (2013)https://edms.cern.ch/document/1319366
25. K. Werner, Nucl. Phys. B 175(Proc. Suppl.), 81 (2008)26. N. Abgrall, Ph.D. Thesis, University of Geneva, Geneva, Switzer-
land (2011). https://edms.cern.ch/document/1172455/127. R. Brun, F. Carminati, GEANT Detector Description and Simula-
tion Tool, CERN Program Library Long Writeup W5013 (1993).http://wwwasdoc.web.cern.ch/wwwasdoc/geant/geantall.html
28. J. Beringer, Particle Data Group, Phys. Rev. D 86, 010001 (2012)29. A. Aduszkiewicz, Ph.D. Thesis in preparation, University of War-
saw, Poland (2014)30. S. Puławski, PoS, CPOD 2013, 056 (2013). http://pos.sissa.it/
archive/conferences/185/056/CPOD%202013_056.pdf31. A. Aduszkiewicz, EuNPC 2012 (2012). http://www.nipne.ro/
indico/contributionDisplay.py?contribId=268&sessionId=2&confId=0
32. M. Gazdzicki, D. Roehrich, Z.Phys.C 65, 215 (1995)33. M. Gazdzicki, D. Röhrich, Z.Phys.C 71, 55 (1996)34. K. Werner, Nucl. Phys. A 525, 501c (1991)35. K. Werner, Phys. Rep. 232, 87 (1993)36. E.E. Zabrodin et al., Phys. Rev. D 52, 1316 (1995)37. E.E. Zabrodin, private communication.38. https://edms.cern.ch/document/131460539. E. Fermi, Prog. Theor. Phys. 5, 570 (1950)40. J. Klay et al., (E895 Collaboration), Phys. Rev. C 68, 054905 (2003)41. L. Ahle et al., E802 Collaboration, Phys. Rev. C 57, 466 (1998)42. B.B. Back et al., (PHOBOS Collaboration). [arXiv:0301017 [nucl-
ex]]43. K. Adcox et al., (PHENIX Collaboration), Phys. Rev. C 69, 024904
(2004)44. S.S. Adler et al., (PHENIX Collaboration), Phys. Rev. C 69, 034909
(2004)45. J. Adams et al., (STAR Collaboration), Phys. Rev. Lett. 92, 112301
(2004)46. I.G. Bearden et al., (BRAHMS Collaboration), Phys. Rev. Lett. 94,
162301 (2005)47. V.V. Ammosov et al., Nuovo Cimento 40, 237 (1977)
123