Embed Size (px)
Citation preview
MEAN ANNUAL RUNOFF AND PEAK FLOW ESTIMATES BASED ON CHANNEL
GEOMETRY OF STREAMS IN NORTHEASTERN AND WESTERN MONTANA
by Charles Parrett, R. J. Omang, and J. A. Hull
U.S. GEOLOGICAL SURVEY
Water-Resources Investigations Report 83-4046
Prepared in cooperation with the
U.S. BUREAU OF LAND MANAGEMENT, U.S. FOREST SERVICE, and
MONTANA DEPARTMENT OF NATURAL RESOURCES AND CONSERVATION
Helena, Montana June 1983
UNITED STATES DEPARTMENT OF THE INTERIOR
JAMES G. WATT, Secretary
GEOLOGICAL SURVEY
Dallas L. Peck, Director
For more information Copies of this report can bewrite to: purchased from:
District Chief Open-File Services SectionU.S. Geological Survey Western Distribution Branch 428 Federal Building | U.S. Geological Survey301 S. Park Box 25425, Federal CenterDrawer 10076 Lakewood, CO 80225Helena, MT 59626 (Telephone: [303] 234-5888)

CONTENTS
Page
Abstract ................................... 1Introduction ................................. 1Data used. .................................. 4
Streamflow data. .............................. 4Channel-geometry data. ........................... 4Basin-characteristics data ......................... 5
Method of analysis .............................. 12Multiple regression techniques ....................... 12Mean-annual-runoff analysis. ........................ 13Peak-discharge analysis. .......................... 15
Discussion .................................. 15Limitations of method. ........................... 15Accuracy appraisal ............................. 21Illustrative examples. ........................... 21
Conclusions. ................................. 24Selected references. ............................. 25
ILLUSTRATIONS
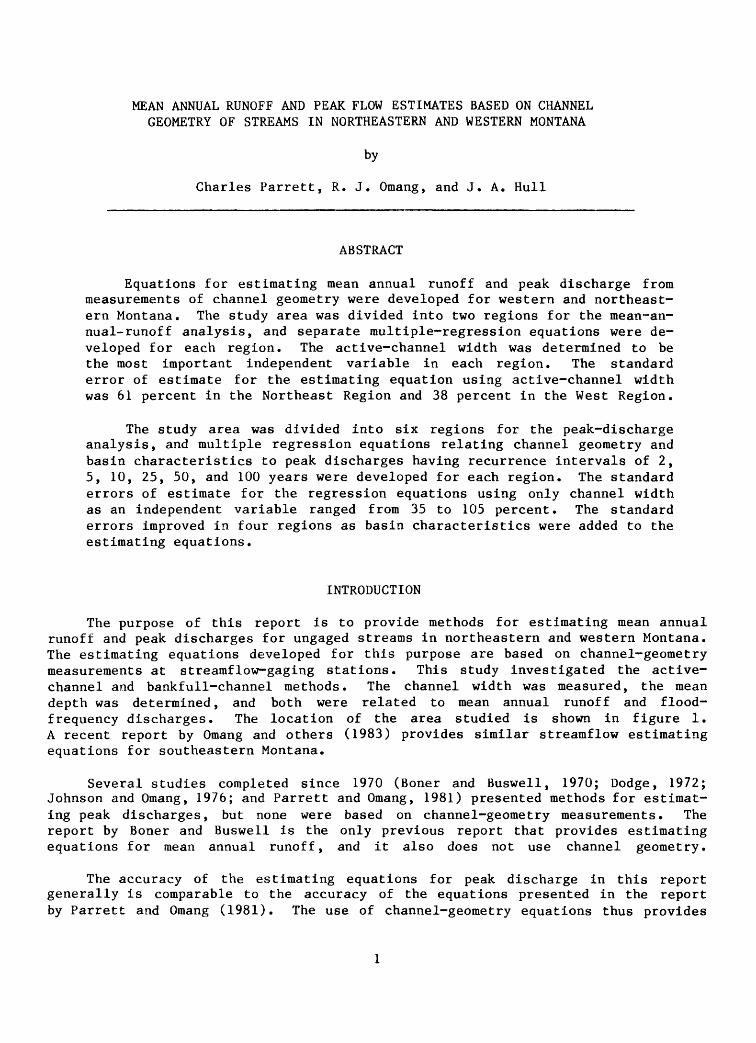
Figure 1. Map showing location of study area, region boundaries, and selectedstreamflow-gaging stations used for mean-annual-runoff analysis . 2
2. Map showing location of region boundaries and selected streamflow- gaging stations used for peak-discharge analysis. ........ 6
3. Sketch showing best locations for measurement of channel-geometryfeatures. ............................ 8
4-7. Photographs showing active-channel and bankfull widths on:4. Rattlesnake Creek at Missoula, Montana. ............ 95. Eightmile Creek near Florence, Montana. ............ 96. Dayton Creek near Proctor, Montana. .............. 107. East Fork Battle Creek near international boundary, Montana . . 10
8. Photograph showing active-channel width on Willow Creek nearGlasgow, Montana ....... ................. 11
TABLES
Table 1. Streamflow characteristics at selected gaging stations ....... 272. Channel-geometry characteristics at selected gaging stations .... 353. Basin characteristics at selected gaging stations. ......... 424. Results of regression analysis for mean annual runoff using only
channel-geometry characteristics ................. 135. Results of regression analysis for mean annual runoff in West
Region .............................. 146. Results of regression analysis for peak discharge using only
channel-geometry characteristics ................. 167. Results of regression analysis for peak discharge using channel-
geometry and basin characteristics ................ 508. Range of channel-geometry and basin characteristics. ........ 20
III
METRIC CONVERSION FACTORS
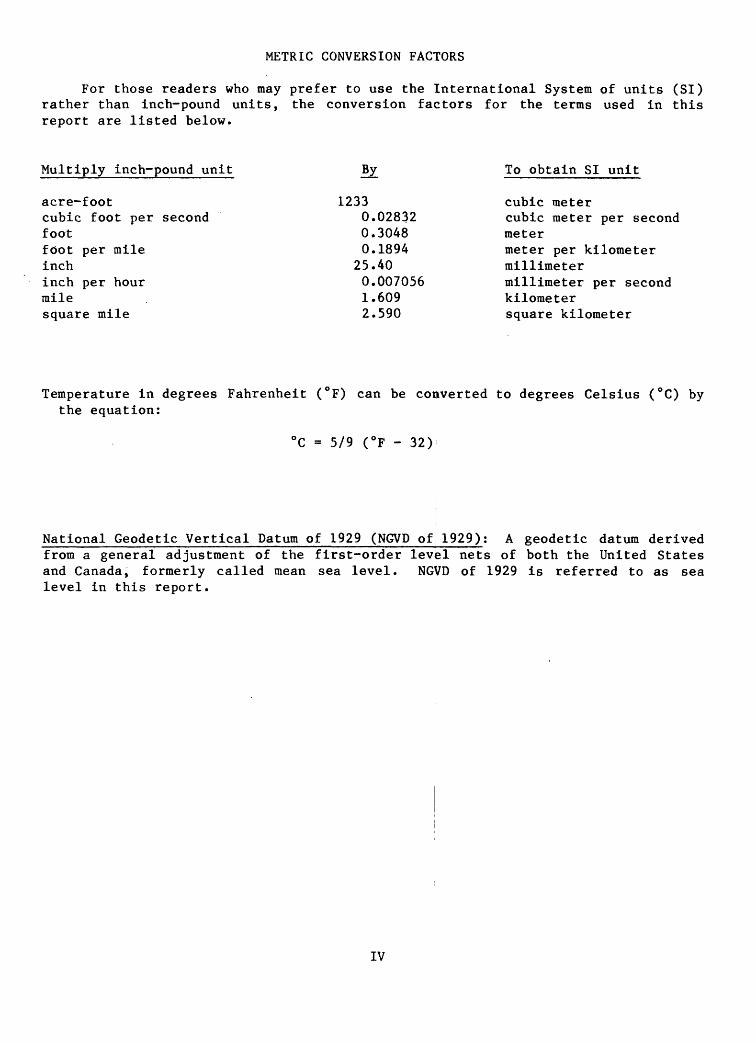
For those readers who may prefer to use the International System of units (SI) rather than inch-pound units, the conversion factors for the terms used in this report are listed below.
Multiply inch-pound unit
acre-footcubic foot per secondfootfoot per mileinchinch per hourmilesquare mile
By
12330.028320.30480.1894
25.400.0070561.6092.590
To obtain SI unit
cubic metercubic meter per secondmetermeter per kilometermillimetermillimeter per secondkilometersquare kilometer
Temperature in degrees Fahrenheit (°F) can be converted to degrees Celsius (°C) by the equation:
°C = 5/9 (°F - 32)
National Geodetic Vertical Datum of 1929 (NGVD of 1929): A geodetic datum derived from a general adjustment of the first-order levfel nets of both the United States and Canada, formerly called mean sea level. NGVD of 1929 is referred to as sea level in this report.
IV
MEAN ANNUAL RUNOFF AND PEAK FLOW ESTIMATES BASED ON CHANNEL GEOMETRY OF STREAMS IN NORTHEASTERN AND WESTERN MONTANA
by
Charles Parrett, R. J. Omang, and J. A. Hull
ABSTRACT
Equations for estimating mean annual runoff and peak discharge from measurements of channel geometry were developed for western and northeast ern Montana. The study area was divided into two regions for the mean-an nual-runoff analysis, and separate multiple-regression equations were de veloped for each region. The active-channel width was determined to be the most important independent variable in each region. The standard error of estimate for the estimating equation using active-channel width was 61 percent in the Northeast Region and 38 percent in the West Region.
The study area was divided into six regions for the peak-discharge analysis, and multiple regression equations relating channel geometry and basin characteristics to peak discharges having recurrence intervals of 2, 5, 10, 25, 50, and 100 years were developed for each region. The standard errors of estimate for the regression equations using only channel width as an independent variable ranged from 35 to 105 percent. The standard errors improved in four regions as basin characteristics were added to the estimating equations.
INTRODUCTION
The purpose of this report is to provide methods for estimating mean annual runoff and peak discharges for ungaged streams in northeastern and western Montana. The estimating equations developed for this purpose are based on channel-geometry measurements at streamflow-gaging stations. This study investigated the active- channel and bankfull-channel methods. The channel width was measured, the mean depth was determined, and both were related to mean annual runoff and flood- frequency discharges. The location of the area studied is shown in figure 1. A recent report by Omang and others (1983) provides similar streamflow estimating equations for southeastern Montana.
Several studies completed since 1970 (Boner and Buswell, 1970; Dodge, 1972; Johnson and Omang, 1976; and Parrett and Omang, 1981) presented methods for estimat ing peak discharges, but none were based on channel-geometry measurements. The report by Boner and Buswell is the only previous report that provides estimating equations for mean annual runoff, and it also does not use channel geometry.
The accuracy of the estimating equations for peak discharge in this report generally is comparable to the accuracy of the equations presented in the report by Parrett and Omang (1981). The use of channel-geometry equations thus provides
49-US1
Figure 1. Location of study area, region boundaries, and selected streamflow*-

0 20 ___40 MILES
0 20 40 KILOMETERS
3434
EXPLANATION
STREAMFLOW-GAGING STATION AND ABBREVIATED NUMBER Numbers have been abbreviated by omitting
the first two digits, which Identify the major drainage basin, and the last one or two digits If they are zeros
REGION BOUNDARY
gaging stations used for mean-annual-runoff analysis.

a viable alternative to methods for peak-discharge prediction based solely on drainage-basin characteristics. The estimating equations for mean annual runoff in this report are considered to be more reliable than the equations in the report by Boner and Buswell (1970). The improved reliability probably is due largely to the additional streamflow-gaging data that have become available since 1970.
The estimating equations presented herein will be useful to hydraulic design ers, land-use managers, water-rights administrators, and others who need to esti mate streamflow. This report was prepared in cooperation with the U.S. Bureau of Land Management, the U.S. Forest Service, and the Montana Department of Natural Resources and Conservation.
DATA USED
Streamflow data
Values of mean annual runoff were computed using streamflow data from 126 streamflow-gaging stations with 10 or more years of continuous record. Data through the 1980 water year were used in the analysis. Gaging stations where the flows are substantially regulated or where large diversions significantly affect flows were generally not used in the analysis. Exceptions were made where the regulation or diversions began more than 10 years before the beginning of the streamflow record, so that the channel-geometry features were considered represent ative of the altered streamflow regimen. The location of the streamflow-gaging stations used in the mean-annual-runoff analysis is shown in figure 1. The mean annual runoff computed for each gaging station is listed in table 1 at the back of the report.
Peak discharges for recurrence intervals of 2, 5, 10, 25, 50, and 100 years were computed using data from 203 streamflow-gaging stations having 10 or more years of record of annual peak discharge. Most of the continuous-record stations used in the mean-annual-runoff analysis also were used in the peak-discharge analy sis. In addition, data from crest-stage gages where only annual peak discharges are available were used in the analysis. The peak discharges used in this study were computed previously for the regional floods-frequency study by Parrett and Omang (1981) using procedures recommended by the U.S. Water Resources Council (1977). Streamflow data through the 1978 water year were used in the peak-dis charge computations. The location of all streamflow-gaging stations used in the peak-discharge analysis is shown in figure 2, and the computed peak-discharges for the various recurrence intervals are listed in table 1.
Channel-geometry data
Channel-geometry features were measured by U.S. Geological Survey personnel from 1978 through 1980 at or near each streamflo^-gaging station used in the mean annual runoff and peak-discharge analyses. Activje-channel width was measured and an associated mean depth was determined at almost every site. Bankfull width was measured and an associated mean depth was determined at every site where the bank- full width was discernible. On some streams, particularly those that were deeply entrenched in the flood plain, the bankfull width was not well defined and conse quently was not measured.

The active channel has been described by Hedman and Kastner (1977) as that part of the stream channel recently used to transport water and sediment at normal stages. The width of the active channel is measured where the stream banks abruptly change from steep to a more gently sloping surface. This change in slope commonly coincides with the lower limit of annual vegetation. A distinguishable vegetation line generally was used as the reference level for the active-channel width meas ured. In many instances, a prominent vegetation line or change in bank slope was found on only one side of the channel. In this situation, the width was measured from the distinguishing feature, level across the channel, to a point of intersec tion with the opposite streambank.
The bankfull channel was described by Riggs (1974) as that part of the stream channel bounded by the streamward edges of the flood plain or by the lower edge of permanent vegetation. On perennial streams, the upper extent of the bankfull-chan- nel section corresponds to the bankfull stage at a narrow stream section described by Leopold and others (1964). At most of the sites in the study area, the distin guishing feature of the bankfull reference level was the abrupt change in bank slope from near vertical to near horizontal. This prominent flood-plain bench com monly was found on only one side of the channel.
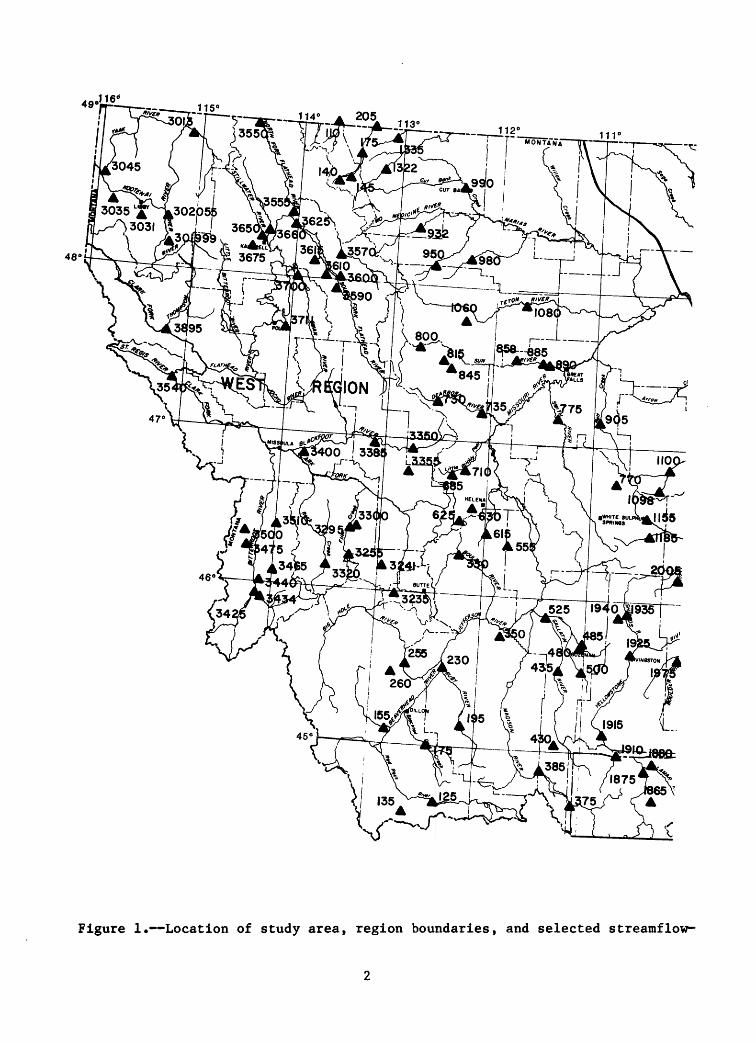
On mountain streams typical of most of this study area, the bankfull channel is only slightly wider than the active channel. Channel geometry features were measured at the narrowest and most stable section of a stream. A sketch (fig. 3) modified from Lowham (1976) shows where the stable section normally occurs. Typical active-channel and bankfull sections in the mountainous regions of Montana are illustrated in figures 4 through 6. Active-channel and bankfull sections measured on plains streams in northeastern Montana are shown in figures 7 and 8. Values of the channel-geometry features measured at each gaging station used in the mean- annual-runoff analysis or the peak-discharge analysis are listed in table 2 at the back of the report.
Basin-characteristics data
Various drainage-basin characteristics were investigated for possible use in the development of estimating equations for mean annual runoff and for peak dis charge. Basin characteristics tested include:
A drainage area,p mean annual precipitation,F+10 forest cover index,E/1000 mean basin elevation index,HE+10 basin high-elevation index,JAN+10 mean January minimum temperature index,L main channel length,S main channel slope, and124 precipitation intensity index for a storm of 24 hours duration
having an exceedance probability of 50 percent.
Basin characteristics determined to be important in the various estimating equations were drainage area, mean annual precipitation, forest cover index, mean basin elevation index, basin high-elevation index, main channel length, main channel slope, and precipitation intensity index. Drainage area is expressed in square miles

Figure 2. Location of region boundaries and selected

105°
0_____20 40 MILES
0 20 40 KILOMETERS
35IO
EXPLANATION
STREAMFLOW-GAGING STATION AND ABBREVIATED NUMBER Numbers have been abbreviated by omitting
the first two digits, which identify the major drainage basin, and the last one or two digits if they are zeros
REGION BOUNDARY
streamflow-gaging stations used for peak-discharge analysis

1 v," -"fvy-::;.-,;iv "-"iv," -ELEVATION VIEW OF
STREAM AT NARROWESTCHANNEL SECTION
Narrowest and most stable channel section
PLAN VIEW OF STREAM
Figure 3. Best locations for measurement of channel-geometry features.
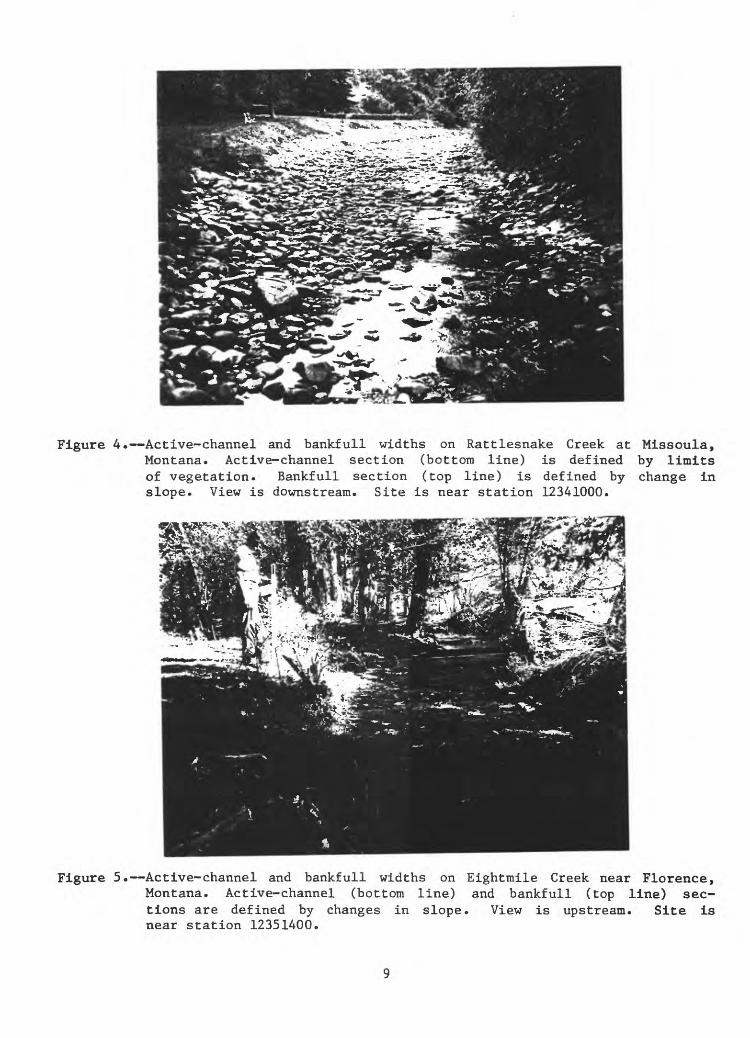
Figure 4. Active-channel and bankfull widths on Rattlesnake Creek at Missoula, Montana. Active-channel section (bottom line) is defined by limits of vegetation. Bankfull section (top line) is defined by change in slope. View is downstream. Site is near station 12341000.
Figure 5. Active-channel and bankfull widths on Eightmile Creek near Florence, Montana. Active-channel (bottom line) and bankfull (top line) sec tions are defined by changes in slope. View is upstream. Site is near station 12351400.

Figure 6.- Active- channel and bankfull widths on Dayton Creek near Proctor, Mon tana. Active- channel (bottom line) and bankfull (top line) sections are defined by changes in slope. View is upstream tion 12370500.
Site is near sta
Figure 7. Active-channel and bankfull widths on East Fork Battle Creek near inter national boundary, Montana. Active-channel (bottom line) and bankfull (top line) sections are defined by changes in slope. View is down stream. Site is near station 06150500.
10
Figure 8. Active-channel width on Willow Creek near Glasgow, Montana. Section is defined by limits of vegetation. View is downstream. Site is near sta tion 06174000.
and is determined for ungaged sites by planimetering the area outlined on the best scale topographic map available. Mean annual precipitation is the basin average, in inches, determined from the maps contained in the report by U.S. Soil Conserva tion Service (1977). The forest cover index is the percentage of the drainage basin covered by forest (F) plus 10; it is determined by planimetering the forest ed (green) areas shown on the best scale U.S. Geological Survey topographic maps, multiplying by 100, and dividing the result by the total basin drainage area. The value 10 is added to the percentage to ensure that values close to zero do not occur.
Mean basin elevation index is the mean basin elevation, in feet above sea- level datum (E) divided by 1,000. Mean basin elevation can be determined by using a transparent grid overlay on a topographic map. The basin elevation at each grid intersection is determined, and the mean basin elevation is calculated by averag ing. The basin high-elevation index is the percentage of the total basin area above 6,000 feet sea-level datum (#E) plus 10. The percentage of basin area above 6,000 feet elevation can be determined by planimetering the drainage area above the 6,000-foot contour on a topographic map, multiplying by 100, and dividing the result by the total drainage area. The mean January minimum temperature index is the mean January minimum temperature in degrees Fahrenheit (JAW) plus 10. Mean January minimum temperatures are obtained from the U.S. Environmental Data Service (1971). Main channel length is the length of the main stream channel, in miles, from the outlet of the drainage basin to the basin divide. The main channel length is determined from the best scale topographic map, usually by measuring the dis tance with dividers. Main channel slope, in feet per mile, is determined from the main channel elevations determined at points 10 and 85 percent of the main channel
11

I I
length. The difference in elevation at the two points is divided by 75 percent of the main channel length to obtain main channel slope. Precipitation intensity index is the precipitation intensity in inches per hour for a storm of 24 hours duration having a recurrence interval of 2 years.' Precipitation intensity index is determined from maps published by the National Weather Service (1973). The values of the drainage-basin characteristics for each gaging station used in the analysis are listed in table 3 at the back of the report.
METHOD OF ANALYSIS
Multiple regression techniques
Equations for estimating mean annual runoff and peak discharges for various recurrence intervals were developed from multiple-regression analyses of stream- flow, channel-geometry, and basin-characteristics data obtained at streamflow-gag ing stations. The data were converted to logarithms to help ensure a linear rela tionship among the variables, and regression equations of the following form were derived: II
Log Q = log a + bi log B + b£ log C, log N (1)
where the mean annual runoff in acre-feet, in cubic feet per second having a
Q (dependent variable) is either QA ,or Qmt the annual peak dischargerecurrence interval of m years;
a is the multiple-regression constant; bj, b2»»» b^ are the regression coefficients; andB, C,..« N are values of the channel-geometry and drainage-basin character
istics (independent variables).
Taking antilogarithms yields the following non-linear form of the regression equation:
Q (2)
The regression analyses were performed by digital computer using Statistical Analysis System (SAS) programs (SAS Institute, Inc.1 , 1979). These programs provide various statistical measures of the applicability of the derived regression equa tions such as standard errors of estimate, coefficients of determination (R^), and tests for the significance of each independent variable.
Three sets of regression equations for estimating QA and Q were developed. One set considered only active-channel geometry , characteristics (active-channel width, IV, and active-channel depth, DAC ) as independent variables. Another set
BF ,considered only bankfull-channel geometry characteristics (bankfull width, Wand bankfull depth, DBF ) as independent variables! The third set of regression equations used both basin characteristics and channel-geometry characteristics as independent variables.
In developing equations using both channel-geometry and basin characteristics, a "maximum R*- improvement" routine for adding or deleting independent variables was used. This procedure determines the "bestj" one-variable model (largest R ), the best two-variable model (greatest increase in R 2 ), and so forth until all independent variables have been added to the model. Variables may be deleted
12
2 and replaced by new variables at any step if a larger R results. In thisstudy, a variable was included in the model if the test statistic for significance was 5 percent or less. In general, the smaller the test statistic for significance, the more significant is the variable in the equation.
Mean-annual-runoff analysis
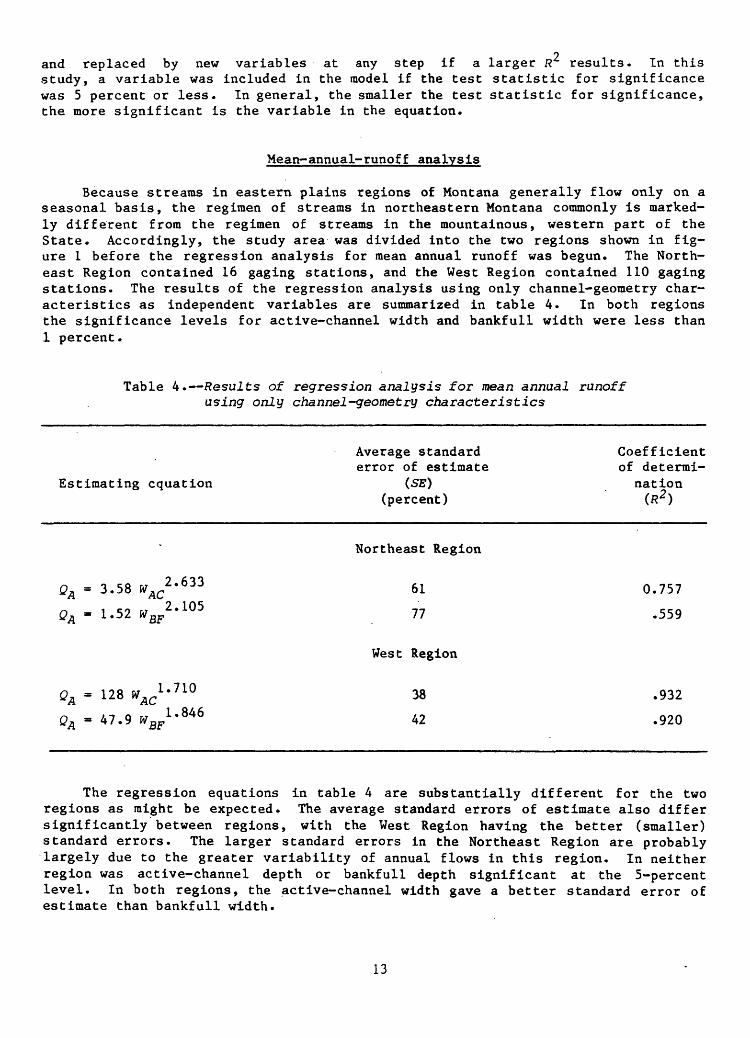
Because streams in eastern plains regions of Montana generally flow only on a seasonal basis, the regimen of streams in northeastern Montana commonly is marked ly different from the regimen of streams in the mountainous, western part of the State. Accordingly, the study area was divided into the two regions shown in fig ure 1 before the regression analysis for mean annual runoff was begun. The North east Region contained 16 gaging stations, and the West Region contained 110 gaging stations. The results of the regression analysis using only channel-geometry char acteristics as independent variables are summarized in table 4. In both regions the significance levels for active-channel width and bankfull width were less than 1 percent.
Table 4. Results of regression analysis for mean annual runoff using only channel-geometry characteristics
Average standard Coefficienterror of estimate of determi-
Estimating equation (SE) nation(percent) (R2 )
Northeast Region
Q* = 3.58 W, r2 * 633 61 0.757*i *1O
0, - 1.52 tf 2 * 105 77 .559/i DC
West Region
Q = 128 JV 1-710 28 .932
QA - 47.9 War 1 " 846 42 .920
The regression equations in table 4 are substantially different for the two regions as might be expected. The average standard errors of estimate also differ significantly between regions, with the West Region having the better (smaller) standard errors. The larger standard errors in the Northeast Region are probably largely due to the greater variability of annual flows in this region. In neither region was active-channel depth or bankfull depth significant at the 5-percent level. In both regions, the active-channel width gave a better standard error of estimate than bankfull width.
13
A regression analysis using both channel-geometry and basin characteristics for the Northeast Region resulted in the following equation:
7 - 56 (3)
The coefficient of determination (K^) for this equation was 0.834 and the average standard error of estimate (SE) was 52 petcent. The level of significance was 4 percent for WA£ and 3 percent for A. No other independent variables were found to be significant at the 5-percent level.
The estimating equation using both active-Channel width and drainage area apparently is better than the equation using only active channel width because of the reduced standard error of estimate. The improvement may be misleading, how ever, because active-channel width and drainage arlea are correlated. An estimating equation with two correlated independent variables may not provide any more reli able estimates than an equation with only one of tine variables included.
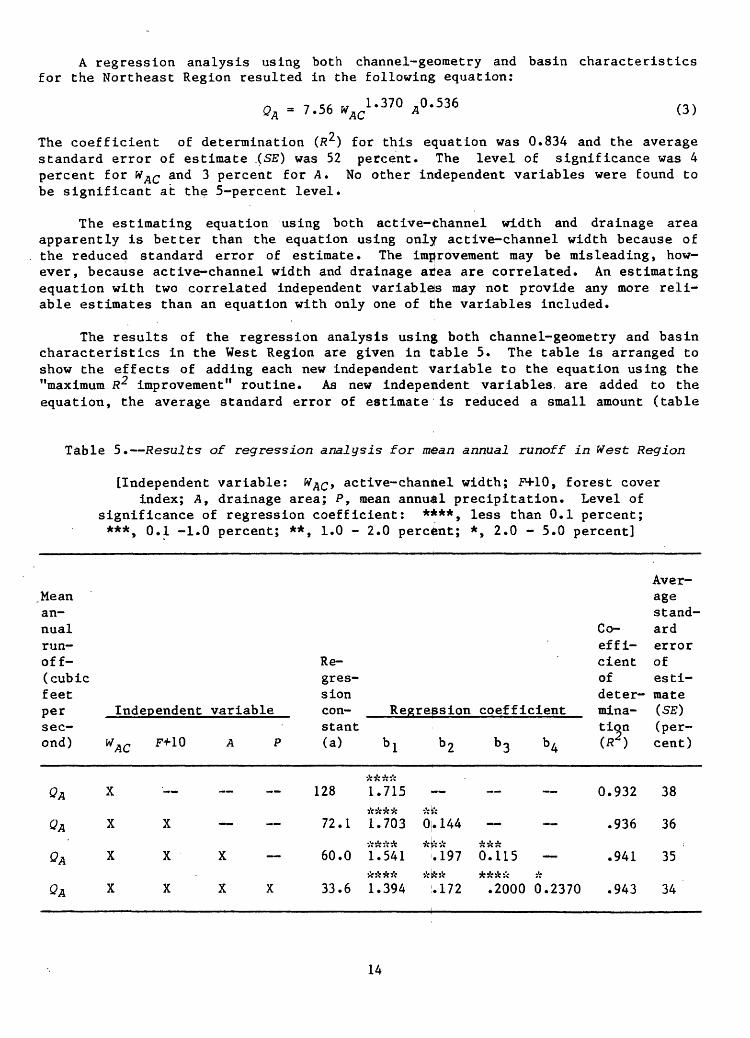
The results of the regression analysis using both channel-geometry and basin characteristics in the West Region are given in table 5. The table is arranged to show the effects of adding each new independent variable to the equation using the "maximum R^ improvement" routine. As new independent variables, are added to the equation, the average standard error of estimate is reduced a small amount (table
Table 5. Results of regression analysis for mean annual runoff in West Region
[Independent variable: W&c> active-channel width; F+10, forest coverindex; A, drainage area; P, mean annual precipitation. Level of
significance of regression coefficient: ****, less than 0.1 percent; ***, 0.1 -1.0 percent; **, 1.0 - 2.0 percent; *, 2.0 - 5.0 percent]
.Mean annualrunoff- Re-
Average stand-
Co- ardeffi- errorcient of
( cubic gres- of esti- feet sion deter- mate per Independent variable con- Regression coefficient mina- (SE)sec- stant ond) WAC F+10 A P (a) b L
QA X 128 1.715ftftftft ft
QA X X 72.1 1.703 0
tion (per- b 2 b^ b^ (R ) cent)
0.932 38fe .144 .936 36
ftftftft ftKft ftftft
QA X X X 60.0 1.541 .197 0.115 .941 35ftftftft ft
QA X X XX 33.6 1.394.I..U ^Jj.^.I. J.
.172 .2000 0.2370 .943 34
14
5). Thus, the estimating equation using four independent variables is not signifi cantly better than the equation using only active-channel width.
Peak-discharge analysis
An initial peak-discharge regression analysis using only channel geometry characteristics was made for the entire study area. The regression residuals (difference between actual peak discharges and computed peak discharges) then were plotted on a map and used as a basis for separating the study area into the six regions shown in figure 2. The boundaries for the regions were located on topo graphic divides or prominent geographic features if possible. An attempt also was made to match the same regional boundaries used in the study by Parrett and Omang (1981), although complete agreement was not possible. The physiography and climate of the regions as described by Parrett and Omang thus are considered to be gener ally applicable to the regions used in this report.
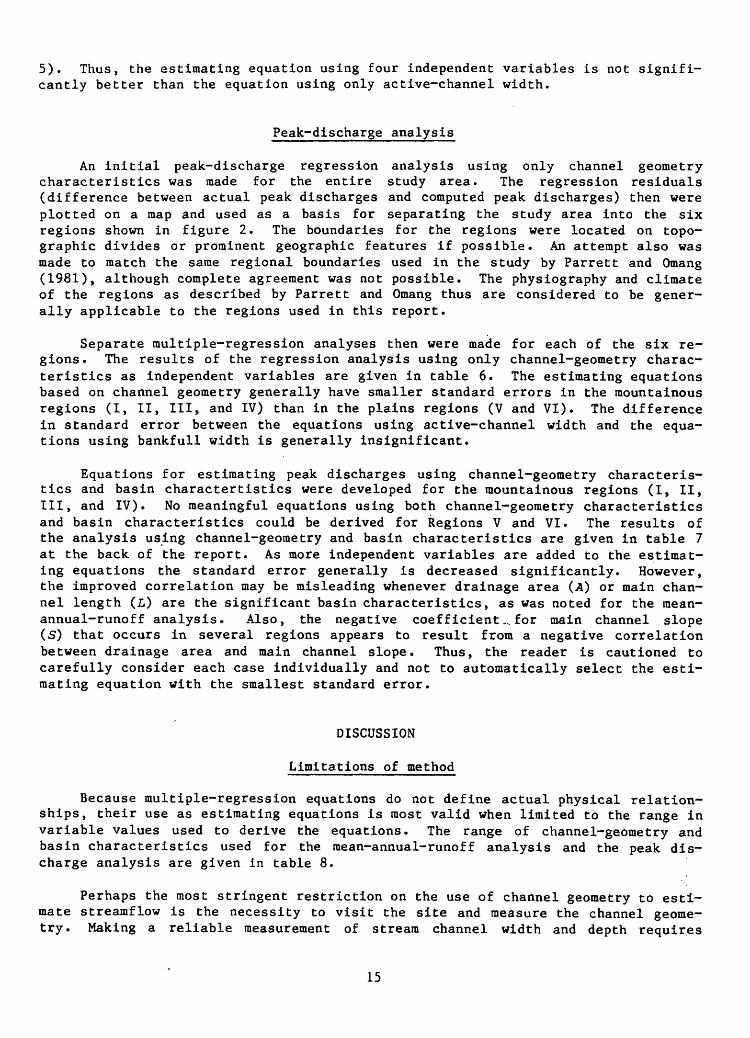
Separate multiple-regression analyses then were made for each of the six re gions. The results of the regression analysis using only channel-geometry charac teristics as independent variables are given in table 6. The estimating equations based on channel geometry generally have smaller standard errors in the mountainous regions (I, II, III, and IV) than in the plains regions (V and VI). The difference in standard error between the equations using active-channel width and the equa tions using bankfull width is generally insignificant.
Equations for estimating peak discharges using channel-geometry characteris tics and basin charactertistics were developed for the mountainous regions (I, II, III, and IV). No meaningful equations using both channel-geometry characteristics and basin characteristics could be derived for Regions V and VI. The results of the analysis using channel-geometry and basin characteristics are given in table 7 at the back of the report. As more independent variables are added to the estimat ing equations the standard error generally is decreased significantly. However, the improved correlation may be misleading whenever drainage area (A) or main chan nel length (L) are the significant basin characteristics, as was noted for the mean- annual-runoff analysis. Also, the negative coef f icient... for main channel slope (S) that occurs in several regions appears to result from a negative correlation between drainage area and main channel slope. Thus, the reader is cautioned to carefully consider each case individually and not to automatically select the esti mating equation with the smallest standard error.
DISCUSSION
Limitations of method
Because multiple-regression equations do not define actual physical relation ships, their use as estimating equations is most valid when limited to the range in variable values used to derive the equations. The range of channel-geometry and basin characteristics used for the mean-annual-runoff analysis and the peak dis charge analysis are given in table 8.
Perhaps the most stringent restriction on the use of channel geometry to esti mate streamflow is the necessity to visit the site and measure the channel geome try. Making a reliable measurement of stream channel width and depth requires
15

Table 6. Results of regression analysis for peak discharge using only channel-geometry characteristics
Average Coeffi- standard cient of error of determi- estimate nation
Region Estimating equation (SE) (R^) (percent)
Active- channel width
I 02
05
QIO
025
050
QIOO
Q2
' -05
QIO
025
050
QIOO
- i ]«; &/ ar,1.7351 i J AC
o / c 67 1 .639 = 2.45 w AC
3.61 W AC
^ i u b/ 1 .538 J .Jo "AC
_ L. Q7 67,^,1.504~ o . 7/ ^ AC
_ o -7 c r.7 1 .474 o . / D AC
Bankfull width
= 0.295 VBF 1<%5
= 0.677 ^BF 1 ' 857
= 1.04 Wjgf 1 - 800 -
= 1.61 Vj3F l« 742
= 2.14 VBF L704
= 2.74 f/BF 1 ' 670
53 0.936
48 .940
48 .936
50 .928
52 .919
55 .910
54 .935
48 .942
47 .940
48 .933
50 .926
52 .917
Active-channel width
II 02
05
QIO
025
050
QIOO
r\ ^.oc &7 ~_ J. * o :7 1- U.OJ.) "AC
= 1.68 ^c1 * 763
= 3.02 ^c1 - 680
__ c / f u 1 . 608 J.4D AC
Q ^^ w,^l«476 .* jo "AC
IA Q &/ ^,1.476 ~ JLO 3 AC
48 .954
39 .964
36 .966
35 .965
43 .942
43 .942
16

Table 6. Results of regression analysis for peak discharge using only channel-geometry characteristics Continued
Average standard error of estimate
Region Estimating equation (SE) (percent)
II Q2
Qs
QIO
Q25
QSO
QIOO
HI Q2
' Qs
QIO
Q25
QSO
QIOO
Q2
Qs
QIO
Q25
QSO
QIOO
Bankfull width
= 0.153 IVBF2 ' 104 44
- 0.449 WBF 1 ' 958 36
= 0.859 wBF1-864 38
= 1.63 p,^ 1 - 784 39
= 2.99 tfsp 1 ' 704 39
- 5.48 tfBF1-636 50
Active-channel width
= 0.869 WAC 1 ' 756 49
= 2.74 tfAC 1 ' 555 48
- 4.99 wAC1 ^51 54
- 9.59 wAC1 - 33* 63
=14.6 ^1-260 71
=21.2 V^1 * 193 79
Bankfull width
- 0.202 VBF2 * 013 53
- 0.768 WBF 1 ' 778 55
- 1.54 v K656 61
= 3.30 ^1-519 70
= 5.39 v^1 * 432 78
P/pe* ®-'
Coeffi cient of determi nation
0.964
.967
.965
.955
.955
.932
.933
.918
.889
.835
.786
.733
.924
.900
.867
.809
.760
.707
17
Table 6. Results of regression analysis Ifor peak discharge using only channel-geometry characteristics Continued
Region Estimating
IV 02
Qs
QIO
Q25
Qso
QIOO
I
8
= 20
= 56
= 109
= 199
equation
Ac t ive- channel
8 "AC1 " 213
7 *Kl '°X
^c0 ' 923
0.817 "AC
Average standard error of estimate
(SB) (percent)
width
46
38
39
45
51
58
Coeffi cient of determi nation
0.937
.937
.915
.857
.789
.701
Bankfull width
02
^5
QIO
Q25
Qso
$100
V 02
05
QIO
Q25
QSO
QIOO
= 0
1
5
= 17
- 38
- 76
= 4
= 17
- 37
= 84
= 141
- 226
.283 J.BF 1 - 957
.96 w 1-626
AO 1.443. O^. QT
9 wj, 1 ' 2*3
3 6T *
.9 w °' 990
Active-channel
5 UK1 ' 336
A w^1 - 146
w Ei7
v °* 979
v °' 919
46
35
35
42
48
55
width
90
72
68
68
h77
.936
.945
.929
.877
.816
.726
.774
.796
.787
.751
.710
.658
18

Table 6. Results of regression analysis for peak discharge using only channel-geometry characteristics Continued
Average standard error of estimate
Region Estimating equation (SE) (percent)
V 22
Qs
- QIO
Q25
QSO
QIOO
VI . Q2
Qs
QIO
Q25
QSO
QIOO
Q2
Qs
QIO
Q25
Qso
QIOO
0.815
3.99
9.20. i'f
- 22.6
- 40.6
= 68.6
9.81
= 34.8
= 64.1
= 117
= 173
= 237
3.54
= 13.7
- 27.2
= 55.0
- 85.9
= 126
Bankfull width
VBF 1.700
VBF 1.504
WBF 1.396
*BF 1.277
JfHpl.197
M 1 1 OCrV OF A -t * -J
Active- channel width
»AC 1.334
»AC 1.297
WAC1.275
«fACU249
^cl-231
WAC 1.216
Bankfull width
WBF 1.387
IVBF 1.331
P/BF1.288
P/BF 1.235
^1.195
P/BF1.160\
105
77
73
72
74
79
88
63
58
58
61
65
79
58
56
60
65
71
Coeffi cient of determi nation
0.715
.744
.739
.706
.665
.614
.693
.790
.808
.800
.781
.758
.675
.770
.768
.727
.681
.633
19

Table 8.--Range of channel-geometry and basin characteristics
Average annual runoff
Northeast Region
West Region 9
Active- channel width("AC)
(feet)
11-56
.0-290
Bank- full width
cfiKi
16-59
14-325
Active- channel depth("AC) (feet)
--
Drainage area(A)
(square miles)
60.2-3,174
3.47-3,551
Forest- cover(')
(per cent)
3.9-100
Meanannual precipi tation
(inches)
12-95
Meanchannelslope(S)
(feet per
mile)
Mean basin
elevation<«>
(feet)
--
Basin above 6,000feet
eleva tion(HE)
(per cent)
--
Mean channel length(£)
(miles)
--
Peak discharge
Region I
Region II
Region III
Region IV
Region V
Region VI
3.0-165 5.0-190 1.16-2,290 15.0-100 V2-79 13.4-1,011 3,760-7,600
2.5-290 4.5-325 .14-1,663 1J5-95 8.09-1,610 5,120-6,460
3.0-223 6.0-260 0.3-3.0 1.48-2,476 4,770-8,320
4.0-270 8.0-300 7.61-3,551 13-95.7 17.2-304 4,420-9,560 0-100
1.0-76 2.5-98
4.0-56 8.0-59 i
2.3-116.9
some onsite training and experience. In addition, the cost and effort involved in a trip to the site may not be justified for preliminary or reconnaissance-level flow investigations. However, onsite stream investigations generally reveal anom alies in the regimen of streams that would not otherwise be discovered. In this respect, onsite investigations are a positive aspect of the channel-geometry method.
The regression equations were derived from gaging-station data on streams where major basin changes have not occurred or where the changes occurred so long ago that the channel geometry has had time to adjust to the altered streamflows. Thus, the equations may not be valid in recently urbanized or logged areas or where streamflows are regulated.
Stream reaches where channel-geometry measurements may be impossible or may provide misleading estimates of flow include:
1. Braided channels2. Small streams which are entirely vegetated with no well-defined channel3. Channels with bedrock exposed in either the bed or banks4. Reaches with large pools or steep inclines5. Channels that have had recent large floods or construction work
The equation for estimating peak discharge cotamonly will yield markedly dif ferent answers in adjoining regions. Therefore, a reader may be faced with a dilemma if peak discharges need to be estimated far a site near or on a regional boundary or for a stream that crosses regional boundaries. Unfortunately, there is no easy resolution of the problem. The discharges could be estimated using both sets of equations for the two adjoining regions and hydrologic judgment used to select the better set, or the discharges from :he two sets could be averaged.
20
Accuracy appraisal
The accuracy of a regression equation generally is measured by the standard error of estimate. The standard error of estimate is the standard deviation of the distribution (assumed normal) of residuals about the regression line. The standard error of estimate thus is a measure of how well the regression line fits the data used to derive the line and is not necessarily a measure of how well the equation can be used to estimate or predict from data not used in the regression analysis.
To evaluate whether the standard error of estimate is a reliable measure of the prediction accuracy of the regression equations, a split-sample analysis was made using mean-annual-runoff data from the West Region. Thus, a random sample of 42 of the 110 streamflow-gaging sites in the West Region was used to derive a regression equation relating mean annual runoff to active-channel width. The equation thus derived was used to estimate mean annual runoff at the 68 sites not used to derive the equation. The standard deviation of the residuals (differences between the estimated and actual mean-annual-runoff values) at the 68 sites is considered to be a true measure of the standard error of prediction. In this instance, the standard deviation of the residuals was the same as the standard error of estimate using all 110 sites in the regression analysis (38 percent). The standard error of estimate thus is considered to be a reliable indicator of the prediction accuracy of the regression equation for mean annual runoff. A split-sample analysis was not made for peak discharges because of the smaller number of gaging stations in each of the six regions.
The standard errors of estimate for mean annual runoff determined in this study are slightly larger than the standard errors of estimate computed for the mean-annual-runoff analysis by Boner and Buswell (1970). The regression equations developed by Boner and Buswell are not considered to be as reliable as the equations developed in this study, however, because of the limited amount of gaging-station data used in the 1970 analysis.
The standard errors of estimate for peak discharges determined in this study generally are equivalent to the standard errors of estimate determined in the flood-frequency study by Parrett and Omang (1981). The two methods thus are considered to be equally reliable, and each can be used to supplement or check the other.
Illustrative examples
The general procedure for using channel geometry to estimate mean annual runoff and peak discharges at ungaged sites is shown by the following examples:
Example 1.
A road designer needs to determine the peak discharge for a 25-year recurrence interval (£25) at an ungaged stream crossing in Region I. The site was visited, and the channel was found to be reasonably uniform and stable. The measured active-channel width was 8.0 feet and the measured bankfull width was 12 feet. From table 6, the estimating equations for Region I are:
21

and £>25 = 1»61
Solving for £>25 using each equation yields:Q25 = 5.38 (8.0) 1 - 538
= 5.38 (24.49) = 132 cubic feet per
second
Q25 = 1.61 (12) 1 * 742
= 1.61 (75.85) = 122 cubic feet per
second
In this instance, the results are almost the same for the two different widths. The width used can be the one most easily identifiable and measurable (generally active-channel width).
Example 2.
j An estimate of mean annual runoff and peak discharge for a recurrence interval
of 100 years is required for an ungaged site in Region III. The active-channel width was measured as 7.0 feet, and the bankfull width was measured as 10 feet. From topographic maps, the drainage area (A) is 4.00 square miles and the mean basin elevation (E) is 5,900 feet.
The mean-annual-runoff estimating equations from tajble 4 are:
1.710QA - 128 *AC and = 47.9 1.846
Inserting the measured widths and solving for QA gilves
Q, = 128 (7.0) 1 ' 710 ! = 128 (27.87) = 3,570 acre-feet
'A47.9 (10) 1 ' 846
47.9 (70.15) 3,360 acre-feet
Again, the results of the two equations are almost the same. The estimate using active channel width probably would be used becausie the standard error of estimate is somewhat smaller.
From table 6, the channel-geometry equations for Q\QQ are:
Q 100 = 21.2 wAC 1 ' 193 and <2100 8.36 w 1.353BF
Solving for Q\QQ using the measured widths gives:
Q 1QO = 21.2 (7.0) 1 - 193
= 21.2 (10.19) = 216 cubic feet
per second
0100 = 8.36 (10) 1 - 353
= 8.36 (22.54) = 188 cubic feet
per second
22

The results from the two estimating equations are again very close. To refine the estimate, the equation in table 7 using both active-channel width and the mean basin elevation index could be used.
0100 = 3,010 WAC1-310 (E/1000)"2 ' 796
= 3,010 (7.0) 1 - 310 (5.90)"2 ' 796
= 3,010 (12.80) (0.0070)
= 269 cubic feet per second
Adding the last significant variable (A) shown in the equations in table 7 and again solving for £?100 yields:
* 7 * « 0.697 /winnnx-3 ' 089 ,0.368#100 = 7 >630 WAC (E/1000) A= 7,630 (7.0) 0 ' 697 (5.90)"3 ' 089 (4.00) 0 ' 368
= 7,630 (3.882) (0.0042) (1.666)
- 207 cubic feet per second
The standard error of estimate is smaller for the equation using WAC and E (71 percent) than for either equation using only channel geometry (79 and 85 percent). The standard error of estimate for the equation using W^c* £» and A is smaller yet, but the improvement may be misleading because WAC and A are highly correlated. Thus, the best estimate for QIQQ in this instance is probably the 269 ft /s deter mined from WAC and E.
Example 3.
An estimate for £50 is required for an ungaged stream site in northeastern Montana in Region V near the boundary between Regions V and VI. The site is visited, and an active-channel width of 11 feet is measured. A reliable measure of bankfull width cannot be made*
From table 6, the estimating equation for Region V is:
141 (11) °' 979
= 141 (10.46) i
= 1,470 cubic feet per second
Because the site is close to the regional boundary, the estimating equation for Region VI is also used as follows:
050 ' 173 "AC= 173 (II) 1 - 231
= 173 (19.14)
= 3,310 cubic feet per second
23

To help choose between the two significantly different estimates, the basin characteristics are measured and the appropriate equation in the report by Parrett and Omang (1981, p. 15, East-Central Plains Region) is used to calculate
as follows:
= 1,460 A'(2?/1000- Gf
= 1,460 (47.0)°- 47 (3.20)~°-"(1.0)
= 1,460 (6. 11)(0. 316)(1.0)
= 2,820 cubic feet per second
Because the result from the equation using basin characteristics is closer to the 3,310 cubic feet per second calculated from the Region VI channel-geometry equation, the Region VI equation is assumed to be applicable in this instance.
CONCLUSIONS
Multiple-regression equations for estimating mean annual runoff from channel- geometry characteristics were developed for two regions in northeastern and western Montana. In the Northeast Region the standard eirrors of estimate were 61 percent for the estimating equation using active-channejl width and 77 percent for the estimating equation using bankfull width- When drainage area was added to the estimating equation using active-channel width, the standard error of estimate improved to 52 percent.
In the West Region, the standard errors of estimate were 38 percent for the equations for mean annual runoff using active-channel width and 42 percent using bankfull width. The improvement in standard erfor of estimate was insignificant in the West Region when basin characteristics were added to the estimating equation using active-channel width. A split-sample test in the West Region indicated that the standard error of estimate was an accurate measure of the standard error of prediction.
Multiple-regression equations for estimatin; intervals of 2, 5, 10, 25, 50, and 100 years
peak discharges for recurrence were derived for six regions in
northeastern and western Montana. The standard errors of estimate for the estimating equations using only active-channel width ranged ftom 35 to 90 percent. The standard errors of estimate for the equations using only bankfull width ranged from 35 to 105 percent. The addition of basin characteristics to the estimating equations resulted in smaller standard errors in four regions.
24

SELECTED REFERENCES
Boner, F. C., and Buswell, G. W., 1970, A proposed streamflow data program for Montana: U.S. Geological Survey open-file report, 96 p.
Dod'ge, E. R., 1972, Application [of] hydrologic and hydraulic research to culvert selection in Montana: Bozeman, Montana State University, 2 volumes, 188 p.
Fields, F. L., 1975, Estimating streamflow characteristics for streams in Utah using selected channel-geometry parameters: U.S. Geological Survey Water- Resources Investigations 34-74, 19 p.
Harenberg, W. A., 1980, Using channel geometry to estimate flood flow at ungaged sites in Idaho: U.S. Geological Survey Water-Resources Investigations 80-32, 39 p.
Hedman, E. R., 1970, Mean annual runoff as related to channel geometry in selected streams in California: U.S. Geological Survey Water-Supply Paper 1999-E, 17 p.
Hedman, E. R., and Kastner, W. M., 1972, Mean annual runoff as related to channel geometry of selected streams in Kansas: Kansas Water Resources Board Techni cal Report 9, 25 p.
_____1977, Streamflow characteristics related to channel geometry in the Missouri River basin: U.S. Geological Survey Journal of Research, v. 5, no. 3, p. 285-300.
Hedman, E. R., Kastner, W. M., and Hejl, H. R., 1974, Selected streamflow charac teristics as related to active-channel geometry of streams in Kansas: Kansas Water Resources Board Technical Report 10, 21 p.
Hedman, E. R., Moore, D. 0., and Livingston, R. K., 1972, Selected streamflow char acteristics as related to channel geometry of perennial streams in Colorado: U.S. Geological Survey open-file report, 14 p.
Johnson, M. V., and Omang, R. J., 1976, A method for estimating magnitude and fre quency of floods in Montana: U.S. Geological Survey Open-File Report 75-650, 35 p.
Leopold, L. B., and Maddock, Thomas, Jr., 1953, The hydraulic geometry of stream channels and some physiographic implications: U.S. Geological Survey Profes sional Paper 252, 57 p.
Leopold, L. B., Wolman, M. G., and Miller, J. P., 1964, Fluvial processes in geomor- phology: San Francisco, Calif., W. H. Freeman Company, 522 p.
Lowham, H. W., 1976, Techniques for estimating flow characteristics of Wyoming streams: U.S. Geological Survey Water-Resources Investigations 76-112, 83 p.
Moore, D. 0., 1974, Estimating flood discharges in Nevada using channel-geometry measurements: Carson City, Nevada Highway Department Hydrologic Report No. 1, 43 p.
25

National Weather Service, 1973, Precipitation-frequency atlas of the western United States, Volume 1 - Montana: U.S. Department of Commerce, National Oceanic and Atmospheric Administration, 41 p.
Omang, R. J., Parrett, Charles, and Hull, J. A., 1983, Mean annual runoff and peak flow estimates based on channel geometry of streams in southeastern Montana: U.S. Geological Survey Water-Resources Investigations 82-4092, 41 p.
Parrett, Charles, and Omang, R. J., .1981, Revised techniques for estimating magni tude and frequency of floods in Montana: U.S. Geological Survey Open-File Report 81-917, 66 p.
Riggs, H. C., 1974, Flash flood potential from channel measurements, in Flash floods symposium, Paris, 1974: International Association of Hydrological Sciences Proceedings, no. 112, p. 52-56.
SAS Institute, Inc., 1979, SAS user's guide, 1979 edition: Raleigh, N.C., 494 p.
Scott, A. G., and Kunkler, J. L., 1976, Flood discharges of streams in New Mexico as related to channel geometry: U.S. Geological Survey Open-File Report 76-414, 29 p.
U.S. Environmental Data Service, 1971, Climate of Montana: U.S. Department of Commerce, National Oceanic and Atmospheric Administration, Climatography of the United States No. 60-24, 21 p.
U.S. Soil Conservation Service, 1977, Average annual precipitation, Montana, based on 1941-1970 base period: Bozeman, Mont., 13 p.
U.S. Water Resources Council, 1977, Guidelines for determining flood flow frequen cies: Bulletin 17A, 26 p.
Wahl, K. L., 1977, Accuracy of channel measurements and the implications in estimating streamflow characteristics: U.S. Geological Survey Journal of Research, v. 5, no. 6, p. 811-814.
26

Table L.--Streamflow characteristics at selected gaging stations
Station No.
05011000
05014000
05014500
05017500
05020500
06011000
06012500
06013200
06013400
06013500
06015500
06017500
06019500
06019800
06023000
06025300
06025500
06026000
06027700
06030300
06033000
06034700
06035000
06037500
06038500
06043000
06043200
06043300
06043500
06046500
06046700
Station name
Belly River nr Mountain View, Alberta
Grinnell Creek nr Many Glacier, Mont.
Swiftcurrent Creek at Many Glacier, Mont.
St. Mary River nr Babb, Mont.
St. Mary River at international boundary, Mont.
Red Rock River nr Lakeview, Mont.
Red Rock River bl Lima Reservoir, nr Monida, Mont.
Traux Creek nr Lima, Mont.
Muddy Creek nr Dell, Mont.
Big Sheep Creek bl Muddy Cr, nr Dell, Mont.
Grasshopper Creek nr Dillon, Mont.
Blacktail Deer Creek nr Dillon, Mont.
Ruby River ab Reservoir, nr Alder, Mont.
Idaho Creek nr Alder, Mont.
Ruby River nr Twin Bridges, Mont.
Moose Creek nr Divide, Mont.
Big Hole River nr Melrose, Mont.
Birch Creek nr Glen, Mont.
Fish Creek nr Silverstar, Mont.
Jefferson River trib. No. 2 nr Whitehall, Mont.
Boulder River nr Boulder, Mont.
Sand Creek at Sappington, Mont.
Willow Creek nr Harrison, Mont.
Madison River nr West Yellow- stone, Mont.
Madison River bl Hebgen Lake, nr Grayling, Mont.
Taylor Creek nr Grayling, Mont.
Squaw Creek nr Gallatin Gateway, Mont.
Logger Creek nr Gallatin Gateway, Mont.
Gallatin River nr Gallatin Gate way, Mont.
Rocky Creek nr Bozeman, Mont.
Pitcher Creek nr Bozeman, Mont.
Years of 1
record
44
29
66
46
64
28
48
15
15
26
23
18
42
19
20
15
57
28
20
22
41
15
42
58
71
10
17
20
53
22
16
Mean annual runoff (acre- feet)
223,041
18,901
104,279
569,914
507,636
...
103,555
...
...
47,070
37,367
39,105
128,900
...
141,935
...
841,474
21 ,290
...
...
87,623
...
28,822
354,114
720,539
70,895
...
589,466
...
...
Peak discharge, in cubic feet per second, for indicated recurrence interval, in years
02
...
...
1,010
...
...
711
...
5
62
345
391
196
936
21
...
101
7,230
180
135
11
1,100
25
221
1,320
...
777
266
15
5,310
374
13
05
...
...
1,310
...
...
932
...
19
115
522
681
284
1,200
38
...
143
10,400
260
190
41
1,760
163
346
1,620
...
926
397
24
7,060
598
31
Oio
...
...
1,510
...
...
1,070
...
37
156
639
893
341
1,370
50
...
170
12,400
320
227
82
2,250
437
438
1,800
...
1,010
490
30
8,120
768
49
<?25
...
...
1,900
...
...
1,220
...
75
213
784
1,180
410
1,560
68
...
204
14,700
390
274
171
2,930
1,260
567
2,000
...
1,120
613
38
9,370
1,010
81
050
...
...
3,300
...
1,330
...
116
258
890
1,400
461
1,690
82
...
229
16,300
460
309
275
3,480
2,490
671
2,140
...
1,190
709
44
10,200
1,200
112
QIOO
...
...
6,700
...
---
1,430
170
305
994
1,620
509
1,830
96
...
253
17,900
...
344
423
4,070
4,610
782
2,270
...
1,250
808
51
11,100
1,420
150
27
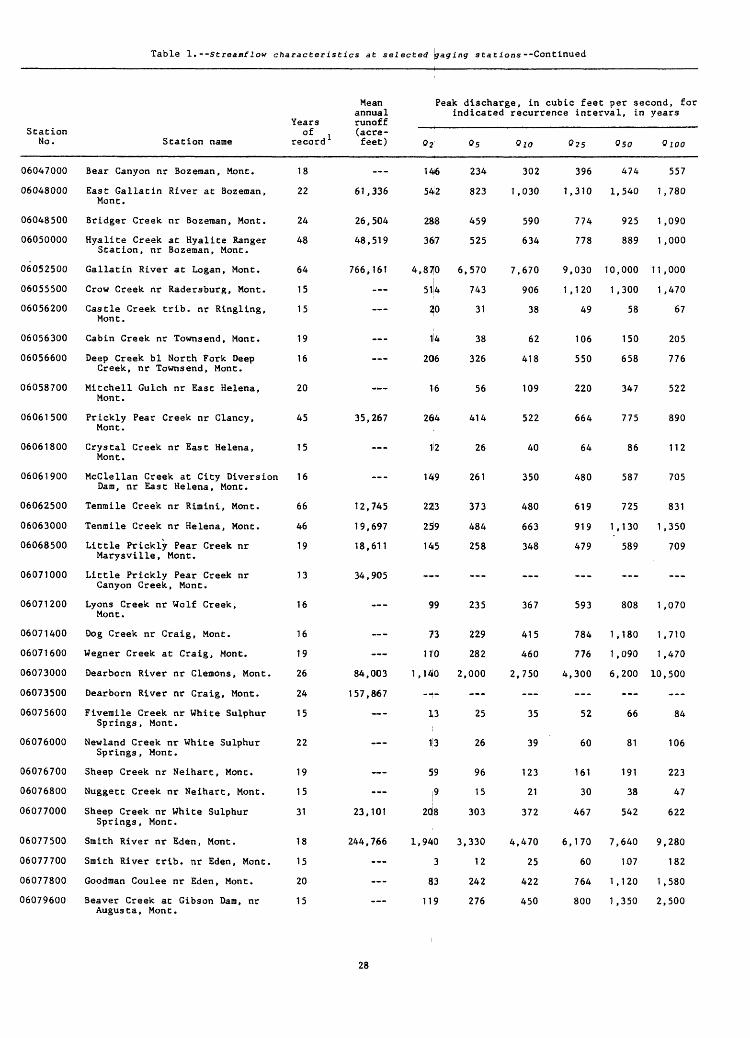
Table 1.--Stream/ low characteristics at selected gaging stations--Continued
Station No.
06047000
06048000
06048500
06050000
06052500
06055500
06056200
06056300
06056600
06058700
06061500
06061800
06061900
06062500
06063000
06068500
06071000
06071200
06071400
06071600
06073000
06073500
06075600
06076000
06076700
06076800
06077000
06077500
06077700
06077800
06079600
Station name
Bear Canyon nr Bozeraan, Mont.
East Gallatin River at Bozeman, Mont.
Bridger Creek nr Bozeraan, Mont.
Hyalite Creek at Hyalite Ranger Station, nr Bozeman, Mont.
Gallatin River at Logan, Mont.
Crow Creek nr Radersburg, Mont.
Castle Creek trib. nr Ringling, Mont.
Cabin Creek nr Townsend, Mont.
Deep Creek bl North Fork Deep Creek, nr Townsend, Mont.
Mitchell Gulch nr East Helena, Mont.
Prickly Pear Creek nr Clancy, Mont.
Crystal Creek nr East Helena, Mont.
McClellan Creek at City Diversion Dam, nr East Helena, Mont.
Tenmile Creek nr Rimini, Mont.
Tenmile Creek nr Helena, Mont.
Little Prickly Pear Creek nr Marysville, Mont.
Little Prickly Pear Creek nr Canyon Creek, Mont.
Lyons Creek nr Wolf Creek, Mont.
Dog Creek nr Craig, Mont.
Wegner Creek at Craig, Mont.
Dearborn River nr demons, Mont.
Dearborn River nr Craig, Mont.
Fivemile Creek nr White Sulphur Springs, Mont.
Newland Creek nr White Sulphur Springs, Mont.
Sheep Creek nr Neihart, Mont.
Nuggett Creek nr Neihart, Mont.
Sheep Creek nr White Sulphur Springs, Mont.
Smith River nr Eden, Mont.
Smith River trib. nr Eden, Mont.
Goodman Coulee nr Eden, Mont.
Beaver Creek at Gibson Dam, nr
Years of
record
18
22
24
48
64
15
15
19
16
20
45
15
16
66
46
19
13
16
16
19
26
24
15
22
19
15
31
18
15
20
15
Mean annual runoff (acre- feet)
61,336
26,504
48,519
766,161
35,267
12,745
19,697
18,611
34,905
84,003
157,867
23,101
244,7,66
Peak discharge, in cubic feet per second, for indicated recurrence interval, in years
0 2
146
542
288
367
4.8^0
514
^0
14
206
16
264
12
149
223
259
145
99
73
110
1,140
...
13
13
39
9
zds
1,940
3
83
119
Qs
234
823 1
459
525
6,570 7
743
31
38
326
56
414
26
261
373
484
258
235
229
282
2,000 2
25
26
96
15
303
3,330 4
12
242
276
QIO
302
,030
590
634
,670
906
38
62
418
109
522
40
350
480
663
348
367
415
460
,750
35
39
123
21
372
,470
25
422
450
*2S
396
1,310
774
778
9,030
1 ,120
49
106
550
220
664
64
480
619
919
479
593
784
776
4,300
52
60
161
30
467
6,170
60
764
800
<?50
474
1,540
925
889
10,000
1,300
58
150
658
347
775
86
587
725
1,130
589
808
1,180
1,090
6,200
66
81
191
38
542
7,640
107
1 ,120
1,350
Q 100
557
1 ,780
1 ,090
1 ,000
11,000
1,470
67
205
776
522
890
112
705
831
1,350
709
1,070
1,710
1 ,470
10,500
84
106
223
47
622
9,280
182
1,580
2,500Augusta, Mont.
28

Table l.--Streamf low characteristics at selected gaging stations Continued
StationNo.
06080000
06081500
06084500
06085800
06087900
06088500
06089000
06089300
06090500
06092000
06093200
06095000
06098000
06099000
06100200
06100300
06101900
06102200
06105800
06106000
06108000
06108200
06109800
06110000
06111000
06111500
06111700
06112100
06115300
06115500
06117000
06118500
06129100
Station name
Sun River nr Augusta, Mont.
Willow Creek nr Augusta, Mont.
Elk Creek at Augusta, Mont.
Sun River at Simras, Mont.
Muddy Creek trib. nr Power,Mont.
Muddy Creek at Vaughn, Mont.
Sun River nr Vaughn, Mont.
Sun River trib. nr Great Falls,Mont.
Belt Creek nr Monarch, Mont.
Two Medicine River nr Browning,Mont.
Badger Creek bl Four Horns Canal,nr Browning, Mont.
Birch Creek nr Dupuyer, Mont.
Dupuyer Creek nr Valier, Mont.
Cut Bank Creek at Cut Bank, Mont.
Heines Coulee trib. nr Valier,Mont.
Lone Man Coulee nr Valier, Mont.
Dead Indian Coulee nr Fort Benton,Mont.
Marias River trib. at Loma, Mont.
Bruce Coulee nr Choteau, Mont.
Deep Creek nr Choteau, Mont.
Teton River nr Dutton, Mont.
Kin ley Coulee nr Dutton, Mont.
South Fork Judith River nr Utica,Mont.
Judith River nr Utica, Mont.
Ross Fork nr Hobson, Mont.
Big Spring Creek nr Lewistown,Mont.
Mill Creek nr Lewistown, Mont.
Cottonwood Creek nr Moore, Mont.
Duval Creek nr Landusky, Mont.
North Fork Musselshell River nrDelpine, Mont.
Checkerboard Creek at Delpine,Mont.
South Fork Musselshell River abMartinsdale, Mont.
North Fork McDonald Creek trib.
Yearsof
record 1
37
20
20
13
16
43
46
19
29
43
29
30
25
38
16
19
15
17
16
13
26
16
20
56
14
25
19
17
16
36
10
38
16
Mean annual runoff(acre-feet)
593,811
20,059
68,361
397,564
_-_
91,968
530,809
--_
136,866
--_
166,557
115,141
35,629
141 ,935
_--
___
50,981
121,659
16,438
39,684
10,138
76,761
8,835
...
66,116
Peak discharge, in cubic feet per second, for indicated recurrence interval, in years
02
6,400
150
855
143
636
72
1,530
3,600
...
490
1,880
6
56
8
16
68
565
1,580
23
232
469
533
___
14
326
61
85
49
737
11
05
9,600
350
2,190
300
1,220
192
2,550
5,200
...
1,340
3,680
27
248
48
57
163
1,310
4,710
185
455
814
1,080
---
35
767
220
155
104
1,220
26
QIO
12,000
540
3,450
442
1,780
321
3,400
6,700
___
2,450
5,220
60
542
122
112
257
2,030
8,180
546
647
1,060
1,580
---
56
1,210
423
212
153
1,620
42
«?25
17,100
890
5,450
668
2,750
555
4,690
9,900
...
5,100
7,610
143
1,250
328
231
417
3,250
14,500
1,730
944
1,390
2,350
___
94
2,000
838
293
232
2,210
71
050
24,500
1,250
7,200
873
3,690
792
5,820
15,500
...
8,700
9,700
250
2,140
623
367
571
4,390
20,900
3,650
1,210
1 ,630
3,040
_-_
133
2,770
1,290
362
304
2,730
100
OlOO
38,000
1 ,470
9,160
1,110
4,880
1,090
7,120
29,000
_--
14,000
12,100
413
3,470
1,110
557
758
5,770
28,900
7,130
1,500
1,880
3,840
_--
181
3,730
1,900
437
387
3,300
135nr Heath, Mont.
29

Table 1. --Streamflow characteristics at selected 'gaging sta tions--Continued
Mean Peak discharge, in cubic feet per second, for annual indicated recurrence interval, in years
Years runoffStation
No.
06129200
06132200
06132400
06133500
06135500
06138700
06138800
06139500
06140400
06144500
06145500
06150000
06150500
06151000
06154400
06154500
06155100
06155300
06155400
06156000
06169500
06170000
06172200
06172300
06172350
06174000
06175900
06178000
06178500
06179500
Station name
Alkali Creek nr Heath, Mont.
South Fork Milk River nr Babb,Mont.
Dry Fork Milk River nr Babb,Mont.
North Fork Milk River ab St.Mary Canal, nr Browning, Mont.
Sage Creek at Q Ranch, nr WildHorse, Alberta
South Fork Spring Coulee nr Havre,Mont.
Spring Coulee nr Havre, Mont.
Big Sandy Creek nr Assinniboine,Mont.
Bullhook Creek nr Havre, Mont
Lodge Creek at internationalboundary
Lodge Creek bl McRae Creek, atinternational boundary
Woodpile Coulee nr internationalboundary
East Fork Battle Creek nr international boundary
Lyons Creek at internationalboundary
Peoples Creek nr Hays, Mont.
Peoples Creek nr Dodson, Mont.
Black Coulee nr Malta, Mont.
Disjardin Coulee nr Malta, Mont.
Taylor Coulee nr Malta, Mont.
Whitewater Creak nr international boundary
Rock Creek bl Horse Creek, nrinternational boundary
McEachern Creek at internationalboundary
Buggy Creek nr Tampico, Mont.
Unger Creek nr Vandalia, Mont.
Mooney Coulee nr Tampico, Mont.
Willow Creek nr Glasgow, Mont.
Wolf Creek trib. No. 2 nr WolfPoint, Mont.
Middle Fork Poplar River atinternational boundary
East Poplar River at international boundary
West Fork Poplar River at international boundary
of (acre-record ! feat) <?2 Os QIO 025
15 24 101 216 493
18 380 790 1,200 2,100
17 21|6 700 1,290 2,500
39 29^2 752 1,230 2,100
38 7,461 613 1,200 1,660 2,310
19 15 70 156 362
15 34 138 285 610
21 372 1,200 2,190 4,100
15 103 276 456 769
41 1,320 2,770 3,970 5,680
27 22,505 79ft 2,640 4,830 9,070
44 2,210 383 1,040 1,660 2,660
44 2,117 341 812 1,220 1,810
44 1,804 221 520 779 1,160
13 14,194 387 1,230 2,200 4,000
21 879 1,990 2,970 4,470
12 74 144 200 279
23 29 91 158 278
18 {> 43 92 200
51 3,317 165 940 2,120 4,730
32 17,040 1,070 2,410 3,540 5,170
53 7,794 634 2,320 3,990 6,450
10 3,896
21 85 421 906 1,940
15 39 124 217 379
27 43,812
24 10$ 423 811 1,550
48 13,450 818 2,220 3,650 6,090
48 11,680 701 1,850 2,890 4,460
20 21$ 959 1,940 3,920
050
843
3,400
3,810
2,960
2,830
619
993
6,110
1,070
7,070
13,500
3,530
2,300
1,470
5,820
5,760
343
395
321
7,660
6,490
8,390
3,100
532
2,310
8,390
5,770
6,020
QIOO
1,370
6,200
5,580
4,030
3,380
998
1,530
8,720
1,440
8,550
19,200
4,510
2,820
1,810
8,100
7,200
410
535
485
11,500
7,890
10,300
4,620
712
3,240
1 1 , 1 00
7,160
8,690
30
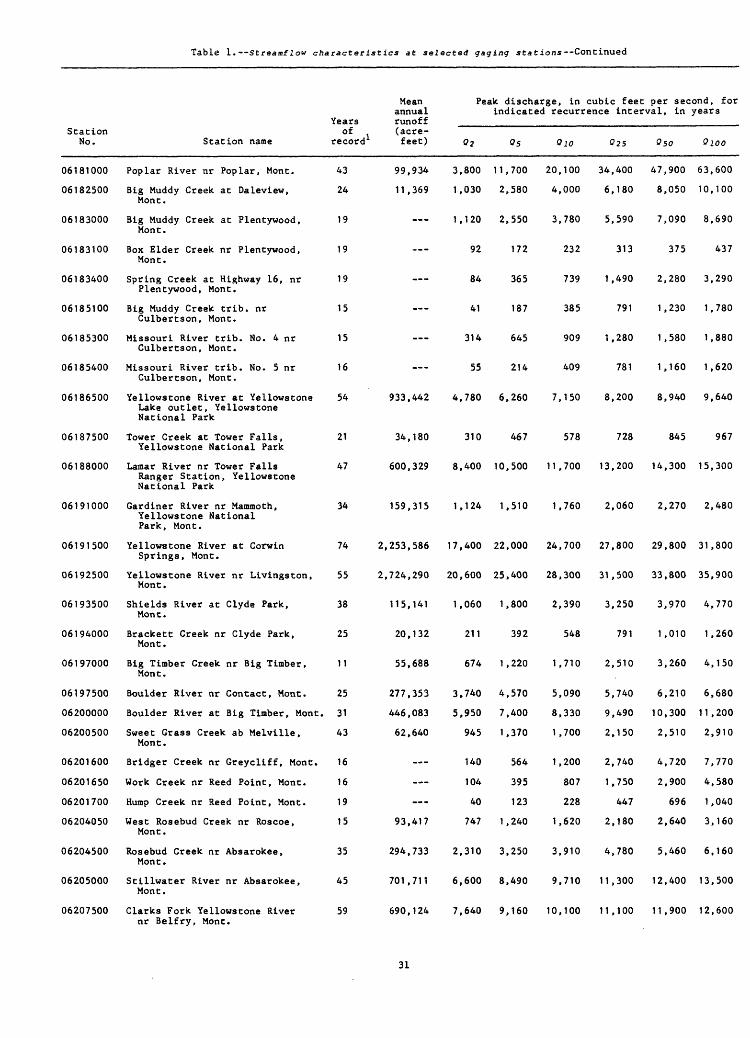
Table 1.--Stream/low characteristics at selected gaging stations Continued
Station No.
06181000
06182500
06183000
06183100
06183400
06185100
06185300
06185400
06186500
06187500
06188000
06191000
06191500
06192500
06193500
06194000
06197000
06197500
06200000
06200500
06201600
06201650
06201700
06204050
06204500
06205000
06207500
Station name
Poplar River nr Poplar, Mont.
Big Muddy Creek at Daleview, Mont.
Big Muddy Creek at Plentywood, Mont.
Box Elder Creek nr Plentywood, Mont.
Spring Creek at Highway 16, nr Plentywood, Mont.
Big Muddy Creek trib. nr Culbertson, Mont.
Missouri River trib. No. 4 nr Culbertson, Mont.
Missouri River trib. No. 5 nr Culbertson, Mont.
Yellowstone River at Yellowstone Lake outlet, Yellowstone National Park
Tower Creek at Tower Falls, Yellowstone National Park
Lamar River nr Tower Falls Ranger Station, Yellowstone National Park
Gardiner River nr Mammoth, Yellowstone National Park, Mont.
Yellowstone River at Corwin Springs, Mont.
Yellowstone River nr Livingston, Mont.
Shields River at Clyde Park, Mont.
Brackett Creek nr Clyde Park, Mont.
Big Timber Creek nr Big Timber, Mont.
Boulder River nr Contact, Mont.
Boulder River at Big Timber, Mont.
Sweet Grass Creek ab Melville, Mont.
Bridger Creek nr Greycliff, Mont.
Work Creek nr Reed Point, Mont.
Hump Creek nr Reed Point, Mont.
West Rosebud Creek nr Roscoe, Mont.
Rosebud Creek nr Absarokee, Mont.
Stillwater River nr Absarokee, Mont.
Clarks Fork Yellowstone River
Mean annual
Years runoff of (acre-
record 1 feet)
43
24
19
19
19
15
15
16
54
21
47
34
74
55
38
25
11
25
31
43
16
16
19
15
35
45
59
99,934
11,369
933,442
34,180
600,329
159,315
2,253,586
2,724,290
115,141
20,132
55,688
277,353
446,083
62,640
93,417
294,733
701,711
690,124
Peak discharge, in cubic feet per second, for indicated recurrence interval, in years
02
3,800
1,030
1,120
92
84
41
314
55
4,780
310
8,400
1,124
17,400
20,600
1,060
211
674
3,740
5,950
945
140
104
40
747
2,310
6,600
7,640
05
11,700
2,580
2,550
172
365
187
645
214
6,260
467
10,500
1,510
22,000
25,400
1,800
392
1,220
4,570
7,400
1,370
564
395
123
1,240
3,250
8,490
9,160
QIO
20,100
4,000
3,780
232
739
385
909
409
7,150
578
11,700
1,760
24,700
28,300
2,390
548
1,710
5,090
8,330
1,700
1,200
807
228
1,620
3,910
9,710
10,100
025
34,400
6,180
5,590
313
1,490
791
1,280
781
8,200
728
13,200
2,060
27,800
31,500
3,250
791
2,510
5,740
9,490
2,150
2,740
1,750
447
2,180
4,780
11,300
11,100
QSO
47,900
8,050
7,090
375
2,280
1,230
1,580
1,160
8,940
845
14,300
2,270
29,800
33,800
3,970
1,010
3,260
6,210
10,300
2,510
4,720
2,900
696
2,640
5,460
12,400
11 ,900
QIOO
63,600
10,100
8,690
437
3,290
1,780
1,880
1,620
9,640
967
15,300
2,480
31,800
35,900
4,770
1,260
4,150
6,680
11,200
2,910
7,770
4,580
1,040
3,160
6,160
13,500
12,600nr Belfry, Mont.
31

Table 1.--Stream/low characteristics at selectee? gaging stations--Continued
StationNo.
06207800
06209500
06210500
06211000
06211500
06212500
12300500
12300800
12301300
12301999
12302055
12302400
.12303100
12303500
12304250
12304300
12304400
12304500
12323300
12323500
12324100
12324700
12324800
12325500
12329500
12330000
12332000
12335000
12335500
12338500
12339900
12340000
12340200
Station name
Bluewater Creek nr Bridger
Rock Creek nr Red Lodge, Mont.
West Fork Rock Creek nr RedLodge, Mont.
Red Lodge Creek ab CooneyReservoir, nr Boyd, Mont.
Willow Creek nr Boyd, Mont.
Red Lodge Creek bl CooneyReservoir, nr Boyd, Mont.
Fortine Creek nr Trego, Mont.
Deep Creek nr Fortine, Mont.
Tobacco River nr Eureka, Mont.
Wolf Creek nr Libby, Mont.
Fisher River nr Libby, Mont.
Shaughnessy Creek nr Libby, Mont.
Flower Creek nr Libby, Mont.
Lake Creek at Troy, Mont.
Whitetail Creek nr Yaak, Mont.
Cyclone Creek nr Yaak, Mont.
Fourth of July Creek nr Yaak,Mont.
Yaak River nr Troy, Mont.
Smith Gulch nr Silverbow, Mont.
German Gulch Creek nr Ramsay,Mont.
Racetrack Creek bl Granite Creek,nr Anaconda, Mont.
Clark Fork trib. nr Drummond,Mont.
Morris Creek nr Drummond, Mont.
Flint Creek nr Southern Cross,Mont.
Flint Creek at Maxville, Mont.
Boulder Creek at Maxville, Mont.
Middle Fork Rock Creek nrPhillipsburg, Mont.
Blackfoot River nr Helmville,Mont.
Nevada Creek ab Reservoir, nrFinn, Mont.
Blackfoot River nr Ovando, Mont.
West Twin Creek nr Bonner, Mont.
Blackfoot River nr Bonner, Mont.
Marshall Creek nr Missoula, Mont.
Yearsof
record
11
46
10
42
42
43
23
20
22
10
13
20
20
12
15
19
15
24
20
14
16
21
15
40
39
41
43
13
41
23
20
44
15
Mean annual runoff(acre-
1 feet)
126,004
48,157
73,864
...
...
195,523
50,836
363,528
...
19,407
373,667
...
...
.*.-
643,778
...
15,135
42,798
___
20,783
72,271
34,470
89,072
254,904
27,880
619,157
1,195,588
...
Peak discharge, in cubic feet per second, for indicated recurrence interval, in years
C? 2
110
1,210
586
574
25d
737
138
1,580
579
12
225
29
133
164
7,590
21
188
360
43
a_ ,
--
373
912
2,110
504
5,230
94
9,360
17
£?5
313
1,710
977
1,200
563
1,130
191
2,190
1,360
...
30
325
...
46
182
248
9,820
50
295
484
82
14
._.
553
1,240
3,730
915
8,210
156
14,000
26
QIO
550
2,060
1 ,270
1,780
879
1,420
226
2,580
2,100
...
48
391
...
58
213
306
11,200
77
370
563
115
18
._.
677
1,440
5,010
1,250
10,500
202
16,900
33
025
1,020
2,510
1,660
2,720
1,440
1,820
272
3,070
3,310
...
78
474
...
74
252
382
12,800
123
469
660
164
23
_-_
...
840
1,670
6,850
1,730
13,600
264
20,400
41
<?50
1.520
2,860
1,970
3,580
1,990
...
2,140
306
3,430
4,420
...
106
536
...
87
280
439
14,000
165
545
731
207
28
._.
...
965
1,830
8,380
2,130
16,200
314
22,900
47
QIOO
2,200
3,210
2,290
4,600
2,700
2,480
340
3,780
5,710
...
139
597
...
100
308
497
15,100
214
623
800
256
32
...
...
1,090
1,980
10,000
2,560
18,900
365
25,200
54
32
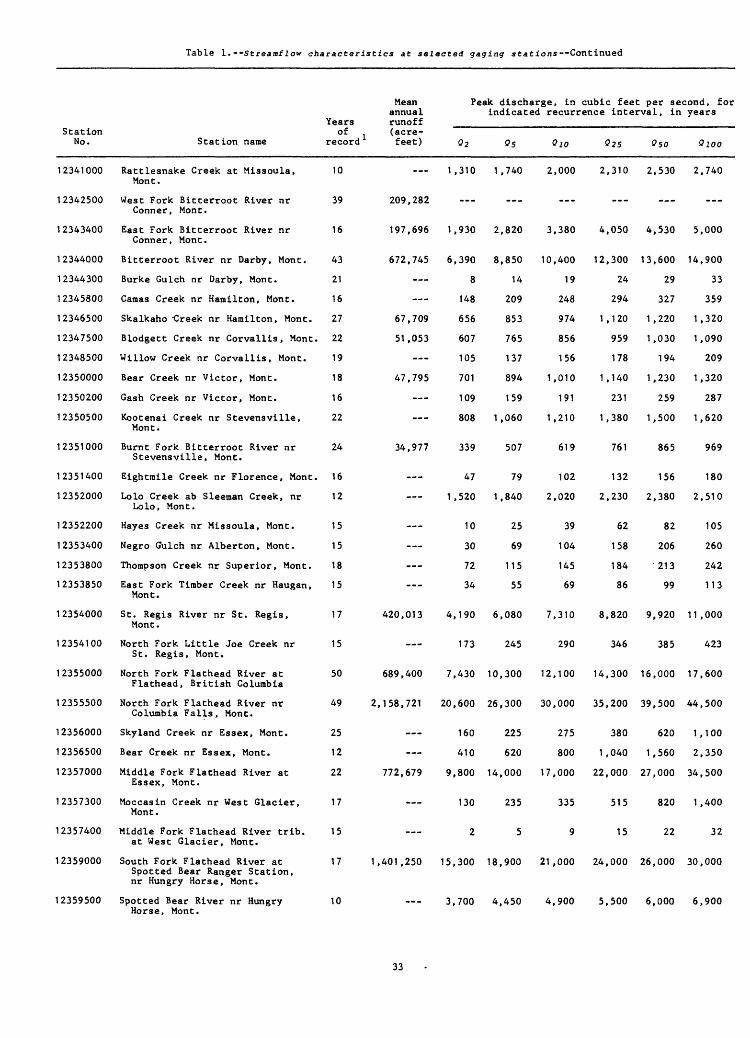
Table 1.--Stream/ low characteristics at selected gaging stations--Continued
StationNo.
12341000
12342500
12343400
1 2344000
12344300
12345800
12346500
12347500
12348500
12350000
12350200
12350500
12351000
12351400
12352000
12352200
12353400
12353800
12353850
12354000
12354100
12355000
12355500
12356000
12356500
12357000
12357300
12357400
12359000
Station name
Rattlesnake Creek at Missoula,Mont.
West Fork Bitterroot River nrConner, Mont.
East Fork Bitterroot River nrConner, Mont.
Bitterroot River nr Darby, Mont.
Burke Gulch nr Darby, Mont.
Camas Creek nr Hamilton, Mont.
Skalkaho "Creek nr Hamilton, Mont.
Blodgett Creek nr Corvallis, Mont.
Willow Creek nr Corvallis, Mont.
Bear Creek nr Victor, Mont.
Gash Creek nr Victor, Mont.
Kootenai Creek nr Stevensville,Mont.
Burnt Fork Bitterroot River nrStevensville, Mont.
Eightmile Creek nr Florence, Mont.
Lolo Creek ab Sleeman Creek, nrLolo, Mont.
Hayes Creek nr Missoula, Mont.
Negro Gulch nr Alberton, Mont.
Thompson Creek nr Superior, Mont.
East Fork Timber Creek nr Haugan,Mont.
St. Regis River nr St. Regis,Mont.
North Fork Little Joe Creek nrSt. Regis, Mont.
North Fork Flathead River atFlathead, British Columbia
North Fork Flathead River nrColumbia Falls, Mont.
Sky land Creek nr Essex, Mont.
Bear Creek nr Essex, Mont.
Middle Fork Flathead River atEssex, Mont.
Moccasin Creek nr West Glacier,Mont.
Middle Fork Flathead River trib.at West Glacier, Mont.
South Fork Flathead River at
Yearsof
record
10
39
16
43
21
16
27
22
19
18
16
22
24
16
12
15
15
18
15
17
15
50
49
25
12
22
17
15
17
Meanannualrunoff(acre-feet)
...
209,282
197,696
672,745
67,709
51,053
47,795
34,977
420,013
___
689,400
2,158,721
772,679
___
___
1,401,250
Peak discharge , in cubic feet per second, forindicated recurrence interval, in
02
1,310
___
1,930
6,390
8
148
656
607
105
701
109
808
339
47
1,520
10
30
72
34
4,190
173
7,430
20,600
160
410
9,800
130
2
15,300
Os
1,740 2
-__
2,820 3
8,850 10
14
209
853
765
137
894 1
159
1,060 1
507
79
1 , 840 2
25
69
115
55
6,080 7
245
10,300 12
26,300 30
225
620
14,000 17
235
5
18,900 21
Oio
,000
___
,380
,400
19
248
974
856
156
,010
191
,210
619
102
,020
39
104
145
69
,310
290
,100
,000
275
800
,000
335
9
,000
025
2,310
___
4,050
12,300
24
294
1 ,120
959
178
1,140
231
1,380
761
132
2,230
62
158
184
86
8,820
346
14,300
35,200
380
1 ,040
22,000
515
15
24,000
Oso
2,530
___
4,530
13,600
29
327
1,220
1,030
194
1,230
259
1,500
865
156
2,380
82
206
213
99
9,920
385
16,000
39,500
620
1,560
27,000
820
22
26,000
years
QIOO
2,740
___
5,000
14,900
33
359
1,320
1,090
209
1,320
287
1,620
969
180
2,510
105
260
242
113
11 ,000
423
17,600
44,500
1,100
2,350
34,500
1,400
32
30,000
12359500
Spotted Bear Ranger Station, nr Hungry Horse, Mont.
Spotted Bear River nr Hungry Horse, Mont.
10 3,700 4,450 4,900 5,500 6,000 6,900
33

Table l.--Strea inflow characteristics at selected gaging stations--Continued
Station No.
12360000
12361000
12361500
12362500
12363900
12364000
12365000
12366000
12367500
12370000
12370500
12370900
12371100
12374300
12375700
12389500
Station name
Twin Creek nr Hungry Horse, Mont.
Sullivan Creek nr Hungry Horse, Mont.
Graves Creek nr Hungry Horse, Mont.
South Fork Flathead River nr Columbia Falls, Mont.
Rock Creek nr Olney, Mont.
Logan Creek at Tally Lake, nr Whitefish, Mont.
Stillwater River nr Whitefish, Mont.
Whitefish Creek nr Kalispell, Mont.
Ashley Creek nr Kalispell, Mont.
Swan River nr Bigfork, Mont.
Dayton Creek nr Proctor, Mont.
Teepee Creek nr Poison, Mont.
Hellroaring Creek nr Poison, Mont.
Mill Creek nr Niarada, Mont.
Garden Creek nr Hot Springs, Mont.
Thompson River nr Thompson Falls, Mont.
Years of
record1
11
25
11
52
15
10
28
29
19
58
20
15
15
15
15
24
Mean annual runoff (acre- feet)
87,623
162,936
97,762
2,577,285
242,594
138,315
22,304
843,646
4,808
346,873
Peak discharge, in cubic feet per second, for indicated recurrence interval, in years
02
1,400 1
1,860 2
1,290 1
25,OOC( 34
15
454
1,520 2
820 1
5,250 6
38
a28
89
25
2,690 4
05
,950 2
,430 2
,880 2
,500 40
24
874 1
,500 3
,090 1
,590 7
79
19
58
165
49
,270 5
QlO
,310
,800
,290
,200
32
.220
,170
,250
,360
115
29
84
227
68
,360
025
2,890
3,210
2,820
47,500
44
1,740
4,020
1,450
8,250
172
48
126
318
96
6,740
Oso
3,050
3,600
3,230
53,700
53
2,170
4,650
1,580
8,850
222
65
163
395
119
7,770
QIOO
4,100
4,100
3,650
61,500
64
2,650
5,270
1,720
9,410
280
88
206
478
144
8,780
For gaging stations with both continuous flow record and peak discharge record, the years of record pertain to the continuous flow record only.
34

Table 2. --Channel-geometry characteristics at selected gaging stations
Station No.
05011000
05014000
05014500
05017500
05020500
06011000
06012500
06013200
06013400
06013500
06015500
06017500
06019500
06019800
06023000
06025300
06025500
06026000
06027700
06030300
06033000
06034700
06035000
06037500
06038500
06043000
06043200
06043300
06043500
06046500
06046700
06047000
06048000
06048500
Station name
Belly River nr Mountain View, Alberta
Grinnell Creek nr Many Glacier, Mont.
Swiftcurrent Creek at Many Glacier, Mont.
St. Mary River nr Babb, Mont.
St. Mary River at international boundary , Mon t .
Red Rock River nr Lakeview, Mont.
Red Rock River bl Lima Reservoir, nr Monida, Mont.
Traux Creek nr Lima, Mont.
Muddy Creek nr Dell, Mont.
Big Sheep Creek bl Muddy Creek, nr Dell, Mont.
Grasshopper Creek nr Dillon, Mont.
Blacktail Deer Creek nr Dillon, Mont.
Ruby River ab reservoir, nr Alder, Mont.
Idaho Creek nr Alder, Mont.
Ruby River nr Twin Bridges, Mont.
Moose Creek nr Divide, Mont.
Big Hole River nr Melrose, Mont.
Birch Creek nr Glen, Mont.
Fish Creek nr Silverstar, Mont.
Jefferson River trib. No. 2 nr Whitehall, Mont.
Boulder River nr Boulder, Mont.
Sand Creek at Sappington, Mont.
Willow Creek nr Harrison, Mont.
Madison River nr West Yellowstone, Mont.
Madison River bl Hebgen Lake, nr Grayling, Mont.
Taylor Creek nr Grayling, Mont.
Squaw Creek nr Gallatin Gateway, Mont.
Logger Creek nr Gallatin Gateway, Mont.
Gallatin River nr Gallatin Gateway, Mont.
Rocky Creek nr Bozeman, Mont.
Pitcher Creek nr Bozeman, Mont.
Bear Canyon nr Bozeman, Mont.
East Gallatin River at Bozeman, Mont.
Bridger Creek nr Bozeman, Mont.
Active- channel width
tfuA105
25
45
165
160
77
60
3.0
5.5
27
31
21
44
5.5
48
13
223
22
17
6.0
45
6.0
23
85
105
39
25
8.0
102
27
5.0
13
35
22
Active- channel depth(c&t>)
2.0
2.0
2.0
3.0
2.5
1 .1
2.5
.3
1.8
2.0
1.3
1.4
2.6
.7
3.0
.9
1.5
1.1
1.1
.5
1.5
.5
1.5
1.6
2.5
1.5
1.4
1 .0
2.5
1 .2
.3
.7
1 .4
1.9
Bank- full width<&SA
135
35
62
180
170
87
6.0
10
33
40
37
9.0
59
19
260
28 .
23
11
60
8.0
94
120
44
120
37
10
18
46
Bank- full depth
'dllA
4.0
4.0
5.0
8.0
5.5
2.0
...
1 .4
2.8
4.0
2.8
3.4
2.7
5.5
2.9
7.5
2.6
3.6
1.5
3.5
.8
4.1
4.5
3.0
5.5
2.7
1.3
2.0
3.4
35

Table 2. Channel-geometry characteristics at selected gaging stations Continued
Station No.
06050000
06052500
06055500
06056200
06056300
06056600
06058700
06061500
06061800
06061900
06062500
06063000
06068500
06071000
06071200
06071400
06071600
06073000
06073500
06075600
06076000
06076700
06076800
06077000
06077500
06077700
06077800
06079600
06080000
06081500
06084500
06085800
06087900
Station name
Hyalite Creek at Hyalite Ranger Station, nr Bozeman, Mont.
Gallatin River at Logan, Mont.
Crow Creek nr Radersburg, Mont.
Castle Creek trib. nr Ringling, Mont.
Cabin Creek nr Townsend, Mont.
Deep Creek bl North Fork Deep Creek, nr Townsend, Mont.
Mitchell Gulch nr East Helena, Mont.
Prickly Pear Creek nr Clancy, Mont.
Crystal Creek nr East Helena, Mont.
McClellan Creek at City Diversion Dam, nr East Helena, Mont.
Tenmile Creek nr Rimini, Mont.
Tenmile Creek nr Helena, Mont.
Little Prickly Pear Creek nr Marysville, Mont.
Little Prickly Pear Creek nr Canyon Creek, Mont.
Lyons Creek nr Wolf Creek, Mont.
Dog Creek nr Craig, Mont.
Wegner Creek at Craig, Mont.
Dearborn River nr demons, Mont.
Dearborn River nr Craig, Mont.
Fivemile Creek nr White Sulphur Springs, Mont.
Newland Creek nr White Sulphur Springs, Mont.
Sheep Creek nr Neihart, Mont.
Nuggett Creek nr Neihart, Mont.
Sheep Creek nr White Sulphur Springs, Mont.
Smith River nr Eden, Mont.
Smith River trib. nr Eden, Mont.
Goodman Coulee nr Eden, Mont.
Beaver Creek at Gibson Dam, nr Augusta, Mont.
Sun River nr Augusta, Mont.
Willow Creek nr Augusta, Mont.
Elk Creek at Augusta, Mont.
Sun River at Simms, Mont.
Muddy Creek trib. nr Power, Mont.
ActiVe- channel width("AC) (feet)
33
150
30
5.;5
7.0
21
9.0
27
7.0
20
16
26
14
24
11
11
14
54
69
4.0
7.0
12
3.0
26
76
1.0
5.3
17
160
20
46
165
3.0
Active- channel depth(°AC\(feet)
1 .1
3.0
1.2
.6
.6
1.1
.2
1.4
.6
.6
.8
1.0
1.7
1.0
1.1
.5
.5
2.5
2.3
.4
1.0
1 .1
1.0
1.5
1.5
.1
.6
1.0
1.8
1.5
1.5
2.5
.4
Bank- full width(»BF\ (feet)
42
170
38
8.0
12
29
31
10
28
25
33
24
37
16
15
18
83
85
8.5
12
25
9.0
33
98
2.5
11
24
193
35
50
180
5.5
Bank- full depth(OB?) (feet)
4.1
6.0
3.2
1.6
2.6
2.0
3.2
1 .6
2.6
2.5
2.2
2.8
2.5
1.7
1.3
1 .5
3.0
4.0
2.5
2.4
1.9
3.0
5.0
.4
2.4
2.5
7.3
3.5
3.5
4.5
.6
36

Table 2.--Channel -geometry characteristics at selected gaging stations--Continued
Station No.
06088500
06089000
06089300
06090500
06092000
06093200
06095000
06098000
06099000
06100200
06100300
06101900
06102200
06106000
06108000
06108200
06109800
06110000
06111000
06111500
06111700
06112100
06115300
06115500
06117000
06118500
06129100
06129200
06132200
06132400
06133500
06135500
06138700
Station name
Muddy Creek at Vaughn, Mont.
Sun River nr Vaughn, Mont.
Sun River trib. nr Great Falls, Mont.
Belt Creek nr Monarch, Mont.
Two Medicine River nr Browning, Mont.
Badger Creek bl Four Horns Canal, nr Brown ing , Mon t .
Birch Creek nr Dupuyer, Mont.
Dupuyer Creek nr Valier, Mont.
Cut Bank Creek at Cut Bank, Mont.
Heines Coulee trib. nr Valier, Mont.
Lone Man Coulee nr Valier, Mont.
Dead Indian Coulee nr Fort Benton, Mont.
Marias River trib. at Loraa, Mont.
Deep Creek nr Choteau, Mont.
Teton River nr Dutton, Mont.
Kinley Coulee nr Dutton, Mont.
South Fork Judith River nr Utica, Mont.
Judith River nr Utica, Mont.
Ross Fork nr Hobson, Mont.
Big Spring Creek nr Lewistown, Mont.
Mill Creek nr Lewistown, Mont.
Cottonwood Creek nr Moore, Mont.
Duval Creek nr Landusky, Mont.
North Fork Musselshell River nr Delpine, Mont.
Checkerboard Creek at Delpine, Mont.
South Fork Musselshell River ab Martinsdale, Mont.
North Fork McDonald Creek trib. nr Heath, Mont.
Alkali Creek nr Heath, Mont.
South Fork Milk River nr Babb, Mont.
Dry Fork Milk River nr Babb, Mont.
North Fork Milk River ab St. Mary Canal, nr Browning, Mont.
Sage Creek at Q Ranch, nr Wild Horse, Alberta
South Fork Spring Coulee nr Havre, Mont.
Active- channel width
(feet)
45
200
10
62
164
90
52
22
88
1 .0
6.5
2.0
5.0
49
72
10
21
37
24
29
3.0
26
8.0
15
16
45
2.5
5.0
45
9.5
23
15
8.0
Active- channel depth
(feet)
2.5
0.0
.7
1.8
2.6
2.0
1 .8
.7
1.0
.3
.7
.3
.4
1.0
1.9
.3
1.8
2.0
2.0
2.5
.9
1 .0
.3
1.5
.9
1.6
.5
.5
1.0
.8
2.2
1 .3
.3
Bank- full width
(feet)
60
255
18
185
95
105
33
108
4.0
14
14
60
84
17
25
42
35 .
36
5.0
30
14
19
20
56
8.0
9.0
12
32
Bank- full depth
(feet)
5.5
0.9
6.6
5.0
5.0
1 .5
3.4
1.0
1.6
1.4
4.0
6.0
1.0
3.5
2.0
2.5
1.0
2.8
1.5
2.5
2.5
1 .0
2.0
3.3
4.2
37
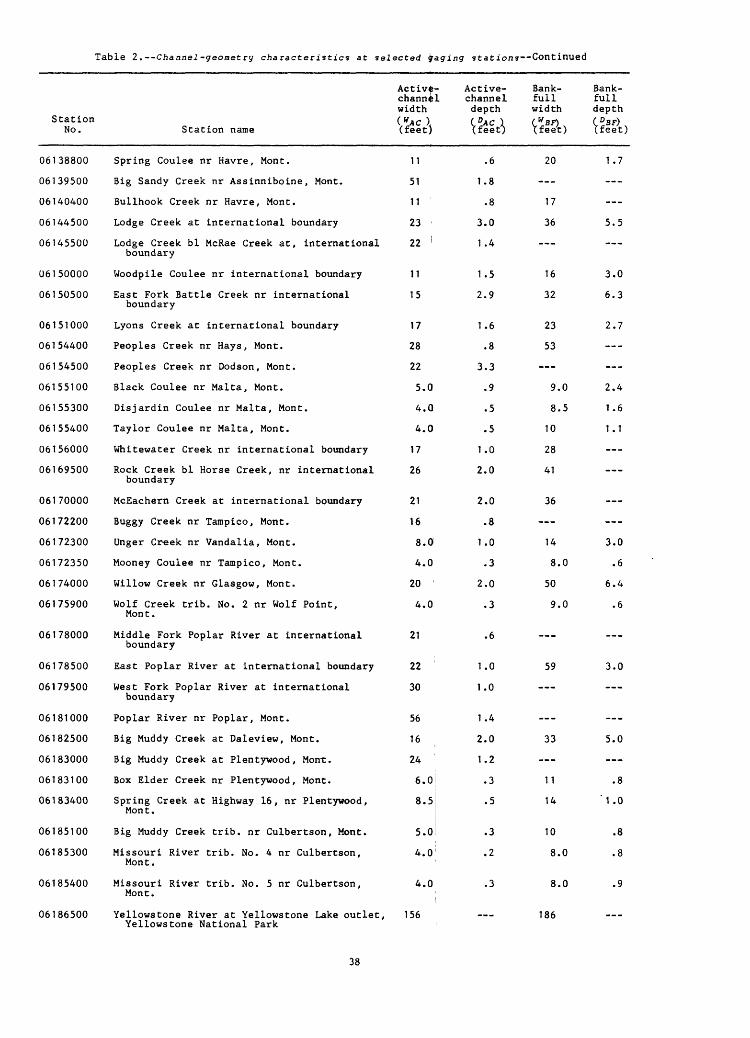
Table 2. --Channel-geometry characteristics at selected paging stations--Continued
Station No.
06138800
06139500
06140400
06144500
06145500
06150000
06150500
06151000
06154400
06154500
06155100
06155300
06155400
06156000
06169500
06170000
06172200
06172300
06172350
06174000
06175900
06178000
06178500
06179500
06181000
06182500
06183000
06183100
06183400
06185100
06185300
06185400
06186500
Activ£- Active- Bank- Bank- chann^l channel full full width depth width depth
Station name (feet) (feet; \feet) (feet)
Spring Coulee nr Havre, Mont. 11
Big Sandy Creek nr Assinniboine, Mont. 51
Bullhook Creek nr Havre, Mont. 11
Lodge Creek at international boundary 23
Lodge Creek bl McRae Creek at, international 22 ' boundary
Woodpile Coulee nr international boundary 11
East Fork Battle Creek nr international 15 boundary
Lyons Creek at international boundary 17
Peoples Creek nr Hays, Mont. 28
Peoples Creek nr Dodson, Mont. 22
Black Coulee nr Malta, Mont. 5.0
Disjardin Coulee nr Malta, Mont. 4.0
Taylor Coulee nr Malta, Mont. 4.0
Whitewater Creek nr international boundary 17
Rock Creek bl Horse Creek, nr international 26 boundary
McEachern Creek at international boundary 21
Buggy Creek nr Tampico, Mont. 16
Unger Creek nr Vandal ia, Mont. 8.0
Mooney Coulee nr Tampico, Mont. 4.0
Willow Creek nr Glasgow, Mont. 20
Wolf Creek trib. No. 2 nr Wolf Point, 4.0 Mont.
Middle Fork Poplar River at international 21 boundary
East Poplar River at international boundary 22
West Fork Poplar River at international 30 boundary
Poplar River nr Poplar, Mont. 56
Big Muddy Creek at Daleview, Mont. 16
Big Muddy Creek at Plentywood, Mont. 24
Box Elder Creek nr Plentywood, Mont. 6.0
Spring Creek at Highway 16, nr Plentywood, 8.5 Mont.
Big Muddy Creek trib. nr Culbertson, Mont. 5.0
Missouri River trib. No. 4 nr Culbertson, 4.0 Mont.
Missouri River trib. No. 5 nr Culbertson, 4.0 Mont.
Yellowstone River at Yellowstone Lake outlet, 156
.6 20 1.7
1.8
.8 17
3.0 36 5.5
1.4
1.5 16 3.0
2.9 32 6.3
1.6 23 2.7
.8 53
3.3
.9 9.0 2.4
.5 8.5 1.6
.5 10 1.1
1.0 28
2.0 41
2.0 36
.8
1.0 14 3.0
.3 8.0 .6
2.0 50 6.4
.3 9.0 .6
.6
1.0 59 3.0
1.0
1.4
2.0 33 5.0
1.2
.3 11 .8
.5 14 '1.0
.3 10 .8
.2 8.0 .8
.3 8.0 .9
186Yellowstone National Park
38

Table 2. channel-geometry characteristics at selected gaging stations--Continued
Station No.
06187500
06188000
06191000
06191500
06192500
06193500
06194000
06197000
06197500
06200000
06200500
06201600
06201650
06201700
06204050
06204500
06205000
06207500
06207800
06209500
06210500
06211000
06211500
06212500
12300500
12300800
12301300
12301999
12302055
12302400
12303100
12303500
12304250
1 2304300
Station name
Tower Creek at Tower Falls, Yellowstone National Park
Lamar River nr Tower Falls Ranger Station, Yellowstone National Park
Gardiner River nr Mammoth, Yellowstone National Park
Yellowstone River at Corwin Springs, Mont.
Yellowstone River nr Livingston, Mont.
Shields River at Clyde Park, Mont.
Brackett Creek nr Clyde Park, Mont.
Big Timber Creek nr Big Timber, Mont.
Boulder River nr Contact, Mont.
Boulder River at Big Timber, Mont.
Sweet Grass Creek ab Melville, Mont.
Bridger Creek nr Greycliff, Mont.
Work Creek nr Reed Point, Mont.
Hump Creek nr Reed Point, Mont.
West Rosebud Creek nr Roscoe, Mont.
Rosebud Creek nr Absarokee, Mont.
Stillwater River nr Absarokee, Mont.
Clarks Fork Yellowstone River nr Belfry, Mont.
Bluewater Creek nr Bridger, Mont.
Rock Creek nr Red Lodge, Mont.
West Fork Rock Creek nr Red Lodge, Mont.
Red Lodge Creek ab Cooney Reservoir, nr Boyd, Mont.
Willow Creek nr Boyd, Mont.
Red Lodge Creek bl Cooney Reservoir, nr Boyd, Mont.
Fortine Creek nr Trego, Mont.
Deep Creek nr Fortine, Mont.
Tobacco River nr Eureka, Mont.
Wolf Creek nr Libby, Mont.
Fisher River nr Libby, Mont.
Shaughnessy Creek nr Libby, Mont.
Flower Creek nr Libby, Mont.
Lake Creek at Troy, Mont.
Whitetail Creek nr Yaak, Mont.
Cyclone Creek nr Yaak, Mont.
Active- channel width("AC) .(feet)
23
120
44
240
270
68
23
42
80
120
47
24
20
4.0
47
105
140
150
10
65
40
30
26
38
22
16
48
40
111
7.0
17
70
9.0
9.0
Active- channel depth(»AC\ (feet)
2.5
1.5
3.5
.9
.9
2.0
2.5
2.5
1.8
.7
1.0
.7
1.8
2.0
2.0
0.0
2.0
1.5
1.5
2.3
2.0
1.8
1.0
1.0
1.7
1.4
2.4
.6
1.1
1.3
.5
1.0
Bank- full width(*BF) (feet)
29
135
55
260
300
75
31
65
95
140
56
32
31
8.0
60
130
163
23
80
60
46
38
55
29
18
58
47
130
11
24
78
17
22
Bank- full depth(°BF) (feet)
6.0
3.0
6.0
4.4
2.9
6.0
6.0
6.0
3.0
2.0
4.0
1 .1
5.8
5.0
5.5
6.0
3.5
3.5
8.3
5.0
8.8
3.0
2.0
4.7
2.9
6.0
1.6
3.1
4.3
2.0
2.7
39

Table 2. Channel-geometry characteristics at selected gaging stations Continued
Station No.
12304400
12304500
12323300
12323500
12324100
12324700
12324800
12325500
12329500
12330000
12332000
12335000
12335500
12338500
12339900
12340000
12340200
12341000
12342500
12343400
12344000
12344300
12345800
12346500
12347500
12348500
12350000
12350200
12350500
12351000
12351400
12352000
12352200
12353400
Active- Active- Bank- channel channel full width depth width(^c) ("AC) < W BF)
Station name (feet) (feet) (feet)
Fourth of July Creek nr Yaak, Mont. 13
Yaak River nr Troy, Mont. 136
Smith Gulch nr Silverbow, Mont. 3
German Gulch Creek nr Ramsay, Mont. 20
Racetrack Creek bl Granite Creek, nr 22 Anaconda, Mont.
.8 21
1.4 176
0 .2 5.5
1.6
1.1 28
Clark Fork trib. nr Drummond, Mont. 4^0 .2 10
Morris Creek nr Drummond, Mont. 3.0 .4 5.0
Flint Creek nr Southern Cross, Mont. 12
Flint Creek at Maxville, Mont. 28
Boulder Creek at Maxville, Mont. 28
Middle Fork Rock Creek nr Phillipsburg, 56 Mont.
Blackfoot River nr Helmville, Mont. 100
Nevada Creek ab Reservoir, nr Finn, 28 Mont.
Blackfoot River nr Ovando, Mont. 150
West Twin Creek nr Bonner, Mont. 15
Blackfoot River nr Bonner, Mont. 150
.7 18
1.9 35
1.5 32
1.2 71
2.3 120
.8 36
3.0 180
1.0 22
3.0 190
Marshall Creek nr Missoula, Mont. 6.0 .8 9.0
Rattlesnake Creek at Missoula, Mont. 39
West Fork Bitterroot River nr Conner, 60 Mont.
East Fork Bitterroot River nr Conner, 70 Mont.
Bitterroot River nr Darby, Mont. 148
Burke Gulch nr Darby, Mont. 3.
Camas Creek nr Hamilton, Mont. 15
Skalkaho Creek nr Hamilton, Mont. 34
Blodgett Creek nr Corvallis, Mont. 30
Willow Creek nr Corvallis, Mont. 17
Bear Creek nr Victor, Mont. 41
Gash Creek nr Victor, Mont. 11
Kootenai Creek nr Stevensville, Mont. 38
Burnt Fork Bitterroot River nr 20 Stevensville, Mont.
Eightmile Creek nr Florence, Mont. 10
Lolo Creek ab Sleeman Creek, nr Lolo, 51 Mont.
Hayes Creek nr Missoula, Mont. 4.
Negro Gulch nr Alberton, Mont. 8.
1.7 48
2.0 78
1.5 90
2.0 184
0 .3 5.5
.5 20
1.3 44
1.3 38
.8 21
1.8 47
.4 16
1.6 46
1.0 28
.7 16
1.0 60
0 .5 7.5
0 .5 13
Bank- full depth (OBF) (feet)
2.8
6.4
.5
3.1
.6
1.4
1.1
3.0
4.5
2.7
5.0
2.8
7.0
3.0
6.0
1.8
4.2
5.0
4.5
4.0
1 .2
2.0
3.3
2.8
2.3
3.8
1.4
3.6
2.0
2.7
4.0
1 .0
1.5
40

Table 2.--Channel-geometry characteristics at selected gaging stations Continued
StationNo.
12353800
12353850
12354000
12354100
12355000
12355500
12356000
12356500
12357000
12357300
12357400
12359000
12359500
12360000
12360500
12361000
12361500
12362500
12363900
12364000
12365000
12366000
12367500
12370000
12370500
12370900
12371100
12374300
12375700
12389500
Station name
Thompson Creek nr Superior, Mont.
East Fork Timber Creek nr Haugan, Mont.
St. Regis River nr St. Regis, Mont.
North Fork Little Joe Creek nr St. Regis, Mont.
North Fork Flathead River at Flathead, British Columbia
North Fork Flathead River nr Columbia Falls, Mont.
Sky land Creek nr Essex, Mont.
Bear Creek nr Essex, Mont.
Middle Fork Flathead River at Essex, Mont.
Moccasin Creek nr West Glacier, Mont.
Middle Fork Flathead River trib. at West Glacier, Mont.
South Fork Flathead River at Spotted Bear Ranger Station, nr Hungry Horse, Mont.
Spotted Bear River nr Hungry Horse, Mont.
Twin Creek nr Hungry Horse, Mont.
Lower Twin Creek nr Hungry Horse, Mont.
Sullivan Creek nr Hungry Horse, Mont.
Graves Creek nr Hungry Horse, Mont.
South Fork Flathead River nr Columbia Falls, Mont.
Rock Creek nr Olney, Mont.
Logan Creek at Tally Lake, nr Whitefish, Mont.
Stillwater River nr Whitefish, Mont.
Whitefish Creek nr Kalispell, Mont.
Ashley Creek nr Kalispell, Mont.
Swan River nr Bigfork, Mont.
Dayton Creek nr Proctor, Mont.
Teepee Creek nr Poison, Mont.
Hellroaring Creek nr Poison, Mont.
Mill Creek nr Niarada, Mont.
Garden Creek nr Hot Springs, Mont.
Thompson River nr Thompson Falls, Mont.
Active- channel width<*AC>(feet)
9.0
8.0
130
16
120
225
19
25
172
16
2.5
178
65
41
32
63
40
290
6.0
47
70
64
26
165
11
6.0
9.0
13
8.0
95
Active- channel depth( a»c> , (feet)
0.7
.8
2.5
.9
2.0
3.0
1.0
1.2
1.7
1.2
.3
1.5
2.9
1.5
1.5
1.4
KO
4.0
1.0
1.0
6.0
1.6
1.0
1.0
.6
.7
1.5
.7
.5
3.5
Bank- full width(VBF) (feet)
14
12
136
21
145
270
28
36
192
22
4.5
200
105
59
44
78
60
325
8.0
67
85
82
38
185
14
10
14
21
12
Bank- full depth( DBF> ^ (feet)
2.5
2.8
6.5
2.4
5.0
7.0
3.0
3.2
4.7
3.2
.8
5.5
5.9
4.5
3.5
3.4
3.0
7.5
2.0
2.0
12.0
4.6
3.5
4.0
1.6
2.5
3.5
4.7
2.5
5.0
41

Table 3.--Basin characteristics at selected gaging stations
StationNo.
05011000
05014000
05014500
05017500
05020500
06011000
06012500
06013200
06013400
06013500
06015500
06017500
06019500
06019800
06023000
06025300
06025500
06026000
06027700
06030300
06033000
06034700
06035000
06037500
06038500
06043000
06043200
06043300
06043500
Drain age
area GO
(square
Mean annual precipi- Forest tation cover (*) (?)
Station name miles) (inches)
Belly River nr Mountain View,Alberta
Grinnell Creek nr Many Glacier,Mont.
Swiftcurrent Creek at ManyGlacier, Mont.
St. Mary River nr Babb, Mont.
St. Mary River at internationalboundary, Mont.
Red Rock River nr Lakeview,Mont.
Red Rock River bl LimaReservoir, nr Monida, Mont.
Traux Creek nr Lima, Mont.
Muddy Creek nr Dell, Mont.
Big Sheep Creek bl Muddy Creek,nr Dell, Mont.
Grasshopper Creek nr Dillon,Mont.
Blacktail Deer Creek nr Dillon,Mont.
Ruby River ab Reservoir, nrAlder, Mont.
Idaho Creek nr Alder, Mont.
Ruby River nr Twin Bridges,Mont.
Moose Creek nr Divide, Mont.
Big Hole River nr Melrose, 2Mont.
Birch Creek nr Glen, Mont.
Fish Creek nr Silverstar,Mont.
Jefferson River trib. No. 2,nr Whitehall, Mont.
Boulder River nr Boulder,Mont.
Sand Creek at Sappington,Mont.
Willow Creek nr Harrison,Mont.
Madison River nr WestYellows tone, Mont.
Madison River bl Hebgen Lake, nrGrayling, Mont.
Taylor Creek nr Grayling, Mont.
Squaw Creek nr Gallatin Gateway,Mont.
Logger Creek nr GallatinGateway, Mont.
Gallatin River nr Gallatin
121
3.47
31.4
278
469
323
570
4.06
62.7
280
348
312
538
11.0
935
41 .4
,476
36.0
39.5
4.50
381
9.41
83.8
420
905
98.0
40.4
2.48
825
65
95
95
71
59
22
21
15
16
19
19
12
18
19
19
18
23
12
19
12
19
11
27
24
38
40
35
30
37
Mean basin eleva tion(*)
(feet above sea
(percent) level))
59.8
47.4
58.1
66.0
57.0
29.2
21.8
2.8
24.0
31.0
30.0
18.8
28.8
52.0
32.0
73. »
65.3
86.8
77.0
17.0
89.1
.0
52.5
93.8
90.0
60.5
95.0
99.0
83.3
5.92Q
6,530
6,460
6,170
5,790
7,330
7,180
7,240
7,840
8,010
7,050
7,210
7,280J
7,010
7,060 j
7,050
7,140
7,690
7,030
5,440
6,640
4,770
6,930
7,920
7,650
8,320
7,440
7,120
7,960
Baa in above 6,000 foot eleva tion(H»)
(percent)
46.0
72.0
64.0
53.0
39.0
100.0
100.0
100.0
99.0
99.0
94.0
96.0
91 .0
83.0
83.0
97.0
91.0
97.0
80.0
31.0
80.0
.0
70.7
99.0
100.0
99.0
98.0
87.0
95.0
Mean Janu ary temper- Mean ature chan- (JAH~) nel (degrees length Fahren- (L)heit)
4
8
8
6
7
1
0
3
4
4
4
3
6
6
1
4
2
4
5
2
4
13
14
2
2
4
12
12
12
(miles)
22.6
2.30
7.10
24.7
39.8
37.0
57.8
3.10
18.7
23.1
42.0
34.7
39.5
9.80
78.2
13.0
113
12.8
13.8
5.60
31.3
4.00
20.6
38.9
62.8
16.0
11.7
3.70
59.5
24- hour pre-
Mean cipi- chan- tation nel inten- slope sity (s) (124)
(feet (inches) per per
mile)
23.7
1,560
283
36.4
12.7
16.6
'4.60
592
95.0
75.2
46.0
36.5
53.3
263
35.5
144
15.4
207
197
317
66.0
233
130
34.2
21 .2
138
205
970
16.8
hour)
2.0
2.1
2.1
2.2
2.0
1.3
1 .4
1.2
1.7
1.6
1.3
1.4
1.3
1.3
1.3
1.4
1.4
1.5
1.6
1.2
1.5
1.2
1.3
1.4
1.3
1.5
1.7
1.8
1.6Gateway, Mont.
42

Table 3.--Basin characteristics at selected gaging stations--Continued
Station No.
06046500
06046700
06047000
06048000
06048500
06050000
06052500
06055500
06056200
06056300
06056600
06058700
06061500
06061800
06061900
06062500
06063000
06068500
06071000
06071200
06071400
06071600
06073000
06073500
06075600
06076000
06076700
06076800
06077000
06077500
06077700
Station name
Rocky Creek nr Bozeman, Mont.
Pitcher Creek nr Bozeman, Mont.
Bear Canyon nr Bozeman. Mont.
East Gallatin River at Bozeman,Mont.
Bridger Creek nr Bozeman, Mont.
Hyalite Creek at Hyalite Ranger Station, nr Bozeman, Mont.
Gallatin River at Logan, Mont.
Crow Creek nr Radersburg, Mont.
Castle Creek trib. nr Ringling,Mont.
Cabin Creek nr Towns end, Mont.
Deep Creek bl North Fork Deep Creek, nr Townsend, Mont.
MitcheLl GuLch nr East Helena,Mont.
Prickly Pear Creek nr Clancy, Mont.
Crystal Creek nr East Helena, Mont.
McClellan Creek at City Diversion Dam, nr EastHelena, Mont.
Tenmile Creek nr Rimini, Mont.
Temnile Creek nr Helena, Mont.
Little Prickly Pear Creek nr Marysville, Mont.
Little Prickly Pear Creek nr Canyon Creek, Mont.
Lyons Creek nr Wolf Creek, Mont.
Dog Creek nr Craig, Mont.
Wegner Creek at Craig, Mont.
Dearborn River nr demons.Mont.
Dearborn River nr Craig, Mont.
Fivemile Creek nr White Sulphur Springs, Mont.
Newland Creek nr White Sulphur Springs, Mont.
Sheep Creek nr Neihart, Mont.
Nuggett Creek nr Neihart, Mont.
Sheep Creek nr White Sulphur Springs, Mont.
Smith River nr Eden, Mont.
Smith River trib. nr Eden,
Mean basin e leva-
Drain- Mean tion age annual (E)
area precipi- Forest (feet (A) tation cover above
(square (p) (r) sea miles) (inches) (percent) level)
49.0
2.33
17.0
148
62.5
48.2
1,795
78.0
2.59
12.6
87.7
8.09
192
3.77
33.2
32.7
102
44.4
183
29.4
15.9
35.0
123
325
6.00
6.74
5.22
1.48
54.4
1 ,594
1.44
21
21
28
26
33
36
27
25
22
26
24
15
19
19
19
24
20
12
23
27
13
17
37
28
19
25
29
29
30
23
15
62.4
50.0
88.5
65.0
73.9
87.8
60.3
89.5
.0
76.0
75.0
45.0
83.5
100.0
96.0
97.3
75.4
97.1
70.0
77.0
4.0
68.0
91.3
55.0
33.0
97.0
82.0
93.0
95.5
43.3
.0
6,110
5,680
6,690
6,210
6,540
7,710
6.820
6,980
6,380
6,990
6,170
5,000
5,660
5,830
5,980
6,580
5,600
5,900
5,840
5,270
4,090
4,610
6,230
5,330
5,980
6,380
7,210
7,190
6,910
5,840
3,840
Basin above 6,000 foot eleva tion (*E)
(percent)
55.0
15.0
92.0
51.0
62.0
97.0
64.0
86.0
80.0
44.0
61.0
12.0
34.0
38.9
47.0
86.2
39.5
55.0
43.0
13.0
.0
3.0
76.0
31.0
45.0
81 .0
99.0
99.0
94.0
35.6
.0
Mean Janu ary temper- Mean ature chan- (JAW) nel (degrees Length Fahren- (L) heit) (miles)
8
8
8
8
8
8
9
4
5
5
0
5
5
4
6
9
8
9
8
10
12
12
0
13
9
8
8
8
8
9
10
13.2
3.10
5.80
18.7
12.3
16.0
98.7
14.9
2.96
6.30
14.2
6.40
20.8
2.90
8.80
8.80
19.8
6.20
15.1
11.0
6.25
15.9
21.8
46.3
7.50
4.70
3.30
2.60
10.9
107
2.20
24- hourpre-
Mean cipi- chan- tation neL inten- slope sity(S) (134)
(feet (inches) per per
mile) hour)
96
245
256
143
91
70
37
219
302
307
131
302
157
355
212
260
135
255
83
143
84
119
33
50
121
182
281
590
85
20
255
.0
.4
.8
.8
.8
.4
.0
.7
.3
.4
.0
1.6
1.3
1.8
1.5
1.9
2.0
1.5
1.5
1.4
1.4
1.4
1.4
1.3
1.3
1.5
1.3
1.3
1.4
1.3
1.6
1.6
1 .7
2.0
1.9
1.4
1.4
2.0
1.7
1.9
1.8
1.6Mont.
43
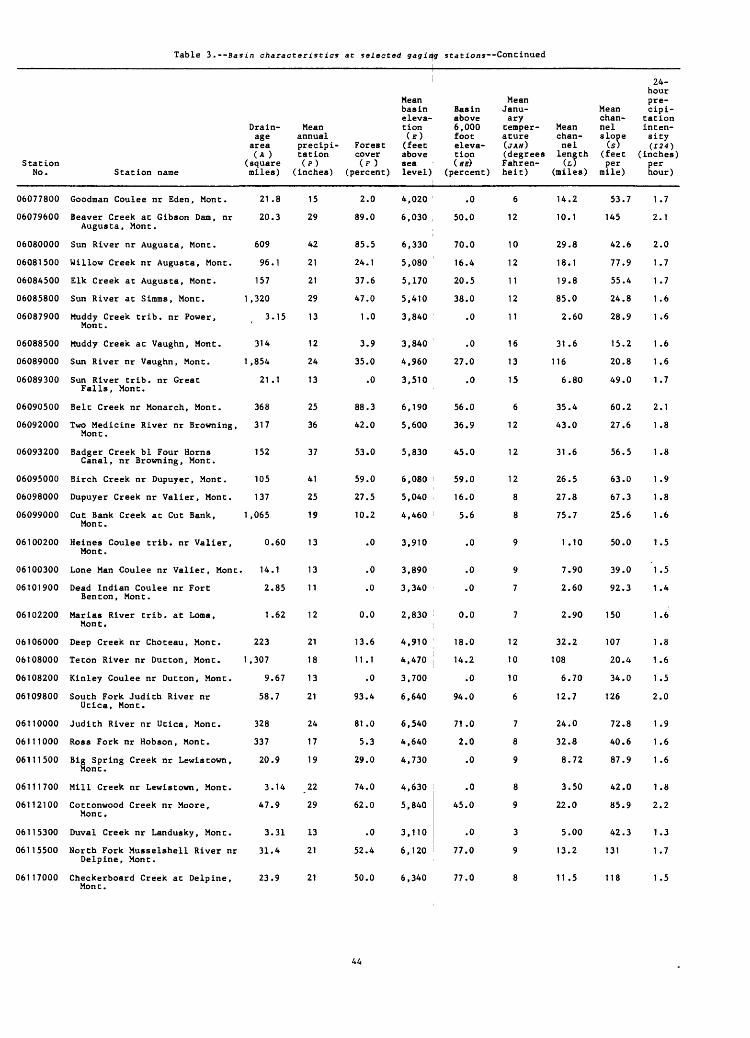
Table 3.--Basin characteristics at selected gaging stations--Continued
StationNo.
06077800
06079600
06080000
06081500
06084500
06085800
06087900
06088500
06089000
06089300
06090500
06092000
06093200
06095000
06098000
06099000
06100200
06100300
06101900
06102200
06106000
06108000
06108200
06109800
06110000
06111000
06111500
06111700
06112100
06115300
06115500
Drain age area(A )
(squareStation name
Goodman Coulee nr Eden, Mont.
Beaver Creek at Gibson Dan, nrAugusta, Mont.
Sun River nr Augusta, Mont.
Willow Creek nr Augusta, Mont.
Elk Creek at Augusta, Monc.
Sun River at Simms, Mont. 1
Muddy Creek trib. nr Power,Mont.
Muddy Creek at Vaughn, Monc.
Sun River nr Vaughn, Mont. 1
Sun River trib. nr GreatFalls, Mont.
Belt Creek nr Monarch, Mont.
Two Medicine River nr Browning,Mont.
Badger Creek bl Four HornsCanal, nr Browning, Mont.
Birch Creek nr Dupuyer, Mont.
Dupuyer Creek nr Valier, Mont.
Cut Bank Creek at Cut Bank, 1Mont.
Heines Coulee trib. nr Valier,Mont.
Lone Man Coulee nr Valier, Mont.
Dead Indian Coulee nr FortBenton, Mont.
Marias River trib. at Loma,Mont.
Deep Creek nr Choteau, Mont.
Teton River nr Dutton, Mont. 1
Kinley Coulee nr Dutton, Mont.
South Fork Judith River nrUtica, Mont.
Judith River nr Utica, Mont.
Ross Fork nr Hobson, Mont.
Big Spring Creek nr Lewis town,Mont.
Mill Creek nr Lewis town, Mont.
Cottonwood Creek nr Moore,Mont.
Duval Creek nr Landusky, Mont.
North Fork Musselshell River nr
Mean annual precipi- Forest tat ion cover (P) (?)
miles) (inches)
21.8
20.3
609
96.1
157
,320
3.15
314
,854
21.1
368
317
152
105
137
,065
0.60
14.1
2.85
1.62
223
,307
9.67
58.7
328
337
20.9
3.14
47.9
3.31
31.4
15
29
42
21
21
29
13
12
24
13
25
36
37
41
25
19
13
13
11
12
21
18
13
21
24
17
19
22
29
13
21
Mean basin eleva tion (E) (feet above sea
(percent) level)
2.0
89.0
85.5
24.1
37.6
47.0
1.0
3.9
35.0
.0
88.3
42.0
53.0
59.0
27.5
10.2
.0
.0
.0
0.0
13.6
11.1
.0
93.4
81.0
5.3
29.0
74.0
62.0
.0
52.4
4,020
6,030
6,330
5,080
5,170
5,410
3,840
3,840
4,960
3,510
6,190
5,600
5,830
6,080
5,040
4,460
3,910
3,890
3,340
2,830
4,910
4,470
3,700
6,640
6,540
4,640
4,730
4,630
5,840
3,110
6,120
Basin above 6,000 foot eleva tion (*E)
(percent)
.0
50.0
70.0
16.4
20.5
38.0
.0
.0
27.0
.0
56.0
36.9
45.0
59.0
16.0
5.6
.0
.0
.0
0.0
18.0
14.2
.0
94.0
71 .0
2.0
.0
.0
45.0
.0
77.0
Mean Janu ary temper- Mean ature chan- (JAW) nel (degrees length Fahren- (L)heit)
6
12
10
12
11
12
11
16
13
15
6
12
12
12
8
8
9
9
7
7
12
10
10
6
7
8
9
8
9
3
9
(miles)
14
10
29
18
19
85
2
31
116
6
35
43
31
26
27
75
1
7
2
2
32
108
6
12
24
32
8
3
22
5
13
.2
.1
.8
.1
.8
.0
.60
.6
.80
.4
.0
.6
.5
.8
.7
.10
.90
.60
.90
.2
.70
.7
.0
.8
.72
.50
.0
.00
.2
24- hour pre-
Mean cipi- chan- tation nel inten- slope sity (s) (Z24)
(feet (inches) per per
mile)
53.7
145
42.6
77.9
55.4
24.8
28.9
15.2
20.8
49.0
60.2
27.6
56.5
63.0
67.3
25.6
50.0
39.0
92.3
150
107
20.4
34.0
126
72.8
40.6
87.9
42.0
85.9
42.3
131
hour)
1.7
2.1
2.0
1.7
1.7
1.6
1.6
1.6
1.6
1.7
2.1
1 .8
1.8
1.9
1.8
1.6
1.5
1.5
1.4
1.6
1.8
1.6
1.5
2.0
1.9
1.6
1.6
1.8
2.2
1.3
1 .7Delpine, Mont.
06117000 Checkerboard Creek at Delpine, Mont.
23.9 21 50.0 6,340 77.0 11.5 118 1.5
44

Table 3.--Basin characteristics at selected gaging stationi--Continued
StationNo.
06118500
06129100
06129200
06132200"
06132400
06133500
06135500
06138700
06138800
06139500
06140400
06144500
06145500
06150000
06150500
06151000
06154400
06154500
06155100
06155300
06155400
06156000
06169500
06170000
06172200
06172300
06172350
06174000
06175900
06178000
Station name
South Fork Musselshell Riverab Martinsdale, Mont.
North Fork McDonald Creek trib.nr Heath, Mont.
Alkali Creek nr Heath, Mont.
South Fork Milk River nr Babb,Mont.
Dry Fork Milk River nr Bsbb,Mont.
North Fork Milk River abSt. Mary Canal, nr Browning,Mont.
Sage Creek at Q Ranch, nr WildHorse, Alberta
South Fork Spring Coulee nrHavre, Mont.
Spring Coulee nr Havre, Mont.
Big Sandy Creek nrAssinniboine, Mont.
Bullhook Creek nr Havre,Mont.
Lodge Creek at internationalboundary
Lodge Creek bl McRae Creek, atinternational boundary
Woodpi-le Coulee nrinternational boundary
East Fork Battle Creek nrinternational boundary
Lyons Creek at internationalboundary
Peoples Creek nr Hays, Mont.
Peoples Creek nr Dodson, Mont.
Black Coulee nr Malta, Mont.
Disjardin Coulee nr Malta, Mont.
Taylor Coulee nr Malta, Mont.
Whitewater Creek nrinternational boundary
Rock Creek bl Horse Creek,nr international boundary
McEachera Creek atinternational boundary
Buggy Creek nr Tampico, Mont.
Unger Creek nr Vandalia, Mont.
Mooney Coulee nr Tampico , Mont.
Willow Creek nr Glasgow, Mont.
Wolf Creek trib. No. 2 nr WolfPoint, Mont.
Middle Fork Poplar River at
Drain age
area (A)
(squaremiles)
287
2.24
3.76
68.6
17.4
61.8
175
6.47
17.8
1,805
39.6
753
818
60.2
89.5
66.7
220
670
7.03
4.84
3.89
458
328
182
105
11.1
14.3
538
6.54
362
Mean annual precipi tation(P)
(inches)
20
20
18
36
28
21
13
13
13
12
15
13
13
12
12
12
16
15
13
13
12
12
13
13
12
12
13
12
12
14
Forest cover
(* >(percent)
46.6
.0
29.6
43.9
22.0
.0
.0
.0
.0
2.0
4.0
14.0
.0
0.0
.0
.0
.0
2.7
.0
.0
.0
.0
.0
.0
.0
.0
.0
.0
.0
.0
Mean basin eleva tion
<ffi.abovesealevel)
6,110
4,750
4,570
5,470
5J30
4,850
3,200
3,100
3,090
3,200
3,220
3,480
3,490
2,950
3,000
3,000
3,570
3,500
2,550
2,470
2,530
2,820
2,870
2.830
2,770
2,560
2,410
2,400
2,470
2,950
Basin above 6,000 foot eleva tion<«) .
(percent)
60.0
.0
.0
11.7
.0
.0
.0
.0
.0
.0
.0
.0
.0
0.0
.0
.0
.0
.0
.0
.0
.0
.0
.0
.0
.0
.0
.0
.0
.0
.0
Mean Janu ary temper- Mean ature chan- (JAH) nel (degrees lengthFahrenheit)
10
8
8
8
7
8
-1
4
4
4
5
-1
-1
-1
-1
-1
3
2
1
0
0
-2
-5
-5
-4
-3
-3
0
-6
-5
(*)(miles)
23.8
1.80
4.80
16.3
12.4
13.5
34.9
4.30
9.60
73.7
12.8
70.5
71.6
22.4
19.0
20.2
46.4
74.9
6.70
4.65
4.50
36.3
43.3
26.3
26.0
11.7
12.3
40.2
6.06
39.2
24- hour pre-
Mean cipi- chan- tation nel inten- slope sity(S) (124)
(feet (inches)per
mile)
58.7
223
222
100
67
34.6
19.2
152
83.3
17.8
99.0
13.3
14.0
11.9
14.0
26.3
26.4
20.5
11 .9
57.5
74.0
18.3
12.3
20.2
35.9
51.7
33.5
12.9
72.7
15.3
perhour)
1.7
1.8
1.8
1.9
1.9
1.6
1.6
2.0
1.9
1.8
1.8
1.6
1.6
1 .6
1.6
1.6
1.7
1.7
1.6
1.6
1.6
1.6
1.6
1.6
1.7
1.8
1.8
1.8
1.7
1.7international boundary
45

Table 3.--Basin characteristics at selected gaging stations--Continued
StationNo.
06178500
06179500
06181000
06182500
06183000
06183100
06183400
06185100
06185300
06185400
06186500
06187500
06188000
06191000
06191500
06192500
06193500
06194000
06197000
06197500
06200000
06200500
06201600
06201650
06201700
06204050
Station name
East Poplar River atinternational boundary
West Fork Poplar River atinternational boundary
Poplar River nr Poplar. Mont.
Big Muddy Creek at Daleview,Mont.
Big Muddy Creek at Plentywood,Mont.
Box Elder Creek nr Plentywood,Mont.
Spring Creek at Highway 16, nrPlentywood, Mont.
Big Muddy Creek trib. nrCulbertson, Mont.
Missouri River trib. No. 4nr Culbertson, Mont.
Missouri River trib. No. 5 nrCulbertson, Mont.
Yellowstone River at Yellow-stone Lake outlet. Yellow-stone National Park
Tower Creek at Tower Falls,Yellowstone National Park
Lamar River nr Tower FallsRanger Station, YellowstoneNational Park
Gardiner River nr Mammoth,Yellowstone National Park
Yellowstone River at CorwinSprings, Mont.
Yellowstone River nrLivingston, Mont.
Shields River at Clyde Park,Mont.
Brackett Creek nr Clyde Park,Mont.
Big Timber Creek nr Big Timber,Mont.
Boulder River nr Contact, Mont.
Boulder River at Big Timber,Mont.
Sweet Grass Creek abMelville, Mont.
Bridger Creek nr Greycliff,Mont.
Work Creek nr Reed Point, Mont.
Hump Creek nr Reed Point Mont.
West Rosebud Creek nr Roscoe,
Drain age
area, (A) (square
Mean annual jrecipi- Forest cation cover (.P) (O
miles) (inches)
534
139
3,174
279
850
9.40
16.9
7.38
11.6
3.67
1,006
50.4
660
202
2,623
3,551
543
57.9
74.9
226
523
63.8
61.5
32.5
7.61
52.1
16
13
12
15
14
14
14
13
14
14
27
28
34
30
33
28
20
26
25
37
30
33
19
16
15
55
Mean basin eleva* tion (»> '
(feet above sea
(percent) level)
.0
.0
.0
.0
.0
.0
.0
.0
.0
.0
70.6
95.7
79.2
79.2
78.2
72.8
30.6
60.8
42.9
65.3
57.9
48.7
45.0
13.0
23.0
16.0
2,800
3,000
2,730
2,510
2,460
2,380
2,330
2,110
2,170
2,210
8,680
8,340
7,400
7,940
8,440
8,350
6,090
6,140
6,680
8,510
7,570
7,630
5,320
4,630
4,420
9,560
Basin above 6,000 foot eleva tion(HE)
(percent)
.0
.0
.0
.0
.0
.0
.0
.0
.0
.0
99.0
99.0
91.0
98.0
96.0
89.0
44.1
60.0
59.0
91.0
75.0
75.0
12.0
.0
.0
100.0
Mean Janu ary
temper- Mean ature chan- (JAN) nel (degrees length Fahren- (£)heit)
-5
-5
-4
-4
-4
-4
-4
-3
-3
-3
0
0
1
2
4
6
12
10
16
13
17
13
14
13
13
10
(miles)
56.4
23.2
145
35.1
77.4
4.80
10.3
5.80
6.30
3.70
68.5
12.9
42.6
.00
130
179
37.9
15.7
13.1
30.8
55.2
20.2
18.5
11.8
6.00
11.4
24- hour pre-
Mean cipi- chan- tation nel inten- slope sity(S) (124)
(feet (inches) per per
mile)
5.90
11.5
6.43
11.4
6.40
38.9
51.9
34.5
41.7
119
32.4
165
17.2
176
25.3
23.1
56.3
111
304
104
55.6
106
103
111
131
186
hour)
1.8
1.7
1.7
1.8
1.8
1.9
1.9
1.6
1.6
1.6
1.5
1.4
1.4
1.4
1.4
1.5
1.3
1.8
2.2
2.3
2.2
2.2
1.4
1.4
1.4
2.2Mont.
06204500 Rosebud Creek nr Absarokee, Mont.
394 32 29.0 7,890 66.1 12 35.9 123 2.0
46
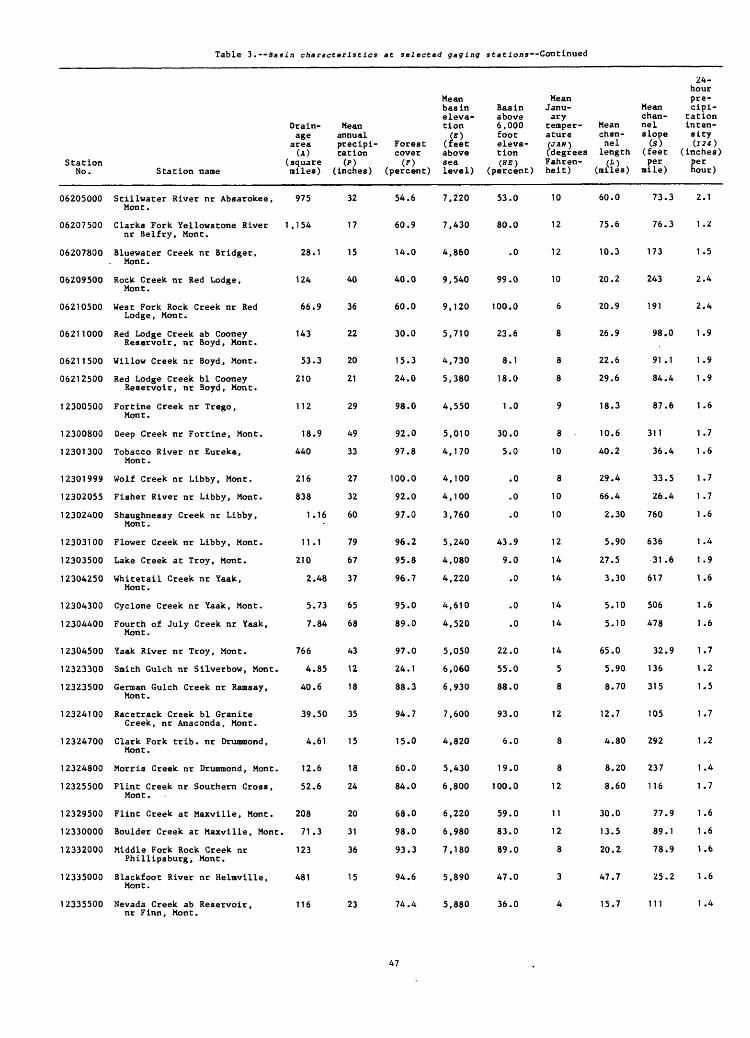
Table 3.--Basin characteristics at selected gaging stations--Continued
Drain age
area (*)
Station No.
06205000
06207500
06207800
06209500
06210500
06211000
06211500
06212500
12300500
12300800
12301300
12301999
12302055
12302400
12303100
12303500
12304250
12304300
1 2304400
12304500
12323300
12323500
12324100
12324700
12324800
12325500
12329500
12330000
12332000
12335000
12335500
Mean annual precipi- Forest tat ion cover
(square (p) Station name miles) (inches)
Stillwater River nr Absarokee,Mont.
Clarks Fork Yellowstone River 1nr Belfry, Mont.
Bluewater Creek nr Bridger,Mont.
Rock Creek nr Red Lodge,Mont.
West Fork Rock Creek nr RedLodge, Mont.
Red Lodge Creek ab CooneyReservoir, nr Boyd, Mont.
Willow Creek nr Boyd, Mont.
Red Lodge Creek bl CooneyReservoir, nr Boyd, Mont.
Fortine Creek nr Trego,Mont.
Deep Creek nr Fortine, Mont.
Tobacco River nr Eureka,Mont.
Wolf Creek nr Libby, Mont.
Fisher River nr Libby, Mont.
Shaughnessy Creek nr Libby,Mont.
Flower Creek nr Libby, Mont.
Lake Creek at Troy, MonC.
Whitetail Creek nr Yaak,Mont.
Cyclone Creek nr Yaak, Mont.
Fourth of July Creek nr Yaak,Mont.
Yaak River nr Troy, Mont.
Smith Gulch nr Silverbow, Mont.
German Gulch Creek nr Ramsay,Mont.
Racetrack Creek bl GraniteCreek, nr Anaconda, Mont.
Clark Fork trib. nr Drunnnond,Mont.
Morris Creek nr Drumnond, Mont.
Flint Creek nr Southern Cross,Mont .
Flint Creek at Maxville, Mont.
Boulder Creek at Maxville, Mont.
Middle Fork Rock Creek nrPhillipsburg, Mont.
Blackfoot River nr Helmville,Mont.
Nevada Creek ab Reservoir,
975
,154
28
124
66
143
53
210
112
18
440
216
838
1
11
210
2
5
7
766
4
40
39
4
12
.1
.9
.3
.9
.16
.1
.48
.73
.84
.85
.6
.50
.61
.6
52.6
208
71
123
481
116
.3
32
17
15
40
36
22
20
21
29
49
33
27
32
60
79
67
37
65
68
43
12
18
35
15
18
24
20
31
36
15
23
Mean basin eleva tion(*)
(feet above
(?) sea (percent) level)
54.6
60.9
14.0
40.0
60.0
30.0
15.3
24.0
98.0
92.0
97.8
100.0
92.0
97.0
96.2
95.8
96.7
95.0
89.0
97.0
24.1
88.3
94.7
15.0
60.0
84.0
68.0
98.0
93.3
94.6
74.4
7,220
7,430
4,860
9,540
9,120
5,710
4,730
5,380
4,550
5,010
4,170
4,100
4,100
3,760
5,240
4,080
4,220
4,610
4,520
5,050
6,060
6,930
7,600
4,820
5,430
6,800
6,220
6,980
7,180
5,890
5,880
Basin above 6,000 foot eleva tion(HE)
(percent)
53.0
80.0
.0
99.0
100.0
23.6
8.1
18.0
1.0
30.0
5.0
.0
.0
.0
43.9
9.0
.0
.0
.0
22.0
55.0
88.0
93.0
6.0
19.0
100.0
59.0
83.0
89.0
47.0
36.0
Mean Janu ary temper- Mean ature chsn- (JAU) nel (degrees lengthFahren- (i) heit) (miles)
10
12
12
10
6
8
8
8
9
8 .
10
8
10
10
12
14
14
14
14
14
5
8
12
8
8
12
11
12
8
3
4
60.0
75.6
10.3
20.2
20.9
26.9
22.6
29.6
18.3
10.6
40.2
29.4
66.4
2.30
5.90
27.5
3.30
5.10
5.10
65.0
5.90
8.70
12.7
4.80
8.20
8.60
30.0
13.5
20.2
47.7
15.7
24- hour pre-
Mean cipi- chan- tation nel inten- slope sity(S) (124)
(feet (inches)per
mile)
73.3
76.3
173
243
191
98.0
91 .1
84.4
87.6
311
36.4
33.5
26.4
760
636
31 .6
617
506
478
32.9
136
315
105
292
237
116
7.7.9
89.1
78.9
25.2
111
per hour)
2.1
1.2
1.5
2.4
2.4
1.9
1.9
1.9
1.6
1.7
1.6
1.7
1.7
1.6
1.4
1.9
1.6
1 .6
1.6
1.7
1.2
1.5
1.7
1.2
1.4
1.7
1.6
1.6
1.6
1.6
1 .4nr Finn, Mont.
47
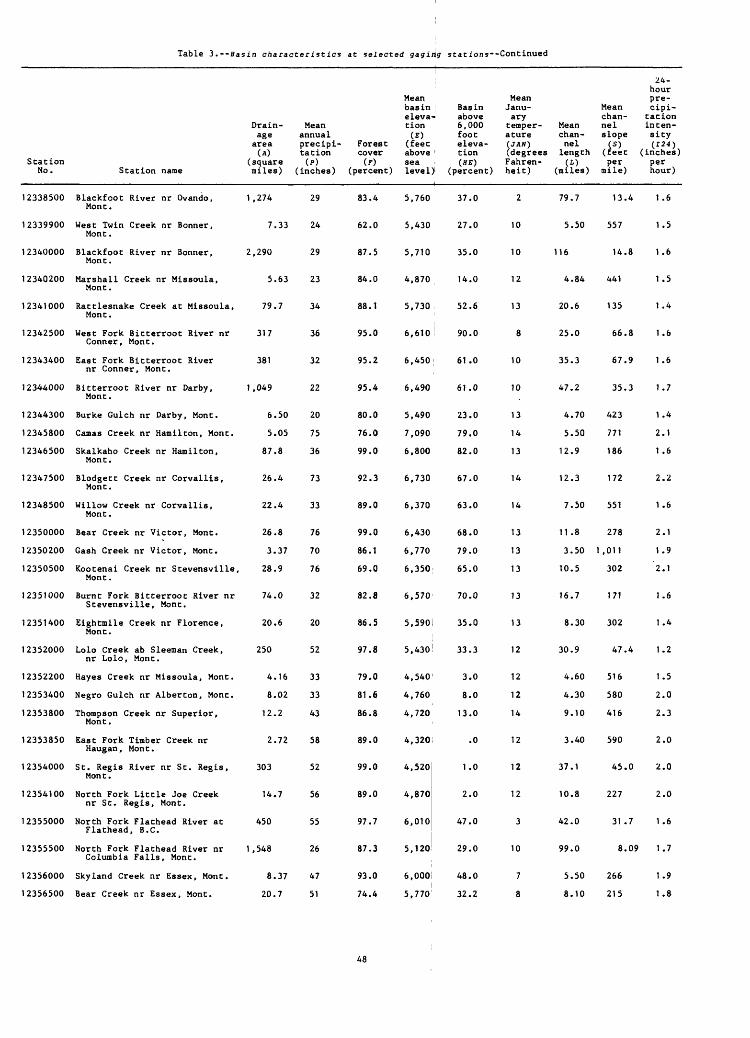
Table 3.--Basin characteristics at selected gaging stations--Continued
StationNo.
12338500
12339900
12340000
12340200
12341000
12342500
1 2343400
12344000
1 2344300
12345800
12346500
12347500
12348500
12350000
12350200
12350500
12351000
12351400
12352000
12352200
12353400
12353800
12353850
12354000
12354100
12355000
12355500
12356000
12356500
Station name
Blackfoot River nr Ovando,Mont.
West Twin Creek nr Bonner,Mont.
Blackfoot River nr Bonner,Mont.
Marshall Creek nr Missoula,Mont.
Rattlesnake Creek at Missoula,Mont.
West Fork Bitterroot River nrConner, Mont.
East Fork Bitterroot Rivernr Conner, Mont.
Bitterroot River nr Darby,Mont.
Burke Gulch nr Darby, Mont.
Carnas Creek nr Hamilton, Mont.
Skalkaho Creek nr Hamilton,Mont.
Blodgett Creek nr Corvallis,Mont.
Willow Creek nr Corvallis,Mont.
Bear Creek nr Victor, Mont.
Gash Creek nr Victor, Mont.
Kootenai Creek nr Stevensville,Mont.
Burnt Fork Bitterroot River nrStevensville, Mont.
Eightmile Creek nr Florence,Mont.
Lolo Creek ab Sleeman Creek,nr Lolo, Mont.
Hayes Creek nr Missoula, Mont.
Negro Gulch nr Alberton, Mont.
Thompson Creek nr Superior,Mont.
East Fork Timber Creek nrHaugan, Mont.
St. Regis River nr St. Regis,Mont.
North Fork Little Joe Creeknr St. Regis, Mont.
North Fork Flathead River atFlathead, B.C.
North Fork Flathead River nrColumbia Falls, Mont.
Sky land Creek nr Essex, Mont.
Bear Creek nr Essex, Mont.
Drain age area(A)
(square
Mean annual precipi- Forest tation cover (P) (F)
miles) (inches)
1 ,274
7.33
2,290
5.63
79.7
317
381
1 ,049
6.50
5.05
87.8
26.4
22.4
26.8
3.37
28.9
74.0
20.6
250
4.16
8.02
12.2
2.72
303
14.7
450
1,548
8.37
20.7
29
24
29
23
34
36
32
22
20
75
36
73
33
76
70
76
32
20
52
33
33
43
58
52
56
55
26
47
51
Mean basin ; Basin eleva- above tion 6,000 (E) foot (feet eleva- above ! tion sea (HE)
(percent) level) (percent)
83.4
62.0
87.5
84.0
88.1
95.0
95.2
95.4
80.0
76.0
99.0
92.3
89.0
99.0
86.1
69.0
82.8
86.5
97.8
79.0
81.6
86.8
89.0
99.0
89.0
97.7
87.3
93.0
74.4
5,760
5,430
5,710
4,870
5,730
6,610
6,450
6,490
5,490
7,090
6.800
6,730
6,370
6,430
6,770
6,350
6,570
37.0
27.0
35.0
14.0
52.6
90.0
61.0
61.0
23.0
79.0
82.0
67.0
63.0
68.0
79.0
65.0
70.0
5,590i 35.0
5,430
4,540
4,760
4,720
4,320
4,520
4,870
6,010
5,120
6,000
5,770
33.3
3.0
8.0
13.0
.0
1.0
2.0
47.0
29.0
48.0
32.2
Mean Janu ary temper- Mean ature chan- (JAH) nel (degrees length Fahren- (L)heit)
2
10
10
12
13
8
10
10
13
14
13
14
14
13
13
13
13
13
12
12
12
14
12
12
12
3
10
7
8
(miles)
79.7
5.50
116
4.84
20.6
25.0
35.3
47.2
4.70
5.50
12.9
12.3
7.50
11.8
3.50
10.5
16.7
8.30
30.9
4.60
4.30
9.10
3.40
37.1
10.8
42.0
99.0
5.50
8.10
24- hour pre-
Mean cipi- chan- tacion nel in ten- slope sity(S) (124)
(feet (inches) per per
mile)
13
557
14
441
135
66
67
35
423
771
186
172
551
278
1 ,011
302
171
302
47
516
580
416
590
45
227
31
8
266
215
.4
.8
.8
.9
.3
.4
.0
.7
.09
hour)
1 .6
1.5
1.6
1.5
1 .4
1.6
1.6
1.7
1 .4
2.1
1 .6
2.2
1.6
2.1
1.9
2.1
1.6
1 .4
1.2
1.5
2.0
2.3
2.0
2.0
2.0
1 .6
1.7
1.9
1.8
48

Table 3.--Basin characteristics at selected gaging stations--Contlnued
StationNo.
12357000
12357300
12357400
12359000
12359500
12360000
12360500
12361000
12361500
12362500
12363900
12364000
12365000
12366000
12367500
12370000
12370500
12370900
12371100
12374300
12375700
Drain age
area, (*> (square
Station name
Middle Fork Flathead River atEssex, Mont.
Moccasin Creek nr West Glacier,Mont.
Middle Fork Flathead River trib.at West Glacier, Mont.
South Fork Flathead River atSpotted Bear Ranger Station,nr Hungry Horse, Mont.
Spotted Bear River nr HungryHorse, Mont.
Twin Creek nr Hungry Horse,Mont.
Lower Twin Creek nr HungryHorse, Mont.
Sullivan Creek nr HungryHorse, Mont.
Graves Creek nr Hungry Horse,Mont.
South Fork Flathead River nr 1Columbia Falls, Mont.
Rock Creek nr Olney, Mont.
Logan Creek at Tally Lake, nrWhitefish, Mont.
Stillwater River nr Whitefish,Mont.
Whitefish Creek nr Kalispell,Mont.
Ashley Creek nr Kalispell,Mont.
Swan River nr Bigfork, Mont.
Dayton Creek nr Proctor, Mont.
Teepee Creek nr Poison, Mont.
Hellroaring Creek nr Poison,Mont.
Mill Creek nr Niarada, Mont.
Garden Creek nr Hot Springs,
Mean annual precipi- Forest tat ion cover(P) (F)
miles) (inches)
510
2.38
0.14
958
184
47.0
22.4
71.3
27.0
,663
3.61
183
524
170
201
671
20.9
2.55
6.22
28.2
3.29
52
57
39
52
56
53
56
35
67
37
35
28
31
37
24
23
20
52
48
27
19
Mean basin eleva tion<*)
(feet above sea
(percent) level)
87
81
76
88
91
83
68
80
94
85
88
100
97
86
78
89
94
89
90
91
94
.0
.0
.0
.8
.9
.3
.6
.0
.4
.7
.0
.0
.5
.8
.0
.8
.0
.0
.0
.0
.0
5,900
5,620
3,580
6,130
6,000
5,300
5,490
5,510
5,430
5,780
4,470
4,910
4,320
4,170
4,670
5,020
4,370
5,460
5,210
4,510
4,180
Basin above 6,000 foot eleva tion
(percent)
46.0
41.0
.0
57.0
55.5
57.0
30.4
38.0
42.0
53.0
17.0
6.0
3.0
11.0
.0
26.0
.0
45.0
37.0
7.0
.0
Mean Janu ary temper- Mean ature chan- (JAtf) nel (degrees length Fahren- (L)heit)
7
8
8
7
6
7
6
7
8
8
12
12
12
11
15
14
18
18
16
15
17
(miles)
60.0
3.00
0.60
76.5
29.8
15.4
8.90
13.0
9.00
125
3.30
20.3
50.5
36.9
25.3
84.5
6.80
4.10
5.20
8.70
3.70
24- hour pre-
Mean cipi- chan- tat ion nel inten- slope sity (s) (124)
(feet (inches) per per
mile)
36.7
1 ,610
356
25.3
64.6
121
128
124
328
13.1
846
59.1
19.8
52.3
46.4
36.3
175
900
746
254
543
hour)
1.9
1 .6
1.8
1.9
2.0
1.8
1.9
1 .9
1.9
1.9
1.6
1.7
1.7
1.6
1.8
1.7
1.7
1.8
1.8
1.8
2.0Mont.
12389500 Thompson River nr Thompson Fails, Mont.
642 41 99.0 4,710 5.0 18 48.7 21.9 1.8
49
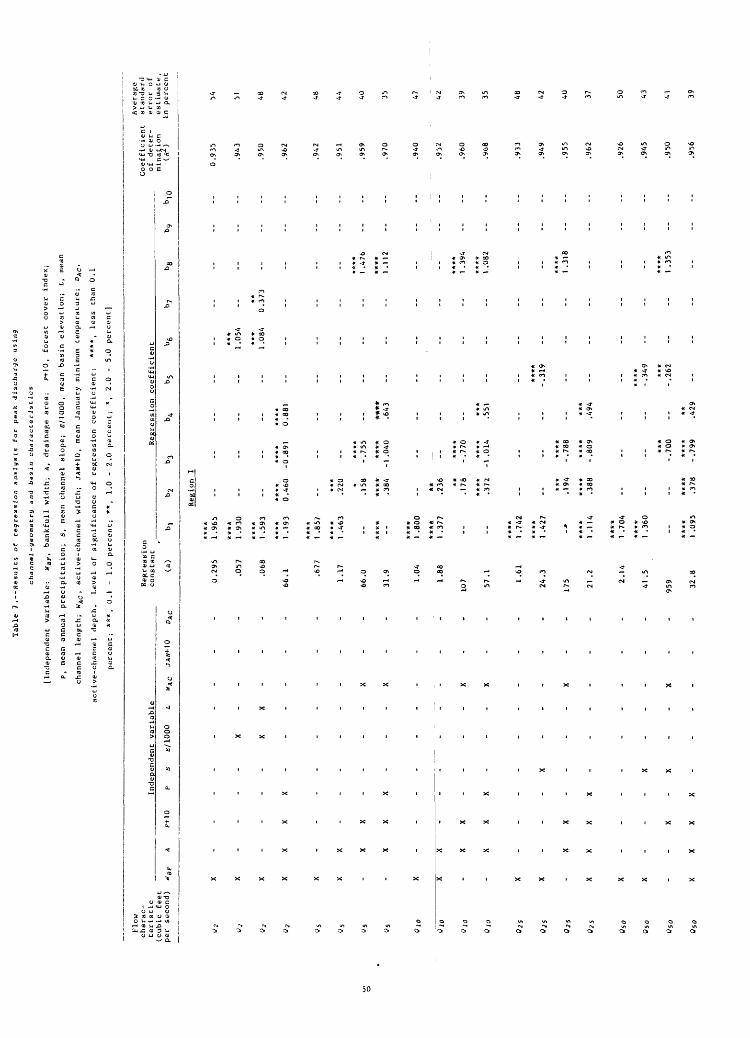
Table 7 .--Resul
Flow
charac-
teristic
(cubic feet
per
second)
[Ind
epen
dent
variable:
HBF
, bankfull width;
A, drainage area:
F+10
, forest co
ver
inde
x;
p, mean an
nual
precipitation;
s, me
an channel
slop
e; e/1000,
mean
ba
sin
elev
atio
n;
L, me
an
chan
nel
length;
UAC
, active-channel wi
dth;
JA
W+10
, me
an January minimum te
mper
atur
e;
DAC
,
active-channel depth.
Level
of significance of
regression coefficient:
****_
less th
an 0.1
perc
ent;
***
, 0.
1 -
1.0
perc
ent;
** ,
1.0
- 2.0
perc
ent;
*, 2.0
- 5.0
perc
ent]
Independent variable
F+
10
P
S
E/1
00
0
£
HA
C
JA
N+
\0
D
Regression
constant
Regression coefficient
(a)
b,
Average
Coefficient
standard
of deter-
erro
r of
mination
estimate,
(fi
) in
pe
rcen
t
Uio
025
025
025
050
050
050
X -
- -
X -
- -
X -
- -
X
X X
X
X
X XX-
XXX
X X
- -
-
X X
XXX-
X -
- -
X
XX--
X X
X X
-
X -
- -
X
X -
X
X X
X X
-
0.295
1.96
5
****
***
.057
1.93
0 --
--
--
--
1.054
.068
1.
593
--
--
--
--
1.084
0.37
3
66.1
1.
193
0.46
0 -0
.891
0.881
.677
1 .857
1.17
1 .463
.220
66.0
--
.158
-.
755
--
--
--
--
1.476
****
****
****
****
****
31.9
--
.384
-1.040
.643
--
--
--
1.112
***»
1.
04
1.80
0
****
t*
1.88
1.
377
.236
107
--
.178
-.
770
--
--
--
--
1.394
57.1
--
.372
-1.014
.551
--
--
--
1.08
2
****
1.61
1.74
2
****
**
»*
24.3
1 .4
27
--
--
--
-.31
9
175
-"
.194
-.78
8 --
--
--
--
1.318
21.2
1.
114
.388
-.
809
.494
****
2.14
1 .704
41.5
1.
360
--
--
--
-.34
9
959
--
-.70
0 --
-.26
2
--
1.35
3
32.8
1.09
5 .378
-.79
9 .4
29
0.93
5
.943
.950
.962
.942
.951
.959
.970
.940
.952
.960
.968
.933
.949
.955
.962
.926
.945
.950
54
bl
48
42 48 44 40 35 47 42 39 35 48 42 40 37 50 43 41 39

'Fl
owcharac
teristic
(cub
ic feet
per
second)
uaf
A
OlOO
X
. Oioo
x
OlOO
02
X
-
02
X
02
- X
0S
05
- X
OlO
QIO
- x
Oio
- X
02S ois
- x
Oso
050
-
X
050
- X
OlOO
OlOO
02
02
02
- X
Regr
essi
on
Independent
variable
constant
Regression coeffici
ent
**>0
f s
E/1000
L UA
C jjyHO
DJ,C
(a
) bj
b2
b3
b^
b5
b6
Reg_ion_I- -Continued
****
2.75
1.670
****
****
X -
- -
64.0
1.305
--
--
-.370
***
***
X-X --x
- -
1.43
0 --
--
-.69
8 --
-.
285
Region II
****
.153
2.10
4
****
*X
- ...
_ .
.026
2.113
--
--
.470
***
***
X -
- X
- -
.064
--
.361
--
.917
-----X--
175
- -
____--
***
***
X -
- 3.10
*X
- -
6.08
.213 ***
*X
X -
- 1.
93
--
.386
--
.445
***
X 13
.0
.271
--- --X
- -
9.53
**X
20.9
--
.249 ***
*X
X -
- 5.
17
.416
--
.242
-
Y
1 £ ^
****
X-X
- -
.771
--
--
--
--
2.068
Regi
on III
****
***
X X
- -
.195
.452
--
6.714
bj
b8
b9
--
****
1.30
3
****
1.22
1
****
1.760
****
1.02
3
****
1 &7Q
****
1.273
****
.953
****
1 .6
07
****
1.09
1
****
1 538
****
1 .064
****
.963
****
1 .478
****
1.351
****
1 .756
****
1.533
.919
Coef
fici
ent
of deter
mina
tion
b,0
(«Z
)
.917
.939
.944
.964
.972
.977
.968
.981
.968
.974
.980
.966
.976
.963
.973
.980
.943
.958
.933
.549
.949
.958
Average
standard
error
ofestimate,
in pe
rcen
t
52 45 43 44 39 34 38 30 36 33 30 36 30 35 31 28 43 38 49 43 39

Table 7.--Results of regression analysis for peak discharge using
Flow
char
ac-
Regression
teristic
Independent variable
constant
Regression coefficient
(cubic feet
per
second)
UBF
A
F+10
p s
E/1000
L UAC
jaiv+10
DAC
(a
) bj
\>
2 b-
j b^
bj
bg
Regi
on Ill Continued
QS
-X--- --x
- -
3.92
--
.320
Oio
- X
- -
4.99
Qlo -X--- --X
- -
7.13
--
.321
****
Qio
X X
X -
.778
--
.372
****
*<jlo -X--- X-X
X -
7.65
--
.389
--
--
--
-1.150
yJ5
-x--- --X
- -
13.7
--
.3
19
****
***
Wjj
X -
- -
X -
X -
- 574
--
.359
--
--
--
-2.084
Oso .....
x -
- 14
.6
0SO -----
X -
X -
- 886
........
--
-2.3
19
***
****
050
X X-X
- -
2.23
0 --
.3
64
--
--
--
-2.609
Oioo
-----
. -
X -
- 21
.2
***
QIOO
----- X-X
- -
3.01
0 -
--
--
--
--
-2.7
96
***
****
OIQO -X--- X-X
- -
7.63
0 --
.368
--
--
--
-3.0
89
Region IV
*»**
****
* ***
02
- -
X -
- -
- X
- X
.487
--
--
.632
****
****
***
05
X---X .--
- -
21.9
1.44
0 --
--
--
-.
359
b?
b8
b9
b!0
1 .5
55
1.01
1
.904
A i * *
*
.836
.7
96
--
A * * *
*
.854
.717
--
.792
****
.812
****
1.357
****
.750
****
1 .3
10
***
.697
****
***
1 .2
08
--
.848
--
Average
Coefficient
standard
of de
ter-
er
ror
of
ruination
estimate,
(R2
) in
percent
.918
.940
.949
.889
.914
.924
.931
.835
.861
.888
.786
.822
.858
.733
.780
.826
."36
.946
.964
.945
.969
48 41
J9 54
47 45 43 6J
58 52
71 65 58 79 71 63 46
42 34 35 27

Flow
char
ac
teristic
(cubic feet
per
seco
nd)
uBf
A
Oio
X
0,5
X
Regression
Independent
variable
cons
tant
f+10
p
s B/
1000
£.
UAC
jA«r
*-10
DA
C (a
)
X ...
- .
87.0
X ...
- -
391
Regression coeffici
ent
bj
b2
bj
b^
bj
bg
by
Regi
on IV
--Co
ntin
ued
****
1
443
._
****
****
1.
233
--
-.407
****
****
****
1 .0
06
--
-.459
Coef
fici
ent
of de
ter
mina
tion
ba
b9
b^
o (R
)
.967
077
.938
Average
standard
error
ofestimate,
in percent
35 24 42 30
050
(No
meaningful equations
deri
ved
using
both
channel
geom
etry
and
basi
n ch
arac
teri
stic
s)
Oioo
(No
meaningful equations
deri
ved
usin
g bo
th channel
geom
etry
and basin
char
acte
rist
ics)