Embed Size (px)
Citation preview
U.S. Department of the InteriorU.S. Geological Survey
Scientific Investigations Report 2005-5254
Prepared in cooperation with the Virginia Department of Transportation
Comparison of Peak Discharge and Runoff CharacteristicEstimates from the Rational Method to Field Observationsfor Small Basins in Central Virginia
Comparison of Peak Discharge and Runoff Characteristic Estimates from the Rational Method to Field Observations for Small Basins in Central Virginia
By Donald C. Hayes and Richard L. Young
Prepared in cooperation with the Virginia Department of Transportation
Scientific Investigations Report 2005–5254
U.S. Department of the InteriorU.S. Geological Survey
U.S. Department of the InteriorGale A. Norton, Secretary
U.S. Geological SurveyP. Patrick Leahy, Acting Director
U.S. Geological Survey, Reston, Virginia: 2006
For sale by U.S. Geological Survey, Information Services Box 25286, Denver Federal Center Denver, CO 80225
For product and ordering information: World Wide Web: http://www.usgs.gov/pubprod Telephone: 1-888-ASK-USGS
For additional information, contact: Director USGS Virginia Water Science Center 1730 E. Parham Rd. Richmond, VA 23228 [email protected]
Information about water resources in Virginia is available online at http://va.water.usgs.gov
Any use of trade, product, or firm names is for descriptive purposes only and does not imply endorsement by the U.S. Government.
Although this report is in the public domain, permission must be secured from the individual copyright owners to reproduce any copyrighted materials contained within this report.

iii
Contents
Abstract ……………………………………………………………………………………… 1Introduction …………………………………………………………………………………… 2
Purpose and Scope ……………………………………………………………………… 2Description of Study Basins …………………………………………………………… 3Runoff …………………………………………………………………………………… 3
Factors Affecting Runoff …………………………………………………………… 3Sources of Runoff ………………………………………………………………… 5
Peak Discharge Estimates from the Rational Method ………………………………………… 6Rational Method ………………………………………………………………………… 7Design Computations …………………………………………………………………… 9
Parameter Estimates from Storm Data ……………………………………………………… 9Data Collection ………………………………………………………………………… 11Time of Concentration and Runoff Coefficient Estimation ……………………………… 14Data analysis …………………………………………………………………………… 15Discharge Computations ………………………………………………………………… 17Comparison of Design Computations and Parameters Estimated From Storm Data …… 17
National Peak-Flow Data ……………………………………………………………………… 21Maximum Observed Runoff and Flood-Frequency Envelope Curves …………………… 21Data Analysis …………………………………………………………………………… 23Comparison of Design Computations and Envelope Curves …………………………… 23
Summary and Conclusions …………………………………………………………………… 25Acknowledgments …………………………………………………………………………… 26References Cited ……………………………………………………………………………… 26
Figures 1. Location of streamflow-gaging stations used in the runoff study,
central Virginia ............................................................................................................................. 42–8.Graphs showing: 2. Hypothetical intensity-duration-frequency curve ......................................................... 8 3. Hypothetical rainfall intensity and associated runoff where (A) the
storm duration is equal to the basin time of concentration (ts = tc), and (B) the storm duration is greater than the basin time of concentration (ts > tc) ...................................................................................................... 10
4. Discharge, rainfall intensity and rainfall for a 24-hour period in September 2003 at streamflow-gaging station 0204206210, Swift Creek Tributary Industrial Drainage near Wathall, Va ..................................... 13
5. Relation between peak discharge and runoff coefficient for streamflow-gaging station 0203667510, Tuckahoe Creek Tributary 1 at Route 288 near Centerville, Va ............................................................... 18

iv
6. Relation between storm duration and time of concentration determined by time to rise for streamflow-gaging station 0204243150, Beaverdam Creek Tributary at Ellerson, Va ............................................ 19
7. Relation of maximum observed peak flows and flood-frequency estimates to drainage area for 1,025 U.S. Geological Survey streamflow-gaging stations in the continental United States with drainage area less than 0.625 square miles ................................................................. 22
8. Relation of maximum observed peak flows and flood-frequency estimates to drainage area for 156 U.S. Geological Survey streamflow-gaging stations in North Carolina, Virginia, Maryland, West Virginia, eastern Tennessee, and eastern Kentucky with drainage areas less than 0.625 square miles ............................................................... 24
Tables 1. Location of study basins in central Virginia ............................................................................ 5 2. Design storm frequency adjustment factor (Cf) for
the Rational Method. ................................................................................................................. 11 3. Basin characteristics and runoff characteristics estimated by the
Virginia Department of Transportation and Chesterfield County, Va ................................ 12 4. Storm and estimated runoff characteristics for streamflow-gaging station
0203667510, Tuckahoe Creek Tributary 1 at Route 288 near Centerville, Va ...................... 30 5. Storm and estimated runoff characteristics for streamflow-gaging station
0203667525, Tuckahoe Creek Tributary 2 at Route 288 near Centerville, Va ...................... 31 6. Storm and estimated runoff characteristics for streamflow-gaging station
0203667530, Tuckahoe Creek Tributary to Tributary 3 near Centerville, Va ......................... 32 7. Storm and estimated runoff characteristics for streamflow-gaging
station 0203668010, Stony Run Tributary to Tributary at Short Pump, Va ........................... 33 8. Storm and estimated runoff characteristics for streamflow-gaging station
0203856510, Reedy Creek Industrial Drainage near Chesterfield, Va ................................. 34 9. Storm and estimated runoff characteristics for streamflow-gaging station
020406210, Swift Creek Tributary Industrial Drainage near Wathall, Va ............................ 35 10. Storm and estimated runoff characteristics for streamflow-gaging station
0204228775, Chickahominy River Tributary to Tributary at Ellerson, Va .............................. 36 11. Storm and estimated runoff characteristics for streamflow-gaging
station 0204243150, Beaverdam Creek Tributary at Ellerson, Va ......................................... 37 12. Discharge computed using the Rational Method for study basins
in central Virginia. ...................................................................................................................... 20 13. Distribution of length of record for frequency analysis of annual
peak flows at U.S. Geological Survey streamflow-gaging stations in the continental United States .............................................................................................. 23
v
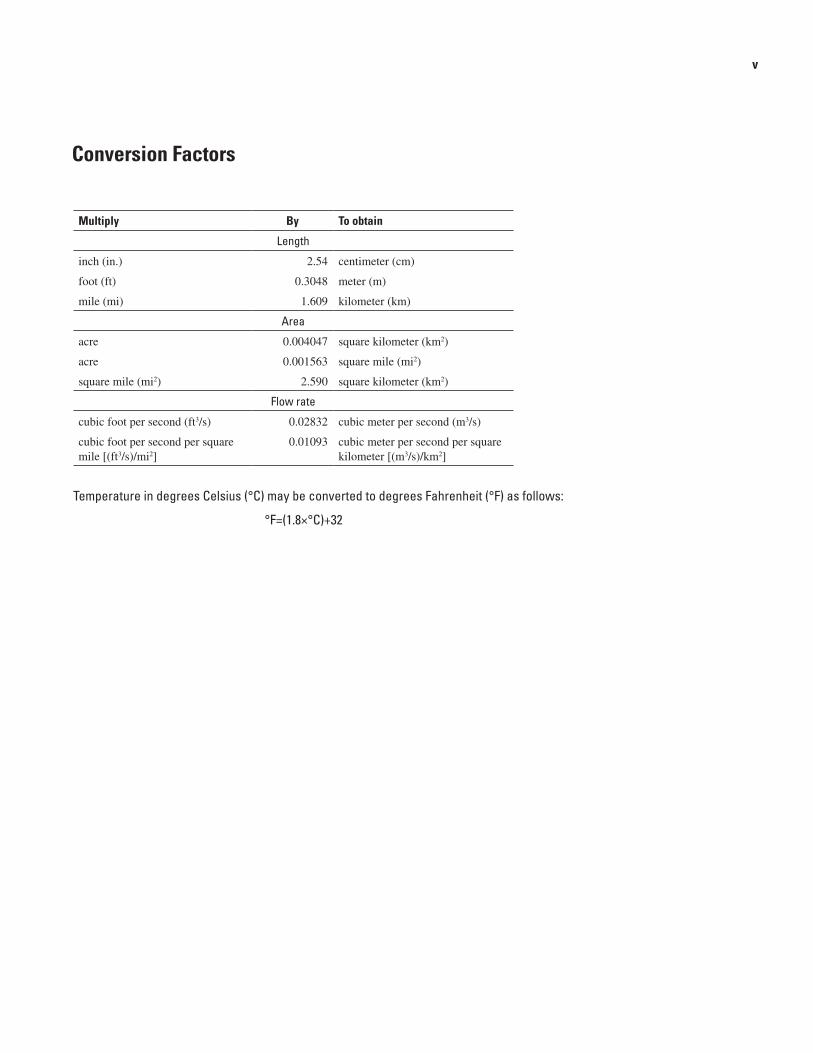
Conversion Factors
Multiply By To obtain
Length
inch (in.) 2.54 centimeter (cm)
foot (ft) 0.3048 meter (m)
mile (mi) 1.609 kilometer (km)
Area
acre 0.004047 square kilometer (km2)
acre 0.001563 square mile (mi2)
square mile (mi2) 2.590 square kilometer (km2)
Flow rate
cubic foot per second (ft3/s) 0.02832 cubic meter per second (m3/s)
cubic foot per second per square mile [(ft3/s)/mi2]
0.01093 cubic meter per second per square kilometer [(m3/s)/km2]
Temperature in degrees Celsius (°C) may be converted to degrees Fahrenheit (°F) as follows:
°F=(1.8×°C)+32

AbstractVarious types of drainage structures are necessary to
protect human life, highway settings, and the flood-plain environment from surface runoff. The design of a drainage structure requires hydrologic analysis of precipitation amount and duration, peak rate of runoff, and the time distribution of runoff from a given basin.
Many hydrologic methods are available for estimating peak flows from a basin, and no single method is applicable to all basins. The Rational Method is commonly used to estimate the design-storm peak discharge. The concepts of the Rational Method are sophisticated and considerable engineering knowl-edge is required to select representative hydrologic charac-teristics, such as time of concentration and runoff coefficient, which will result in a reliable design discharge. Validation of the Rational Method is difficult because direct measurement of some hydrologic characteristics, for example, time of concen-tration and runoff coefficient, is not easily accomplished.
Eight small basins in central Virginia ranging from 2.5 to 52.7 acres were selected for comparison of design characteris-tics to observed hydrologic data. Design estimates of drainage area, time of concentration, and runoff coefficients were used to estimate the design-storm peak discharge with the Ratio-nal Method. The basins were instrumented with monitoring devices to determine instantaneous discharge and measure discrete depths of precipitation from storms. These data were analyzed to estimate times of concentration and runoff coeffi-cients for individual storms. Times of concentration and runoff coefficients were estimated directly from hyetograph and hydrograph data and by the Rational Hydrograph Method. The Rational Hydrograph Method (RHM) is a mathematical and statistical model where in the observed hydrograph is com-pared to predicted hydrographs developed with the Rational Method using the hyetograph data and paired combinations of times of concentration and runoff coefficients.
Design estimates of time of concentration for eight study basins generally were longer than the estimates derived
directly from the observed (hyetograph and hydrograph) data, and, therefore, underestimated peak discharges and are considered less conservative. In contrast, design estimates of time of concentration generally were shorter than the estimates derived from the RHM, and, therefore, overestimate peak discharges and are considered more conservative.
Design estimates of runoff coefficient for eight study basins generally were larger than the runoff coefficients derived either by solving the rational equation for the runoff coefficient from the observed data or by the RHM, and, there-fore, overestimate peak discharges and are considered more conservative.
Design estimates of peak discharge were compared to discharges computed for each study site using the median values of the times of concentration and runoff coefficients as input values for the Rational Method. Design peak-dis-charge values at seven of the eight study basins generally were greater than the discharges computed from the median values of time of concentration and runoff coefficients determined from the storm data and are considered more conservative. However, rainfall intensities and duration measured during storms generally had less than or equal to a 2-year recurrence interval when compared to local intensity-duration-frequency curves. Only a few storms generated intensities and durations near the 10-year recurrence interval. It is expected that design peak discharges based on a 10-year recurrence interval would be greater than discharges based on data collected from higher frequency storms.
Design estimates of peak discharge for the design storm frequency and observed peak discharges and rainfall intensi-ties for eight basins in central Virginia were compared to observed peak discharges at similar-sized basins across the United States and separately to observed peak discharges at similar-sized basins in Virginia and surrounding states.
A curve drawn over the range of the maximum observed runoff for 1,025 streamflow-gaging stations from across the United States defines the upper boundary for small basins (less than 400 acres). The maximum observed runoff was 10.2 inches per hour (in./hour) for basins smaller than 256 acres.
Comparison of Peak Discharge and Runoff Characteristic Estimates from the Rational Method to Field Observations for Small Basins in Central Virginia
By Donald C. Hayes and Richard L. Young
2 Comparison of Peak Discharge and Runoff Characteristic Estimates for Small Basins in Central Virginia
The maximum observed runoff from the 122 storms analyzed at eight study basins was 3.6 in./hour, and the greatest average rainfall intensity for storms analyzed was 6.60 in./hour. Curves also were drawn over the range of flood-frequency estimates of the 10-, 25-, 50-, and 100-year peak flows for 596 stream-flow-gaging stations across the United States with 10 or more years of annual peak-flow data. The curves define the upper boundaries of flood-frequency estimates for small basins. Similar regional curves for maximum observed runoff and flood-frequency estimates were developed from records from streamflow-gaging stations in Virginia and surrounding states.
Data collected and analyzed for this study confirm the nonuniformity of precipitation in time and space, and are evi-dence for the validity of the assumption that unsteady runoff conditions are generated from varied precipitation, overland flow, and subsurface stormflow. Runoff characteristics deter-mined using different methods from multiple storms validate, to a degree, use of the Rational Method for peak-flow design computations. Further validation would require a flood-fre-quency analysis of annual peak-flow data.
IntroductionOften, extensive hydraulic analysis and design are needed
to reduce the impact of highway and bridge crossings on floodways and rivers. With any modification to existing basin drainage, there is potential for stormwater runoff to create or increase flood and water-quality problems. Many govern-ment agencies are trying to mitigate the increased runoff and diminished water quality associated with transportation infra-structure through better design of drainage structures. Deten-tion structures and channel improvements have often helped to manage runoff volume and maintain water quality. Various types of drainage structures are necessary to protect human life, highways and highway structures, adjacent structures, and the flood-plain environment from surface and subsurface water. Drainage structures are designed to convey water in a manner that is efficient, safe, and least destructive to the highway and adjacent areas (Washington State Department of Transportation, 1997).
Previous studies by the Virginia Department of Trans-portation (VDOT) and the U.S. Geological Survey (USGS) determined peak flows from rural, unregulated streams in Vir-ginia (Miller, 1978; Bisese, 1995). Regression equations were developed to estimate peak flows in the State using data from streamflow-gaging stations in Virginia and surrounding states. However, these equations were developed for basins ranging in size from 0.3 to 3,260 mi2 and are inappropriate for use on the very small (less than 200 acres) drainage basins commonly evaluated by transportation engineers in the State.
On average, Virginia’s highways contain one culvert or flow structure for every half mile of road constructed. Most of these structures drain small basins with areas less than 200 acres. The VDOT design manual (Virginia Department of
Transportation, 2002) recommends that transportation engi-neers follow several well-documented, standard engineering methods to estimate runoff volumes and peak flows from these small drainage basins. No single method for determining peak flow is applicable to all basins, however, and significantly different peak flows are calculated for a basin when using dif-ferent methods. Local codes require that the selected method be calibrated to local conditions and, if possible, verified for accuracy and reliability (Virginia Department of Transporta-tion, 2002).
VDOT (2002) recommends use of the Rational Method for estimating the design-storm peak runoff from small basins with areas up to 200 acres and for up to 300 acres in low-lying tidewater areas. The method uses an empirical equation that incorporates basin and precipitation characteristics to estimate peak discharges (Chow, 1964). The Rational Method is rela-tively simple to apply; however, its concepts are sophisticated. Considerable engineering knowledge is required to select rep-resentative hydrologic characteristics that will result in a reli-able design discharge (Virginia Department of Transportation, 2002). Validation of the Rational Method is difficult because direct measurement of some hydrologic characteristics used in the method is not easily accomplished.
Because of inconsistent results from the available hydro-logic methods in estimating peak flows from small drainage basins, a runoff study was initiated in 1997 by the USGS, in cooperation with VDOT. The study was conducted to deter-mine the reliability of methods recommended by VDOT to estimate runoff from small basins by comparison of peak-flow estimates calculated by the Rational Method to observed rain-fall intensities and peak flows at eight study basins. In addi-tion, peak-flow and basin-characteristic data from numerous small basins (about 1 to 400 acres) across the United States were analyzed to determine the maximum observed runoff and maximum runoff for the 10-, 25-, 50-, and 100-year flood frequencies for similar-sized basins. Data collected at the eight study basins in Virginia were compared to the national data set. The results of this study should be similar to results obtained by comparable studies in other areas of the country.
Purpose and Scope
The purpose of this report is to present a comparison of design estimates of time of concentration, runoff coefficient, and peak flow to observed storm data in central Virginia, and to compare the storm data to observed regional and national peak-flow data from small basins. This report describes the results of a small basin runoff study conducted from 1997 through 2004 at eight basins in central Virginia, and presents a summary of peak-flow data from more than 1,000 small basins in the continental United States. This report also presents background information on the processes that control runoff from basins with various soil, geologic, topographic, and land-use characteristics; a comparison of runoff characteris-tics (time of concentration, runoff coefficient, and peak flow)

Introduction 3
observed and estimated by various methods from storm data to runoff characteristics derived from the Rational Method; and graphs depicting maximum observed runoff and maximum runoff for the 10-, 25-, 50-, and 100-year flood frequencies.
Description of Study Basins
Many small basins in central Virginia with previous hydrologic analysis and hydraulic design were reviewed for inclusion in the study. An attempt was made to include mul-tiple land uses and various drainage area sizes in the network of basins to be studied. Factors such as site accessibility, proximity to field personnel, and capability to be instrumented with monitoring equipment also were considered in selecting the study basins. Eight small basins in central Virginia ranging from 2.5 to 52.7 acres were selected for collection of discharge and precipitation data (fig. 1, table 1). Land use for the eight study basins consists of combined road and ditch, pasture, new growth forest, residential, and industrial areas.
In addition, peak-flow data were retrieved for sites with drainage areas less than 400 acres (0.625 mi2) across the conti-nental United States from the USGS National Water Informa-tion System (NWIS) database. Maximum peak flow for the period of record was obtained for 1,025 sites, and a flood-fre-quency analysis was performed on 596 of these sites with 10 or more years of peak-flow record.
Runoff
Precipitation is the primary natural supplier of water to a basin. Runoff is that part of the precipitation that exits the basin as streamflow at a concentrated point. A hydrograph is a graphical representation of streamflow plotted with respect to time (Langbein and Iseri, 1960) and can be used to ana-lyze runoff characteristics associated with a basin and storm. The hydrograph shows the integrated effects of the physical basin characteristics and storm characteristics within the basin boundaries (Chow, 1964; Freeze, 1974), and the separation of a hydrograph in terms of time can be useful for hydrologic analysis of drainage structures.
The single most important property of the hydrograph that is essential to drainage structure design is the peak rate of runoff (Wigham, 1970). The design of a drainage structure requires the hydrologic analysis of the peak rate of runoff, the volume of runoff, and the time distribution of flow from the contributing drainage area (Virginia Department of Transpor-tation, 2002; Washington State Department of Transportation, 1997). However, the relation between the amount of rainfall over a drainage basin and the amount of runoff from the basin is complex and not well understood. The hydrologic analysis allows for estimates of runoff characteristics such as peak rate of runoff or runoff volume, but exact solutions to drainage design problems should not be expected (Virginia Department of Transportation, 2002). Errors in runoff estimates can result in either an undersized drainage structure that causes potential
hazards, inconvenience, and damage problems; or an over-sized, inefficient drainage structure.
Factors Affecting RunoffTwo broad categories of factors affect runoff: precipita-
tion characteristics and basin or watershed characteristics. Precipitation characteristics include type, duration, amount, intensity, frequency, and distribution. Basin characteristics are size, shape, topography, soils, geology, and land use (Schwab and others, 1971).
Precipitation characteristics describe the supply of water to a basin, a portion of which reaches the basin outlet as surface runoff. Amount and duration of the precipitation are the most important characteristics of a storm for hydro-logic analysis and can be combined to describe intensity and frequency of the precipitation. Distribution of precipitation in time and space is somewhat reduced in importance by analyz-ing basins with small contributing drainage areas: the smaller the basin size, the less the expected variability of precipita-tion distribution over the basin. One assumption made during the hydrologic analysis and design of hydraulic structures for small basins is that the precipitation amount is uniform across the basin in time and space. There is no single accepted basin size limit for which the uniform precipitation assumption holds true. Various agencies and investigators use maximum size limits from less than 20 acres to several square miles for their definition of small basins. VDOT’s definition of a small basin is 200 acres or less (Virginia Department of Transporta-tion, 2002).
The location of the basin outlet defines the basin bound-ary, which establishes the basin size and defines the control-ling physiographic characteristics. Basin shape, topography, and soils are controlled by the underlying lithologies and geologic structure, and weathering processes within the basin. Land use is the primary basin characteristic controlled by humans.
Generally, the basin size is the most important basin char-acteristic in determining the amount and timing of surface run-off at the outlet. The larger the basin size, the greater potential amount of precipitation that can be captured and routed to the basin outlet. Basin size primarily controls the volume of runoff past the outlet. Basin shape and topography are key basin characteristics controlling the routing of runoff to the basin outlet, and primarily control the timing of the peak, and to a lesser extent, the magnitude of the peak flow. Soil properties determine to a large degree the infiltration rate, storage, and release of the precipitation from the overburden. Soils affect the amount and type of vegetation, which also influence the infiltration rate. Land use and modifications to the natural sur-face by practices such as deforestation, mining, and farming, as well as structures such as dams, levees, bridges, channels, and pavement also can have a significant effect on the runoff from a basin (Carluer and others, 2004).

4 Comparison of Peak Discharge and Runoff Characteristic Estimates for Small Basins in Central Virginia
������������
�������
����������������
��������
����������
�������
��
��
��
�����
��
��
���
���
���
���
�����������������������������������������������������������������������������������������������������������������������������������������������������������������������������������������������������������������������������������������������������������������������������������������������
��������
����������������
����������
�����������
��������������������������������������
��� ������ ���
������
���
�
�
�� ��������
���������������
����������
��������������������
����������
����������
������������������������������
����������
Figure 1. Location of streamflow-gaging stations used in the runoff study, central Virginia.
Introduction 5
Sources of RunoffMost scientists and transportation engineers recognize
that runoff occurs in response to complex interactions between surface flow and saturated and unsaturated subsurface regimes (Freeze, 1972b). Runoff moves laterally into a stream during and after precipitation either through direct runoff or ground-water flow. Direct runoff consists of channel interception, overland flow, and subsurface stormflow. Channel interception is the capture of precipitation that falls directly on a stream channel and its flowing tributaries. Overland flow or surface runoff is the lateral inflow of precipitation to a stream that is generated when the precipitation rate exceeds the soil infiltra-tion capacity. Subsurface stormflow or interflow is the lateral inflow of precipitation through both unsaturated and saturated soil horizons above the ground-water table, and flow routed through interconnected macrochannels formed by roots and animal burrows. The portion of streamflow derived from inflow from the saturated soil below the water table that is intercepted by the stream channel is often referred to as base flow (Freeze, 1974; Dunne, 1978; Hewlett and Hibbert, 1967).
Investigators disagree about how storm and flow mecha-nisms generate runoff, and many have collected field data in which either the overland flow or the subsurface stormflow process dominates runoff generation. Forest researchers generally support subsurface stormflow as the major contribu-tor to runoff and minimize the importance of overland flow (Hewlett, 1961; Hewlett and Hibbert, 1967; Whipkey, 1965; Kirkby and Chorley, 1967; Hursh and Brater, 1941). Other researchers argue that water passes through the soil matrix too
slowly to have a large effect on the peak runoff from a basin and that overland flow dominates runoff in most instances (Horton, 1933; Betson, 1964; Dunne, 1978; Dunne and Black, 1970; Freeze, 1972a; Beasley, 1976). A brief description of the flow mechanisms follows.
Channel interception would appear to be one of the easier runoff generation mechanisms to describe because it can be equated to the amount of precipitation falling on a definable area over a specified period. However, stream channels tend to expand and contract in an indeterminate way during a storm (Hewlett and Hibbert, 1967), and precipitation intensities can vary greatly in time and space. For these reasons, runoff amounts generated by channel interception are not easily defined.
Horton (1933) developed a widely accepted theory where overland flow dominates runoff generation. When precipita-tion falls to the earth, a portion of the moisture evaporates or is intercepted by plants, litter, and soil. Initial surface detention storage must be satisfied before infiltration into the soil col-umn occurs. Infiltration rate is greatest initially, and is reduced as precipitation continues. If the precipitation rate exceeds the infiltration rate after satisfying interception requirements, the excess moisture initially forms small puddles, creating depres-sion storage. As surface depressions are filled and depth of surface detention increases, surface runoff begins. This runoff is referred to as overland flow or surface runoff (Horton, 1933) and the theory is most appropriately applied to hill slopes with low infiltration capacity and little soil depth. Horton’s theory suggests that most precipitation events exceed the infiltration capacity of the soil and that overland flow is common (Freeze,
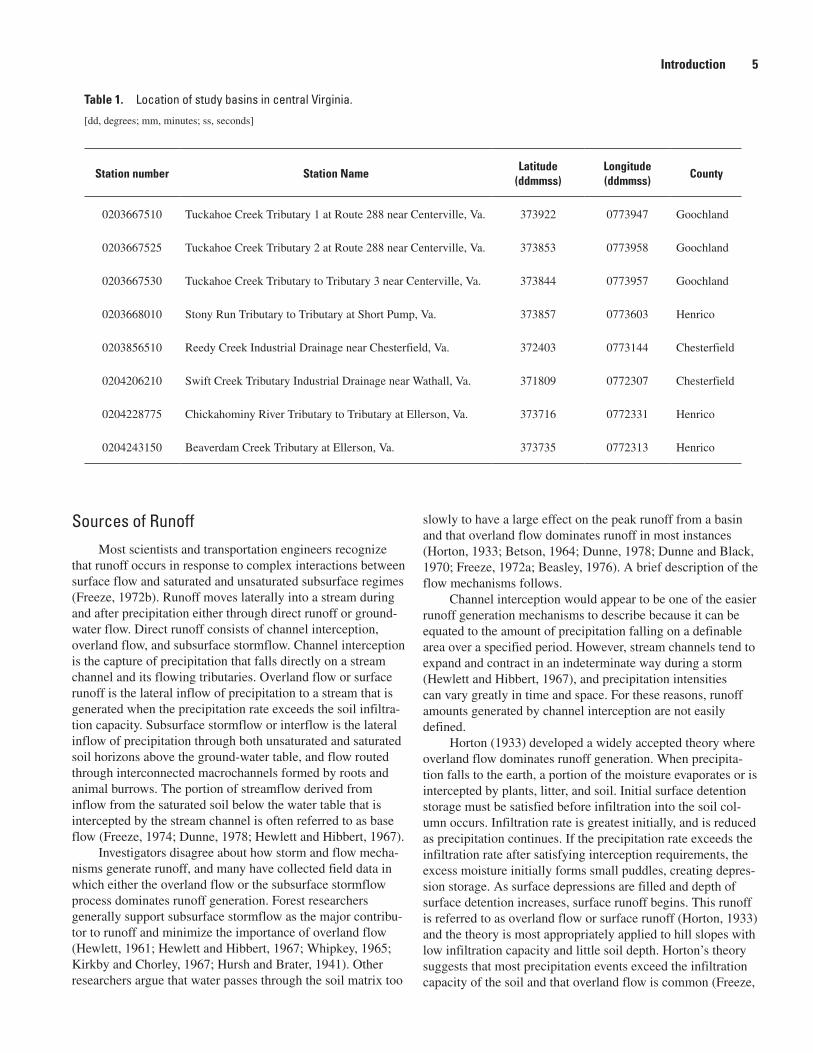
Table 1. Location of study basins in central Virginia.
[dd, degrees; mm, minutes; ss, seconds]
Station number Station NameLatitude
(ddmmss)Longitude(ddmmss)
County
0203667510 Tuckahoe Creek Tributary 1 at Route 288 near Centerville, Va. 373922 0773947 Goochland
0203667525 Tuckahoe Creek Tributary 2 at Route 288 near Centerville, Va. 373853 0773958 Goochland
0203667530 Tuckahoe Creek Tributary to Tributary 3 near Centerville, Va. 373844 0773957 Goochland
0203668010 Stony Run Tributary to Tributary at Short Pump, Va. 373857 0773603 Henrico
0203856510 Reedy Creek Industrial Drainage near Chesterfield, Va. 372403 0773144 Chesterfield
0204206210 Swift Creek Tributary Industrial Drainage near Wathall, Va. 371809 0772307 Chesterfield
0204228775 Chickahominy River Tributary to Tributary at Ellerson, Va. 373716 0772331 Henrico
0204243150 Beaverdam Creek Tributary at Ellerson, Va. 373735 0772313 Henrico

6 Comparison of Peak Discharge and Runoff Characteristic Estimates for Small Basins in Central Virginia
1972b). Freeze (1972b) refers to runoff generated according to the classic Horton model as “overland flow owing to surface saturation from above.”
Another widely held concept of runoff generation from a storm is the subsurface stormflow theory, sometimes referred to as quick flow, throughflow, or interflow. Subsur-face stormflow refers to that portion of the lateral inflow to a stream that is derived from water that infiltrates and moves through the porous soil media as either unsaturated flow or as saturated flow above the primary ground-water table (Freeze, 1974). Water entering the soil column moves both vertically and laterally downslope in the unsaturated soil matrix. When a horizontal boundary or area of reduced vertical conductivity is met, the lateral component of flow may be increased and local saturated conditions achieved. Where the saturated soil conditions exist at the base of a slope or intersection with the channel, discharge will occur. The saturated zone is supplied moisture by the unsaturated flow from upslope. When the moisture supply exceeds the lateral permeability, the vol-ume of the saturated zone increases upslope, the discharge increases along the slope base (Weyman, 1970), and saturated channel length will increase (Hewlett and Hibbert, 1967). Pie-shaped hillside segments concentrate subsurface storm-flow into saturated source areas that expand rapidly (Hewlett, 1974). These source areas—sometimes called “variable source areas” because they rapidly expand and contract the channel system, and sometimes called “partial areas” because they are more or less fixed in location and size—shorten the subsurface flow paths to the channel, increase the cross-sectional area through which subsurface flow can pass, and increase over-land flow and interception in the affected areas (Hewlett and Hibbert, 1967). Freeze (1972b) refers to runoff generated from near-channel partial areas as “overland flow owing to surface saturation from below.”
Not all migration of the subsurface stormflow must pass through the soil matrix. Interconnected macrochannels formed by roots, old root holes, animal burrows, and structural chan-nels can provide the means for rapid subsurface flow from upper slopes to stream channels (Whipkey, 1965). These chan-nels may act as flow collectors and greatly reduce the time necessary to transport water to the surface channel.
Ground-water flow is usually inconsequential to peak discharges of small basins because the channel bottoms are normally above the water table and the time delay for precipi-tation infiltration through the ground-water system and dis-charge to a stream channel is much longer than movement of direct runoff through the basin (Freeze, 1974, Dunne, 1978). However, in a perennial channel where the channel bottom is below the water table, the subsurface stormflow is indivisible from the ground-water flow (Hewlett and Hibbert, 1967).
Genereux and Hooper (1998) summarized 20 studies from Europe, North America, Australia, and New Zealand that used oxygen and hydrogen isotopes to determine the amount of “pre-event” and “event” water in the peak flow and in the runoff volume of storm runoff. Pre-event water refers to water in the basin prior to the event of interest and event water refers
to precipitation during the event of interest. The study basins were predominately forested with some grassland/pasture and ranged from 2 acres to almost 300 mi2. In almost all of the 41 sampled events, pre-event water accounted for over half and usually three-quarters of the peak flow or runoff volume. Although most of the pre-event water probably was initially in storage in the soil matrix, Genereux and Hooper caution that not all pre-event water is ground water and not all event water is overland flow. Key findings of the studies include the consistently large fraction of pre-event water in storm runoff, and that subsurface stormflow can dominate runoff generation in forested and grassland basins.
Peak Discharge Estimates from the Rational Method
According to the VDOT 2002 Drainage Manual: Drainage concerns are one of the most important aspects
of highway design and construction. Present state-of-practice formulas and models for estimating flood flows are based on statistical analyses of rainfall and runoff records and there-fore provide statistical estimates of flood flows with varying degrees of error. The recommended practice is for the designer to select appropriate hydrologic estimating procedures, and obtain runoff data where available for purposes of evaluation, calibration, and determination of the predicted value of the desired flood frequencies. Since the predicted value of the flood flows represents the designer’s best estimate, there is a chance that the true value of the flow for any flood will be greater or smaller than the predicted value (Virginia Depart-ment of Transportation, 2002).
In the hydrologic analysis for a drainage structure, many important, variable factors affect floods. The primary factors to be considered on a site-by-site basis include: precipitation type, amount, duration, intensity, frequency and distribution; basin size and physiographic characteristics; soil type; vegeta-tive cover; antecedent moisture condition; surface storage potential; and basin development potential (Virginia Depart-ment of Transportation, 2002).
The design of drainage structures in Virginia is based on a design flood frequency whereby the frequency is selected based on potential flood hazard, cost, and budget constraints. However, certain hydrologic methods contain precipitation or precipitation frequency as the basic input. It is commonly assumed that the ‘N’-year precipitation will produce the ‘N’-year peak flow; however, antecedent soil moisture and other hydrologic conditions determine whether a direct comparison between precipitation frequency and flood frequency exists. Selection of the design frequency depends upon the structure cost, amount of traffic, potential flood hazard to property, expected level of service, political considerations, and budget-ary constraints as well as the expected magnitude of damages from larger floods (Virginia Department of Transportation, 2002). In Virginia, design requirements for drainage structures

Peak Discharge Estimates from the Rational Method 7
use flood frequencies that range from 10-year for local roads to 100-year for depressed (not elevated) interstates.
Rational Method
The Rational Method is an empirical relation between rainfall intensity and peak flow that is widely accepted by hydraulic engineers; however, the origin of the method is unclear. In the United States, Kuichling (1889) was the first to mention the method in the scientific literature, yet some engineers attribute the principles of the method to Mulvaney (1851). In England, the method is often referred to as the Lloyd-Davies method, which was published in 1906 (Chow, 1964). Assumptions associated with the use of the Rational Method and seldom met under natural conditions are:
Precipitation is uniform over the entire basin,
Precipitation does not vary with time or space,
Storm duration is equal to the time of concentration,
Design storm of a specified frequency produces the design flood of the same frequency,
Basin area increases roughly in proportion to increase in length,
Time of concentration is relatively short and inde-pendent of storm intensity,
Runoff coefficient does not vary with storm intensity or antecedent soil moisture,
Runoff is dominated by overland flow, and
Basin storage effects are negligible.
The Rational Method is usually expressed in terms of the fol-lowing equation:
Q C I A= · · ·1 008. (1)
where Q is the peak flow in ft
3/s,
1.008 is unit conversion and usually neglected in hours/(acre-in.),
C is the runoff coefficient (dimensionless), I is average rainfall intensity from an intensity-dura-
tion-frequency curve for a duration equal to t
c in in./hour,
A is area in acres, t
c is time of concentration in minutes.
Time of concentration has several definitions. The mini-mum time required after runoff begins for the entire basin to contribute flow to the outlet is the definition preferred by the
1.
2.
3.
4.
5.
6.
7.
8.
9.
authors. Other definitions are the time required for a particle of water to travel from the most hydraulically distant point in the basin to the outlet (Wigham, 1970), and the time required for a flood wave to travel from the most hydraulically distant point to the outlet (National Resources Committee, 1939).
The runoff coefficient C is a dimensionless empirical coefficient related to the abstractive and diffusive proper-ties of the basin. Basin abstractions including infiltration, depression storage, evapotranspiration, and interception are lumped into the coefficient. Runoff diffusion is a measure of the attenuation of the flood peak attributable to basin runoff characteristics (Ponce, 1989). The runoff coefficient ranges between 0 and 1.0, where a value of 0 indicates that none of the rain falling on the basin generates runoff, and a value of 1.0 indicates that all of the rain falling on the basin generates runoff. A basin that has low land-surface slopes, high infiltra-tion rates, high ground-water storage, and extensive vegetation and surface storage will have a low runoff coefficient. A steep basin with an impervious surface, little vegetation, and no surface storage will have a high runoff coefficient.
The Rational Method uses a rainfall intensity to repre-sent the average intensity for a storm of a given frequency for a selected duration (Viessman and others, 1977). As noted, assumptions of the method include that the rainfall intensity is constant over the entire basin and uniform for the time of concentration. Of all the assumptions associated with the Rational Method, the assumptions of constant, uniform rainfall intensity are the least valid in a natural environment. However, the variability of rainfall intensity during a storm and over a basin becomes less as the size of the basin decreases such that these assumptions become more valid. The variability of rainfall intensity in time and space is a major reason for an upper limit on basin size when using the Rational Method to estimate peak flow.
Rainfall intensity is selected from an intensity-duration-frequency (IDF) curve generated from point rainfall data col-lected in the local area. These curves are generated by fitting annual maximum rainfall intensities for specified durations to a Gumbel-probability distribution, usually by plotting the data on extreme-value-probability paper (McKay, 1970). Figure 2 is an example of an IDF curve plotted on arithmetic paper. The rainfall intensity is estimated by transferring the basin time of concentration as duration in minutes through the desired storm frequency curve in the same manner as shown in figure 2. For example, if the hypothetical IDF curve in figure 2 is valid for the basin being analyzed and it is determined that a basin has a time of concentration of 20 minutes, then the rainfall intensity for the 25-year storm is 5.2 in./hour.
The Rational Method is based on the theory that, for a given storm frequency, the maximum runoff rate results from a rainfall intensity of duration equal to the time of concentra-tion of the particular basin. The simplicity of the equation is misleading because “the critical value of the rainfall intensity, through the medium of concentration time, entails a consider-ation of such factors as basin size, shape, and slope; channel length, shape, slope, and conditions; as well as variation in

8 Comparison of Peak Discharge and Runoff Characteristic Estimates for Small Basins in Central Virginia
��������������������� �� �� �� �� �� �� ��
�
�
�
�
�
�
�
�
�
�
��
��
��������
�������
�������
�������
������
������
���������������
����
����
�����
���
�����
����
����
����
����
�
Figure 2. Hypothetical intensity-duration-frequency (IDF) curve. Dashed lines indicate an example of determining a rainfall intensity of 5.2 inches per hour for a 25-year storm in a basin with a time of concentration of 20 minutes.

Peak Discharge Estimates from the Rational Method 9
rainfall intensity, distribution, duration, and frequency; all of which can and should be considered in determining its value” (National Resources Committee, 1939).
The relation between rainfall intensity and runoff in a hypothetical, totally impervious basin with no abstractions (C = 1.0) and where all the assumptions of the Rational Method are met is shown in figure 3. When the storm duration, t
s, is
equal to the time of concentration, tc, the peak flow occurs at
the time of concentration when the entire basin is contribut-ing to the flow at the outlet, and is equal to the product of the rainfall intensity and drainage area (fig. 3A). When t
s is greater
than tc, the peak flow occurs at the time of concentration when
the entire basin is contributing to the flow at the outlet, but continues at a constant rate for the remaining duration of the storm (fig.3B). In both scenarios, after the rainfall stops, the flow recedes to zero over a timeframe approximately equal to the time of concentration (Ponce, 1989). The average rainfall intensity for a shorter storm duration will always be greater than the average rainfall intensity for a longer storm duration. For this reason, in flood design computations, the maximum discharge is obtained when the storm duration is equal to the basin time of concentration (fig. 3A).
Design Computations
The VDOT (2002) design manual, recommends use of the Rational Method for peak-discharge design for areas up to 200 acres except in low-lying tidewater areas where the method can be used for areas up to 300 acres. The form of the Rational Equation recommended by VDOT (2002) is
Q C C I Af= · · · (2)
where Q is the peak flow in ft3/s, C
f is the design storm frequency adjustment factor
(dimensionless), C is the runoff coefficient (dimensionless), I is average rainfall intensity from an intensity-dura
tion-frequency curve for a duration equal to tc in in./hour,
A is area in acres, t
c is time of concentration in minutes.
The only difference in this form of the Rational Equa-tion and equation 1 is the inclusion of the storm frequency adjustment factor, C
f . Many investigators have concluded—in
contrast to the basic assumptions of the Rational Method—that the runoff coefficient varies with rainfall intensity and duration (Ponce, 1989; Beadles, 2002; Pilgrim and Cordery, 1993), and recommend that the runoff coefficient be adjusted for design of less frequent floods. Values for C
f are selected from table 2.
A value of 1.0 is used when the combined value of C Cf· is greater than 1.0.
Selection of the runoff coefficient requires knowledge of engineering principles and of factors that affect runoff quanti-ties (Virginia Department of Transportation, 2002). Tables are available to guide the transportation engineer in selection of a runoff coefficient for current and future land uses. A compos-ite coefficient should be determined for basins with multiple land-use types with adjustments made for the degree of basin slope.
VDOT (2002) defines time of concentration as the time required for water to flow from the hydraulically most distant point to the outlet. Determination of time of concentration consists of combining flow times for overland flow, channel flow, and conveyance flow in pipes, as appropriate, at several locations within the basin. Overland flow computations should be limited to approximately 200 ft and either the Seelye Method or Kinematic Wave Method used to compute flow times. For channel flow computations, VDOT (2002) recom-mends use of the nomograph developed by P.Z. Kirpich. No recommendations are given for determining flow time through pipes.
Average rainfall intensity is determined by applying the time of concentration and design flood frequency to an IDF curve similar to that shown in Figure 2. Minimum design crite-ria include flood frequencies of 5- or 10-year for local roads, 25-year for principal arterial roads, and 50- or 100-year for interstate highways (Virginia Department of Transportation, 2002).
Once the equation components are determined, the design flood is determined using equation 2. Two errors commonly are made when computing peak runoff from small basins. First, a portion of the basin that is highly impervious may gen-erate a greater peak runoff than would occur using the entire basin area. It may be necessary to estimate peak runoff of mul-tiple areas to determine the critical design discharge. Second, when determining the time of concentration, the overland flow path may not be perpendicular to contours shown on available maps. Land forms and grading may direct flow to ditches and streets more quickly than determined using pre-construction topography (Virginia Department of Transportation, 2002).
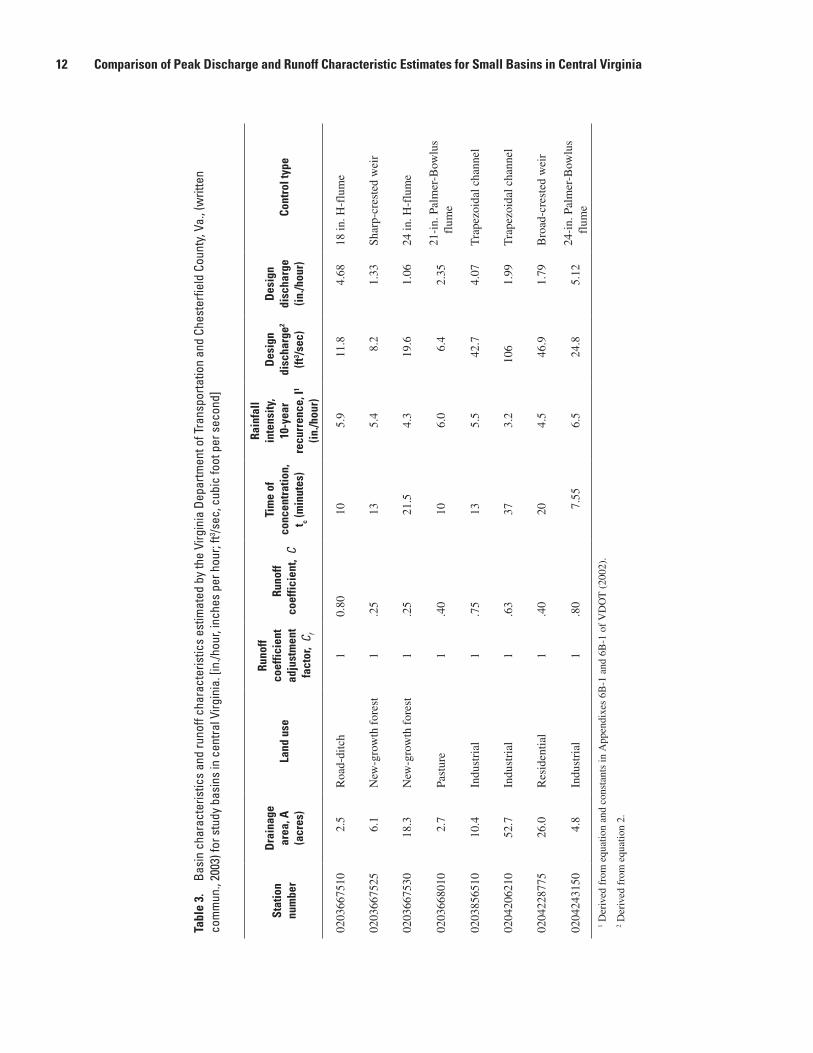
Engineers from VDOT and Chesterfield County, Va., determined design discharges for the eight basins in this study. Peak flows were initially determined for future land use. The design parameters were then modified to represent current land use and correspond to present data collection efforts. Basin characteristics and estimated runoff characteristics used in the design computations are shown in table 3. A 10-year flood frequency for local roads was used as the design crite-rion.
Parameter Estimates from Storm DataOne technique for assessing the accuracy of design peak-
discharge values is to determine parameters used in the design method from field measurements of storm, basin, and runoff

10 Comparison of Peak Discharge and Runoff Characteristic Estimates for Small Basins in Central Virginia
��
��
���
��
�������
�������
��
���
����
���
���
����
����
�����
���
����
���
���
����
�����
���
����
�� ��������������
�� ���������������������
�� ��������������
�� ���������������������
Figure 3. Hypothetical rainfall intensity and associated runoff where (A) the storm duration is equal to the basin time of concentration (ts = tc), and (B) the storm duration is greater than the basin time of concentration (ts > tc) (modified from Ponce, 1989).

Parameter Estimates from Storm Data 11
characteristics. Several investigators declare that a determin-istic analysis of individual storms to estimate storm and basin runoff coefficients is not valid primarily because it is unlikely that corresponding rainfall and runoff rates are of the same return period (French and others, 1974). More recently, how-ever, investigators have concluded that the rainfall and runoff characteristics can be determined for individual storms (Singh and Cruise, 1992; Guo, 2001). A data collection network was established in central Virginia to determine the feasibility of this procedure. To evaluate design peak discharges computed using the Rational Method, rainfall and runoff data were collected to estimate rainfall duration and intensity, time of concentration, and runoff coefficients from individual storms that occurred between June, 1998, and September, 2004.
Data Collection
Eight small basins in central Virginia ranging in size from 2.5 to 52.7 acres (0.004 to 0.082 mi2) were instrumented with streamflow and rain gages to determine instantaneous discharge and measure discrete depths of precipitation from storms. At each basin outlet, an artificial control consisting of a weir, flume, or concrete-lined channel was used in conjunc-tion with a stage measuring device to determine the discharge. Theoretical stage-discharge ratings for the flumes were checked and stage-discharge ratings were developed for the weirs and concrete-lined channels using field measurements of discharge and stage. A tipping-spoon rain gage and separate recorder were used to measure rainfall volume and calculate rainfall intensity. The rain gages were located near the basin outlet in areas where rainfall patterns would be least affected by vehicles along roadways and by nearby trees.
At all sites except for the concrete-lined trapezoidal channels, 4-in. polyvinyl chloride-pipe stilling wells were constructed and connected to the flume or open to the gage pool with 1.0-in. pipe. The stilling wells were incased in 8-in. steel well casings. At the concrete-lined trapezoidal channels, 2.0-in. open-bottom steel pipes were bolted to the channel side as modified stilling wells.
Streamflow-gages were instrumented with In-Situ, Inc., Troll 4000, vented, submersible pressure transducers with pressures adjusted for temperature changes. The transducers’ range of measurement is 15 pounds per square in. pressure or approximately 35 ft of water. The manufacturer’s stated accuracy for pressure is 0.05 percent of full range or 0.018 ft of water with a resolution of 0.001 ft of water. Accuracy for temperature is 0.1 degree Celsius. Transducers were factory calibrated when batteries were changed annually and field checked for accuracy by submersion in a known depth of water and at atmospheric pressure. The submersible pres-sure transducers were installed such that the zero point on the transducer was approximately 0.01 ft above the point of zero flow for the control to reduce the possibility of trans-ducer damage from ice. Because of rapid runoff response of the basins, the data logger read the transducer and thermister every minute. Date, time, stage, and temperature data were electronically stored only if the stage was different by 0.005 ft from the previous reading; otherwise, data were stored on the hour. Recorded peak gage heights were compared to high-water marks left by runoff in the stilling well or on the instrument. Time drift was noted when data were retrieved. The data logger reference time was reset each time the logger was accessed.
Precipitation data were collected using Pronamic Com-pany, Ltd., Rain-O-Matic, tipping-spoon rain gages. The manufacturer’s stated accuracy is +/- 2 percent with a resolu-tion of 0.5 seconds. Rain gages were calibrated a minimum of four times per year at a rate of approximately 9.5 in./hour using a NovaLynx constant head calibrator. The rain gages were operated by recording the date and time of each 0.01 in. of rainfall. Time drift could not be determined when data were retrieved. The data logger reference time was reset each time the logger was accessed.
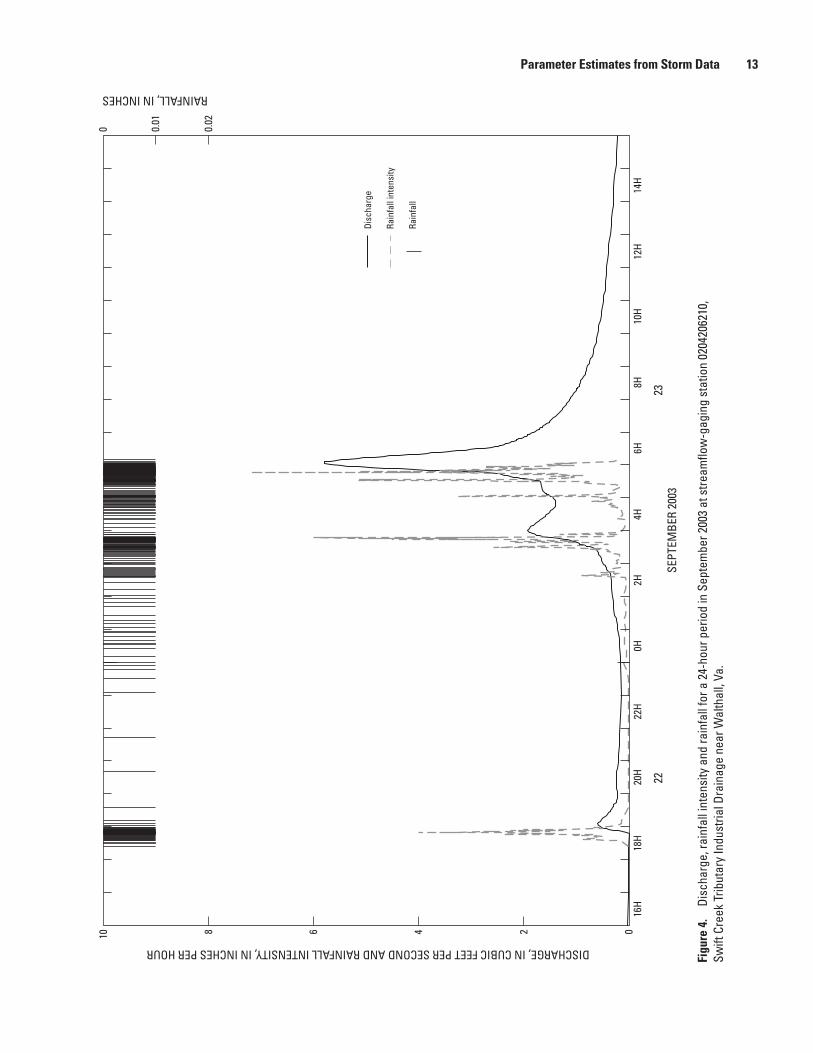
Data were retrieved from the data loggers approxi-mately every two months and stored in the USGS Automated Data Processing System (ADAPS) data base. Instantaneous discharge was computed by transferring instantaneous stage values through a stage-discharge relation. Daily precipita-tion totals were computed from the incremental rainfall data. Discharge, temperature, and rainfall data were reviewed and runoff events were flagged for further analysis. Data collected during times of freezing temperatures or from frozen precipi-tation were flagged and not analyzed further. When either the stage or precipitation data were missing, no further analysis was performed. Plots of the instantaneous discharge, rainfall, and rainfall intensity were made when daily rainfall totals were greater than 0.85 in. or when consecutive days of rainfall indicated a potential runoff event. An example plot is shown in figure 4. The plots that contained well-defined peak flows with rainfall amounts and intensities that support the peak flows were used to determine storm and runoff characteristics.
Table 2. Design storm frequency adjustment factor (Cf) for the Rational Method. [modified from Virginia Department of Transportation, 2002]
Design storm recurrence interval, in years
Cf
10 and less 1.0
25 1.1
50 1.2
100 1.25
12 Comparison of Peak Discharge and Runoff Characteristic Estimates for Small Basins in Central Virginia
Tabl
e 3.
Ba
sin
char
acte
ristic
s an
d ru
noff
char
acte
ristic
s es
timat
ed b
y th
e Vi
rgin
ia D
epar
tmen
t of T
rans
porta
tion
and
Ches
terfi
eld
Coun
ty, V
a., (
writ
ten
com
mun
., 20
03) f
or s
tudy
bas
ins
in c
entra
l Virg
inia
. [in
./hou
r, in
ches
per
hou
r; ft3 /s
ec, c
ubic
foot
per
sec
ond]
Stat
ion
num
ber
Dra
inag
e ar
ea, A
(acr
es)
Land
use
Runo
ff co
effic
ient
ad
just
men
t fa
ctor
, C f
Runo
ffco
effic
ient
, C
Tim
e of
co
ncen
trat
ion,
t c (m
inut
es)
Rain
fall
inte
nsity
,10
-yea
rre
curr
ence
, I1
(in./h
our)
Des
ign
disc
harg
e2 (ft
3 /sec
)
Des
ign
disc
harg
e (in
./hou
r)Co
ntro
l typ
e
0203
6675
102.
5R
oad-
ditc
h1
0.80
105.
911
.84.
6818
in. H
-flu
me
0203
6675
256.
1N
ew-g
row
th f
ores
t1
.25
135.
48.
21.
33Sh
arp-
cres
ted
wei
r
0203
6675
3018
.3N
ew-g
row
th f
ores
t1
.25
21.5
4.3
19.6
1.06
24 in
. H-f
lum
e
0203
6680
102.
7Pa
stur
e1
.40
106.
06.
42.
3521
-in.
Pal
mer
-Bow
lus
flum
e
0203
8565
1010
.4In
dust
rial
1.7
513
5.5
42.7
4.07
Tra
pezo
idal
cha
nnel
0204
2062
1052
.7In
dust
rial
1.6
337
3.2
106
1.99
Tra
pezo
idal
cha
nnel
0204
2287
7526
.0R
esid
entia
l1
.40
204.
546
.91.
79B
road
-cre
sted
wei
r
0204
2431
504.
8In
dust
rial
1.8
07.
556.
524
.85.
1224
-in.
Pal
mer
-Bow
lus
flum
e1 D
eriv
ed f
rom
equ
atio
n an
d co
nsta
nts
in A
ppen
dixe
s 6B
-1 a
nd 6
B-1
of
VD
OT
(20
02).
2 Der
ived
fro
m e
quat
ion
2.
Parameter Estimates from Storm Data 13
�������� ��
��
����
�������������������
������������������������������������������������������������������������������
���
���
���
���
����
����
����
���
���
�
����
����
����
����
��
����
����
�
����
�����
����
�����
����
����
Figu
re 4
. Di
scha
rge,
rain
fall
inte
nsity
and
rain
fall
for a
24-
hour
per
iod
in S
epte
mbe
r 200
3 at
stre
amflo
w-g
agin
g st
atio
n 02
0420
6210
, Sw
ift C
reek
Trib
utar
y In
dust
rial D
rain
age
near
Wal
thal
l, Va
.

14 Comparison of Peak Discharge and Runoff Characteristic Estimates for Small Basins in Central Virginia
Time of Concentration and Runoff Coefficient Estimation
Two basin runoff characteristics, time of concentration and runoff coefficient, were estimated from rainfall and runoff data using methods found in textbooks or research literature. Time of concentration was calculated several different ways from the hydrograph and hyetograph using the time to rise, end of excess precipitation to inflection point, and peak flow to inflection point. Runoff coefficients were calculated by solving for C in the Rational Equation (eq. 1) by dividing the peak flow by the drainage area and average rainfall inten-sity. In addition, the Rational Hydrograph Method was used to estimate time of concentration and runoff coefficient for nonuniform precipitation. The Rational Hydrograph Method (RHM) is a mathematical and statistical model wherein paired combinations of time of concentration and runoff coefficient are used with the recorded rainfall data to estimate discharge. The predicted and observed discharge hydrographs were compared, and through an optimization scheme, event-average runoff characteristics were determined.
Because the rain gage and stage recorders were not coupled, there were some discrepancies between recorded times that could not be resolved. Therefore, the time of the peak flow also was used as the time for the end of excess precipitation. Because of the small size of the basins and the expected short times of concentration, it was assumed that the excess precipitation ended over the entire basin at the time of the peak flow.
Time to Rise—Time of concentration was calculated as the time required for the discharge to rise from base flow to the peak flow on the discharge hydrograph. This description of the time of concentration results from an idealized basin (fig. 3) where there is no storage or delays in runoff genera-tion (Pilgrim and Cordery, 1993; Singh, 1992; Bell and Kar, 1969; Ponce, 1989). The time of concentration was computed by summing the time increment between consecutive observed discharge points that were increasing in value beginning from the high-intensity portion of the hyetograph to the peak flow. The intervals where the hydrograph was in recession prior to the peak and the time increments required to reach the previ-ous maximum discharge were not included in the total time.
End of Excess Precipitation and Peak flow to Inflection Point—Time of concentration was calculated as the time dif-ference from the end of excess precipitation on the hyetograph to the inflection point on the recession portion of the discharge hydrograph (Thomas and others, 2000; Viessman and others, 1977; Wigham, 1970). This time represents the time neces-sary for water from the most hydraulically distant point of the basin to exit the basin. Flow in the remaining portion of the recession hydrograph is considered the release of water from storage within the basin. This description of the time of con-centration assumes that the storm duration is longer than the time of concentration and that steady-state runoff conditions have been achieved when the rainfall stops.
The inflection point of the runoff hydrograph was deter-mined using two methods. In the first method, a weighted running-average discharge was computed using the three computed discharges prior to and after the computation time. The seven discharge values were multiplied by the time incre-ment between readings, totaled, and divided by the total time interval to produce a single weighted-average discharge value. This averaging technique was necessary to dampen fluctua-tions in the hydrograph. Next, the slope between consecutive weighted-average discharge data points on the hydrograph was computed. The time of the greatest negative slope between discharge data points following the peak was identified as the time of the inflection point. In the second method, the inflec-tion point was estimated visually from plots of the hydro-graphs. The time of the inflection point was determined by selecting the discharge at the inflection point on the plot and reviewing the digital data to determine the time that discharge was observed. The time of the inflection point was not read directly from the hydrograph because of the compressed time scale. It should be noted that visual selection of the inflection point from a hydrograph is subjective.
Ratio of Runoff to Rainfall—The runoff coefficient is defined as the ratio of runoff to rainfall (Pilgrim and Cordery, 1993), and lumps all of the basin and environmental abstrac-tions into one parameter (Singh and Cruise, 1992). To deter-mine the runoff coefficient for each storm, the Rational Equa-tion (eq. 1) was solved for C; the peak flow was divided by the drainage area and average rainfall intensity. The average rain-fall intensity for the storm was determined by computing the rainfall intensity between each consecutive pair of rainfall data points. The rainfall intensities closest to the time of the peak flow were reviewed for a decrease in value, usually to a value below 0.75 in./hour, with the data point prior to the decrease identified as the end of the high intensity-rainfall phase. The rainfall intensities from data collected prior to the peak were scanned in reverse time order until a decrease in rainfall inten-sity was observed, usually to a value below 0.75 in./hour, with the data point after the decrease identified as the beginning of the high-intensity rainfall phase. Single intensity values below 0.75 in./hour were ignored unless there was a substantial time difference greater than a minute between rainfall readings. The total rainfall in the high-intensity rainfall phase was divided by the time difference between the data points identified as the beginning and end of the phase to determine the average rainfall intensity. It should be noted that similar to the visual determination of the inflection point on a hydrograph, the determination of the high-intensity portion of the hyetograph that is related to the peak flow is subjective.
Modeled characteristics—Singh and Cruise (1992) and Guo (2001) developed the Rational Hydrograph Method (RHM), a mathematical and statistical model wherein the observed hydrograph is compared to predicted hydrographs developed with the Rational Method using the hyetograph data and paired combinations of times of concentration and runoff coefficients. In the RHM, only the rainfall that is accumu-lated from the present to one time of concentration in the past
Parameter Estimates from Storm Data 15
is observed at the outlet. The underlying assumption of the method is that all rainfall prior to one time of concentration in the past has already exited the basin. This assumption allows a complete runoff hydrograph to be generated from a con-tinuous, nonuniform hyetograph. Time of concentration and runoff coefficient values are selected, average rainfall intensity is computed from the hyetograph over the selected time of concentration for each observed discharge data point, and the corresponding predicted discharge is computed. The predicted discharge hydrograph is compared to the observed discharge hydrograph with an optimization scheme applied to select the event-averaged values for the time of concentration and runoff coefficient (Guo, 2001).
The observed discharge hydrograph was separated into three areas: (1) The rising portion of the hydrograph consists of the time from initiation of runoff to one time of concentra-tion after initiation of runoff when the entire basin is not yet contributing to the runoff at the outlet. This portion of the hydrograph reflects the increasing contribution of the basin area to the runoff at the outlet. (2) The peaking portion of the hydrograph consists of the time from one time of concentra-tion after initiation of runoff to the peak flow. This portion of the hydrograph reflects the entire basin contribution to the runoff at the outlet, and changes in discharge should be the result of changes in rainfall input. (3) The recession portion of the hydrograph consists of the time from the peak flow to one time of concentration after the peak when the entire basin is not contributing to the runoff at the outlet. This portion of the hydrograph reflects the downstream portion of the basin losing contribution to the runoff at the outlet, and reduction in discharge should be the result of the noncontributing area expanding from the outlet to the hydraulically most distant portion of the basin (Guo, 2001).
The peaking and recession portions of the hydrograph were analyzed. Between 1 and 35 discharge data points were selected from the hydrograph prior to the observed peak flow, depending upon the hydrograph shape and intensity, duration, and uniformity of the rainfall. A time of concentration and runoff coefficient were selected and a predicted discharge was computed for each observed discharge. The standard error between the predicted and observed data was computed; the time of concentration or runoff coefficient was incremented and the calculations re-accomplished. Computations were made where 10,208 iterations of all paired combinations of time of concentration from 5 to 120 minutes and runoff coef-ficients from 0.10 to 0.97 were used in conjunction with the recorded rainfall data to compute the discharge correspond-ing to observed discharge data. The time of concentration and runoff coefficient pair with the smallest standard error were retained as the event-averaged values. The first observed discharge value was eliminated from the data set and the computations re-accomplished. The series of computations and discharge data removal continued until no discharge values remained. Two pairs of coefficients were selected as event-averaged time of concentration and runoff coefficient. The first pair of values is the average of up to five event-aver-
aged values of time of concentration and runoff coefficient representing five or fewer observed discharge data points. The second pair of values is the event-averaged values of time of concentration and runoff coefficient representing only the observed peak data point.
Similar computations were made using the recession portion of the hydrograph except that the discharge data were selected from the hydrograph following the observed peak flow, and the elimination order of the data was from the last data point to the peak. In addition, the actual peak may not have been used if there were multiple peaks on the hydro-graph. When the recession portion of the hydrograph after the greatest peak was unusable, a later, secondary peak was often selected for computations. As expected, when the same peak was used for the peaking and recession portions of the com-putations, the event-averaged time of concentration and runoff values of each were equal; these values were not equal when different peaks were used.
Rainfall duration and intensity for each storm were reviewed. Storm data were eliminated when the storm duration was significantly less than the calculated time of concentra-tion or when the average rainfall intensity was less than 0.96 in./hour. Summary tables were generated for each of the eight study basins (tables 4-11 at end of report) containing infor-mation on each storm analyzed, computed values of times of concentration and runoff coefficients, statistical summaries of the values, and design values supplied by VDOT.
Data analysis
Estimates of the time of concentration and runoff coef-ficient (tables 4-11) are separated into two groups: estimates derived directly from the hyetograph and hydrograph, and estimates derived from the hyetograph and hydrograph through use of the RHM. The time of concentration values estimated from the hyetograph and hydrograph—the time to rise, the time from the end of excess precipitation to the inflec-tion point determined by slope, the time from the peak to the inflection point determined by slope, and the time from the peak to the inflection point determined visually (Tc1-Tc4)—tend to be similar at each site. The average and median values of time of concentration for each estimation method at each site are within a few minutes difference—except for Tc1 at streamflow-gaging station 0203667525 where the average and median values are 42 and 21 minutes, respectively, and Tc4 at streamflow-gaging station 0203667530 where the average and median values are 50 and 16 minutes, respectively. However, greater variation of values between individual storms at each site exists. The time of concentration values estimated using the slope to determine the inflection point (Tc2 and Tc3 in tables 4-11) generally were less than the values estimated by the time to rise and the peak to inflection point determined visually (Tc1 and Tc4 in tables 4-11) except for a few storms. The average and median runoff coefficient values derived directly from the storm and runoff data (Cb) were similar

16 Comparison of Peak Discharge and Runoff Characteristic Estimates for Small Basins in Central Virginia
at each site, even though some variation was observed from storm to storm. Several minimum and maximum values for both time of concentration and runoff coefficient appear to be unrealistic, such as times of concentration of 0 and 1 minute and runoff coefficients greater than 1.0.
Average and median values of time of concentration estimated through use of the RHM (Tc5, Tc6, Tc7, and Tc8 in tables 4-11) are similar at each site as a group when compared to Tc1, Tc2, Tc3, and Tc4. There are significant differences between estimates for individual storms at each site. Similar to the values generated for the time of concentration, average and median values of runoff coefficients estimated through use of the RHM (C5, C6, C7, and C8) are similar for each method at each site, yet there is significant variation between values esti-mated for individual storms at each site. In this study, the pos-sible values for time of concentration are limited to between 5 and 120 minutes, and possible values for runoff coefficient are limited to between 0.10 and 0.97. Values determined by the RHM ranged from the low boundary to the high boundary for both characteristics.
In general terms, when comparing average and median values, estimated values for time of concentration (Tc5, Tc6, Tc7, and Tc8) using the RHM were 2 to 5 times greater than the values determined directly from the hyetograph and hydrograph (Tc1, Tc2, Tc3, and Tc4). The only exception is for streamflow-gaging station 0203667510, the small basin that consists of a road and ditch land use, where the values are considered equivalent. Likewise, the estimated values for the runoff coefficient (C5, C6, C7, and C8) using the RHM were 1.3 to 2 times greater than the values determined directly from the hyetograph and hydrograph (Cb). The exceptions are for streamflow-gaging stations 0203856510 and 0204206210, two of the three industrial land-use areas, where the values are considered equivalent.
The wide variation in characteristic values (Tc1-Tc8, C5-C8) determined is probably because of antecedent moisture conditions and areal variation in rainfall amount, intensity, and duration. In addition, rarely does the rainfall cease immedi-ately at the end of a storm. Persistent lower intensity rainfall after the high-intensity portion causes the lower reaches of the basin to continue to supply runoff to the outlet, which slows the hydrograph recession and increases the calculated time of concentration.
A review of plots of the hyetographs and hydrographs revealed that steady-state conditions were never achieved, as supported by the discharge continuing to increase for the dura-tion of the rainfall. Several possible reasons for the unsteady conditions were nonuniform precipitation supply, changes in saturated surface area and subsurface stormflow, and varia-tions in basin abstractions during the storm and resulting runoff.
Because the rain gages were located at fixed points in each basin, the rainfall data collected can best be analyzed as point data with respect to time. Three rain gages were located relatively close together, and some information can be described on areal variation of precipitation. Rainfall intensity
ranged from 0.0 to 18 in./hour and seldom were two consecu-tive calculations at the same intensity. Rainfall intensities greater than 6 in./hour were rare and infrequently occurred consecutively. Rainfall intensities between 2.0 and 4.0 in./hour were common during storms, and it was not unusual for the rate to be maintained for several minutes. Most storms that caused significant runoff consisted of a continual moderate rainfall intensity of 1 to 2 in./hour with infrequent, short bursts of rainfall at a much greater intensity. Two rain gages were mounted 3 ft apart and operated independently for over four years. When data were retrieved, the two rain gage totals were always similar and considered equivalent. Another rain gage located 0.65 mi away showed similar rain patterns, but the rainfall total and intensity did not match the other rain gages as closely, and the data were not considered equivalent. The variability of precipitation in time and space is probably the major reason for unsteady runoff conditions.
Another possible cause of unsteady runoff conditions is the changes in saturation conditions at ground surface that correspond to the variable source area, partial area, and sub-surface stormflow theories of storm runoff (described under “Sources of Runoff”). Visual observations of a few basins during and after storms confirmed that some areas around the stream or in depressed areas had become saturated either because of a rising perched water table or because the rainfall rate was greater than the infiltration rate. The size or length of the saturated areas appeared to vary with antecedent moisture conditions and storm duration and intensity. Also, conditions appeared to vary with land use. Few saturated areas were observed in basins that were less impervious or had drainage improvements.
The review of plots of the hyetographs and hydrographs also revealed that the changes in runoff did not always coin-cide with changes in rainfall intensity. For example, the end of the high-intensity rainfall did not always coincide with the recession of the hydrograph, and rising hydrographs did not always coincide with an increasing rainfall rate. A partial explanation for this difference it the differences between the stage recorder and rain recorder clocks; however, the clocks were never more than a few minutes different in time. The dif-ference in timing between the rising or falling hydrograph and changes in rainfall intensity is probably primarily the result of rainfall variability in location, amount, intensity, and duration across the basins.
Three observations were made while reviewing plots of the data summary for each basin (tables 4-11). First, a positive relation exists between peak discharge and runoff coefficients at all sites except for streamflow-gaging station 0203667530, regardless of how the coefficients were determined. An increasing runoff coefficient with increasing peak discharge may indicate that basin abstractions and runoff characteris-tics vary throughout the duration of the storm. An example of the positive relation between peak discharge and runoff coefficient is shown in figure 5 for streamflow-gaging station 0203667510. This site has a very small drainage area (2.5 acres) and probably the largest percentage impervious area of
Parameter Estimates from Storm Data 17
all the study sites (approximately 30 percent). Despite the high percentage of impervious area, the plot of the data for the site shows a strong relation between peak discharge and runoff coefficient. Second, no consistent relation exists between rain-fall intensity and runoff coefficient. It is expected that the rela-tion between rainfall intensity and runoff coefficient would be similar to the relation between peak discharge and runoff coef-ficient because the peak discharge in the Rational Equation is a function of the rainfall intensity and storm duration. Third, a weak, positive relation exists between storm duration and time to rise (Tc1), where the longer duration storms usually have lower average rainfall intensities. The relation is probably a function of infiltration, antecedent soil moisture, and subsur-face stormflow previously discussed. An example of the posi-tive relation between storm duration and time to rise is shown in figure 6 for streamflow-gaging station 0204243150.
The instantaneous discharge and incremental precipita-tion data and determinations of times of concentration and runoff coefficients (tables 4-11) indicate that most of the assumptions associated with the Rational Method (listed under “Rational Method”) were not met. For example, incremental precipitation data show that the precipitation intensity varies with time, and differences in precipitation data collected at the individual rain gages indicate spatial variability within the basins (see assumptions 1 and 2). Storm durations were almost always less than the times of concentration determined by various methods (see assumption 3). Storms with similar mea-sured values of rainfall intensity and storm duration resulted in different peak discharge values (assumption 4). Time of concentration did not appear to vary with rainfall intensity; however, time of concentration did vary with storm duration, and some methods generated values much larger than values generated by other methods (assumption 6). Runoff coefficient did not appear to vary with rainfall intensity, but did vary with peak discharge, which is highly correlated with rainfall inten-sity (assumption 7). Finally, visual observations during storms did not indicate significant overland flow (assumption 8).
Discharge Computations
Discharges were computed for each site using the median values of the times of concentration and runoff coefficients in tables 4-11 as input values for the Rational Method (eq. 2). Median values of the runoff characteristics are used because the potential sample error of any individual measurement is large and there is large variability in values of runoff charac-teristics determined from individual storms at the study sites. Rainfall intensity for the 10-year recurrence interval was determined from the IDF curves for the counties in which the basins are located using the times of concentration (Tc1-Tc8) as precipitation duration (Virginia Department of Transpor-tation, 2002). Discharges computed for each site using the runoff coefficient, Cb, with times of concentrations, Tc1-Tc4, and paired combinations of times of concentration and runoff coefficients, Tc5, C5-Tc8, C8 are shown in table 12.
Comparison of Design Computations and Parameters Estimated From Storm Data
Comparison of runoff coefficients from design compu-tations and runoff coefficients determined from individual storms is difficult, partially because the return frequency of any storm generally is not the same as the design storm frequency and the frequency of an observed storm will not necessarily generate the same frequency flood. In addition, other assumptions associated with the Rational Method, such as uniform precipitation in time and space over the basin, are seldom observed. However, determination of storm and runoff coefficients from individual storms at specific study sites may indicate if the method is being used in a manner that consistently overestimates or underestimates the design flood magnitudes.
Design coefficients are compared to median values of runoff characteristics—times of concentration and runoff coef-ficients—determined from all storms. When the design esti-mate of time of concentration is less than the values obtained from observed storm data, the design value is considered more conservative. Shorter time durations will always generate greater average rainfall intensities (fig. 2) and greater design discharges (eq. 2). Also, when the design estimate of runoff coefficient is greater than the values obtained from observed storm data, the design value is considered more conservative. Greater runoff coefficients generate greater design discharges (eq. 2). When the design estimate of time of concentration is greater than the values obtained from observed storm data, or when the design estimate of runoff coefficient is less than the values obtained from observed storm data, the design value is considered less conservative.
For time of concentration, design coefficients gener-ally were greater than the median values of the estimates derived directly from the hyetograph and hydrograph (Tc1-Tc4 in tables 4-11) except for streamflow-gaging stations 0203667525 and 0203668010 where the design coefficients were less than the median values of the estimates, and for streamflow-gaging station 0203667510 where the design coef-ficient was considered similar. Design coefficients were less than the median values of the estimates derived from the hye-tograph and hydrograph through use of the RHM (Tc5-Tc8 in tables 4-11) except for streamflow-gaging station 0204206210 where the design coefficient was greater than the median value of the estimate.
For runoff coefficients, design coefficients generally were greater than the median values of observed runoff coefficients (Cb in tables 4-11) for all storms at each site. The only excep-tion is for streamflow-gaging station 0203668010 where the design coefficient and median value of the observed runoff coefficient are considered similar (0.40 and 0.35, respec-tively). Also, design coefficients generally were greater than the median values of the runoff coefficients estimated through use of the RHM (C5-C8 in tables 4-11) except for streamflow-gaging stations 0203667510, 0203667525, and 0204206210 where the design coefficients and median values of the runoff

18 Comparison of Peak Discharge and Runoff Characteristic Estimates for Small Basins in Central Virginia
����
����
����
�����
���
����
����
����
����
���
�
����
�����
�
������������������
��
��
��
��
���
���
���
���
���
���
���
���
Figu
re 5
. Re
latio
n be
twee
n pe
ak d
isch
arge
and
runo
ff co
effic
ient
for s
tream
flow
-gag
ing
stat
ion
0203
6675
10, T
ucka
hoe
Cree
k Tr
ibut
ary
1 at
Rou
te 2
88 n
ear
Cent
ervi
lle, V
a.
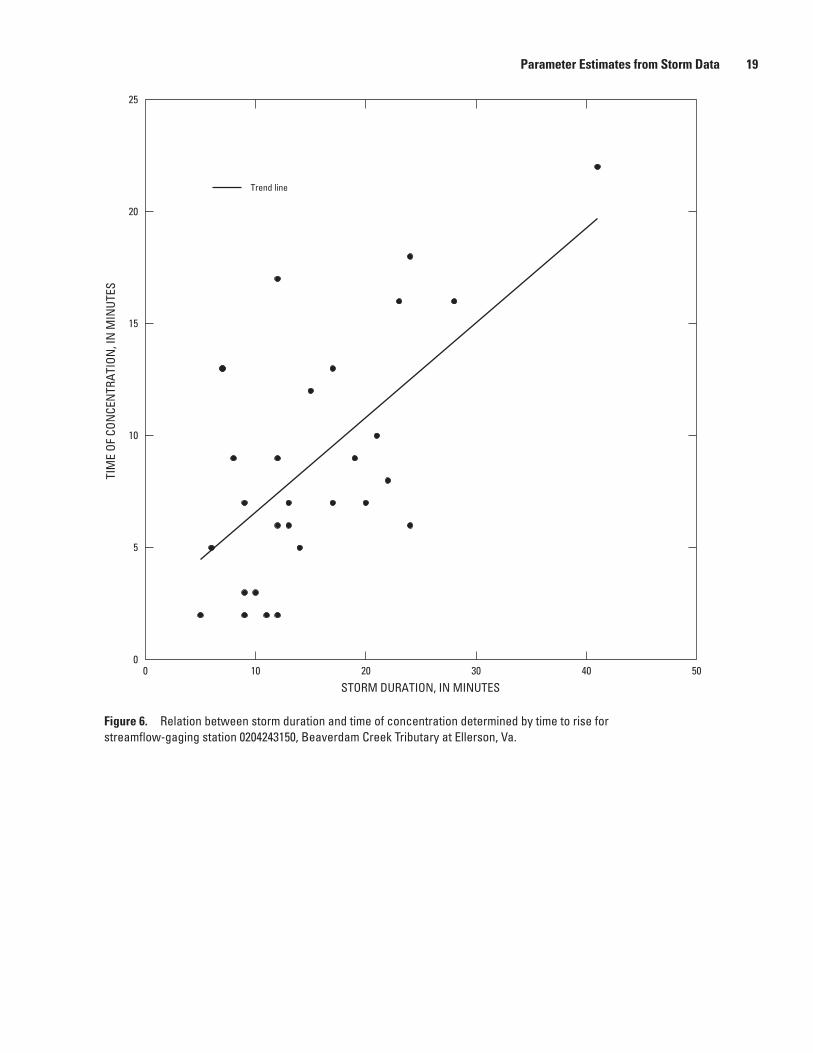
Parameter Estimates from Storm Data 19
� �� �� �� �� ���
�
��
��
��
��
��������������������������
����������
���
����
����
���
����
���
����
����
����
Figure 6. Relation between storm duration and time of concentration determined by time to rise for streamflow-gaging station 0204243150, Beaverdam Creek Tributary at Ellerson, Va.

20 Comparison of Peak Discharge and Runoff Characteristic Estimates for Small Basins in Central Virginia
Tabl
e 12
. Di
scha
rge
com
pute
d us
ing
the
Ratio
nal M
etho
d fo
r stu
dy b
asin
s in
cen
tral V
irgin
ia.
[Q(T
c1-4
, Cb,
and
Tc5
-8, C
5-8)
, dis
char
ge u
sing
med
ian
valu
e of
tim
e of
con
cent
ratio
n an
d ru
noff
coe
ffic
ient
fro
m ta
bles
4-1
1 as
inpu
t val
ues
for
the
Rat
iona
l Met
hod;
VD
OT,
Vir
gini
a D
epar
tmen
t of
Tra
nspo
rtat
ion;
ft3
/sec
, cub
ic f
eet p
er s
econ
d]
Stat
ion
num
ber
Dra
inag
e ar
ea(A
cres
)Q
(Tc1
, Cb)
Q(T
c2, C
b)Q
(Tc3
, Cb)
Q(T
c4, C
b)Q
(Tc5
, C5)
Q(T
c6, C
6)Q
(Tc7
, C7)
Q(T
c8, C
8)VD
OT
desi
gn
disc
harg
e (ft
3 /sec
)1
0203
6675
102.
57.
210
.69.
47.
49.
111
.19.
611
.711
.8
0203
6675
256.
12.
12.
62.
52.
12.
72.
82.
53.
18.
2
0203
6675
3018
.35.
811
.011
.09.
04.
35.
13.
85.
619
.6
0203
6680
102.
73.
85.
05.
33.
52.
54.
02.
73.
26.
4
0203
8565
1010
.421
.124
.924
.023
.28.
910
.29.
49.
742
.7
0204
2062
1052
.710
712
214
114
196
126
115
161
106
0204
2287
7526
.027
.338
.735
.935
.37.
17.
66.
97.
346
.9
0204
2431
504.
87.
67.
97.
97.
97.
88.
58.
38.
324
.8
1 Vir
gini
a D
epar
tmen
t of
Tra
nspo
rtat
ion,
wri
tten
com
mun
., 20
03.
National Peak-Flow Data 21
coefficients estimated through use of the RHM are considered similar.
Design estimates of time of concentration generally were less conservative than the estimates derived directly from the hyetograph and hydrograph (Tc1-Tc4) and more conservative than the estimates derived from the hyetograph and hydro-graph through use of the RHM (Tc5-Tc8). Design estimates of runoff coefficients generally were more conservative than the estimates derived directly from the storm and runoff data (Cb) and the estimates derived through use of the RHM (C5-C8).
Design peak-discharge values are more conservative (greater) than the discharges computed from the median values of time of concentration and runoff coefficient deter-mined from the storm data at all sites, with one exception. More conservative design peak-discharge values are expected because the discharges computed from the median values of Tc and C from the storm data have recurrence intervals less than 10-years. The exception is at streamflow-gaging station 0204206210 where the design peak-discharge value is less conservative than the discharge computed from the storm data. Possible reasons for this are that the basin has an efficient drainage network that may expedite runoff, the precipitation may not have been uniform across the basin because of the basin size (52.7 acres), and the precipitation duration may not have been of sufficient length that the entire basin contributed to the peak flow at the outlet.
Comparison of rainfall intensities and duration measured during storms to local IDF curves indicate that most of the storms were less than or equal to a 2-year recurrence interval. Only two storms generated intensities and durations near the 10-year recurrence interval. At streamflow-gaging station 0203667525, 1.70 in. of rainfall was measured over 20 min-utes on June 18, 2004, for a rainfall intensity of 5.10 in./hour and an observed peak discharge of 2.32 ft3/s. The 10-year frequency design rainfall intensity is 5.4 in./hour for a time of concentration of 13 minutes and a design peak discharge of 8.2 ft3/s. At streamflow-gaging station 0204243150, 0.77 in of rainfall was measured over 7 minutes on September 23, 2003, for a rainfall intensity of 6.60 in./hour and an observed peak discharge of 17.4 ft3/s. The 10-year frequency design rainfall intensity is 6.5 in./hour for a time of concentration of 7.55 minutes and a design peak discharge of 24.8 ft3/s. If the assumptions of the Rational Method are met—such as uniform precipitation over the entire basin and the design storm of a specified frequency produces the design flood of the same frequency—the design peak discharges are more conservative (greater) than the observed peak discharges. Additionally, it is expected that design peak discharges based on a 10-year recurrence interval should be more conservative (greater) than discharges based on data collected from higher frequency storms. Data collected and analyzed for this study confirm the nonuniformity of precipitation in time and space, and are evidence for the validity of unsteady runoff conditions gener-ated from varied precipitation, overland flow, and subsurface stormflow. However, runoff characteristics determined using different methods from multiple storms validate, to a degree,
use of the Rational Method for design computations. Further validation should be determined from a flood-frequency analy-sis of annual peak-flow data.
National Peak-Flow DataReliable estimates of flood magnitude and frequency are
needed to determine the hazard potential and probable effects of floods on local transportation structures and public and private infrastructure. To assist in this effort, the USGS has collected, published, and maintained a data base of annual peak-flow data; currently (2005) the data base has more than 25,000 peak-flow sites and 635,000 station-years of record. The data are available online at http://waterdata.usgs.gov/usa/nwis/peak and from the individual USGS offices that collect the data.
Maximum Observed Runoff and Flood-Frequency Envelope Curves
Annual peak-flow data were retrieved for all sites in the national data base with drainage areas less than 400 acres (0.625 mi2, or twice the maximum area the VDOT considers a small drainage basin). More than 1,200 sites met the initial size criterion. The maximum peak flow in ft3/s for each site for the period of record was determined, normalized by drain-age area, converted to runoff in units of in./hour, and plotted against drainage area in mi2. Sites in Hawaii, Puerto Rico, Guam, and the Virgin Islands were eliminated because peak rainfall intensity is much greater on these islands than in the continental United States. Sites with large runoff values per unit area were reviewed by the USGS office that collected the data, and data were either eliminated or retained on their recommendations. One site in Arkansas was eliminated even though the office was confident that the data are correct. The site has a drainage area of 0.07 mi2 and a peak flow rate of 978 ft3/s, which equates to a normalized runoff rate of 21.7 in./hour. This rate is similar to peak discharges observed on the islands of Hawaii and Puerto Rico. This review of the data resulted in a total of 1,025 sites being retained.
Curves, often referred to as envelope curves, were drawn over the range of data (maximum observed runoff and 10-, 25-, 50-, and 100-year flood-frequency estimates) on the basis of a visual inspection of the data (figs, 7 and 8). In figure 7, the curves define the upper boundary of the maximum observed peak flows since about 1900 from 1,025 streamflow-gaging stations, and the upper boundary of the 10-, 25-, 50-, and 100-year flood-frequency estimates from 596 streamflow-gaging stations. Figure 7 is similar to plots presented in Dunne (1978).
Of the final 1,025 sites, 596 sites had 10 or more years of peak-flow record. The distribution of record length for the national data set is shown in table 13. A flood-frequency analysis was performed on the data at each site by fitting a

22 Comparison of Peak Discharge and Runoff Characteristic Estimates for Small Basins in Central Virginia
���
���
���
���
���
���
���
�����
����
����
�����
����
�
����
�����
����
����
���
����
����
����
�
����
�����
����
����
����
�����
����
����
���
����
����
����
����
�����
����
�����
����
����
����
����
����
����
����
����
�����
�����
����
����
����
����
����
����
����
����
�����
�����
�����
�����
�����
����
����
�� ���
��
�������������������������������
����
���
����
�����
���
����
���
����
Figu
re 7
. Re
latio
n of
max
imum
obs
erve
d pe
ak fl
ows
and
flood
-freq
uenc
y es
timat
es to
dra
inag
e ar
ea fo
r 1,0
25 U
.S. G
eolo
gica
l Sur
vey
st
ream
flow
-gag
ing
stat
ions
in th
e co
ntin
enta
l Uni
ted
Stat
es w
ith d
rain
age
area
less
than
0.6
25 s
quar
e m
iles.
Max
imum
obs
erve
d cu
rve
defin
es u
pper
bou
ndar
y of
max
imum
obs
erve
d flo
ws
sinc
e ab
out 1
900
from
thes
e 1,
025
stre
amflo
w-g
agin
g st
atio
ns.
Floo
d-fre
quen
cy e
stim
ates
der
ived
from
sta
tistic
al a
naly
sis
of m
axim
um o
bser
ved
peak
-flow
dat
a fro
m 5
96 o
f the
1,0
25
stre
amflo
w-g
agin
g st
atio
ns w
ith 1
0 or
mor
e ye
ars
of p
eak-
flow
dat
a. C
urve
s fo
r the
10-
, 25-
, 50-
, and
100
-yea
r fre
quen
cies
de
fine
uppe
r bou
ndar
ies
of th
e 10
-, 25
-, 50
-, an
d 10
0-ye
ar fl
ood
frequ
enci
es fo
r the
596
stre
amflo
w-g
agin
g st
atio
ns.

National Peak-Flow Data 23
Pearson Type III distribution to the logarithms of the annual peak flow. Estimates were made of the peak flow at these streamflow-gaging stations for 10-, 25-, 50-, and 100-year recurrence intervals. Data were not reviewed for changes in flow regulation or for trends in the data with time. The peak-flow estimates for each recurrence interval were normalized by drainage area, converted to units of in./hour, and plotted against drainage area. Data from the Arkansas site not used for the maximum observed runoff envelope curve were included in the development of the envelope curves for the flood-fre-quency data; however, the envelope curve positions were not affected by the plotting locations of data from this site.
The same type envelope curves were developed from a subset of the national peak-flow data–regional data from North Carolina, Virginia, Maryland, West Virginia, eastern Tennes-see, and eastern Kentucky (fig. 8). Data from 156 regional sites were used to produce the maximum observed runoff envelope curve in figure 8. Data from 86 of these sites with 10 or more years of peak-flow record were used to produce the envelope curves for the 10-, 25-, 50-, and 100-year flood recurrence intervals. The distribution of record length for the regional data set of 86 sites is shown in table 13.
Because the sites retrieved from the USGS national peak-flow data base were not reviewed for effects of urbanization, it is expected that the envelope curves are representative of sites where overland flow is the dominant runoff generation mechanism. Basins where overland flow dominates runoff should have a greater peak runoff per unit area because the flow mechanisms of these basins concentrate the storm runoff at the outlet. Generally, in basins where runoff is dominated by overland flow, less water infiltrates into the soil matrix and the water moves more quickly to the outlet than in basins where runoff is dominated by subsurface stormflow (Dunne,
1978, Freeze, 1972a). The curves (figs. 7 and 8) may be used to validate design peak discharges for small basins where overland flow dominates storm runoff but should not be used to determine design peak discharges.
Data Analysis
The envelope curve in figure 7 developed from small basins across the continental United States shows a maximum observed runoff of 10.2 in./hour for the range of basins instru-mented in this study (from 2.5 to 52.7 acres). The envelope curve in figure 8 developed from basins in the nearby region documents a maximum runoff of 9.4 in./hour for the smallest study basin (2.5 acres) and 8.5 in./hour for the largest study basin (52.7 acres). The maximum observed runoff from the storms analyzed at the eight study basins was 3.6 in./hour from streamflow-gaging station 0204243150 on Septem-ber 23, 2003; this value plots well below both the national and regional envelope curves. The greatest average rainfall intensity for the storms analyzed was 6.60 in./hour for the same storm at the same location, and this value also plots well below the national or regional envelope curves. Therefore, even if there were no basin abstractions such as infiltration or evapotranspiration and all the rainfall was converted to runoff, any of the study basins with the average rainfall intensity of 6.60 in./hour for the basin time of concentration would not approach the runoff rate indicated by the envelope curves. Average rainfall intensities greater than 6.60 in./hour were observed over the study period but were not analyzed because of missing or incomplete data.
Comparison of Design Computations and Envelope Curves
The design peak discharges for the 10-year rainfall intensity frequency can be compared to the 10-year flood fre-quency envelope curve in figure 8. All eight study basins have drainage areas less than 0.1 mi2 (64.0 acres). As indicated by assigning high runoff coefficients, design engineers expect overland flow to dominate sites 0203667525, 0203856510, and 0204243150. Design peak discharges for the three sites are 4.68, 4.07, and 5.12 in./hour and all three sites have drain-age areas less than 0.02 mi2 (12.8 acres). The design peak dis-charge for all three sites plot below the 10-year annual-flood frequency envelope curve, which indicates that the design peak discharges are less conservative than the frequency data used for the envelope curve. However, the design data are within 25 percent of the values determined by the envelope curve and should be considered similar.
Table 13. Distribution of length of record for frequency analysis of annual peak flows at U.S. Geological Survey streamflow-gaging stations in the continental United States (national data set) and in North Carolina, Virginia, Maryland, West Virginia, eastern Tennessee, and eastern Kentucky (regional data set).
Years ofrecord
National data set
Regional data set
10 75 32
11-25 420 42
26-50 98 12
More than 50 3 0
Total 596 86

24 Comparison of Peak Discharge and Runoff Characteristic Estimates for Small Basins in Central Virginia
���
���
���
���
���
���
���
� �������
���
�
�������������������������������
����
���
����
�����
���
����
���
����
����
����
�����
����
�
����
�����
����
���� �
����
����
����
���
����
�����
����
����
����
�����
����
����
���
����
����
����
����
�����
����
�����
����
����
����
����
����
����
����
����
�����
�����
����
����
����
����
����
����
����
����
�����
�����
�����
�����
�����
����
����
Figu
re 8
. Re
latio
n of
max
imum
obs
erve
d pe
ak fl
ows
and
flood
-freq
uenc
y es
timat
es to
dra
inag
e ar
ea fo
r 156
U.S
. Geo
logi
cal S
urve
y st
ream
flow
-gag
ing
stat
ions
in N
orth
Car
olin
a, V
irgin
ia, M
aryl
and,
Wes
t Virg
inia
, eas
tern
Ten
ness
ee, a
nd e
aste
rn K
entu
cky
with
dr
aina
ge a
reas
less
than
0.6
25 s
quar
e m
iles.
Max
imum
obs
erve
d cu
rve
defin
es u
pper
bou
ndar
y of
max
imum
obs
erve
d flo
ws
sinc
e ab
out 1
900
from
thes
e 15
6 st
ream
flow
-gag
ing
stat
ions
. Flo
od-fr
eque
ncy
estim
ates
der
ived
from
sta
tistic
al a
naly
sis
of
max
imum
obs
erve
d pe
ak-fl
ow d
ata
from
86
of th
e 15
6 st
ream
flow
-gag
ing
stat
ions
with
10
or m
ore
year
s of
pea
k-flo
w d
ata.
Cu
rves
for t
he 1
0-, 2
5-, 5
0-, a
nd 1
00-y
ear f
requ
enci
es d
efin
e up
per b
ound
arie
s of
the
10-,
25-,
50-,
and
100-
year
floo
d fre
quen
cies
for t
he 8
6 st
ream
flow
-gag
ing
stat
ions
.

Summary and Conclusions 25
Summary and ConclusionsVirginia’s highways contain approximately one culvert or
flow structure for every half mile of road constructed. Most of these structures drain areas less than 200 acres. Transportation engineers follow several standard engineering methods to esti-mate peak flows from these small drainage basins; however, inconsistent results are obtained from the available methods. Errors in peak-flow estimates can result in potential hazards, inconvenience, and damage problems. A study was begun in 1997 by the U.S. Geological Survey (USGS), in cooperation with the Virginia Department of Transportation (VDOT), to determine the reliability of the Rational Method used to esti-mate runoff from small basins in Virginia.
The relation between the amount of rainfall over a drain-age basin and the amount of runoff from the basin is not well understood. The hydrograph shows runoff with respect to time and the most important property of the hydrograph that is essential to drainage structure design is the peak rate of runoff.
Runoff is generated through channel interception, over-land flow, subsurface stormflow, or ground-water flow and there is disagreement about the relative contributions of each to runoff. Field tests have shown that the control any individ-ual mechanism has on runoff is dependent on basin hydrogeol-ogy and storm characteristics.
VDOT (2002) recommends use of the Rational Method for estimating the design-storm peak flow from basins less than 200 acres. The method requires considerable engineering knowledge to determine a reliable design discharge. The major assumptions associated with the Rational Method, which are seldom met under natural conditions, are uniform precipitation in time and space for the duration equal to the time of concen-tration, negligible basin storage, and that the design-frequency storm produces the design flood of the same frequency. The Rational Method combines the basin abstractions, average rainfall intensity, and drainage area to estimate the peak flow with the same recurrence interval as the rainfall intensity. The runoff coefficient is associated with the abstractive and dif-fusive properties of the basin such as infiltration, storage, and evapotranspiration. The average rainfall intensity is dependent upon a frequency analysis of historic precipitation data and the time of concentration of the basin—or the time necessary for the entire basin to supply discharge to the outlet after runoff begins. The runoff coefficient and time of concentration are controlled by some of the same storm and basin characteris-tics, and therefore, are not independent.
Eight small basins in central Virginia ranging from 2.5 to 52.7 acres were instrumented with monitoring devices to determine instantaneous discharge and measure discrete depths of precipitation from storms. Land use in the basins consists of combined road and ditch, pasture, new-growth for-est, residential, and industrial areas. Rainfall and runoff data were collected and analyzed to estimate times of concentration and runoff coefficients for individual storms. Times of concen-tration and runoff coefficients were calculated directly from
data in the hyetograph and hydrograph and from the Rational Hydrograph Method (RHM), wherein paired combinations of time of concentration, runoff coefficient, and hyetograph are used to predict a runoff hydrograph.
Time of concentration was calculated from the hyeto-graph and hydrograph as the time required for the discharge hydrograph to rise from base flow to the peak flow, time from the end of the excess precipitation to the hydrograph inflec-tion point determined by slope, time from the peak flow to the hydrograph inflection point determined by slope, and time from the peak flow to the hydrograph inflection point deter-mined visually. The runoff coefficient was calculated from the hyetograph and hydrograph of each storm by dividing the peak discharge by the drainage area and average rainfall intensity.
The RHM is a mathematical model whereby runoff is generated using rainfall inputs from the computation time to one time of concentration in the past. Predicted runoff hydrographs were generated using all possible combinations of times of concentration from 5 to 120 minutes and runoff coefficients from 0.10 to 0.97 with the observed rainfall data for the peaking portion of the hydrograph, the hydrograph peak, and the recession portion of the hydrograph. The time of concentration and runoff coefficient pair with the lowest stan-dard error computed from the predicted and observed runoff hydrograph was selected as characteristic for that storm.
Design estimates of times of concentration were consid-ered less conservative than the estimates derived directly from the hyetograph and hydrograph, and more conservative than the estimates derived from the hyetograph and hydrograph through use of the RHM. Design estimates of runoff coef-ficients were considered more conservative than the estimates derived directly from the storm and runoff data and the esti-mates derived through use of the RHM.
Design peak discharges were compared to discharges computed for each basin using the median value of the times of concentration and runoff coefficient as input values for the Rational Method. Rainfall intensity for the 10-year recurrence interval was determined from intensity-duration-frequency (IDF) curves using time of concentration as precipitation dura-tion. Design peak-discharge values were more conservative (greater) than the discharges computed from the median values of time of concentration and runoff coefficient determined from the storm data at seven of the eight basins, which is expected because the discharges computed from the median of the Tc and C values from the storm data have less than 10-year recurrence intervals.
Comparison of rainfall intensities and duration measured during storms to local IDF curves indicate that most of the storms were less than or equal to a 2-year recurrence inter-val, and only a few storms were near the 10-year recurrence interval. It is expected that design peak discharges based on a 10-year recurrence interval would be more conservative (greater) than discharges based on data collected from higher frequency storms.
Design estimates of peak discharge for the design storm frequency and observed peak discharges and rainfall intensi-

26 Comparison of Peak Discharge and Runoff Characteristic Estimates for Small Basins in Central Virginia
ties for eight basins in central Virginia were compared to observed peak discharges at similar-sized basins across the United States and separately to observed peak discharges at similar-sized basins in Virginia and surrounding states. Annual peak-flow data and basin characteristics were retrieved from the USGS national stream flow data base for basins less than 400 acres across the continental United States. Period-of-record peak flows for 1,025 sites were normalized by drainage area, converted to units of in./hour, and plotted against drain-age area. An envelope curve fitted to the data depicted a maxi-mum observed runoff of 10.2 in./hour for basins smaller than 256 acres (0.40 mi2), which declined to 4.8 in./hour for basins as large as 400 acres (0.625 mi2). A flood-frequency analysis was performed on 596 of the sites that have 10 or more years of annual peak-flow data. Estimates were made of the peak flow for the 10-, 25-, 50-, and 100-year recurrence intervals and envelope curves were drawn around the data determined for each recurrence interval.
Period-of-record peak-flow data from 156 sites in North Carolina, Virginia, Maryland, West Virginia, eastern Tennes-see, and eastern Kentucky were used to develop a maximum observed runoff envelope curve for the region, and annual peak-flow data from 86 of the sites were used to produce envelope curves for the 10-, 25-, 50-, and 100-year flood recurrence intervals. The maximum observed runoff is 9.4 in./hour for the smallest basins and declines to 2.4 in./hour for basins as large as 400 acres. The regional data are a subset of the national data.
It is expected that the envelope curves are representative of sites where overland flow is the dominant runoff-genera-tion mechanism. The curves can be used only to validate design discharges, and should not be used to determine design discharges.
Researchers disagree on the reliability of determining storm and basin runoff coefficients through a deterministic analysis of individual storms. Researchers who do not consider the method valid object primarily because assumptions associ-ated with the Rational Method are seldom met. The assump-tions of uniform precipitation and negligible basin storage become less valid as the basin characteristics vary from small, impervious basins to larger rural basins. Data collected and analyzed for this study confirm the nonuniformity of precipita-tion in time and space, and also suggest that unsteady runoff conditions are generated from varied precipitation, overland flow, and subsurface stormflow. However, runoff characteris-tics determined using different methods from multiple storms validate, to a small degree, use of the Rational Method for peak-discharge design computations. Further validation could be determined from a flood-frequency analysis of annual peak-flow data.
AcknowledgmentsThe authors would like to thank the Virginia and Chester-
field County Departments of Transportation for their technical expertise and assistance in site selection and design computa-tions. David LeGrande, Assistant State Hydraulics Engineer, is gratefully acknowledged for coordinating the exchange of information and data between VDOT and the USGS. In addi-tion, the authors thank Elizabeth Ahearn and Daniel Evans of the USGS for their helpful colleague reviews.
References Cited
Beadles, S.J.P., 2002, Rational method: Southern Polytechnic State University, accessed April 23, 2002 at http://www.spsu.edu/cet/sbeadles/Hydrology%20Material/New%20 Hydrology%20Manual/Rational%20Method%20new.doc
Beasley, R.S., 1976, Contribution of subsurface flow from the upper slopes of forested watersheds to channel flow: Soil Science Society of America Journal, v. 40, p. 955–957.
Bell, F.C., and Kar, S.O., 1969, Characteristic response times in design flood estimation: Journal of Hydrology, v. 8, p. 173–196.
Betson, R.P., 1964, What is watershed runoff?: Journal of Geophysical Research, v. 69, no. 8, p. 1541–1552.
Bisese, J.A., 1995, Methods for estimating the magnitude and frequency of peak discharges of rural, unregulated streams in Virginia: U.S. Geological Survey Water-Resources Inves-tigations Report 94-4148, 70 p.
Carluer, Nadia, and De Marsily, Ghislain, D., 2004, Assess-ment and modeling of the influence of man-made networks on the hydrology of a small watershed–Implications for fast flow components, water quality and landscape management: Journal of Hydrology, v. 285, n1, p. 76–95.
Chow, Ven Te, 1964, Handbook of applied hydrology; A compendium of water-resources technology: New York, McGraw-Hill, various pages.
Dunne, Thomas, 1978, Field studies of hillslope flow pro-cesses, in Kirkby, M.J., ed., Hillslope hydrology: New York, Wiley, p. 227–293.
Dunne, Thomas, and Black, R.D., 1970, An experimental investigation of runoff production in permeable soils: Water Resources Research, v. 6, no. 2, p. 478–490.
Freeze, R.A., 1972a, Role of subsurface flow in generating surface runoff 1, Base flow contributions to channel flow: Water Resources Research, v. 8, no. 3, p. 609–623.
References Cited 27
Freeze, R.A., 1972b, Role of subsurface flow in generating surface runoff 2, Upstream source areas: Water Resources Research, v. 8, no. 5, p. 1272–1283.
Freeze, R.A., 1974, Streamflow generation: Reviews of Geo-physics and Space Physics, v. 12, no. 4, p. 627–647.
French, R., Pilgrim, D.H., and Laurenson, B.E., 1974, Experi-mental examination of the Rational Method for small rural catchments: Civil Engineering Transactions, The Institution of Engineers, Australia, v. CE16, no. 2, p. 95–102.
Genereux, D.P., and Hooper, R.P., 1998, Oxygen and hydrogen isotopes in rainfall-runoff studies in isotope tracers in Kend-all, Carol, and McDonnell, J.J., eds., Catchment Hydrology: New York, Elsevier Science, p. 319–346.
Guo, J.C.Y., 2001, Rational hydrograph method for small urban catchments: Transactions, ASCE Journal of Hydro-logic Engineering, v. 6, no. 4, p. 352–356.
Hewlett, J.D., 1961, Soil moisture as a source of base flow from steep mountain watersheds: Southeastern Forest Experiment Station, U.S. Department of Agriculture, Ashe-ville, N.C., paper no. 132, 11 p.
Hewlett, J.D., 1974, Comments on letters relating to: ‘Role of subsurface flow in generating surface runoff, 2. Upstream source areas,’ by R.A. Freeze, Water Resources Research, v. 10, no. 3, p. 605–607.
Hewlett, J.D., and Hibbert, A.R., 1967, Factors affecting the response of small watersheds to precipitation in humid areas, in Sopper, W.E., and Lull, H.W., eds., International symposium on forest hydrology, Oxford, Pergamon, p. 275–290.
Horton, R.E., 1933, The role of infiltration in the hydrologic cycle: Transactions of the American Geophysical Union, no. 14, p. 446–460.
Hursh, C.R. and Brater, E.F., 1941, Separating storm hydro-graphs from small drainage areas into surface and sub-surface flow: Transactions of the American Geophysical Union. v. 22, p. 863–871.
Kirkby, M.J., and Chorley, R.J., 1967, Throughflow, overland flow and erosion: Bulletin of the International Association of Scientific Hydrology, v. 12, p. 5–21.
Kuichling, Emil, 1889, The relation between rainfall and the discharge of sewers in populous districts: Transactions ASCE, v. 20, no. 402, p. 1–60.
Langbein, W.B., and Iseri, K.T., 1960, General introduction and hydrologic definitions: U.S. Geological Survey Water-Supply Paper 1541-A, 29 p.
McKay, G.A., 1970, Precipitation, Section II in Gray, D.M., ed., Handbook on the principles of hydrology: Port Wash-ington, New York, Water Information Center, Inc., 111 p.
Miller, E.M., 1978, Technique for estimation magnitude and frequency of floods in Virginia: U.S. Geological Survey Water-Resources Investigations Report 78-5, 81 p.
Mulvaney, T.J., 1851, On the use of self-registering rain and flood gauges in making observations of the relations of rainfall and of flood discharges in a given catchment: Pro-ceeding of the Institute of Civil Engineers of Ireland, v. 4, p. 18–31.
National Resources Committee, Subcommittee on Small Water Storage Projects of the Water Resources Committee, 1939, Low dams–A manual of design for small water stor-age projects: Washington, D.C., U.S. Government Printing Office, p. 431.
Pilgrim, D.H., and Cordery, Ian, 1993, Flood runoff in Maid-ment, D.R., ed., Handbook of hydrology,: New York, McGraw-Hill, p. 9.1–9.42.
Ponce, V.M., 1989, Engineering hydrology–Principles and practices: Englewood Cliffs, New Jersey, Prentice-Hall, Inc., 642 p.
Schwab, G.O., Frevert, R.K., Barnes, K.K., and Edminster, T.W., 1971, Elementary soil and water engineering: New York, John Wiley & Sons, Inc., 316 p.
Singh, V.P., 1992, Elementary hydrology: Englewood Cliffs, New Jersey, Prentice-Hall, Inc., 973 p.
Singh, V.P., and Cruise, J.F., 1992, Analysis of the rational for-mula using a system approach in Yen, B.C., ed., Catchment runoff and rational formula: Little, Colo., Water Resources Publication, p. 39–51.
Thomas, W.O., Monde, M.C., and Davis, S.R., 2000, Estima-tion of time of concentration for Maryland streams: Trans-portation Research Board 79th Annual Meeting, January 9-13, 2000, paper no. 00-1267, Washington, D.C., p. 16.
Viessman, Warren, Knapp, J.W., Lewis, G.L., and Harbaugh, T.E., 1977, Introduction to hydrology (2nd ed.): New York, Harper and Row, 704 p.
Virginia Department of Transportation, 2002, Drainage Manual: Commonwealth of Virginia, Richmond, Va., vari-ously pages.
Washington State Department of Transportation, Environmen-tal and Engineering Service Center, Hydraulics Branch, 1997, Hydraulics Manual: Washington State Department of Transportation M 23-03, January 1997, variously paged.

28 Comparison of Peak Discharge and Runoff Characteristic Estimates for Small Basins in Central Virginia
Weyman, D.R., 1970, Throughflow on hillslopes and its rela-tion to the stream hydrograph: Bulletin of the International Association of Scientific Hydrology, v. 15(3), p. 25–33.
Whipkey, R.Z., 1965, Subsurface stormflow from forested slopes: Bulletin of the International Association of Scien-tific Hydrology, v. 10, no. 2, p. 74–85.
Wigham, J.M., 1970, Peak flow–rainfall events, in Gray, D.M., ed., Handbook on the principles of hydrology: Port Wash-ington, New York, Water Information Center, Inc. 102 p.

Tables 4–11

30 Comparison of Peak Discharge and Runoff Characteristic Estimates for Small Basins in Central Virginia
Table 4. Storm and estimated runoff characteristics for streamflow-gaging station 0203667510, Tuckahoe Creek Tributary 1 at Route 288 near Centerville, Va.[Design coefficients for this basin are drainage area of 2.5 acres, runoff coefficient of 0.80 and time of concentration of 10 minutes provided by Virginia Department of Transportation; Qp, peak flow in cubic feet per second; P, rainfall amount in inches; D, duration in minutes; I, rain-fall intensity in inches per hour; Cb, runoff coefficient computed by dividing the peak flow by rainfall amount and drainage area; Tc1, time of concentration in minutes computed by time to rise; Tc2, time of concentration in minutes computed from end of excess rainfall to inflection point dete concentrat minimum standard error of peaking portion of hydrograph; C5, runoff coefficient estimated with Tc5; Tc6, time of concentration in minutes estimated from minimum standard error of peak from peaking portion of hydrograph; C6, runoff coefficient estimated with Tc6; Tc7, time of concentration in minutes estimated from minimum standard error of recession portion of hydrograph; C7, runoff coefficient estimated with Tc7; Tc8, time of concentration in minutes estimated from minimum standard error of peak from recession portion of hydrograph; C8, runoff coefficient estimated with Tc8; –, not determined]
Date Time Qp P D IHyetograph and hydrograph
analysis Rational Hydrograph Method
Cb Tc1 Tc2 Tc3 Tc4 Tc5 C5 Tc6 C6 Tc7 C7 Tc8 C8
1999/04/09 19:27 6.10 0.73 10 4.33 0.56 8 5 4 10 18 0.80 12 0.66 – – – –
1999/05/23 00:24 3.70 .33 11 1.80 .82 16 7 7 13 23 .95 14 .96 22 .90 10 .88
1999/06/30 18:18 6.40 1.09 24 2.72 .94 14 3 7 16 22 .95 13 .94 22 .93 13 .91
1999/07/28 19:52 1.10 .53 13 2.45 .18 9 17 12 12 – – – – – – – –
1999/08/14 17:52 2.70 .86 20 2.58 .42 8 7 11 13 18 .37 7 .63 20 .43 7 .63
1999/08/14 20:52 3.50 .71 19 2.24 .63 15 4 9 14 18 .70 6 .56 20 .70 6 .56
1999/08/19 23:32 4.10 .76 19 2.40 .68 13 9 9 15 25 .82 20 .71 21 .74 20 .71
1999/08/20 03:20 3.10 .53 19 1.67 .74 20 6 7 15 19 .75 25 .94 24 .87 25 .94
1999/09/09 22:03 .86 .56 19 1.77 .19 34 29 30 30 – – – – – – – –
2000/02/27 20:28 3.40 .44 11 2.40 .57 13 7 6 11 18 .72 18 .80 15 .70 18 .80
2000/03/16 20:54 6.20 .47 13 2.17 1.14 34 2 8 14 6 .78 10 .92 14 .97 10 .92
2000/04/17 13:27 4.80 .69 21 1.97 .97 20 0 6 15 14 .97 5 .80 11 .91 6 .80
2000/05/28 20:29 .91 .28 11 1.53 .24 17 3 1 – – – – – – – – –
2000/06/13 18:38 .58 .43 12 2.15 .11 7 4 3 – – – – – – – – –
2000/06/27 17:56 5.90 .77 18 2.57 .92 21 2 6 16 13 .82 7 .81 21 .97 36 .91
2000/06/28 19:04 4.10 .75 15 3.00 .55 12 1 5 25 16 .60 6 .40 – – – –
2000/07/15 04:46 2.30 .51 12 2.55 .36 8 3 6 – – – – – – – – –
2000/07/30 14:30 1.90 .38 12 1.90 .40 25 2 5 12 9 .36 37 .66 – – – –
Minimum – – – – – .11 7 0 1 10 6 .36 5 .40 11 .43 6 .56
Maximum – – – – – 1.14 34 29 30 30 25 .97 37 .96 24 .97 36 .94
Average – – – – – .58 16 6 8 15 17 .74 14 .75 19 .81 15 .81
Median – – – – – .57 15 4 7 14 18 .78 12 .80 21 .89 12 .84
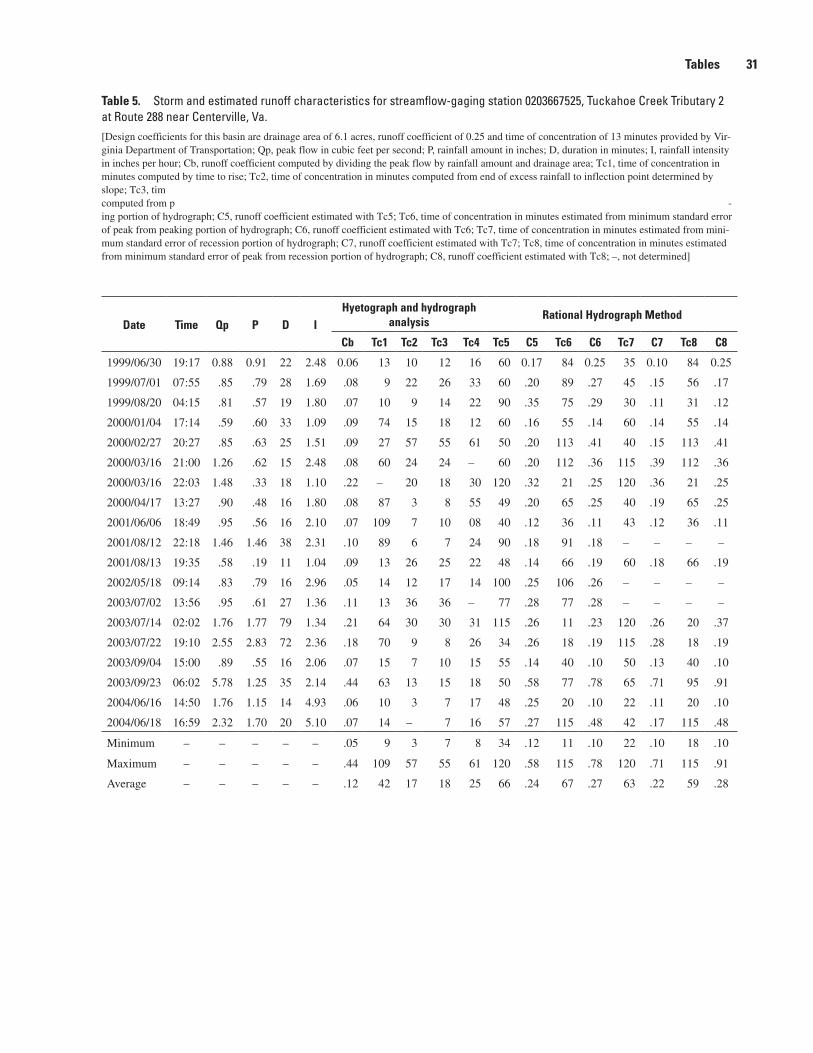
Tables 31
Table 5. Storm and estimated runoff characteristics for streamflow-gaging station 0203667525, Tuckahoe Creek Tributary 2 at Route 288 near Centerville, Va.[Design coefficients for this basin are drainage area of 6.1 acres, runoff coefficient of 0.25 and time of concentration of 13 minutes provided by Vir-ginia Department of Transportation; Qp, peak flow in cubic feet per second; P, rainfall amount in inches; D, duration in minutes; I, rainfall intensity in inches per hour; Cb, runoff coefficient computed by dividing the peak flow by rainfall amount and drainage area; Tc1, time of concentration in minutes computed by time to rise; Tc2, time of concentration in minutes computed from end of excess rainfall to inflection point determined by slope; Tc3, tim computed from p -ing portion of hydrograph; C5, runoff coefficient estimated with Tc5; Tc6, time of concentration in minutes estimated from minimum standard error of peak from peaking portion of hydrograph; C6, runoff coefficient estimated with Tc6; Tc7, time of concentration in minutes estimated from mini-mum standard error of recession portion of hydrograph; C7, runoff coefficient estimated with Tc7; Tc8, time of concentration in minutes estimated from minimum standard error of peak from recession portion of hydrograph; C8, runoff coefficient estimated with Tc8; –, not determined]
Date Time Qp P D IHyetograph and hydrograph
analysisRational Hydrograph Method
Cb Tc1 Tc2 Tc3 Tc4 Tc5 C5 Tc6 C6 Tc7 C7 Tc8 C8
1999/06/30 19:17 0.88 0.91 22 2.48 0.06 13 10 12 16 60 0.17 84 0.25 35 0.10 84 0.25
1999/07/01 07:55 .85 .79 28 1.69 .08 9 22 26 33 60 .20 89 .27 45 .15 56 .17
1999/08/20 04:15 .81 .57 19 1.80 .07 10 9 14 22 90 .35 75 .29 30 .11 31 .12
2000/01/04 17:14 .59 .60 33 1.09 .09 74 15 18 12 60 .16 55 .14 60 .14 55 .14
2000/02/27 20:27 .85 .63 25 1.51 .09 27 57 55 61 50 .20 113 .41 40 .15 113 .41
2000/03/16 21:00 1.26 .62 15 2.48 .08 60 24 24 – 60 .20 112 .36 115 .39 112 .36
2000/03/16 22:03 1.48 .33 18 1.10 .22 – 20 18 30 120 .32 21 .25 120 .36 21 .25
2000/04/17 13:27 .90 .48 16 1.80 .08 87 3 8 55 49 .20 65 .25 40 .19 65 .25
2001/06/06 18:49 .95 .56 16 2.10 .07 109 7 10 08 40 .12 36 .11 43 .12 36 .11
2001/08/12 22:18 1.46 1.46 38 2.31 .10 89 6 7 24 90 .18 91 .18 – – – –
2001/08/13 19:35 .58 .19 11 1.04 .09 13 26 25 22 48 .14 66 .19 60 .18 66 .19
2002/05/18 09:14 .83 .79 16 2.96 .05 14 12 17 14 100 .25 106 .26 – – – –
2003/07/02 13:56 .95 .61 27 1.36 .11 13 36 36 – 77 .28 77 .28 – – – –
2003/07/14 02:02 1.76 1.77 79 1.34 .21 64 30 30 31 115 .26 11 .23 120 .26 20 .37
2003/07/22 19:10 2.55 2.83 72 2.36 .18 70 9 8 26 34 .26 18 .19 115 .28 18 .19
2003/09/04 15:00 .89 .55 16 2.06 .07 15 7 10 15 55 .14 40 .10 50 .13 40 .10
2003/09/23 06:02 5.78 1.25 35 2.14 .44 63 13 15 18 50 .58 77 .78 65 .71 95 .91
2004/06/16 14:50 1.76 1.15 14 4.93 .06 10 3 7 17 48 .25 20 .10 22 .11 20 .10
2004/06/18 16:59 2.32 1.70 20 5.10 .07 14 – 7 16 57 .27 115 .48 42 .17 115 .48
Minimum – – – – – .05 9 3 7 8 34 .12 11 .10 22 .10 18 .10
Maximum – – – – – .44 109 57 55 61 120 .58 115 .78 120 .71 115 .91
Average – – – – – .12 42 17 18 25 66 .24 67 .27 63 .22 59 .28
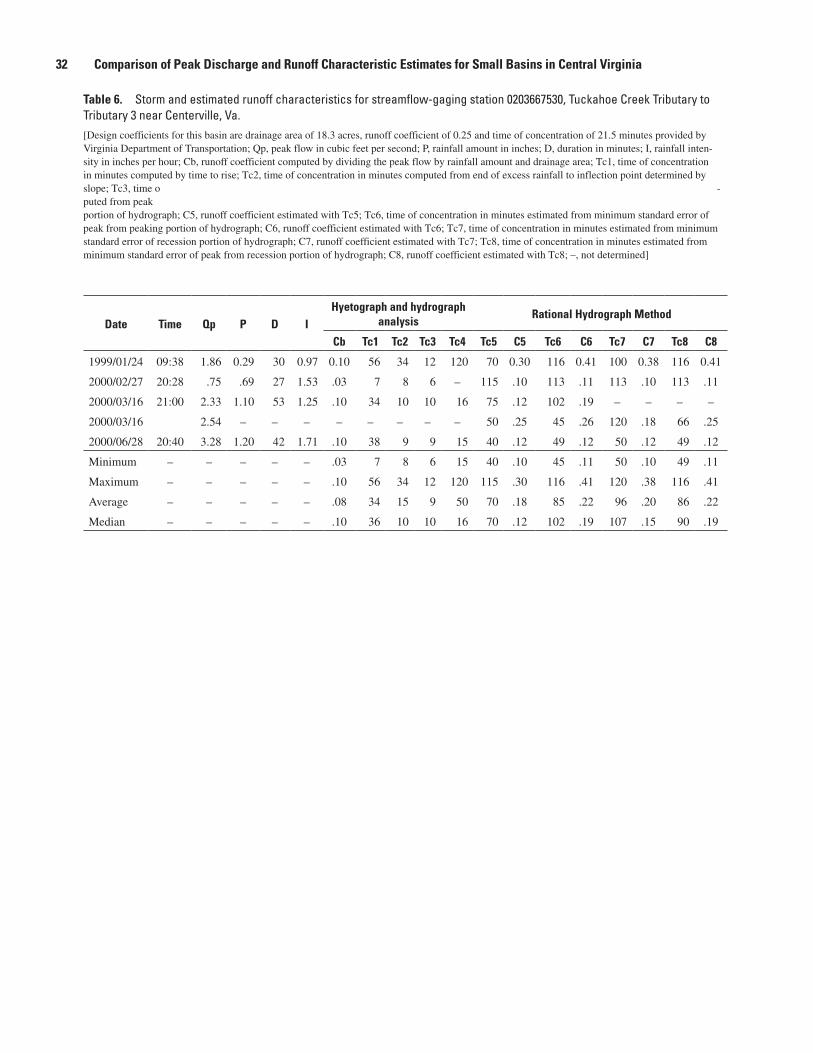
32 Comparison of Peak Discharge and Runoff Characteristic Estimates for Small Basins in Central Virginia
Table 6. Storm and estimated runoff characteristics for streamflow-gaging station 0203667530, Tuckahoe Creek Tributary to Tributary 3 near Centerville, Va.[Design coefficients for this basin are drainage area of 18.3 acres, runoff coefficient of 0.25 and time of concentration of 21.5 minutes provided by Virginia Department of Transportation; Qp, peak flow in cubic feet per second; P, rainfall amount in inches; D, duration in minutes; I, rainfall inten-sity in inches per hour; Cb, runoff coefficient computed by dividing the peak flow by rainfall amount and drainage area; Tc1, time of concentration in minutes computed by time to rise; Tc2, time of concentration in minutes computed from end of excess rainfall to inflection point determined by slope; Tc3, time o -puted from peak portion of hydrograph; C5, runoff coefficient estimated with Tc5; Tc6, time of concentration in minutes estimated from minimum standard error of peak from peaking portion of hydrograph; C6, runoff coefficient estimated with Tc6; Tc7, time of concentration in minutes estimated from minimum standard error of recession portion of hydrograph; C7, runoff coefficient estimated with Tc7; Tc8, time of concentration in minutes estimated from minimum standard error of peak from recession portion of hydrograph; C8, runoff coefficient estimated with Tc8; –, not determined]
Date Time Qp P D IHyetograph and hydrograph
analysis Rational Hydrograph Method
Cb Tc1 Tc2 Tc3 Tc4 Tc5 C5 Tc6 C6 Tc7 C7 Tc8 C8
1999/01/24 09:38 1.86 0.29 30 0.97 0.10 56 34 12 120 70 0.30 116 0.41 100 0.38 116 0.41
2000/02/27 20:28 .75 .69 27 1.53 .03 7 8 6 – 115 .10 113 .11 113 .10 113 .11
2000/03/16 21:00 2.33 1.10 53 1.25 .10 34 10 10 16 75 .12 102 .19 – – – –
2000/03/16 2.54 – – – – – – – – 50 .25 45 .26 120 .18 66 .25
2000/06/28 20:40 3.28 1.20 42 1.71 .10 38 9 9 15 40 .12 49 .12 50 .12 49 .12
Minimum – – – – – .03 7 8 6 15 40 .10 45 .11 50 .10 49 .11
Maximum – – – – – .10 56 34 12 120 115 .30 116 .41 120 .38 116 .41
Average – – – – – .08 34 15 9 50 70 .18 85 .22 96 .20 86 .22
Median – – – – – .10 36 10 10 16 70 .12 102 .19 107 .15 90 .19

Tables 33
Table 7. Storm and estimated runoff characteristics for streamflow-gaging station 0203668010, Stony Run Tributary to Tributary at Short Pump, Va.[Design coefficients for this basin are drainage area of 2.7 acres, runoff coefficient of 0.40 and time of concentration of 10 minutes provided by Virginia Department of Transportation; Qp, peak flow in cubic feet per second; P, rainfall amount in inches; D, duration in minutes; I, rainfall intensity in inches per hour; Cb, runoff coefficient computed by dividing the peak flow by rainfall amount and drainage area; Tc1, time of concentration in minutes computed by time to rise; Tc2, time of concentration in minutes computed from end of excess rainfall to inflection point dete concentrat minimum standard error of peaking portion of hydrograph; C5, runoff coefficient estimated with Tc5; Tc6, time of concentration in minutes estimated from minimum standard error of peak from peaking portion of hydrograph; C6, runoff coefficient estimated with Tc6; Tc7, time of concentration in minutes estimated from minimum standard error of recession portion of hydrograph; C7, runoff coefficient estimated with Tc7; Tc8, time of concentration in minutes estimated from minimum standard error of peak from recession portion of hydrograph; C8, runoff coefficient estimated with Tc8; –, not determined]
Date Time Qp P D IHyetograph and hydrograph
analysis Rational Hydrograph Method
Cb Tc1 Tc2 Tc3 Tc4 Tc5 C5 Tc6 C6 Tc7 C7 Tc8 C8
2003/07/09 16:54 0.97 1.00 28 2.14 0.17 11 16 12 20 40 0.23 54 0.32 50 0.28 73 0.42
2003/07/14 01:11 1.90 1.09 56 1.17 .60 56 14 12 52 60 .65 11 .68 120 .73 93 .66
2003/07/18 23:11 .62 .35 15 1.40 .16 25 14 12 26 32 .23 31 .20 80 .26 13 .33
2003/07/22 18:40 2.02 1.77 49 2.17 .35 24 10 12 33 40 .31 82 .60 73 .54 82 .60
2003/09/18 16:50 .69 .56 35 .96 .65 30 31 35 – 80 .88 82 .90 100 .90 30 .92
Minimum – – – – – .16 11 10 12 20 32 .23 11 .20 50 .26 13 .33
Maximum – – – – – .65 56 31 35 52 80 .88 82 .90 120 .90 93 .92
Average – – – – – .39 29 17 17 33 50 .46 52 .54 85 .54 58 .59
Median – – – – – .35 25 14 12 30 40 .31 54 .60 80 .54 73 .60

34 Comparison of Peak Discharge and Runoff Characteristic Estimates for Small Basins in Central Virginia
Table 8. Storm and estimated runoff characteristics for streamflow-gaging station 0203856510, Reedy Creek Industrial Drainage near Chesterfield, Va.[Design coefficients for this basin are drainage area of 10.4 acres, runoff coefficient of 0.75 and time of concentration of 13 minutes provided by Virginia Department of Transportation; Qp, peak flow in cubic feet per second; P, rainfall amount in inches; D, duration in minutes; I, rainfall inten-sity in inches per hour; Cb, runoff coefficient computed by dividing the peak flow by rainfall amount and drainage area; Tc1, time of concentration in minutes computed by time to rise; Tc2, time of concentration in minutes computed from end of excess rainfall to inflection point determined by slope; Tc3, time o -puted from peak portion of hydrograph; C5, runoff coefficient estimated with Tc5; Tc6, time of concentration in minutes estimated from minimum standard error of peak from peaking portion of hydrograph; C6, runoff coefficient estimated with Tc6; Tc7, time of concentration in minutes estimated from minimum standard error of recession portion of hydrograph; C7, runoff coefficient estimated with Tc7; Tc8, time of concentration in minutes estimated from minimum standard error of peak from recession portion of hydrograph; C8, runoff coefficient estimated with Tc8; –, not determined]
Date Time Qp P D IHyetograph and hydrograph
analysisRational Hydrograph Method
Cb Tc1 Tc2 Tc3 Tc4 Tc5 C5 Tc6 C6 Tc7 C7 Tc8 C8
2002/08/28 18:00 3.85 0.72 15 2.88 0.28 30 6 6 7 81 0.60 94 0.69 35 0.26 94 0.69
2003/04/10 20:13 2.56 .27 16 1.01 .53 8 11 12 13 83 .62 19 .30 27 .34 19 .30
2003/05/26 00:42 3.61 .49 14 2.10 .36 27 7 8 7 29 .30 28 .30 29 .31 28 .30
2003/05/26 01:23 4.58 .60 11 3.27 .29 12 5 5 6 34 .34 21 .23 39 .33 21 .23
2003/05/26 02:48 5.45 .56 12 2.80 .41 10 – 12 22 53 .38 113 .42 78 .36 113 .42
2003/06/07 07:44 3.32 .36 10 2.16 .32 13 7 9 9 18 .26 68 .77 38 .46 68 .77
2003/07/30 02:02 2.97 .48 22 1.31 .47 38 10 9 14 45 .39 52 .42 48 .39 52 .42
2003/07/30 07:33 3.66 .63 19 1.99 .38 12 4 4 18 36 .33 51 .46 24 .26 51 .46
2003/07/30 09:27 3.22 .43 19 1.36 .49 37 11 11 11 67 .63 90 .83 82 .66 90 .83
2003/08/07 09:04 1.85 .42 18 1.40 .28 15 11 9 9 56 .28 47 .24 43 .19 78 .35
2003/09/04 02:25 1.79 .56 18 1.87 .20 15 5 8 8 59 .29 29 .16 43 .23 29 .16
2003/09/04 16:23 2.46 .69 14 2.96 .17 13 1 4 8 59 .26 111 .42 63 .26 111 .42
2003/12/10 23:30 3.85 .43 13 1.98 .40 26 11 5 6 88 .53 89 .56 52 .37 89 .56
2004/05/26 21:27 5.11 .97 13 4.48 .24 9 16 2 8 46 .40 65 .56 27 .24 65 .56
2004/06/11 19:50 3.94 .66 10 3.96 .21 11 4 8 7 25 .29 45 .49 20 .22 45 .49
2004/07/05 20:15 4.89 .83 12 4.15 .25 10 8 9 9 25 .24 64 .59 27 .25 64 .59
2004/07/27 18:35 4.13 .28 10 1.68 .51 8 5 7 12 28 .29 100 .57 34 .31 100 .57
2004/07/27 19:39 4.98 .81 13 3.74 .28 10 2 5 17 81 .56 110 .51 46 .29 110 .51
2004/08/03 00:11 4.80 .70 12 3.50 .29 14 10 11 18 49 .31 111 .61 60 .36 111 .61
2004/08/03 00:00 4.62 .54 12 2.70 .36 20 10 8 16 72 .30 119 .39 49 .26 119 .39
2004/08/16 04:49 3.27 .38 13 1.75 .39 7 5 8 – 48 .71 35 .54 19 .29 35 .54
2004/08/16 05:20 3.37 .25 10 1.50 .47 11 17 18 – 60 .46 7 .21 22 .33 7 .21
2004/08/30 15:04 4.98 .52 13 2.40 .43 10 – 7 – 34 .31 55 .43 26 .22 24 .22
2004/08/30 18:21 5.32 .73 19 2.31 .48 12 – 9 – 45 .26 89 .33 52 .26 89 .33
Minimum – – – – – .17 7 1 2 6 18 .24 7 .16 19 .19 7 .16
Maximum – – – – – .53 38 17 18 22 88 .71 119 .83 82 .66 119 .83
Average – – – – – .35 16 8 8 11 51 .39 67 .46 41 .31 67 .46
Median – – – – – .36 12 7 8 9 49 .32 65 .45 39 .29 67 .44

Tables 35
Table 9. Storm and estimated runoff characteristics for streamflow-gaging station 020406210, Swift Creek Tributary Industrial Drainage near Wathall, Va.
[Design coefficients for this basin are drainage area of 52.7 acres, runoff coefficient of 0.63 and time of concentration of 37 minutes provided by Virginia Department of Transportation; Qp, peak flow in cubic feet per second; P, rainfall amount in inches; D, duration in minutes; I, rainfall intensity in inches per hour; Cb, runoff coefficient computed by dividing the peak flow by rainfall amount and drainage area; Tc1, time of concentration in minutes computed by time to rise; Tc2, time of concentration in minutes computed from end of excess rainfall to inflec-tion point d of concentrat minimum standard error of peaking portion of hydrograph; C5, runoff coefficient estimated with Tc5; Tc6, time of concentration in minutes estimated from minimum standard error of peak from peaking portion of hydrograph; C6, runoff coefficient estimated with Tc6; Tc7, time of concentration in minutes estimated from minimum standard error of recession portion of hydrograph; C7, runoff coefficient estimated with Tc7; Tc8, time of concentration in minutes estimated from minimum standard error of peak from recession portion of hydrograph; C8, runoff coef-ficient estimated with Tc8; –, not determined]
Date Time Qp P D IHyetograph and hydrograph
analysisRational Hydrograph Method
Cb Tc1 Tc2 Tc3 Tc4 Tc5 C5 Tc6 C6 Tc7 C7 Tc8 C8
2002/08/28 22:17 30.9 0.41 18 1.37 0.43 11 17 4 4 28 0.63 36 0.80 19 0.47 36 0.80
2002/11/11 12:21 7.38 .96 16 3.60 .04 11 8 4 – 75 .15 58 .13 47 .11 58 .13
2003/08/09 11:46 15.9 1.09 24 2.73 .11 25 4 4 – 62 .21 23 .11 13 .13 23 .11
2004/05/02 22:42 50.7 1.29 29 2.67 .36 12 – 4 – 27 .55 36 .73 6 .68 5 .89
2004/06/11 23:35 51.8 .55 14 2.36 .42 13 8 8 – 15 .48 27 .79 20 .59 27 .79
Minimum – – – – – .04 11 4 4 4 15 .15 23 .11 6 .11 5 .11
Maximum – – – – – .43 25 17 8 4 75 .63 58 .80 47 .68 58 .89
Average – – – – – .27 14 9 5 4 41 .40 36 .51 21 .40 30 .54
Median – – – – – .36 12 8 4 4 28 .48 36 .73 19 .47 27 .79

36 Comparison of Peak Discharge and Runoff Characteristic Estimates for Small Basins in Central Virginia
Table 10. Storm and estimated runoff characteristics for streamflow-gaging station 0204228775, Chickahominy River Tributary to Tributary at Ellerson, Va.[Design coefficients for this basin are drainage area of 26.0 acres, runoff coefficient of 0.40 and time of concentration of 20 minutes provided by Virginia Department of Transportation; Qp, peak flow in cubic feet per second; P, rainfall amount in inches; D, duration in minutes; I, rainfall intensity in inches per hour; Cb, runoff coefficient computed by dividing the peak flow by rainfall amount and drainage area; Tc1, time of concentra-tion in minutes computed by time to rise; Tc2, time of concentration in minutes computed from end of excess rainfall to inflection point determined by slope; Tc3, tim computed from p -ing portion of hydrograph; C5, runoff coefficient estimated with Tc5; Tc6, time of concentration in minutes estimated from minimum standard error of peak from peaking portion of hydrograph; C6, runoff coefficient estimated with Tc6; Tc7, time of concentration in minutes estimated from mini-mum standard error of recession portion of hydrograph; C7, runoff coefficient estimated with Tc7; Tc8, time of concentration in minutes estimated from minimum standard error of peak from recession portion of hydrograph; C8, runoff coefficient estimated with Tc8; –, not determined]
Date Time Qp P D I Hyetograph and hydrograph
analysisRational Hydrograph Method
Cb Tc1 Tc2 Tc3 Tc4 Tc5 C5 Tc6 C6 Tc7 C7 Tc8 C8
2000/06/06 07:30 1.38 0.77 30 1.54 0.19 30 – 13 13 119 0.10 119 0.10 120 0.10 119 0.10
2000/06/27 21:03 1.56 .75 22 2.05 .16 10 10 8 12 95 .12 100 .13 85 .10 100 .13
2000/07/15 06:35 3.46 .80 15 3.20 .23 11 13 14 12 77 .16 110 .22 114 .20 110 .22
2001/06/01 18:49 2.94 1.01 23 2.63 .23 15 8 11 13 83 .15 105 .18 65 .11 105 .18
2001/06/06 18:38 1.78 .75 17 2.65 .14 8 12 12 15 98 .14 79 .12 75 .10 79 .12
2001/08/12 20:37 4.80 .76 11 4.15 .24 23 3 7 12 95 .15 117 .18 90 .14 117 .18
2001/08/13 19:39 4.96 1.34 28 2.87 .36 23 6 9 15 68 .17 55 .14 43 .11 55 .14
2002/07/25 05:01 1.18 .39 18 1.30 .19 29 29 24 27 91 .14 79 .12 70 .10 79 .17
2002/07/27 17:03 3.37 1.14 26 2.63 .27 21 10 10 23 86 .16 53 .10 56 .10 53 .10
2002/08/28 18:57 3.28 .53 16 1.99 .34 46 18 16 12 57 .17 65 .19 68 .20 65 .19
2003/05/26 02:09 4.99 .75 20 2.25 .46 32 7 18 18 60 .20 45 .16 60 .14 116 .22
2003/05/31 18:03 2.67 .48 23 1.25 .44 36 14 13 21 84 .22 38 .13 76 .23 111 .25
2003/07/18 23:17 4.99 1.46 28 3.13 .33 33 4 7 11 79 .13 94 .16 67 .11 94 .16
2003/09/04 15:27 2.39 .70 19 2.21 .23 20 15 14 – 69 .14 120 .23 100 .19 120 .23
2003/09/12 17:54 2.26 .39 18 1.30 .36 25 21 20 19 67 .16 55 .15 69 .14 61 .14
2003/09/23 06:19 4.52 .71 13 3.28 .29 6 5 6 9 42 .13 82 .21 61 .17 82 .21
Minimum – – – – – .14 6 3 6 9 42 .10 38 .10 43 .10 53 .10
Maximum – – – – – .46 46 29 24 27 119 .22 120 .23 120 .23 120 .25
Average – – – – – .28 23 12 13 15 79 .15 82 .16 76 .14 92 .17
Median – – – – – .25 23 10 13 13 81 .15 81 .16 70 .13 97 .18
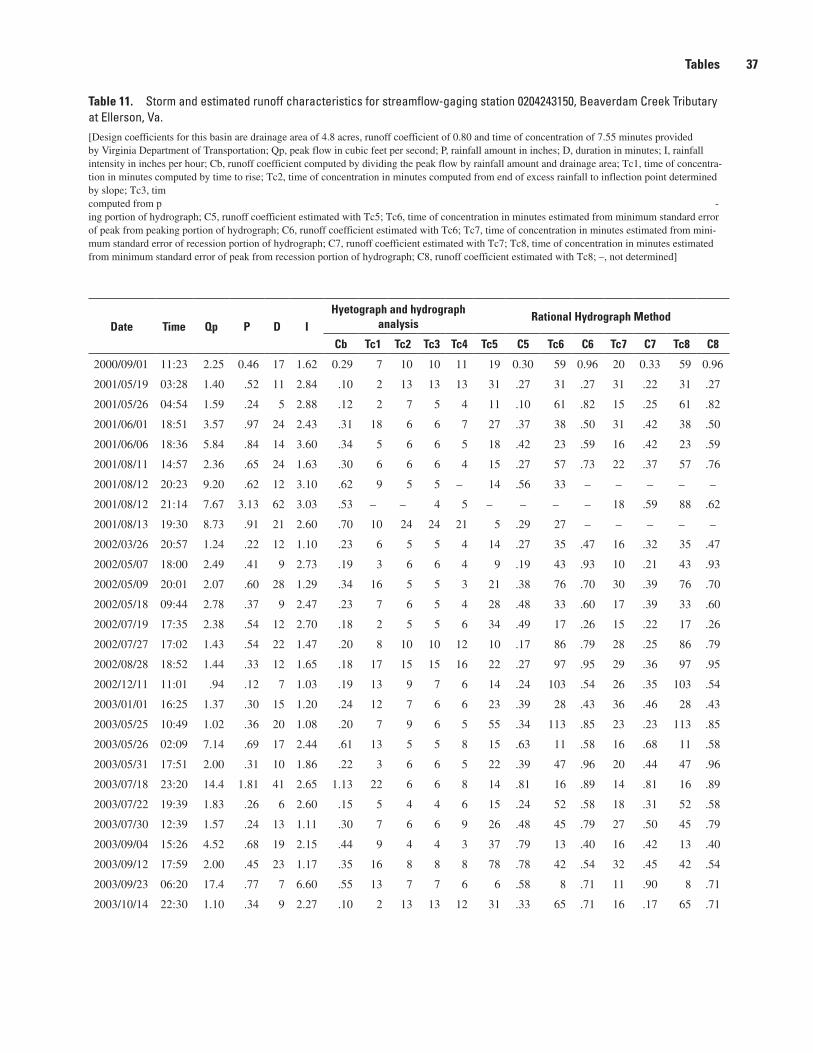
Tables 37
Table 11. Storm and estimated runoff characteristics for streamflow-gaging station 0204243150, Beaverdam Creek Tributary at Ellerson, Va.—Continued[Design coefficients for this basin are drainage area of 4.8 acres, runoff coefficient of 0.80 and time of concentration of 7.55 minutes provided by Virginia Department of Transportation; Qp, peak flow in cubic feet per second; P, rainfall amount in inches; D, duration in minutes; I, rainfall intensity in inches per hour; Cb, runoff coefficient computed by dividing the peak flow by rainfall amount and drainage area; Tc1, time of concentra-tion in minutes computed by time to rise; Tc2, time of concentration in minutes computed from end of excess rainfall to inflection point determined by slope; Tc3, tim computed from p -ing portion of hydrograph; C5, runoff coefficient estimated with Tc5; Tc6, time of concentration in minutes estimated from minimum standard error of peak from peaking portion of hydrograph; C6, runoff coefficient estimated with Tc6; Tc7, time of concentration in minutes estimated from mini-mum standard error of recession portion of hydrograph; C7, runoff coefficient estimated with Tc7; Tc8, time of concentration in minutes estimated from minimum standard error of peak from recession portion of hydrograph; C8, runoff coefficient estimated with Tc8; –, not determined]
Date Time Qp P D IHyetograph and hydrograph
analysisRational Hydrograph Method
Cb Tc1 Tc2 Tc3 Tc4 Tc5 C5 Tc6 C6 Tc7 C7 Tc8 C8
2000/09/01 11:23 2.25 0.46 17 1.62 0.29 7 10 10 11 19 0.30 59 0.96 20 0.33 59 0.96
2001/05/19 03:28 1.40 .52 11 2.84 .10 2 13 13 13 31 .27 31 .27 31 .22 31 .27
2001/05/26 04:54 1.59 .24 5 2.88 .12 2 7 5 4 11 .10 61 .82 15 .25 61 .82
2001/06/01 18:51 3.57 .97 24 2.43 .31 18 6 6 7 27 .37 38 .50 31 .42 38 .50
2001/06/06 18:36 5.84 .84 14 3.60 .34 5 6 6 5 18 .42 23 .59 16 .42 23 .59
2001/08/11 14:57 2.36 .65 24 1.63 .30 6 6 6 4 15 .27 57 .73 22 .37 57 .76
2001/08/12 20:23 9.20 .62 12 3.10 .62 9 5 5 – 14 .56 33 – – – – –
2001/08/12 21:14 7.67 3.13 62 3.03 .53 – – 4 5 – – – – 18 .59 88 .62
2001/08/13 19:30 8.73 .91 21 2.60 .70 10 24 24 21 5 .29 27 – – – – –
2002/03/26 20:57 1.24 .22 12 1.10 .23 6 5 5 4 14 .27 35 .47 16 .32 35 .47
2002/05/07 18:00 2.49 .41 9 2.73 .19 3 6 6 4 9 .19 43 .93 10 .21 43 .93
2002/05/09 20:01 2.07 .60 28 1.29 .34 16 5 5 3 21 .38 76 .70 30 .39 76 .70
2002/05/18 09:44 2.78 .37 9 2.47 .23 7 6 5 4 28 .48 33 .60 17 .39 33 .60
2002/07/19 17:35 2.38 .54 12 2.70 .18 2 5 5 6 34 .49 17 .26 15 .22 17 .26
2002/07/27 17:02 1.43 .54 22 1.47 .20 8 10 10 12 10 .17 86 .79 28 .25 86 .79
2002/08/28 18:52 1.44 .33 12 1.65 .18 17 15 15 16 22 .27 97 .95 29 .36 97 .95
2002/12/11 11:01 .94 .12 7 1.03 .19 13 9 7 6 14 .24 103 .54 26 .35 103 .54
2003/01/01 16:25 1.37 .30 15 1.20 .24 12 7 6 6 23 .39 28 .43 36 .46 28 .43
2003/05/25 10:49 1.02 .36 20 1.08 .20 7 9 6 5 55 .34 113 .85 23 .23 113 .85
2003/05/26 02:09 7.14 .69 17 2.44 .61 13 5 5 8 15 .63 11 .58 16 .68 11 .58
2003/05/31 17:51 2.00 .31 10 1.86 .22 3 6 6 5 22 .39 47 .96 20 .44 47 .96
2003/07/18 23:20 14.4 1.81 41 2.65 1.13 22 6 6 8 14 .81 16 .89 14 .81 16 .89
2003/07/22 19:39 1.83 .26 6 2.60 .15 5 4 4 6 15 .24 52 .58 18 .31 52 .58
2003/07/30 12:39 1.57 .24 13 1.11 .30 7 6 6 9 26 .48 45 .79 27 .50 45 .79
2003/09/04 15:26 4.52 .68 19 2.15 .44 9 4 4 3 37 .79 13 .40 16 .42 13 .40
2003/09/12 17:59 2.00 .45 23 1.17 .35 16 8 8 8 78 .78 42 .54 32 .45 42 .54
2003/09/23 06:20 17.4 .77 7 6.60 .55 13 7 7 6 6 .58 8 .71 11 .90 8 .71
2003/10/14 22:30 1.10 .34 9 2.27 .10 2 13 13 12 31 .33 65 .71 16 .17 65 .71

38 Comparison of Peak Discharge and Runoff Characteristic Estimates for Small Basins in Central Virginia
Table 11. Storm and estimated runoff characteristics for streamflow-gaging station 0204243150, Beaverdam Creek Tributary at Ellerson, Va.—Continued[Design coefficients for this basin are drainage area of 4.8 acres, runoff coefficient of 0.80 and time of concentration of 7.55 minutes provided by Virginia Department of Transportation; Qp, peak flow in cubic feet per second; P, rainfall amount in inches; D, duration in minutes; I, rainfall intensity in inches per hour; Cb, runoff coefficient computed by dividing the peak flow by rainfall amount and drainage area; Tc1, time of concentra-tion in minutes computed by time to rise; Tc2, time of concentration in minutes computed from end of excess rainfall to inflection point determined by slope; Tc3, tim computed from p -ing portion of hydrograph; C5, runoff coefficient estimated with Tc5; Tc6, time of concentration in minutes estimated from minimum standard error of peak from peaking portion of hydrograph; C6, runoff coefficient estimated with Tc6; Tc7, time of concentration in minutes estimated from mini-mum standard error of recession portion of hydrograph; C7, runoff coefficient estimated with Tc7; Tc8, time of concentration in minutes estimated from minimum standard error of peak from recession portion of hydrograph; C8, runoff coefficient estimated with Tc8; –, not determined]
Date Time Qp P D IHyetograph and hydrograph
analysisRational Hydrograph Method
Cb Tc1 Tc2 Tc3 Tc4 Tc5 C5 Tc6 C6 Tc7 C7 Tc8 C8
2003/11/06 09:38 1.94 0.26 8 1.95 0.21 9 4 4 4 25 0.35 48 0.39 19 0.30 48 0.39
2004/06/11 19:13 2.18 .40 13 1.85 .25 6 3 5 8 25 .51 19 .41 11 .28 19 .41
Minimum – – – – – .10 2 3 4 3 5 .10 8 .26 10 .17 8 .26
Maximum – – – – – 1.13 22 24 24 21 78 .81 113 .96 36 .90 113 .96
Average – – – – – .33 9 8 7 7 23 .40 46 .64 21 .39 48 .64
Median – – – – – .24 7 6 6 6 21 .37 42 .60 19 .37 44 .61