Embed Size (px)
Citation preview

MD703Electronic Commerce II
Dealing w/Competitive Threats

Dealing with Competitive Threats
• Strengthen brands– inspire trust, communicate quality, lower search costs
• Create economies of scale
• Differentiate products / constant innovation
• Create switching costs– pref. databases, communities, loyalty programs
• Dominate or create distribution channels
• Leverage alliances and partnerships


Customer Acquisition Costs
CompanyAquis.
Cost
CDnow 40EarthLink 75America Online 93Credit card companies 90-100Long distance telephone companies 100Mortgage lenders 100-250
Source: Sept. 98 Iconocast.

Strong Brand Can Be Extended

Scale, IPOs, and DifferentiationLetting in the Little Guy
The Firm Underwriters, institutions, &
large investors
$12/share7% fee
small Investors
small Investors
small Investors
$15/share
&Online
Brokerages
small Investors
small Investors
small Investors
• Result: differentiated service enabled by scale

Scale in theMarketplace vs. Marketspace
• Turnover– 2.6 times / year– avg. book in store 20
weeks
• Inventory– shelf & warehouse
stock– 30-40% returns– little float / title
• Turnover– 26 times / year– avg. book in house 2
weeks
• Inventory– all warehouse stock– few returns– avg. 32 days of
float / title

If you build it...
• … will they come? Maybe, but they might not return.
Vis
ito
rs
Time
Branding &Value Delivery


Commodity Products
• Time available = X
• High search costs – (e.g. time to visit a firm = X/3)– customer can only visit 3 firms
• Low search costs – (e.g. time to visit a firm = X/30)– customer can visit 30 firms


Differentiation & Switching Costs
• Differentiate the product or service via:– mass customization– preference databases & collaborative filtering– communities
• Switching costs created via:– preference databases & collaborative filtering– frequent buyer programs– communities of users– learning, compatibility, standards
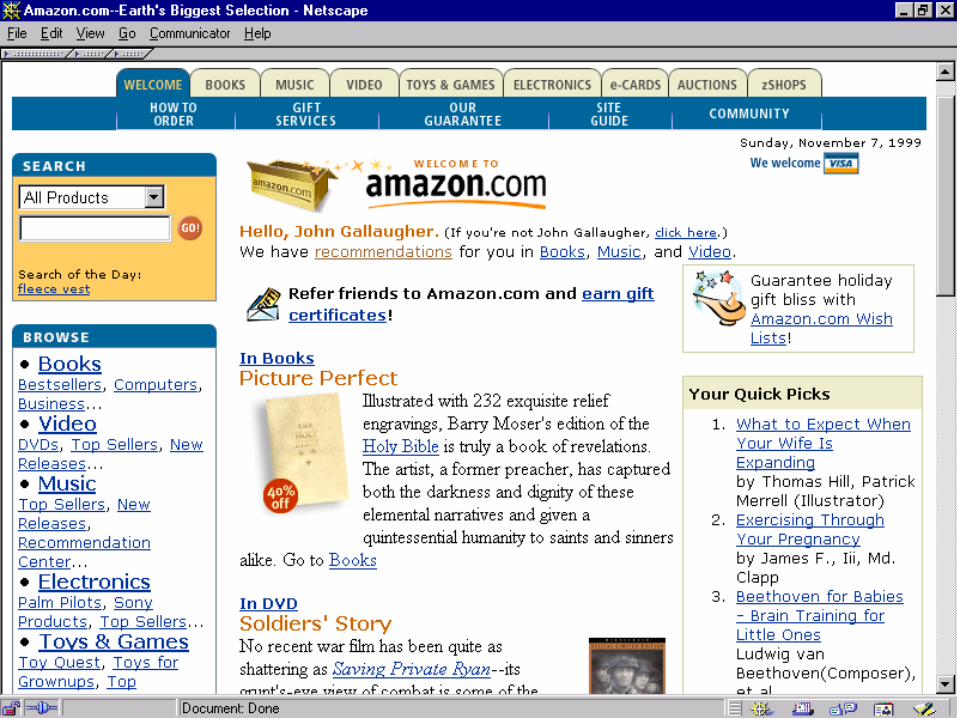


Bezos vs. the World
Amazon CompetitionBooks $317 million $70 million bn.comMusic $78 million $56 million CDNowToys $95 million $105 million eToysAuctions 140,000 users 3 million users eBay
1 million users Yahoo


Cookies• stored in a text file on your hard drive• usage
– track users (unique ID)– save passwords / prefs.– temporary storage (shopping
basket)• each cookie can only be accessed by
the domain that placed it (ads have own domain)
• may be disabled (prefs) • a cookie single user

TargetingTargeting Options• site categorization• visitor frequency• geography• domain name• service provider• SIC codes• company size (emp, $)• browser type• operating system• click stream

Leveraging the Clickstream
1.Lycos visitor searches on “travel”
2. Lycos shares my usage pattern with the Engage database
3. The same user visits NetMarket
4. NetMarket identifies the user’s activity in the Engage database & customizes page #1 with a great deal on luggage for my trip

Why Communities?
• Communities create switching costs & provide a reason to return– 57% of surfers return to the same sites
• Communities generate traffic– chat boosts traffic from 50% to 300%
• Communities pre-qualify users• Community members spend more• Communities can lower support costs

Users = Value
source: InternetWorld, Wired News
Date Service Purchaser # of Users Deal $ $/UserNov-99 Gamesville Lycos 2.2 million $207 million 94$ Jan-99 GeoCities Yahoo 3.5 million $3.56 billion 1,017$ Aug-98 WhoWhere Lycos 10.6 million $133 million 13$ Aug-98 PlanetAll Amazon 1.5 million $87.9 million 59$ Jun-98 Mirabilis/ICQ AOL 11 million $287 million 26$ Apr-98 WebChat InfoSeek 2.7 million $6.7 million 2$ Feb-98 Tripod Lycos 1 million $58 million 58$ Jan-98 HotMail Microsoft 9 million $400 million 44$ Oct-97 Four11 /
RocketmailYahoo 1 million $92 million $ 92
Sep-97 CompuServe AOL 2.6 million $425 million 163$


Distribution Channels
• PC Makers (Compaq, Dell, IBM, Gateway, Apple)
• Operating System (Microsoft Apple, Sun)
• Browsers (Microsoft, Netscape/AOL)
• ISPs (AOL, AT&T, @Home, BabyBells, Earthlink)
• Hosts (Exodus, Broadcast.com, Frontier, IBM, GTE)
• Portals (Yahoo, Excite, Infoseek, Lycos, AOL)
• Hybrids (Pixel Co., RadioWave, Pointcast)

Web Site Promotion Schemes
• Popularity: – Banners 98%– Buttons 55%– Television 30%– Affiliate Programs
17%
• Effectiveness (Scale of 1-5):
– Affiliate Programs 4.3– Television 4.0– Banners 2.8– Buttons 2.0.
Source: Iconocast.


“Speed is God,Time is the Devil”