Embed Size (px)
Citation preview

McGraw-Hill/Irwin ©2001 The McGraw-Hill Companies All Rights Reserved
11.1
Chapter
11Risk andReturn
McGraw-Hill/Irwin ©2001 The McGraw-Hill Companies All Rights Reserved
11.2
11.1 Expected Returns and Variances
McGraw-Hill/Irwin ©2001 The McGraw-Hill Companies All Rights Reserved
11.3
Remember from the Prior Chapter:
We calculated average returns and variances using historical data
We now begin to discuss how to analyze returns and variances when the information we have concerns future possible returns and their probabilities.

McGraw-Hill/Irwin ©2001 The McGraw-Hill Companies All Rights Reserved
11.4
Expected ReturnsExpected Return: return on a risky asset
“expected” in the future.based on the probabilities of possible outcomes in this context, “expected” means average if the
process is repeated many timesThe expected return is equal to:
The sum of: the possible returns multiplied by their probabilities Simply multiply the possibilities by the probabilities and
add up the results:
n
iii RpRE
1
)(

McGraw-Hill/Irwin ©2001 The McGraw-Hill Companies All Rights Reserved
11.5
Variance and Standard DeviationIn Chapter 10 we were examining actual
historical returnsWe estimated the average return and variance
based on actual events

McGraw-Hill/Irwin ©2001 The McGraw-Hill Companies All Rights Reserved
11.6
Remember This Example from the Previous ChapterHistorical Variance and Standard Deviation
Year Actual Return
Average Return
Deviation from the Mean (Average)
Squared Deviation
1 .15 .105 .045 .002025
2 .09 .105 -.015 .000225
3 .06 .105 -.045 .002025
4 .12 .105 .015 .000225
Totals .42 / 4 = .105
.000 .0045
(2) Variance = .0045 / (4-1) = .0015
() Standard Deviation = .03873 (Positive Square Root of the Variance)

McGraw-Hill/Irwin ©2001 The McGraw-Hill Companies All Rights Reserved
11.7
Variance and Standard Deviation
Now we’ll “project” future returns and their associated probabilitiesVariance and standard deviation still measure the
volatility of returns
Therefore, we’ll calculate “expected returns” and variances somewhat different from the previous chapter
McGraw-Hill/Irwin ©2001 The McGraw-Hill Companies All Rights Reserved
11.8
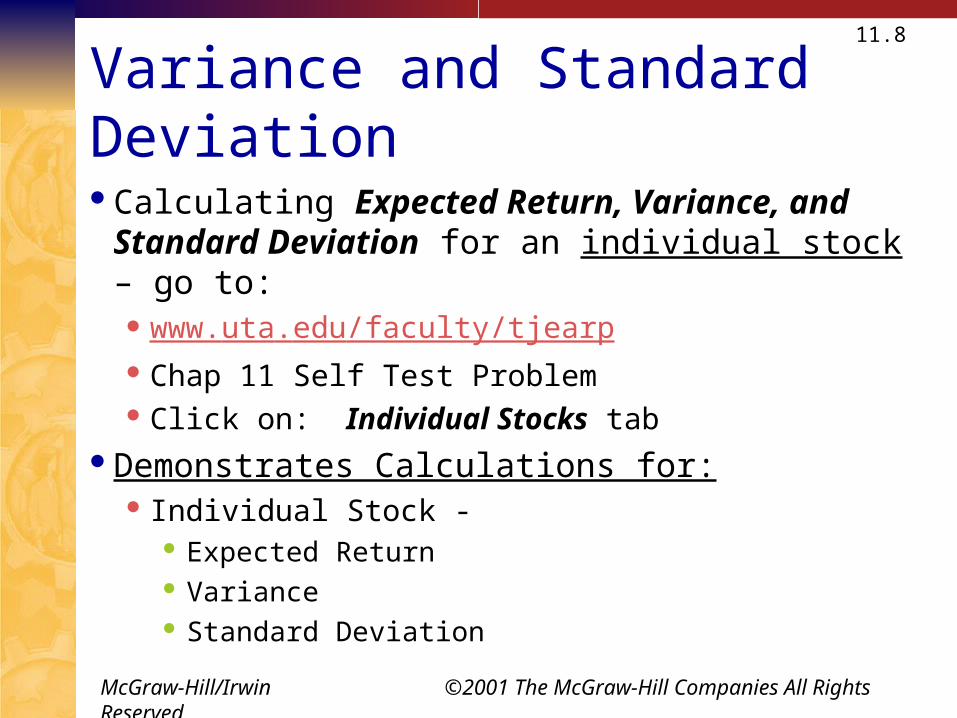
Variance and Standard Deviation
Calculating Expected Return, Variance, and Standard Deviation for an individual stock – go to: www.uta.edu/faculty/tjearp Chap 11 Self Test Problem Click on: Individual Stocks tab
Demonstrates Calculations for: Individual Stock -
Expected Return Variance Standard Deviation

McGraw-Hill/Irwin ©2001 The McGraw-Hill Companies All Rights Reserved
11.9
11.2 Portfolios

McGraw-Hill/Irwin ©2001 The McGraw-Hill Companies All Rights Reserved
11.10
Portfolios
A portfolio is a group of assets such as stocks and bonds held by an investor
An asset’s risk and return is important in how it affects the risk and return of the portfolio
The risk-return trade-off for a portfolio is measured by the portfolio expected return and standard deviation, just as with individual assets
McGraw-Hill/Irwin ©2001 The McGraw-Hill Companies All Rights Reserved
11.11
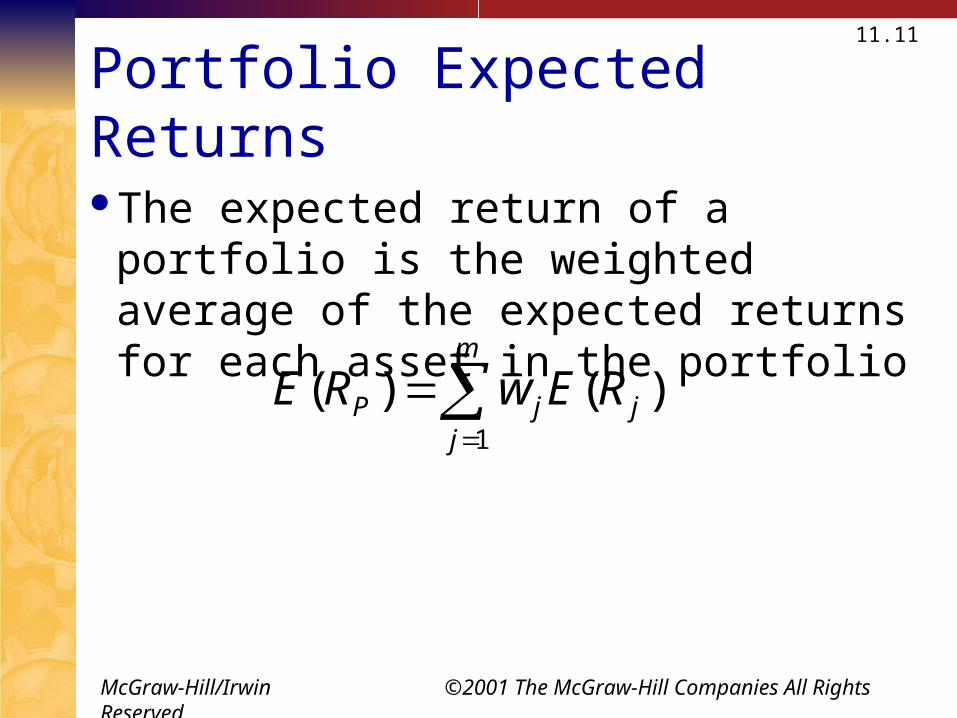
Portfolio Expected Returns
The expected return of a portfolio is the weighted average of the expected returns for each asset in the portfolio
m
jjjP REwRE
1
)()(

McGraw-Hill/Irwin ©2001 The McGraw-Hill Companies All Rights Reserved
11.12
Portfolios
Calculating Portfolio Expected Return, Variance, and Standard Deviation – go to: www.uta.edu/faculty/tjearp Chap 11 Self Test Problem Click on: Portfolio tab
Demonstrates Calculations for: Portfolio
Weights Expected Return Variance Standard Deviation

McGraw-Hill/Irwin ©2001 The McGraw-Hill Companies All Rights Reserved
11.13
11.3 Announcements, Surprises, and Expected Returns

McGraw-Hill/Irwin ©2001 The McGraw-Hill Companies All Rights Reserved
11.14
Expected versus Unexpected Returns
Realized returns are generally not = to expected returns
There’s the expected component and the unexpected component
Total return = Expected return + Unexpected returnThe unexpected return comes about because of
unanticipated events. The risk from investing stems from the possibility of an
unanticipated event. (i.e. a sudden unexpected change in interest rates)
McGraw-Hill/Irwin ©2001 The McGraw-Hill Companies All Rights Reserved
11.15
Announcements and News
Announcements and news contain both an expected component and a surprise component
It’s the surprise component that affects a stock’s price and therefore its return
This is very obvious when we watch how stock prices move when an unexpected announcement is made or earnings are different than anticipated

McGraw-Hill/Irwin ©2001 The McGraw-Hill Companies All Rights Reserved
11.16
Efficient MarketsWe assume that relevant information known
today is already reflected in the expected returnThat is the current stock price reflects relevant
publicly available informationThis assumes that markets are at least reasonably
efficient in the Semistrong form – all public information is reflected in the stock price
McGraw-Hill/Irwin ©2001 The McGraw-Hill Companies All Rights Reserved
11.17
Efficient Markets
Efficient markets are a result of investors trading on the unexpected portion of announcements
The easier it is to trade on surprises, the more efficient markets should be
Efficient markets involve random price changes because we cannot predict surprises
McGraw-Hill/Irwin ©2001 The McGraw-Hill Companies All Rights Reserved
11.18
11.4 Risk: Systematic and Unsystematic

McGraw-Hill/Irwin ©2001 The McGraw-Hill Companies All Rights Reserved
11.19
Systematic Risk
Systematic Risk: a risk that affects a large number of assetsAlso known as non-diversifiable risk or market riskHas market-wide effects Economywide.Affects nearly all companies to some degreeIncludes such things as changes in GDP, inflation,
interest rates, etc.

McGraw-Hill/Irwin ©2001 The McGraw-Hill Companies All Rights Reserved
11.20
Unsystematic Risk
Unsystematic Risk: a risk that affects at most a small number of assets. Also known as unique or asset-specific riskUnique to individual companies or assetsIncludes such things as labor strikes, part shortages,
etc.Firm-Specific Example:
the stock price of a gold-mining firm drops when it’s discovered the firm’s chairman has overstated minable gold reserves

McGraw-Hill/Irwin ©2001 The McGraw-Hill Companies All Rights Reserved
11.21
Systematic and Unsystematic Components of ReturnTotal Return = expected return + unexpected
return: R = E(R) + UUnexpected return = systematic portion +
unsystematic portionTherefore:
Total Return = expected return + systematic portion + unsystematic portion:
R = E(R) + Systematic portion + Unsystematic portion
McGraw-Hill/Irwin ©2001 The McGraw-Hill Companies All Rights Reserved
11.22
11.5 Diversification and Portfolio Risk
McGraw-Hill/Irwin ©2001 The McGraw-Hill Companies All Rights Reserved
11.23
Diversification
Principle of diversification: Spreading an investment across a number of assets will eliminate some, but not all, of the risk.
Portfolio diversification is the investment in several different asset classes or sectors
Diversification is not just holding a lot of assetsFor example: if you own 50 internet stocks, you’re
not diversifiedHowever: if you own 50 stocks that span 20
different industries, then you are diversified
McGraw-Hill/Irwin ©2001 The McGraw-Hill Companies All Rights Reserved
11.24
Diversifiable Risk
The risk that can be eliminated by combining assets into a portfolio
Often considered the same as unsystematic, unique, or asset-specific risk
If we hold only one asset, or assets in the same industry, then we are exposing ourselves to risk that we could diversify away
McGraw-Hill/Irwin ©2001 The McGraw-Hill Companies All Rights Reserved
11.25
The Principle of Diversification
Diversification can substantially reduce the variability of returns without an equivalent reduction in expected returns
This reduction in risk arises because worse than expected returns from one asset are offset by better than expected returns from another
However, there is a minimum level of risk that cannot be diversified away and that is the systematic portion – market risk!
McGraw-Hill/Irwin ©2001 The McGraw-Hill Companies All Rights Reserved
11.26
Total Risk
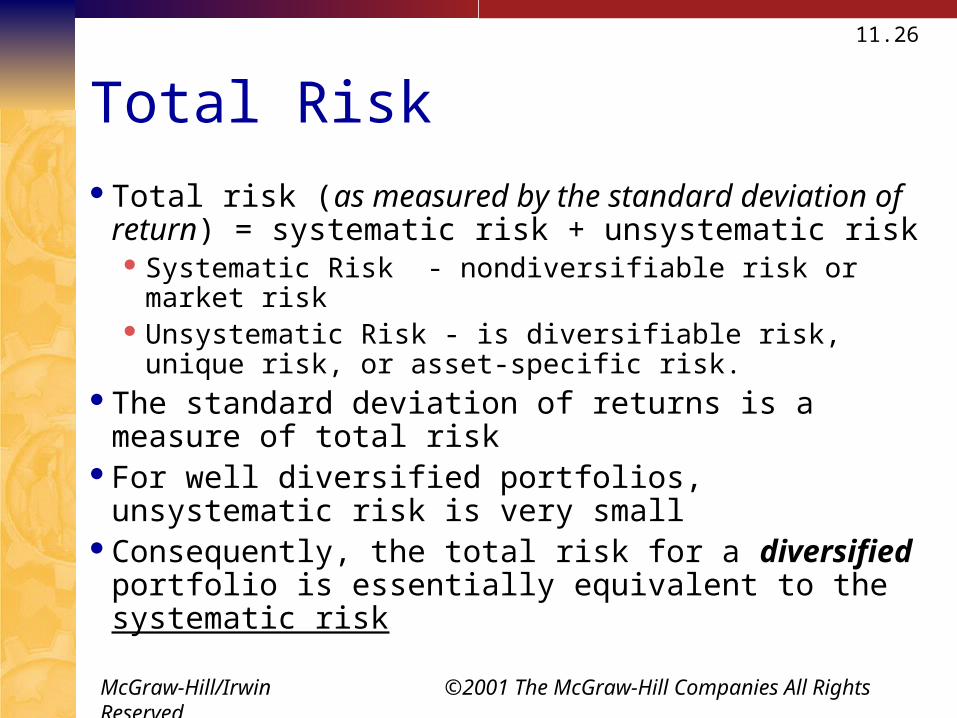
Total risk (as measured by the standard deviation of return) = systematic risk + unsystematic risk Systematic Risk - nondiversifiable risk or market risk Unsystematic Risk - is diversifiable risk, unique risk, or
asset-specific risk.The standard deviation of returns is a measure of total
riskFor well diversified portfolios, unsystematic risk is
very smallConsequently, the total risk for a diversified portfolio
is essentially equivalent to the systematic risk

McGraw-Hill/Irwin ©2001 The McGraw-Hill Companies All Rights Reserved
11.27Table 11.7 – Std Dev declines as the number of securities increases
1 49.24 1.00
2 37.36 .76
4 29.69 .60
6 26.64 .54
8 24.98 .51
10 23.93 .49
20 21.68 .44
30 20.87 .42
40 20.46 .42
50 20.20 .41
100 19.69 .40
200 19.42 .39
300 19.34 .39
400 19.29 .39
500 19.27 .39
1,000 19.21 .39
(2)Average Standard
Deviation of AnnualPortfolio Returns
(3)Ratio of Portfolio
Standard Deviation toStandard Deviationof a Single Stock
(1)Number of Stocks
in Portfolio
%

McGraw-Hill/Irwin ©2001 The McGraw-Hill Companies All Rights Reserved
11.28
Figure 11.1Average annualstandard deviation (%)
Diversifiable risk
Nondiversifiablerisk
Number of stocksin portfolio
49.2
23.9
19.2
1 10 20 30 40 1,000

McGraw-Hill/Irwin ©2001 The McGraw-Hill Companies All Rights Reserved
11.29
11.6 Systematic Risk and Beta

McGraw-Hill/Irwin ©2001 The McGraw-Hill Companies All Rights Reserved
11.30
Systematic Risk Principle
Systematic Risk Principle: the expected return on a risky asset depends only on that asset’s systematic (market) risk There is a reward for bearing riskThere is not a reward for bearing risk unnecessarilyUnsystematic (firm specific) risk can be eliminated at
virtually no cost (by diversifying)
McGraw-Hill/Irwin ©2001 The McGraw-Hill Companies All Rights Reserved
11.31
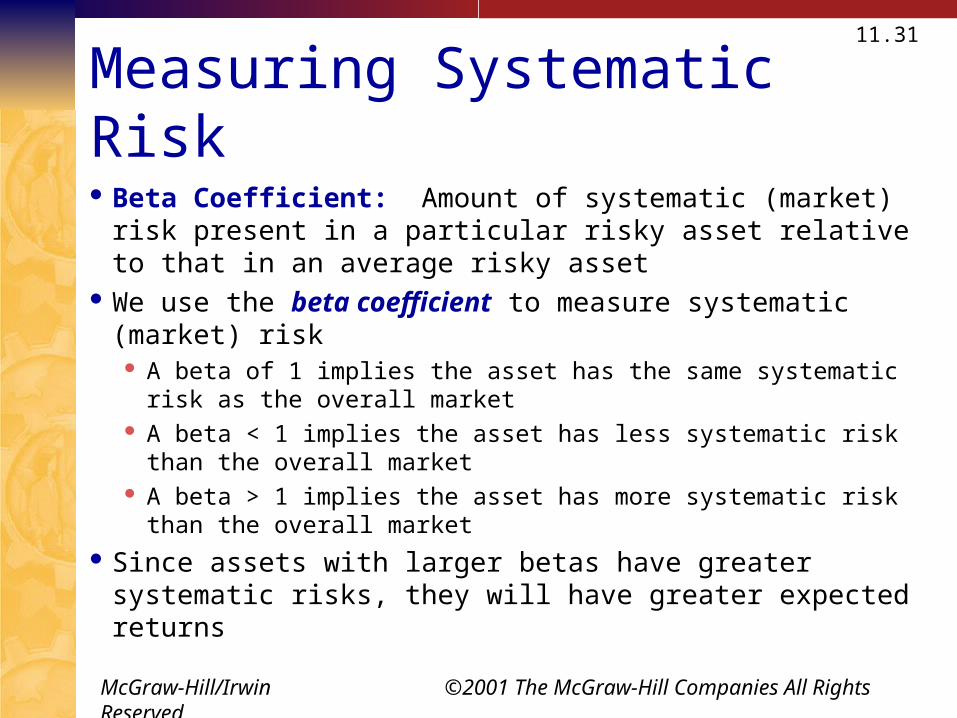
Measuring Systematic Risk
Beta Coefficient: Amount of systematic (market) risk present in a particular risky asset relative to that in an average risky asset
We use the beta coefficient to measure systematic (market) risk A beta of 1 implies the asset has the same systematic risk as the overall
market A beta < 1 implies the asset has less systematic risk than the overall
market A beta > 1 implies the asset has more systematic risk than the overall
market Since assets with larger betas have greater systematic risks, they
will have greater expected returns

McGraw-Hill/Irwin ©2001 The McGraw-Hill Companies All Rights Reserved
11.32
Table 11.8
Company Beta Coefficient
McDonalds .85
Gillette .90
IBM 1.00
General Motors 1.05
Microsoft 1.10
Harley-Davidson 1.20
Dell Computer 1.35
America Online 1.75
(I)

McGraw-Hill/Irwin ©2001 The McGraw-Hill Companies All Rights Reserved
11.33
Portfolio BetasExample: 11.6 – Page 323Security Amt Inv Exp Rtn Beta WeightStock A $ 1,000 8% .80 .10Stock B 2,000 12 .95 .20Stock C 3,000 15 1.10 .30Stock D 4,000 18 1.40 .40
10,000 1.00 What is the expected return on this portfolio?
E(Rp) = .10(.08) + .20(.12) + .30(.15) + .40(.18) = .149 or 14.9% What is the beta of this portfolio?
Bp = .10(.80) + .20(.95) + .30(1.10) + .40(1.40) = 1.16

McGraw-Hill/Irwin ©2001 The McGraw-Hill Companies All Rights Reserved
11.34
11.7 The Security Market Line

McGraw-Hill/Irwin ©2001 The McGraw-Hill Companies All Rights Reserved
11.35
Beta and the Risk Premium
Remember that the risk premium = expected return – risk-free rate
The higher the beta, the greater the risk premium

McGraw-Hill/Irwin ©2001 The McGraw-Hill Companies All Rights Reserved
11.36
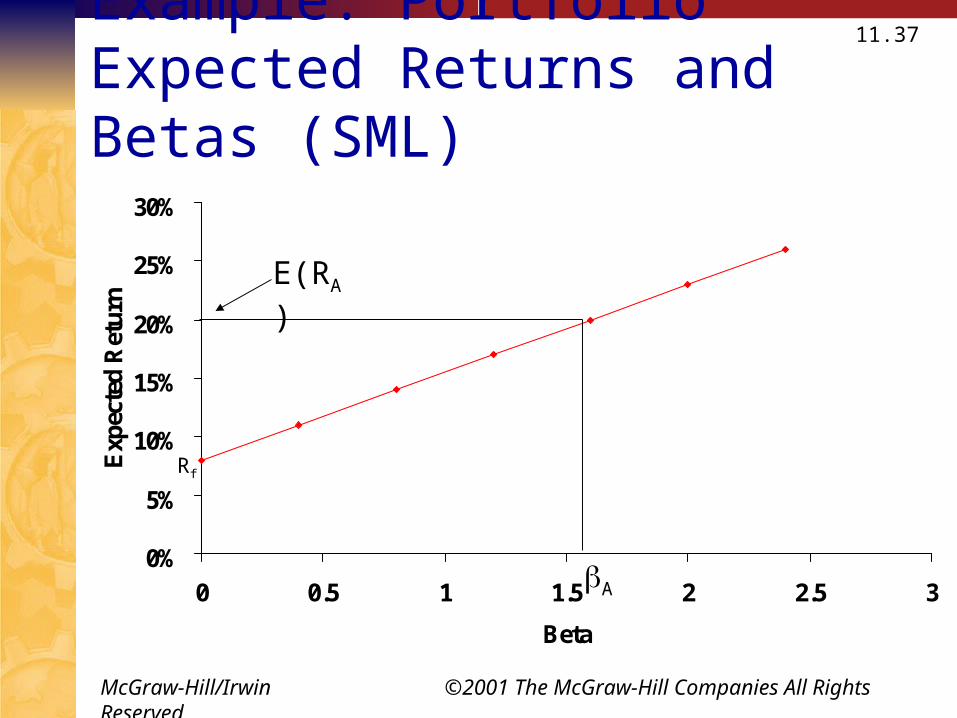
Security Market Line
The security market line (SML): Positively sloped straight line displaying the relationship between expected return and beta.Figure 11.4, Page 330
The slope of the SML is: (E(RM) – Rf) / M
But since the beta for the market is ALWAYS equal to one, the slope can be rewritten: E(RM) – Rf
McGraw-Hill/Irwin ©2001 The McGraw-Hill Companies All Rights Reserved
11.37Example: Portfolio Expected Returns and Betas (SML)
0%
5%
10%
15%
20%
25%
30%
0 0.5 1 1.5 2 2.5 3
Beta
Exp
ecte
d R
etur
n
Rf
E(RA)
A

McGraw-Hill/Irwin ©2001 The McGraw-Hill Companies All Rights Reserved
11.38
Capital Asset Pricing Model
Market Risk Premium: The slope of the Security Market Line (SML), the difference between the expected return on a market portfolio and the risk-free rate. E(RM) - Rf
the reward for bearing an average amount of systematic riskCapital Asset Pricing Model (CAPM): The equation
of the SML showing the relationship between expected return and beta: E(RA) = Rf + [E(RM) – Rf] x A

McGraw-Hill/Irwin ©2001 The McGraw-Hill Companies All Rights Reserved
11.39
Capital Asset Pricing Model
If we know an asset’s systematic (market) risk, we can use the CAPM to determine its expected return
Example:A stock has a beta of 1.2, the expected return on the
market is 12 percent, and the risk-free rate is 6 percent. What must the expected return on this stock be?
E(RA) = Rf + [E(RM) – Rf] x A
E(RA) = .06 + (.12 - .06) x 1.2 = .132

McGraw-Hill/Irwin ©2001 The McGraw-Hill Companies All Rights Reserved
11.40The CAPM shows that the expected return for a particular asset depends on three things:
The Pure time value of money – measured by the risk-free rate The reward for merely waiting for your money, without
taking any riskThe Reward for bearing systematic risk – measured
by the market risk premium: (E(RM) – Rf) The reward for bearing an average amount of systematic
risk in addition to waiting.The Amount of systematic risk – measured by beta
Market risk
McGraw-Hill/Irwin ©2001 The McGraw-Hill Companies All Rights Reserved
11.41
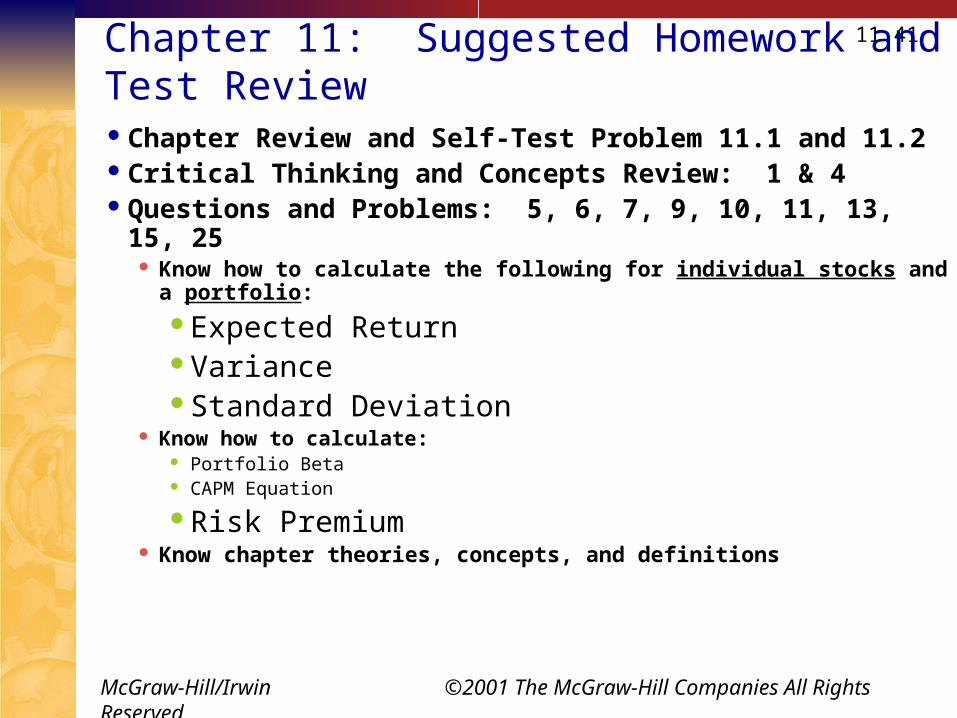
Chapter 11: Suggested Homework and Test Review
Chapter Review and Self-Test Problem 11.1 and 11.2 Critical Thinking and Concepts Review: 1 & 4 Questions and Problems: 5, 6, 7, 9, 10, 11, 13, 15, 25
Know how to calculate the following for individual stocks and a portfolio:
Expected ReturnVarianceStandard Deviation
Know how to calculate: Portfolio Beta CAPM Equation
Risk Premium Know chapter theories, concepts, and definitions