Embed Size (px)
Citation preview

CATALYTIC SYNTHESIS OF NANOCELLULOSE FROM OIL PALM EMPTY FRUIT BUNCH FIBRES
MAZLITA BINTI YAHYA
INSTITUTE OF GRADUATE STUDIES
UNIVERSITY OF MALAYA KUALA LUMPUR
2016Univ
ersity
of M
alaya

CATALYTIC SYNTHESIS OF NANOCELLULOSE FROM OIL PALM EMPTY FRUIT BUNCH FIBRES
MAZLITA BINTI YAHYA
DISSERTATION SUBMITTED IN FULFILMENT
OF THE REQUIREMENTS FOR THE DEGREE OF
MASTER OF PHILOSOPHY
INSTITUTE OF GRADUATE STUDIES UNIVERSITY OF MALAYA
KUALA LUMPUR
2016 Univers
ity of
Mala
ya

iii
UNIVERSITY OF MALAYA
ORIGINAL LITERARY WORK DECLARATION
Name of Candidate: Mazlita binti Yahya
Matric No:HGA140001
Name of Degree: Master of Philosophy
Title of Project Paper/Research Report/Dissertation/Thesis (“this Work”): Catalytic
Synthesis of Nanocellulose from Oil Palm Empty Fruit Bunch Fibres
Field of Study:Chemistry
I do solemnly and sincerely declare that:
(1) I am the sole author/writer of this Work; (2) This Work is original; (3) Any use of any work in which copyright exists was done by way of fair dealing
and for permitted purposes and any excerpt or extract from, or reference to or reproduction of any copyright work has been disclosed expressly and sufficiently and the title of the Work and its authorship have been acknowledged in this Work;
(4) I do not have any actual knowledge nor do I ought reasonably to know that the making of this work constitutes an infringement of any copyright work;
(5) I hereby assign all and every rights in the copyright to this Work to the University of Malaya (“UM”), who henceforth shall be owner of the copyright in this Work and that any reproduction or use in any form or by any means whatsoever is prohibited without the written consent of UM having been first had and obtained;
(6) I am fully aware that if in the course of making this Work I have infringed any copyright whether intentionally or otherwise, I may be subject to legal action or any other action as may be determined by UM.
Candidate’s Signature Date:
Subscribed and solemnly declared before,
Witness’s Signature Date:
Name:
Designation:
Univers
ity of
Mala
ya

iv
ABSTRACT
Currently, Malaysia has substantially increased its reputation as a country developed
for palm-based lignocellulosic biomass. Oil palm biomass is composed of cellulose,
hemicellulose, and lignin. Generally, oil palm biomass can be divided into three
categories: (i) oil palm frond (OPF), oil palm trunk (OPT) and empty fruit bunches (EFB)
fibres. The presence of high cellulose content in oil palm biomass is potentially converted
to nanocellulose, which is a promising bio-polymer that useful for various industrial
applications (personal cares, chemicals, foods, pharmaceuticals and bio-composites).
Objectives of this project are to study the effectiveness of catalytic conversion of oil palm
biomass (EFB) into nanocellulose by using chemical route (inorganic acid: H2SO4 and
inorganic salt: Ni (NO3)2) and also to optimize the nanocellulose yield by study different
reaction parameters (reaction temperature ,reaction time and acidity of catalyst). Finally
the objectives is to determine the physicochemical properties of produced nanocellulose
by using Thermogravimetric Analyzer (TGA) and Derivatives
Thermogravimetric(DTG), X-Ray Diffractometer (XRD), Fourier Transform Infrared
(FTIR), High Resolution Transmission Electron Microscope (HR-TEM), Field Emission
Scanning Electron Microscopy (FESEM), Atomic Force Microscopy(AFM), and Particle
Size Analyzer (PSD) techniques. Nanocellulose was successfully yielded from oil palm
biomass (EFB) via and strong acid hydrolysis (H2SO4) and Ni-salt catalyzed hydrolysis
which annotated as SA-NC and Ni-NC respectively. The mild acid nickel-salt catalyzed
hydrolysis capable to selectively depolymerized amorphous regions of cellulose and
retained its crystalline region, thus improving the crystallinity index of the Ni-NC up to
80.75% compared to SA-NC (73.17%). The FTIR analysis confirmed that the basic
cellulose structure of inorganic Ni-salt and H2SO4 treated products was maintained and
no derivative was formed. Furthermore, FESEM images clearly display that outer layer
(waxes, pectins and fats) of EFB fibres has been removed after pretreatment process. The
Univers
ity of
Mala
ya

v
chemical pretreatment methods was performed followed by acid hydrolysis process to
produce nano-scale dimension (SA-NC and Ni-NC). Chemical pretreatment process was
executed in order to enhance both strong and mild acid hydrolysis process (SA-NC and
Ni-NC). HR-TEM and AFM analyses showed that acid hydrolysis was capable to
depolymerize cellulose micro-chain into average nano-dimensions in fibres length ( < 700
nm) and fibres width dimension (< 50 nm). In addition, PSD results clearly showed the
particle sizes had been reduced from EFB fibres(<5500 nm) to SA-NC and Ni-NC(<90.00
nm). This study concluded that Ni-salts is an efficient and selective catalyst for the
hydrolysis of cellulose with high simplicity in operation as compared to inorganic acid
(H2SO4). Optimization reaction conditions (reaction temperature, reaction time, and
acidity of catalyst) were performed in order to obtain the optimized condition for
nanocellulose production. Based on the reaction model generated from Response Surface
Methodology-Face Central Composite Design (RSM-FCCD), the predicted
nanocellulose yield was 81.40 % (60min, 45 °C, pH 3). Meanwhile, the experimental
value (81.37 %) achieved was reasonably near to the predicted value generated from the
model. It can be concluded that the generated model is near to predictability and close to
precision for the nanocellulose yield in the experimental conditions used. In summary
from the results above, it shows that nanoscale of cellulose (Ni-NC and SA-NC) was
successfully produced, characterized as well as optimized from oil palm biomass (EFB)
via Ni-Salt and H2SO4 catalyzed treatment.
Univers
ity of
Mala
ya

vi
ABSTRAK
Pada masa ini, reputasi Malaysia sebagai sebuah negara maju yang membangunkan
biojisim lignoselulosa berasaskan sawit telah meningkat dengan ketara. Biojisim
lignoselulosa kelapa sawit terdiri daripada selulosa, hemiselulosa dan lignin. Secara
umumnya, biojisim sawit boleh dibahagikan kepada tiga kategori utama: (i) pelepah
kelapa sawit (OPF), batang kelapa sawit (OPT) dan tandan kosong kelapa sawit (EFB).
Kandungan selulosa yang tinggi dalam biojisim kelapa sawit berpotensi untuk
menghasilkan nanocellulosa, iaitu bio-polimer yang berpotensi digunakan dalam
pelbagai aplikasi industri (bahan sediaan jaga diri, bahan kimia, makanan, farmaseutikal
dan bio-komposit). Objektif projek ini adalah mengkaji keberkesanan penukaran biomas
kelapa sawit (EFB) kepada nanoselulosa menggunakan kaedah kimia (asid bukan
organik: H2SO4 dan garam bukan organic: Ni (NO3)2)) serta pengoptimuman hasil
nanoselulosa dengan mengkaji parameter tindakbalas yang berbeza (tindak balas suhu,
masa, keasidan pemangkin). Pada akhir kajian ini, sifat-sifat fizikokimia nanoselulosa
yang berjaya dihasilkan ditentukan menggunakan Termogravimetri Analisis (TGA) dan
Derivatif Termogravimetri (DTG), Pembelauan Sinar-X (XRD), Spektroskopi Sinar
Merah Fourier Transform (FTIR) , mikroskop transmisi elektron beresolusi tinggi (HR-
TEM), mikroskop imbasan elektron pancaran medan (FESEM), mikroskop daya atom
(AFM) dan distribusi saiz zarah (PSD). Nanoselulosa telah berjaya dihasilkan daripada
biojisim kelapa sawit (EFB) melalui hidrolisis bermangkin asid kuat (H2SO4) dan garam
nikel yang dijelaskan sebagai Ni-NC dan SA-NC masing-masing. Garam nikel adalah
asid lemah yang bertindak sebagai pemangkin hidrolisis kerana kemampuannya untuk
menyahpempolimeran(perbuatan) bahagian amorf daripada selulosa serta pada masa
yang sama ia mengekalkan struktur kristalnya, iaitu berlaku peningkatan penghabluran
daripada Ni-NC sehingga 80.75% berbanding SA-NC (73.17%). Analisis FTIR
mengesahkan bahawa struktur organik selulosa yang dirawat menggunakan garam Nikel
Univers
ity of
Mala
ya

vii
dan H2SO4 sebagai pemangkin, berjaya dikekalkan serta tiada terbitan yang terbentuk.
Tambahan pula, imej FESEM jelas memaparkan bahawa imej lapisan luar (lapisan lilin,
pektin dan lemak) EFB biojisim berjaya disingkirkan selepas proses prarawatan. Kaedah
prarawatan kimia dijalankan, diikuti dengan proses hidrolisis berasid untuk
menghasilkan selulosa dengan dimensi berskala nano (SA-NC dan Ni-NC). Kaedah
prarawatan dijalankan bagi meningkatkan kadar proses hidrolisis asid kuat dan lemah
(SA-NC dan Ni-NC). HR-TEM dan analisis AFM menunjukkan bahawa asid hidrolisis
mampu untuk menyahpolimer rantaian panjang serat dan lebar serat selulosa daripada
saiz mikro kepada saiz purata dimensi nano masing-masing <700 nm dan <50 nm. .Di
samping itu, keputusan PSD jelas menunjukkan saiz zarah berkurang daripada EFB
(<5500 nm) kepada SA-NC dan Ni-NC (<90.00 nm). Kesimpulan daripada kajian ini
menunjukkan bahawa garam Nikel adalah mangkin yang berkesan dan terpilih untuk
pengendalian proses hidrolisis selulosa yang lebih mudah berbanding asid bukan organik
(H2SO4). Keadaan optimum tindak balas kimia (suhu tindak balas, masa tindak balas, dan
keasidan pemangkin) telah dijalankan untuk mendapatkan keadaan optimum untuk
penghasilan nanoselulosa. Berdasarkan model tindak balas yang dijana melalui Response
Surface Methodology-Face Central Composite Design (RSM-FCCD), hasil nanoselulosa
yang diramalkan adalah 81.40% (60min, 45 ° C, pH 3). Sementara itu, hasil daripada
eksperimen (81.37%) yang berjaya diperolehi adalah menghampiri nilai ramalan yang
dijana daripada model tersebut. Dapat disimpulkan bahawa nilai model yang dijana
adalah menghampiri nilai ketepatan hasil nanoselulosa yang diperolehi daripada kajian
eksperimen. Secara ringkasnya daripada keputusan diatas, ia menunjukkan bahawa
nanoselulosa (Ni-NC dan SA-NC) telah berjaya dihasilkan, dicirikan dan juga
dioptimumkan daripada biojisim kelapa sawit (EFB) melalui rawatan bermangkin garam
Nikel dan H2SO4 .
Univers
ity of
Mala
ya

viii
ACKNOWLEDGEMENTS
I am deeply grateful to both my supervisors, Dr. Lee Hwei Voon and Proffesor
Sharifah Bee binti Abd Hamid for her detailed and constructive comments, and for her
important support throughout my master. Their understanding, encouraging and personal
guidance have provided a good basis for the present thesis.
My fellow friends from Nanotechnology and Catalysis Research Center (NANOCAT)
should also be recognized for their support. My sincere appreciation also extends to all
my colleagues and others who have provided assistance at various occasions.
The most importantly my beloved parents and family for their support in helping,
giving limitless motivation, warm support in word of wisdom and the sacrifices they made
for me to complete this thesis. Their views and tips are useful indeed. Finally yet
importantly, the most Merciful and the Beneficent, Allah S.W.T for everything He
showered me. Thank you.
.
Univers
ity of
Mala
ya

ix
TABLE OF CONTENTS
Abstract ....................................................................................................................... iv
Abstrak ........................................................................................................................ vi
Acknowledgements .................................................................................................... viii
Table of Contents ......................................................................................................... ix
List of Figures ............................................................................................................. xii
List of Tables ............................................................................................................. xiv
List of Symbols and Abbreviations ............................................................................. xv
List of Equations ...................................................................................................... xviii
CHAPTER 1: INTRODUCTION............................................................................... 1
1.1 Introduction ......................................................................................................... 1
1.2 Problem statement ............................................................................................... 6
1.3 Objectives of Research ........................................................................................ 7
1.4 Scope of Research................................................................................................ 8
1.5 Rationale and Significance ................................................................................... 9
CHAPTER 2: LITERATURE REVIEW ................................................................. 10
2.1 Palm-Based Lignocellulosic Biomass and Architecture of Cellulose .................. 10
2.2 Nanocellulose .................................................................................................... 14
2.3 Conversion of Palm-Based Lignocellulosic Biomass to Nanocellulose ............... 17
2.3.1 Biomass Pretreatment: Isolation of Cellulose Compound ...................... 17
2.4 Isolation of Micro- and Nano-Cellulose from Palm-Based Biomass ................... 22
2.4.1 Chemical Acid hydrolysis ..................................................................... 22
2.4.2 Physical-Chemical Route ...................................................................... 25
2.4.3 Mechanical-Chemical Route ................................................................. 26
Univers
ity of
Mala
ya

x
2.5 Inorganic salt catalyzed mild hydrolysis ............................................................. 30
CHAPTER 3: RESEARCH METHODLOGY ........................................................ 35
3.1 Introduction ....................................................................................................... 35
3.2 Research design ................................................................................................. 35
3.2.1 Raw Material ........................................................................................ 38
3.2.2 Equipment............................................................................................. 38
3.2.3 Chemicals ............................................................................................. 38
3.2.4 Powdering biomass ............................................................................... 39
3.3 Catalytic conversion of lignocellulosic biomass into nanocellulose .................... 39
3.4 Characterization techniques ............................................................................... 40
3.4.1 Fibers characterization .......................................................................... 40
3.4.2 Physiochemical properties characterization ........................................... 42
3.5 Optimization study for nanocellulose production via Response Surface
Methodology (RSM) .......................................................................................... 44
CHAPTER 4: RESULTS AND DISCUSSION ........................................................ 47
4.1 X-Ray Diffraction Analysis ............................................................................... 47
4.2 Fourier Transform Infrared Spectroscopy (FTIR) ............................................... 50
4.3 Field-Emission Scanning Electron Microscopy (FESEM) .................................. 52
4.4 High Resolution Transmission Electron Microscopy (HR-TEM) ........................ 55
4.5 Atomic Force Microscopy (AFM) ...................................................................... 58
4.6 Particle Size Distribution (PSD) ......................................................................... 61
4.7 Thermogravimetric (TG) and Differential Thermogravimetric (DTG) Analysis.. 65
4.8 Optimization study for nanocellulose production via Response Surface
Methodology (RSM) .......................................................................................... 67
Univers
ity of
Mala
ya

xi
CHAPTER 5: CONCLUSION ................................................................................. 80
5.1 Conclusion ......................................................................................................... 80
5.2 Recommendation ............................................................................................... 82
References .................................................................................................................. 84
List of Publications and Papers Presented ................................................................... 93
Univers
ity of
Mala
ya

xii
LIST OF FIGURES
Figure 1.1: Various types of oil palm waste in Malaysia................................................ 2
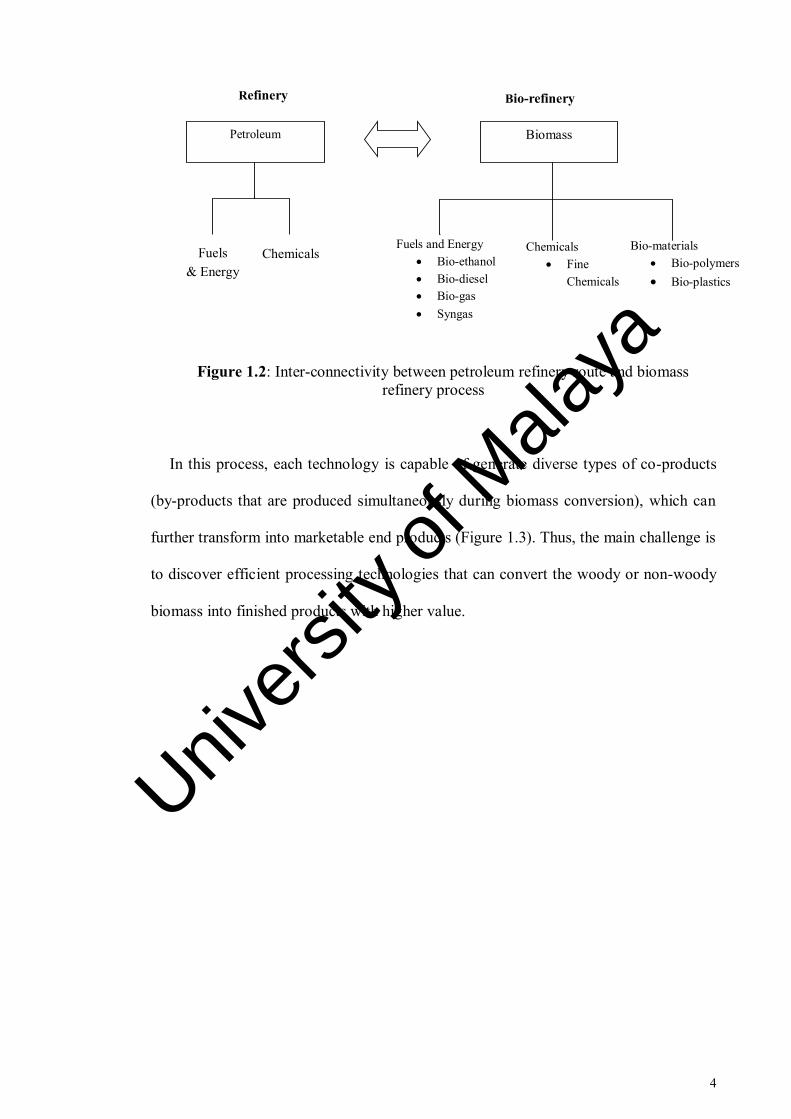
Figure 1.2: Inter-connectivity between petroleum refinery route and biomass refinery process .......................................................................................................................... 4
Figure 1.3: Bio-refinery of lignocellulosic biomass to fuels and chemicals .................... 5
Figure 2.1: Schematic diagram of Lignocellulose Biomass. ......................................... 11
Figure 2.2: Nanocellulose characteristics and applications (Henriksson et al., 2008) ... 16
Figure 2.3: Schematic diagram of biomass pretreatment to unlock biopolymer stored within the plant ........................................................................................................... 18
Figure 3.1: Production of Nanocellulose from Oil Palm biomass ................................. 36
Figure 3.2: Visual observation: (a) Empty Fruit Bunch (EFB) fibres, (b) Cellulose, and (c) Nanocellulose ........................................................................................................ 37
Figure 4.1: X-ray diffraction patterns of (a) EFB fibres (b) EFB derived cellulose, (c) SA-NC, and (d) Ni-NC...................................................................................................... 48
Figure 4.2: FTIR spectra of EFB fibres, EFB derived cellulose, SA-NC and Ni-NC .... 51
Figure 4.3: The morphology of (a) EFB fibres (b) EFB derived cellulose (c) SA-NC and ................................................................................................................................... 54
Figure 4.4: HR-TEM micrographs and particle size distribution profile of (a) SA-NC and (b)Ni-NC .................................................................................................................... 57
Figure 4.5: AFM images and dimention analysis for (a) SA-NC and (b) Ni-NC .......... 59
Figure 4.6: Particle size distribution for (a)EFB fibres, (b)EFB derived cellulose, (c)SA-NC and (d)Ni-NC ....................................................................................................... 64
Figure 4.7: (a) TGA and (b) DTG spectra for EFB fibres, EFB derived cellulose, SA-NC and Ni-NC .................................................................................................................. 66
Figure 4.8: Predicted versus actual nanocellulose yield ............................................... 70
Figure 4.9: Normal probability plots of the residuals (a) and plot of the residuals versus the predicted response (b) ........................................................................................... 71
Univers
ity of
Mala
ya

xiii
Figure 4.10: Effect of acidity of catalyst (A) and reaction time (B) toward nanocellulose yield, reaction temperature =45°C (a)3D response surface plot and (b) 2D Contour plot ................................................................................................................................... 73
Figure 4.11: : Effect of acidity of catalyst (A) and reaction temperature (C) toward nanocellulose yield, reaction time=60mis (a)3D response surface plot and (b) Contour plot ............................................................................................................................. 75
Univers
ity of
Mala
ya

xiv
LIST OF TABLES
Table 1.1: Application of palm-based biomass in Malaysia ........................................... 3
Table 1.2: The physicochemical study of nanocellulose ................................................ 9
Table 2.1: Chemical composition of palm-based biomass (Umar et al., 2013) ............. 11
Table 2.2: Comparison of strength and modulus in commercial fibres and biomass-based cellulose...................................................................................................................... 13
Table 2.3: Advantages and disadvantages of lignocellulosic biomass pretreatment via chemical routes ......................................................................................................... 210
Table 2.4: Summary of nanocellulose production from palm-based biomass ............... 28
Table 2.5: Transition metal salt hydrolysis .................................................................. 34
Table 3.1 Chemical composition of raw EFB fibres, alkali pretreated EFB sample and bleached cellulosic sample .......................................................................................... 40
Table 3.3: Range of independent variables and the experimental domain .................... 46
Table 3.4: The CCD matrix of experimental and yield response .................................. 46
Table 4.1: .Crystallinity Index (Crl) and Crystallite Sizes of EFB fibres, EFB derived cellulose, SA-NC and Ni-NC ...................................................................................... 49
Table 4.2:Dimensional Profile of Prepared Nanocellulose for HR-TEM images .......... 58
Table 4.3: Dimensional Profile of Prepared Nanocellulose for AFM images ............... 59
Table 4.4: ANOVA for nanocellulose yield ................................................................. 69
Table 4.5: (a) Optimization criteria for ideal nanocellulose yield and (b) Results of model validation at the optimum level ................................................................................... 79
Univers
ity of
Mala
ya

xv
LIST OF SYMBOLS AND ABBREVIATIONS
AFM Atomic Force Microscopy
Al(NO3)3 Aluminium Nitrate
BC Bacterial Cellulose
C2H5OH Ethanol
C3H7OH Isopropanol
C6H6 Benzene
C7H8 Toluene
CaCl2 Calcium Chloride
CH3COOH Acetic Acid
CH3OH Methanol
CMC Carboxymethyl Cellulose
C-MCC Commercialized Microcrystalline Cellulose
CNC Cellulose Nanocrystals
CNF Cellulose Nanofibrils
CO Carbon Monoxide
CO2 Carbon Dioxide
CrI Crystallinity Index
DTG Derivatives Thermogravimetric
EFB Empty Fruit Bunches
Fe2(SO4)3 Iron(III) Sulfate
FeCl2 Iron(II) Chloride
FeCl3 Iron(III) Chloride
FESEM Field Emission Scanning Electron Microscopy
FeSO4 Iron(II) Sulfate
Univers
ity of
Mala
ya

xvi
FTIR Fourier Transform Infrared Spectroscopy
H2O Water
H2O2 Hydrogen Peroxide
H2SO4 Sulfuric Acid
H3PO4 Phosphoric acid
HCl Hydrochloric Acid
HPH High Pressure Homogenization
HR-TEM High Resolution Transmission Electron Microscope
KCl Potassium Chloride
KOH Potassium Hydroxide
MCPF Microcrystalline Cellulose Press Fiber
NaCl Sodium Chloride
NaClO2 Sodium Chlorite
NaOH Sodium Hydroxide
NaOH-AQ Sodium Hydroxide-Anthraquinone
NH4OH Ammonium Hydroxide
Ni(NO3)2 Nickel (II) Nitrate
Ni-NC Nanocellulose From Ni-Salt Hydrolysis
OPEFB Oil Palm Empty Fruit Bunch
OPEFB Oil Palm Empty Fruit Bunch
OPF Oil Palm Frond
OPT Oil Palm Trunk
PKC Palm Kernel Cake
PKS Palm Kernel Shell
PSD Particle Size Distribution
RSM Response Surface Methodology
Univers
ity of
Mala
ya

xvii
SA-NC Nanocellulose From Acid Sulfuric Hydrolysis
SEM Scanning Electron Microscopy
SMCA Sodium Monochloroacetate
TEM Transmission Electron Microscope
TGA Thermogravimetric Analysis
XRD X-Ray Diffraction
Univers
ity of
Mala
ya

xviii
LIST OF EQUATIONS
Equation 3.1…………………………………………….......................................... 42
Equation 3.2…………………………………………….......................................... 42
Equation 3.3……………………………………………......................................... 43
Equation 3.4…………………………………………….......................................... 43
Equation 3.5…………………………………………….......................................... 44
Equation 3.6…………………………………………….......................................... 46
Equation 4.1……………………………………………….................................... 51
Equation 4.2……………………………………………......................................... 68
Univers
ity of
Mala
ya

1
CHAPTER 1: INTRODUCTION
1.1 Introduction
To date, transition from fossil-based technology to bio-resource technology is a crucial
alternative seeing that the depletion of fossil fuel reserves and alarming of environmental
problems to the society. Lignocellulosic biomass has become the most potential
renewable feedstock for the chemicals and fuels production. It is defined as a complex
bio-matrix, comprising many different polysaccharides, phenolic polymers and proteins,
excluding a fossil-based resource, which is a non-starch based fibrous part of plant
material that can be valorized into fuel(Agbor et al., 2011) . As one of the largest
producers and exporter of palm oil (approximately 20 MT/year), Malaysia's palm oil
industry leaves behind a huge amount of biomass (46.6 MT) from its plantation and
milling activity (Song et al., 2013). The continuous expand of oil palm plantation area in
Malaysia is concurrent with growing global demand for edible oil applications such as
cooking oil, household products, personal care products, nutrition and transportation fuel
usage. Thus, the amount of palm residues produced also shows a correspondingly increase
from the palm utilization cycle . According to Shuit's case study, one hectare of oil palm
plantation can generate about 50–70 tons of biomass residues from oil palm industry
every year (Shuit et al., 2009). For the whole palm tree, the majority empty fruit bunches
(EFB), palm pressed fibres (PPF), oil palm fronds (OPF), oil palm trunks (OPT), palm
kernel shells (PKS), oil palm leaves (OPL), oil palm roots (OPR) and palm oil mill
effluent (POME) with less commercialization value (Figure 1.1). Minorities of the value
product are palm oil, for edible oil applications such as cooking oil, household products,
personal care products, nutrition and transportation fuel usage (Ng et al., 2012) .
In another way, it can consider that each kg of palm oil, roughly another 4 kg of dry
biomass is produced, which is a third attributed to EFB fibres while two thirds represented
by trunk and frond material (Xiao-shu & Wen-xun, 1992). Up to now, palm biomass is
Univers
ity of
Mala
ya

2
reaching to a large extent without high profit usage, and ultimately, it becomes a
hazardous material to farmers (Ng et al., 2012).
Figure 1.1: Various types of oil palm waste in Malaysia
In normal practice, the oil palm biomass are dumped into open areas, incinerated for
fertilizer usage, applied as pellet fuel for industrial heating, bioelectricity generation and
making pulp for paper and furniture (Table 1.1). However, the biomass burning lead to
greenhouse gas (GHG) emission such as aerosol particles, CO2, CO, volatile organic
compounds and organic halogen compounds (Ng et al., 2012).
Univers
ity of
Mala
ya

3
Basically, oil palm biomass can be converted to a wide range of value-added products
that can be clustered into bio-based chemical, nano-material, biofuel, and as direct fuel
for power generation. Thus, research and development for sustainable technology is
continued in order to select a wise route for biomass bio-refinery, while maintain an
environmental friendly and green process (Ng et al., 2012).
Table 1.1: Application of palm-based biomass in Malaysia
Biomass bio-refinery is numerous types of technologies that able to fractionate
biomass into different separated products for bio-based industry (fuels, power, heat, and
value-added chemicals) via thermo-chemical (gasification, pyrolysis), physico-chemical
(chemical synthesis), biochemical or biological (fermentation) conversion and separation.
It is a similar concept with today's petroleum refinery, where various types of petroleum
fractionation yielded for fuel and chemical synthesis (Figure 1.2).
Palm biomass Industrial application References EFB Cigarette paper and
bound paper(writing) (Rosnah et al., 2010; Singh et al., 2013; Sulaiman et al., 2011)
PKS Industrial burner, road Tar, and activated carbon
(Shinoj et al., 2011; Sulaiman et al., 2011)
OPT
Plywood (blackboards)
Saw wood ( furniture)
(Khalil et al., 2012; Shinoj et al., 2011; Sulaiman et al., 2011)
OPT, EFB and PKS
Energy (Shinoj et al., 2011; Sulaiman et al., 2011)
PKS Briquettes (Khalil et al., 2012; Shinoj et al., 2011)
Univers
ity of
Mala
ya
4
Figure 1.2: Inter-connectivity between petroleum refinery route and biomass refinery process
In this process, each technology is capable of generate diverse types of co-products
(by-products that are produced simultaneously during biomass conversion), which can
further transform into marketable end products (Figure 1.3). Thus, the main challenge is
to discover efficient processing technologies that can convert the woody or non-woody
biomass into finished products with higher value.
Biomass
Refinery Bio-refinery
Fuels & Energy
Chemicals Fuels and Energy
Bio-ethanol Bio-diesel Bio-gas Syngas
Chemicals Fine
Chemicals
Bio-materials Bio-polymers Bio-plastics
Petroleum
Univers
ity of
Mala
ya

5
Products: Lignin,hemicellulose and cellulose
Products: Sugar,nanocellulose
Products: Briquette
Chipping And
Milling
Densification and Drying
Separation: Alkaline Organosolvent Ionic liquid
Acid
Chemical Treatment
Direct combustion
and cofiring
Oil Palm Biomass Thermo-chemical
Pretreatment Physical
Treatment
Pyrolysis
Liquefaction
Products: Heat and steam
(turbine)
Gasification
Products: Sugar,nanocellulose
Products: Hydrocarbon bio derived
liquefaction oil, hydrogen, methanol
Products: Hydrogen, olefin
oils, gasoline, diesel
Biological Treatment
Anaerobic
Fermentation
Products: Bio-ethanol, bioplastics
Products: Bio-gas
Products: Plywood and saw wood
Figure 1.3: Bio-refinery of lignocellulosic biomass to fuels and chemicals
Univers
ity of
Mala
ya

6
1.2 Problem statement
Lignocellulosic biomass (EFB) mainly composed of cellulose, hemicellulose and
lignin, which are categorized into carbohydrate and aromatic polymer that contributed to
various applications based on its composition. Among the bio-components presented in
oil palm biomass, cellulose is the primary structural building block of trees, which can be
extracted for pulp and paper industry. Cellulose is a polymeric carbohydrate that contains
many monosaccharide units covalently bonded to each other. This polymer is a linear
chain of anhydro-glucose monomer units connected through 1,4 β-linkages. The compact
structure of cellulose mainly contributed by the linkage of intra- and inter-hydrogen
bonds, which creating a spectacular mechanical strength to protect the plant
structure(Lindman et al., 2010).
Lately, cellulose in nanodimension has been getting attention by various industries due
to its superior characteristic as a green polymer nanomaterial. The major advantages of
nanocellulose are including excellent mechanical strength, non-toxic and
biodegradability and high availability to diverse surface functionalities for different
applications. With all these superior properties, nanocellulose has a great potential in
applications such as strength enhancers in paper, as additives to composites, polymer
reinforcement, films and barrier coating, water treatment, oxygen barriers for food
packaging, electronics, cosmetic, pharmaceuticals and biomedical devices (e.g. scaffolds
in tissue engineering, artificial skin and cartilage, wound healing and vessel substitutes)
(L. Brinchi et al., 2013; Alain Dufresne, 2013).
To produce nanocellulose from lignocellulosic biomass, the complexity of the biomass
structure needs to be ruptured so that the accessibility of cellulose in the plant fibres can
be increased for depolymerisation process (Kumar et al., 2009). Ideally, chemical
treatment is the most crucial route to obtain nanoscale cellulose from the complex
Univers
ity of
Mala
ya

7
biomass. Various methods have been used to produce nanocellulose material from
lignocellulosic biomass, this included acid, alkali, organosolv and ionic liquid treatment
(Kumar et al., 2009; H. V. Lee, S. B. A. Hamid, et al., 2014). During biomass
pretreatment process, the used of KOH solution make polymers (lignin, hemicellulose
and cellulose) swelling, which partially breaking of inter- or intra hydrogen bonding from
biomass structure occurred. The less ordered biomass structure lead to an increment of
the active surface area (increase the number of available hydroxyl group) and accessibility
to solvents for further hydrolysis process. Conventionally, acid sulfuric (H2SO4) or acid
hydrochloric (HCl) were used for depolymerisation processing which acid will be the
hydrolytic cleave, the glyosidic linkages between the two anhydroglucose units,
dissolving the cellulose amorphous region and increase cellulose crystallinity (Morais et
al., 2013). However, a large amount of toxic waste water from the washing process has
raised the environmental issues such as generation of acid rains pollutes the ground water
and destroys aesthetic value. Thus, introduction of inorganic salt such as Ni-based catalyst
offer an integrated approach of chemical techniques for the controlled structured
degradation of natural cellulose into nanocellulose, which promote more reliable methods
in degradation of cellulose into nanocellulose. As a conclusion, nanocellulose preparation
via chemical route (Ni-salt) is potentially gives profits to Malaysia thus giving greener
solution in generating nation profits.
1.3 Objectives of Research
1. To study the effectiveness of catalytic hydrolysis for the conversion of oil palm Empty
Fruit Bunch biomass (EFB) into nanocellulose by using chemical route (inorganic
acid: H2SO4 and inorganic salt: Ni (NO3)2).
2. To optimize the nanocellulose yield by studying different reaction parameters
(reaction temperature, reaction time and acidity of catalyst).
Univers
ity of
Mala
ya

8
3. To determine the physicochemical properties of the produced nanocellulose by using
Thermogravimetric Analyzer (TGA) and Derivatives Thermogravimetric(DTG), X-
Ray Diffractometer (XRD), Fourier Transform Infrared (FTIR), High Resolution
Transmission Electron Microscope (HR-TEM), Field Emission Scanning Electron
Microscopy (FESEM), Atomic Force Microscopy(AFM), and Particle Size Analyzer
(PSD) techniques.
1.4 Scope of Research
The intention of this project was addressed to the process of cellulose extraction from
EFB fibres and nanocellulose preparation from EFB derived cellulose. Furthermore, an
effective process for nanocellulose preparation was developed by comparing inorganic
acid (H2SO4) and inorganic salt (Ni(NO3)2) catalyzed hydrolysis process. In order to
achieve the objectives of the study, the scope of research was discussed as follows:
1. Catalytic conversion of oil palm biomass into nanocellulose.
Extraction of cellulose from EFB fibres
Preparation of nanocellulose using chemical route (Ni-salt and H2SO4 catalyzed
hydrolysis).
2. Optimization study by using Response Surface Methodology (RSM)
Reaction temperature (⁰C)
Reaction time (min)
Acidity of catalyst (pH)
3. Physicochemical study of produced nanocellulose
The produced cellulose and nanocellulose products will be washed several times with
deionized water and dry in freeze drier for further analysis. The properties of treated
product were analyzed as Table 1.2:
Univers
ity of
Mala
ya

9
Table 1.2: The physicochemical study of nanocellulose
Analyzer Function Thermogravimetric Analyzer (TGA) and Derivatives Thermogravimetric(DTG)
Analyze thermal stability of samples
Fourier Transform Infrared (FTIR) Identify chemical functional group of samples
High Resolution Transmission Electron Microscope (HR-TEM)
Analyze the morphology of samples (size distribution, nanocellulose dimensions and the surface structure).
Atomic Force Microscopy(AFM) Field Emission Scanning Electron Microscopy (FESEM) X-Ray Diffractometer (XRD)
Analyze the chemical characteristic, crystallinity index and crystallite size (nm)
Particle Size Analyzer (PSD)
Profiling particle size distribution
1.5 Rationale and Significance
Based on the research scopes mentioned above, the following rationale and
significance of the research study was outlined as below:
Effectiveness of inorganic salt (Ni (NO3)2) as a hydrolysis catalyst to
selectively convert cellulose into nanocellulose under mild reaction condition.
High yield of nanocellulose derived from EFB under optimized conditions
(reaction time, temperature, acidity of catalyst).
High quality of nanocellulose features (narrow particle size distribution, higher
aspect ratio, better thermal stability) was obtained by using inorganic salt
catalyzed hydrolysis route.
Univers
ity of
Mala
ya

10
CHAPTER 2: LITERATURE REVIEW
2.1 Palm-Based Lignocellulosic Biomass and Architecture of Cellulose
Palm-based lignocellulose resourse is abundantly available in Malaysia, which
composed majority of cellulose biopolymer. It consists of a defensive inner framework
which contributed to the hydrolytic stability, structural robustness of plant cell walls and
its resistance to microbial degradation. Generally, palm biomass can be divided into three
main categories: (i) Oil palm frond (OPF), oil palm trunk (OPT) and empty fruit bunches
(EFB). These biomass consist primarily of three biopolymers: cellulose (~30-50 % by
weight), hemicelluloses (~19-45 % by weight), lignin (~15-35 % by weight) and a small
amount of protein content (Table 2.1) (Umar et al., 2013).
This chemical compositions of a lignocellulosic fiber are varied according to the
species, growing conditions, fiber arrangement and many other factors (Khalil et al.,
2012). The presence of cross-link between the cellulose and hemicellulose with lignin via
ester and ether linkages lead to the biomass recalcitrance (Figure 2.1) (Bozell et al., 2011;
Himmel et al., 2007; Lange, 2007). Today, the biomass's hierarchical structure no longer
holds any secrets. Each valuable biopolymer can be extracted with high recovery for
various usage especially biofuel, biochemical and advance material. Lignin is an
amorphous heteropolymer network of p-coumaryl, coniferyl and sinapyl alcohol that
linked together by different bonding. This complex structure makes lignin to act as a
physical barrier of the plant cell wall as it is rigid, insoluble in water, impermeable,
resistance to microbial attack and oxidative stress.
Extraction of lignin (delignification) is an important process to cause biomass
swelling, disruption of lignin structure, increase in internal surface area, and increase
accessibility of hydrolysis reaction (Doherty et al., 2011; Scheller & Ulvskov, 2010).
Univers
ity of
Mala
ya

11
Table 2.1: Chemical composition of palm-based biomass (Umar et al., 2013)
Oil Palm biomass chemical composition (wt%) Composition EFB OPF OPT Cellulose 43-65 40-50 29-37 Hemicellulose 17-33 34-38 12-17 Holocellulose 68-86 80-83 42-45 Lignin 13-37 20-21 18-23 Xylose 29-33 26-29 15-18 Glucose 60-66 62-67 30-32 Ash 1-6 2-3 2-3
Figure 2.1: Schematic diagram of Lignocellulose Biomass.
Valorization of lignin plays a crucial role for the production of renewable fuels (power,
fuel pellets, and syngas), bio-based material (composite, carbon fibres) for cements
additive, asphalt additive, feed binder. Furthermore, large quantities of poly-aromatic
structure make this compound to serve as a future aromatic source for the green chemicals
(vanillin, phenols, building block for polymer such as polyester and polyurethanes) (de
Wild et al., 2009) .
Univers
ity of
Mala
ya

12
Hemicellulose is the second most abundant polymer that composed polymers of
pentoses (xylose, arabinose), hexoses (mannose, glucose, and galactose) and acetylated
sugars. It is stored within plant cell wall and coated on cellulose fibrils where pretreatment
severity must be control carefully to maximize sugar recovery, and avoid over
degradation of products that inhibit a further process such as furfural (Zhang et al., 2013).
The typical industrial applications of hemicellulose include barrier materials for food
packaging or biopolymers with new properties. Xylan with large molecular weight and
high affinity to cellulose always is the best choice as strengthening agent in paper and
bio-composite. Furthermore, modification of xylan can make self-supporting barrier films
for food packaging (Mikkonen & Tenkanen, 2012). Cellulose is an organic compound
from polysaccharide family with the formula of (C6H10O5)n, which consist of a linear
chain of D-glucose units that linked by ß-1,4 glycosidic bond, with a degree of
polymerization of approximately 10,000 for cellulose chains in nature and 15,000 for
native cellulose cotton (Azizi Samir et al., 2005). Generally, cellulose always exits in two
major forms, which is cellulose I (native cellulose-original from plants in its natural form)
and cellulose II (regenerated from cellulose 1 under chemical treatment)(Dumitriu, 2004;
Eichhorn et al., 2005). The properties of cellulose bio-polymer are unique in terms of its
mechanical properties (strength, stiffness, and dimensional stability), thermal stability,
chemical resistance, surface appearance, optical properties and electrical conductivity.
The presence of strong mechanical strength of cellulose is due to the formation of
hydrogen bonding, which strongly affect the multi-scale microfibrillated structure and
hierarchical organization (crystalline vs. amorphous regions) (Dumitriu, 2004; Lindman
et al., 2010). Table 2.2 showed the comparison of strength and modulus in between
commercial fibres and wood-based cellulose, where bio-cellulose show similar tensile
strength as glass fiber (given their lower density), although are not as strong as either
aramid or carbon fibres(Khalil et al., 2012) . Thus from Table 2.2,it can be concluded that
Univers
ity of
Mala
ya

13
cellulose fiber is a potential candidate for the application of textiles, alternative green
reinforcing material for polymers such as glass, carbon and aramid fibres, or talc.
Table 2.2: Comparison of strength and modulus in commercial fibres and biomass-based cellulose
Material Modulus (GPa)
Density (Mg m-3)
Specific Modulus (GPa/ Mg-1 m3)
References
Aluminium 69 2.7 26 (Ashby & Jones, 2013)
Steel 200 7.8 26 (Ashby & Jones, 2013)
Glass 69 2.5 28 (Eichhorn et al., 2010)
Crystalline cellulose
138 1.5 92 (Eichhorn et al., 2010)
Alumina 350 3.8 92 (Eichhorn et al., 2010)
Kevlar 29 1.44 83 58 (Peng et al., 2011)
Kevlar 49 1.44 124 86 (Peng et al., 2011)
Kevlar 149 1.47 179 122 (Peng et al., 2011)
Twaron 1.44 80 56 (Peng et al., 2011)
Twaron High Modulus(HM)
1.45 124 86 (Peng et al., 2011)
Carbon fiber 1.68 221 132 (Peng et al., 2011)
Univers
ity of
Mala
ya

14
2.2 Nanocellulose
Despite being the most available natural polymer on earth, it has been only recently
that cellulose has gained prominence as a nanostructured material. Increment of
petroleum prices, high energy intensity of chemicals and polymers production, together
with market sustainability trend have motivated the exploitation of nanostructured
cellulose, e.g. crystalline nanocellulose (CNC), cellulose nanofibrils(CNF) and bacterial
cellulose (BC). The growing attention is related to their unsurpassed quintessential
physical and chemical features. The major advantages of nanocellulose are the excellent
mechanical strength, non-toxic, biodegradable, broad availability with various
functionalities. Like the characteristic of cellulose, the nanoscale of this biopolymer
changes dramatically. It is stronger than steel, stiffer than Kevlar® (with specific Young's
modulus 65 Jg-1 for microfibrils and 85 Jg-1 for nanocrystals)(Wu et al., 2007), high
elasticity, lighter in weight, conductive, extremely absorbent and so on(Dufresne, 2012;
Wu et al., 2007) . With all these superior properties, nanocellulose has great potential in
applications such as strength enhancers in paper, as additives to composites, polymer
reinforcement, in emulsions, films and barrier coating, water treatment, as oxygen
barriers for food packaging, electronics, cosmetic, pharmaceuticals and biomedical
devices (e.g. scaffolds in tissue engineering, artificial skin and cartilage, wound healing
and vessel substitutes)(Dufresne, 2012; Peng et al., 2011) (Figure 2.2).
With advance conversion and separation technologies, the hierarchy biomass structure
can be unlocked and integrated into bio-based nanoproducts. Biomass pretreatment is an
important step to enhance the efficiency of nanocellulose preparation step. Generally the
pretreatment step is carried out before acid hydrolysis process.The pretreatment process
breaks down the tangled network structure of lignocelluloses to make cellulose fibrils
accessible for further hydrolysis to nanostructure. Cellulose fibres are formed by several
groups of macrofibril, which generated from bundle groups of microfibril (diameter at 5-
Univers
ity of
Mala
ya
15
50 nm and length in micrometers) that was connected by approximately of 36 individual
cellulose molecule chains via hydrogen bonding (Eichhorn et al., 2005; Khalil et al.,
2012; Peng et al., 2011). The structures of microfibrils cellulose are arranged randomly
into amorphous (disordered) and crystalline (highly ordered) regions. Crystalline
celluloses are stiff as compared to amorphous phases, this is because the polysaccharide
chain packed together with strong intra- and inter-molecular hydrogen bond network.
Thus, the weak amorphous regions in cellulose microfibrils easily break down into shorter
crystalline part when lignocellulosic biomass subjected to depolymerization treatment
such as mechanical shearing, chemical or enzymatic treatment (Beck-Candanedo et al.,
2005).
The depolymerisation process of microfibrillated cellulose will produce cellulose
nanocrystals (CNCs) or it can be named as microcrystals, whiskers, nanoparticles,
microcrystallites, nanofibres, or nanofibrils. Nanocellulose can be produced by palm
biomass-derived cellulose sources and the chemical methods for the preparation of
nanofibres will be deliberated later. Nanocellulose can be categorized to BC, CNC and
CNF (Xu et al., 2013).
BC is a product of microbes’ primary metabolic processes(Dufresne, 2013) .
Generally, BC is produced by acetic acid bacteria in both synthetic and non-synthetic
medium through oxidative fermentation process. Due to high cost and low yield of BC
production, there is limited number of industrial production of BC and its commercial
application as compared to CNC and CNF(Esa et al., 2014).
Univers
ity of
Mala
ya

16
Figure 2.2: Nanocellulose characteristics and applications (Henriksson et al., 2008)
CNCs are needle-like cellulose crystals of 10−20 nm in width and several hundred
nanometres in length. It composed high purity of crystalline phase of cellulose, where
non-cellulosic content and amorphous cellulose are eliminated (Xu et al., 2013). CNFs
formed long flexible fibre networks with both fibril diameters longer and crystallinity
lower than CNCs. It contains a large amount of amorphous cellulose, while surface
morphologies and dimensions of CNF can vary substantially, depending on the degrees
of fibrillation and any pre-treatment involved (Xu et al., 2013).
Univers
ity of
Mala
ya

17
2.3 Conversion of Palm-Based Lignocellulosic Biomass to Nanocellulose
2.3.1 Biomass Pretreatment: Isolation of Cellulose Compound
Generally, the biomass recalcitrance is mainly due to the presence of highly complex
phenolic polymer lignin, which resists degradation of polysaccharides from plant cell
wall, and thus reduces the accessibility to cellulose. Hence, removal of lignin is the key
processing step during the extraction of cellulose fibres. In chemical pretreatment, non-
cellulosic components (lignin and hemicellulose) need to be dissolved from the
lignocellulose and subsequently separated from the production process. However, the fact
that non-linear polymer lignin is built in chemically diverse and poorly reactive linkages,
which require costly and harsh pretreatment to degrade this component. The major
influences on the operation costs are involved the reduction of lignocellulose particle size
and subsequent depolymerisation process. Thus, effectively overcoming the biomass
recalcitrance structure and releasing the locked polysaccharides is the crucial task for the
emerging of nanocellulose industries.
The biomass pretreatment is aimed to reduce the degree of polymerization of cellulose
(glucose congregated forming a polymer molecule) by breaking the lignocellulosic
complex, solubilized the lignin and hemicellulose, increase porosity and surface area of
hidden cellulose, and reduce the crystallinity of cellulose (Paulien Harmsen et al.,
2010).This fractionation process makes the cellulose accessible to hydrolysis reaction and
improves depolymerisation of the cellulose chain into nano-dimension (Figure 2.3)
(Kumar et al., 2009)
Univers
ity of
Mala
ya

18
Figure 2.3: Schematic diagram of biomass pretreatment to unlock biopolymer stored within the plant
The biomass pretreatment process is categorized into three main classes in terms of
pH: (i) Acidic; (ii) Alkaline and (iii) Neutral (Organosolv and ionic liquid
treatments)(PFH Harmsen et al., 2010). However, most of the processes suffer from
unsatisfactory separation of cellulose and lignin, where over-degradation lead to the
formation of by-product (polysaccharide is changed to sugars rather than nanocellulose).
Furthermore, the usage of severe reaction conditions (high temperature and pressure)
makes the operation cost higher and increase the investment risks, as larger capital
investments are required compared to pulp and paper manufacturing (PFH Harmsen et
al., 2010). Therefore, a suitable biomass pretreatment technology with the aims of mild
reaction condition and effective at cellulose recovery is highly targeted in order to
decrease utility consumption, lower down energy demand, rmazeduce capital cost, and
reduce sugar degradation (PFH Harmsen et al., 2010).
The advantages and disadvantages of chemical processes for lignocellulosic biomass
pretreatment were shown in Table 2.3. It is crucial to indicate that different type of
Acetal linkages
Lignin
Hemicellulose
Degradation of cellulose
(amorphous region)
Breaking of acetal linkages
Rupture of hemicellulose
Hemicellulose
Solubilisation of lignin
Cellulose Fibrils
Univers
ity of
Mala
ya

19
chemicals functioning selectively in the biomass separation process. Although the main
goal of pretreatment is to acquire a good quality cellulose product, it is important to
preserve the structure of lignin and hemicellulose as well. The best way to maintain high
recovery of lignin for value-added chemical process is organosolv treatment, which
minimal degradation of aromatic compounds can be observed. Other than solvent process,
alkaline route with the presence of oxidation agent is another potential route to remove
lignin (major) and hemicellulose (minor) with minimum formation of inhibitors,
especially during fermentation sugar to bioethanol. In case of direct acid treatment, a
controllable amount of acid is the key point to solubilize cellulose and hemicellulose
compounds to sugar products. However, it is unsuitable to be used for fractionation of
cellulose as high recovery of cellulose in required for further nanocellulose synthesis.
Ionic liquid treatment is another green process that fit well into the cellulose isolation
with high recovery of all bio-compounds; however, using ionic liquid for biomass
pretreatment is not economically friendly as it is expensive in cost.
Univers
ity of
Mala
ya

Table 2.3: Advantages and disadvantages of lignocellulosic biomass pretreatment via chemical routes
Chemical Mode of Action Advantages Disadvantages/limitation Remarks References Dilute Acid
H2SO4, H3PO4 Removal of hemicellulose
1. Higher reaction rates 2. Increase the accessibility of cellulose
1. Presence of fermentation inhibitors 2. High cost, expensive construction material due to acidic environment.
Minimal degradation of lignin and hemicellulose. (Zheng et al., 2013)
Concentrated Acid
H2SO4, H3PO4
Solubilisation of hemicellulose and direct hydrolysis of cellulose to glucose.
1.Suitable to all types of biomass
1.Uncontrolled hydrolysis products
Saccharification of biomass
(Sathitsuksanoh et al., 2012)
Alkaline
NaOH, CaOH
1. Removal of lignin (major) 2. Removal of hemicellulose 3. Cellulose swelling
1. High solubilisation of lignin 2. Low fermentation inhibitors formed
1. High cost of chemical 2. Alteration of lignin structure
Suitable for direct fermentation
(McIntosh & Vancov, 2010)
20
Univers
ity of
Mala
ya

Chemical Mode of Action Advantages Disadvantages/limitation Remarks References Organosolvent
Mixture of organic solvent and water
1. Extraction of lignin 2. Complete solubilisation of hemicellulose
1. High quality lignin that is low molecular weight and sulphur free. 2. Organic solvent used can be recycled and reused. 3. Size reduction of biomass feedstock is not necessary. 4.Selective pretreatment method
1. High cost of chemicals 2. Containment vessels to prevent leakage of volatile organic solvents.
Suitable for producing a high quality lignin for specialty chemical
(Cybulska et al., 2012)
Ionic Liquid
Imidazolium salts
1. Extraction of lignin 2. Decrease the cellulose crystalinity index 3. Carbohydrate dissolution
1. IL is high thermal stability and low volatility 1. High cost of chemicals.
The effects towards hemicellulose and lignin are depending on the nature of ionic liquid used.
(Fu & Mazza, 2011)
Oxidative
H2O2
1. Solubilisation of lignin. 2. Bleaching effect to the pulp
1. High removal of lignin 2. Increase biomass digestibility
1. High costs of chemicals. Bleaching effect to the biomass, hemicellulose might be degraded
(Correia et al., 2013)
21
Univers
ity of
Mala
ya

22
2.4 Isolation of Micro- and Nano-Cellulose from Palm-Based Biomass
There are various approaches were reported for micro- and nano-cellulose synthesis,
it can either in chemical, biological fermentation, mechanical, physical or mixed
processes (Table 2.4) (Saratale & Oh, 2014).
2.4.1 Chemical Acid hydrolysis
Generally, acid hydrolysis is the leading process for nanocellulose isolation. The acid
hydrolysis involves depolymerization of the cellulose chain by hydrolytically cleavage
the glyosidic bond between two anhydroglucose units. The cellulose depolymerization
occurs randomly and uncontrollable, where acid tends to attack amorphous cellulose as
compared to the crystalline region, resulted in the formation of non-uniform sizes of CNC
(L. Brinchi et al., 2013). Furthermore, different cellulosic material also possesses a
diverse dimension of crystalline to an amorphous region. Therefore, the nanocellulose
obtained has an enormous variety of nano-scale dimension. The nanocellulose is high in
crystallinity index (Crl) (Saratale & Oh, 2014) based on X-ray diffraction analysis, and
Transmission Electron Microscope (TEM) or High Resolution Transmission Electron
Microscope (HR-TEM) can show a rigid rod –like particle or whisker like structure.
By using sulfuric acid (H2SO4) for hydrolysis process, the intra- and inter-hydrogen
bonds were broken and lead to the formation of sulfate coated cellulose complex.
Hydrolyzing cellulose with H2SO4 involves esterification of hydroxyl groups, which
generated acid half-ester or cellulose sulfate in nanocellulose product. The presence of
sulfate groups on the surface of nanocellulose results in negatively charged surfaces
above acidic pH. The surface of nanocellulose with negative charge will lead to anionic
stabilization, where repulsion forces of electrical double layers able to prevent
aggregation of nanocellulose driven by hydrogen bonding (Saratale & Oh, 2014). In
Univers
ity of
Mala
ya

23
addition, mechanical treatment (sonication) sometime used to enhance the disintegration
of cellulose structure into nanocrystalline form (J. Li et al., 2015).
In the year of 1999, researcher had reported that large content of cellulose was
successfully isolated from empty fruit bunches by using acid hydrolysis with removal of
0.9%- 6.6% of lignin and 11.9-17.3% of hemicellulose (Sun et al., 1999). Wattaya's team
further reduced the size of cellulose to microcystalline cellulose (MCC) in order to apply
as reinforce material with rice starch film. The cellulose was extracted from palm pressed
fiber through alkaline treatment using 10% of sodium hydroxide (NaOH) under 100ºC
for 1 hr, followed by bleaching process via sodium chlorite (NaClO2). The bleached pulps
were then hydrolysed using H2SO4 (64%) at 45ºC for 4 hr prior to sonicate for 15min.
The excess H2SO4 remained in suspension was neutralized with 0.5 M of NaOH and
further washes via dialysis process. Based on the SEM analysis, the microcrystalline
cellulose press fiber (MCPF) rendered dimension of 0.480±0.023 µm (Wittaya, 2009).
Similar works were done by Hafiz et al. (2013) and Battisya et al. (1950) (Mohamad
Haafiz et al., 2013). Oil palm empty fruit bunch (OPEFB) was hydrolysed by 2.5 N of
hydrochloric acid (HCl) at 105°C for 30 min with the pulp to liquor ratio of 1:20. After
completion of acid hydrolysis, sample was washed several times before proceed to
neutralization by ammonium hydroxide (NH4OH). The dried MCC was then ground into
fine powder by using rotary ball miller. The crystalinity index for OPEFB-MCC is 87%,
which is higher as compared to OPEFB (80%) and commercialized microcrystalline
cellulose (C-MCC) (79%). This indicated that the amorphous region of cellulose was
removed by acid hydrolysis and remained individual crystallite phases. The crystalinity
is directly proportional to cellulose rigidity, thus this showed that OPEFB-MCC consisted
of higher mechanical properties. SEM analysis for OPEFB pulp, OPEFB-MCC and C-
MCC was reported by Hafiz's group. The morphology of OPEFB-pulp showed individual
Univers
ity of
Mala
ya

24
and uniform fibres indicated that hemicellulose and lignin had been removed, while
OPEFB-MCC and C-MCC rendered aggregated, irregular shaped fibrils with rough
surface.
Bono et al. (2009) selected palm kernel cake (PKC) as the initial feedstock for cellulose
extraction (Bono et al., 2009). The cellulose was further functionalized into
carboxymethyl cellulose (CMC), which was useful in anti-caking agent, emulsifier,
stabilizer, dispersing agent, thickener, and gelling agent. PKC was first grind into smaller
particles (600 µm) in order to ease the pretreatment process by increase the biomass
accessibility to chemicals. Furthermore, soxhlet extraction using isopropanol (C3H7OH)
was performed to enhance the chemical attack by removes the coating layers (wax, lipids,
fats) (Cunha et al., 2004)on the biomass surface. The bounded hemicellulose and lignin
were later solubilised by NaOH and NaClO solution, respectively. Final CMC sample
was substantially produced via alkalization (NaOH), followed by esterification of
cellulose using sodium monochloroacetate (SMCA). The slurry was soaked in methanol
(CH3OH) for overnight and neutralized using 10% acetic acid (CH3COOH) until pH 6-8
(Bono et al., 2009).
Other than MCC, some of the study was continued to push forward the synthesis of
nanocellulose. Fahma et al., (2010) was successfully produced nanocellulose from oil
palm empty fruit bunches (OPEFB) via acid hydrolysis (Fahma et al., 2010). As similar
to other's studies, OPEFB was mashed into 0.5-1 cm, followed by dewaxing process via
soxhlet extraction using ethanol (C2H5OH ) and benzene (C6H6) with the ratio of 1:2,
respectively. The process continued by delignification with NaClO2 (pH 4-5) under 70 ºC
for 1 h, while hemicellulose was removed using 6% potassium hydroxide (KOH) at 20
ºC for 24 h. The cellulose fibres were subsequently stored in a refrigerator for further
process. Nanocellulose suspension was later hydrolysed by 64 % of H2SO4 for 15, 30, 60,
Univers
ity of
Mala
ya

25
and 90 min, and the reaction was immediately terminated by using cold water to prevent
over hydrolysis of cellulose into sugar. The particle sizes of nanocellulose under different
treatment time were studied by SEM analysis, where the results are 2.51 ± 1.03, 2.05 ±
0.95, 2.05 ± 0.89, and 1.96 ± 0.85 nm, respectively. The crystalinity index (CrI) of
nanocellulose with 15 min treatment showed highest index (58.78 ± 0.70%), followed by
30, 60 and 90 min (53.83 ± 2.03%) (Fahma et al., 2010). Generally, acid will easily
attacked amorphous region as compared to crystalline region of cellulose, this increased
the crystalinity index of product after mild acid treatment. When drastic hydrolysis
condition (high concentration of acid and longer treatment time) was applied, both
amorphous and crystalline region would partially destroy. This is the reason of the
crystalinity of nano-fibre tend to decrease as acid continuously attack the crystalline part
of cellulose. For Souza's group, nanowhiskers cellulose was derived from pressing
mesocarp oil palm fibres via similar chemical process (NaOH-H2O2-H2SO4) (Souza et
al., 2013).The nanocellulose product render the length (L) of 171.76 ± 14.91 nm while
the diameter (D) is average of 5.48 ± 0.48 nm, with aspect ratio (L/D) of 35.35 ± 3.37
(Souza et al., 2013)
Although acid hydrolysis is efficiently to depolymerise cellulose into nanocellulose,
however, controllable concentration of acid and treatment time are important to achieve
higher yield of nanocellulose with high crystalinity index.
2.4.2 Physical-Chemical Route
Physical-chemical treatment was proposed by Yan's group for nanocellulose synthesis
(Yan et al., 2009)Palm Kernel Cake (PKC) was initially pretreated under hot liquid
oxidation process, where water (H2O) was used as a mild acid agent at temperature of
160-180 ºC under saturated vapourpressure for 30 min (Yan et al., 2009). In this reaction,
the biomass undergoes an explosive decompression, where hemicellulose was degraded
Univers
ity of
Mala
ya

26
(yielding a dark brown material) to organic acid and saccharides, resulted in lignin matrix
disruption (Paulien Harmsen et al., 2010; Ramos, 2003). The cellulose extraction was
continued by using the same method (hot water oxidation on treated PKC) in the presence
of chemical (30 % of H2O2) for 600-1440min at temperature of 60-80°C. The maximum
yield of nanocellulose (45 %) was obtained within 600min of reaction under 75 ᴼC (Yan
et al., 2009).
2.4.3 Mechanical-Chemical Route
Conversion of empty fruit bunches (EFB) to nanocellulose was performed by
chemical-milling techniques in Jonoobi's study (Jonoobi et al., 2011). The EFB fibres
was treated by sodium hydroxide-anthraquinone (NaOH-AQ), followed by oxidation by
NaClO2 and CH3COOH hydrolysis reaction(Jonoobi et al., 2011). These pulping and
bleaching processes are used to preserve the cellulose structure, while selectively
solubilize the lignin and hemicellulose in the fibres (Jonoobi et al., 2011). During pulping
process, NaOH-AQ acted as a pre-swelling agent, which increases the accessibility of the
core cellulose for hydrolysis action. The oxidation agent (NaClO2) and acid agent
(CH3COOH) were selectively penetrated into fibres to oxidized lignin and cleave the
glyosidic bond of cellulose, respectively (Kalia et al., 2011). Mechanical treatment was
subsequently performed by using mechanical grinder and high pressure homogenization
(HPH) treatment. The grinding process allows the cellulose to refine uniformly, and HPH
treatment reduced the particle sizes of cellulose due to the presence of cleavage energy
derived from homogenization pressure to break down the fibres bonding(Jonoobi et al.,
2011; Kalia et al., 2011).
Univers
ity of
Mala
ya

27
Table 2.4 showed the summary of nanocellulose production from palm-based biomass.
Based on the overall studies, it is concluded that chemical route is important to unleash
nanocellulose from complex biomass.
Univers
ity of
Mala
ya

Table 2.4: Summary of nanocellulose production from palm-based biomass
Raw material
Final product Chemicals Temperature
(°C) Time (min)
Product yield (%) Crystalinity index Particle sizes (L & D)
(2)/ aspect ratio (L/D) (3) References
Chemical Route
OPEFB MCC 2.5 N HCl 105 ± 2 30 N/A Pulp (80%)
50µm (Mohamad Haafiz et al., 2013)
MCC (87%) C-MCC (79%)
5 % NH4OH
CMC C3H7OH 82.4
67% N/A N/A (Bono et al.,
2009) (Soxhlet) 7.5% NaOH 25 60
PKC
CH3COOH and NaClO2 75 120
95% C2H5OH and D.I
C3H7OH 17.5% NaOH 30 60 SMCA 50 120
OPEFB
CNF C2H5OH:C6H6 80.1 2880 18.46 -91.89 53.83-58.97 1.96-2.51nm (Fahma et al., 2010)
NaClO2 70 60
KOH 20 60 H2SO4 45 15, 30,
60,90
Oil palm fibres NC NaOH 80 120 min N/A 70.90% 35.35 ± 3.37 (Souza et
al., 2013) H2O2 and NaOH 55 90 min. H2SO4 60% 45 150 min Palm pressed fiber MCC NaOH 45 60 15.00-
40.00% N/A 0.480+0.023µm
NaCl H2SO4 (175 ml, 64%) 45 240 NaOH
28
Univers
ity of
Mala
ya

Raw material
Final product Chemicals Temperature
(°C) Time (min)
Product yield (%) Crystalinity index Particle sizes (L & D)
(2)/ aspect ratio (L/D) (3) References
Physical chemical route Palm kernel Cellulose Hot water treatment 160-180 30 45% N/A N/A 6gram grinded PKC
and 300ml distilled water filled inside micro pressure reactor
(Yan et al., 2009)
C2H5OH(washing)
2 gram of pretreated PKC was mixed with 30% H2O2
60-80 600-1440
Mechanical chemical route
EFB CNF Chemical treatments 160 105 Cellulose: 91 ±1 (%) EFB fibres (40%)
(Jonoobi et al., 2011; Kalia et al., 2011)
NaOH 70 180 Hemicellulose: 4± 1(%)
bleached pulp fibres (61%)
NaOH-AQ (12%+1%) 160 105 Lignin: 1.0 ± 0.5(%) Nanofibres (69%)
NaCIO2and CH3COOH (1.25%+3%) 70 180
NaOH and H2O2 (1.5%+1%) 70 90 NaCIO2 and CH3COOH (1.5%+3%) 70 90
Physical treatment Grinding 15 High Pressure Homogenization 500 bar (pressure)
29
Univers
ity of
Mala
ya

30
Currently, researchers and scientists had improved the chemical process by applying
mechanical or physical treatment, in order to bring significant performance with the
concern of higher selectivity of the product, energy saving and cost effectiveness.
Although physical and mechanical treatments showed high improvement of the
conversion process, unfortunately, it requires longer treatment time as compared to acid
hydrolysis reaction, which a maximum of 180min was used for the nanocellulose
synthesis as compared to acid treatment. Thus, greener nanocellulose preparation route
was developed in order to overcome the limitation of current technologies
2.5 Inorganic salt catalyzed mild hydrolysis
Generally, nanopolymeric cellulose can be isolated via biological hydrolysis (enzyme)
or chemical acid hydrolysis (strong acid) of the glycosidic bonds of cellulose fibres (L
Brinchi et al., 2013). However, isolation techniques are still problematic because of the
presence of strong intra- and intermolecular hydrogen bonding and van der Waals forces
linking the cellulose fiber network. This highly organized bonding can create a defensive
barrier to protect the plant structure (Lindman et al., 2010).
The enzymatic hydrolysis of lignocellulosic materials requires several days to digest
the structural barriers before the hydrolysis process. In the case of strong acid treatment,
hydronium ions can efficiently break down or attack intermolecular and intramolecular
bonds in cellulose. This treatment is more effective in comparison to enzymatic treatment.
However, the use of a strong acid is usually accompanied by over-degradation of cellulose
and has drawbacks such as equipment corrosion. Thus, diluted or organic acids have been
suggested for milder reactions, but such treatments have been found to be less effective
in reacting to the plant's structure (H. Lee et al., 2014). Inorganic salts in the categories
of trivalent (FeCl3, Fe2(SO4)3, Al(NO3)3), divalent (CaCl2, FeCl2, FeSO4), and
monovalent (NaCl, KCl) have been considered by others as potential catalysts for
Univers
ity of
Mala
ya

31
hydrolysis treatment for several purposes: i) degradation of hemicellulose and cellulose
in biomass (Kamireddy et al., 2013; Liu et al., 2009; López-Linares et al., 2013; Zhao et
al., 2011a); ii) conversion of cellulose to glucose (Zhang et al., 2015); and iii) extraction
of micro- or nano-crystalline cellulose (Hamid et al., 2014; Jinbao Li et al., 2015; Lu et
al., 2014). It has been reported that the valence state of metal ion is the key factor to
influence the hydrolysis efficiency, where acidic solution (H+) was generated during
polarization between metal ions with water molecules (Kamireddy et al., 2013). A higher
valence state will generate more H+ ions, which act effectively in the co-catalyzed acid
hydrolysis reaction in the presence of metal ion.
At present, acid hydrolysis of cellulose is still considered to be the most efficient
pathway for high-yield nanocellulose production. To achieve a technically feasible,
selective, and controllable hydrolysis process, a transition metal-based catalyst can be
used because of its mild acidity. Transition metal-based catalysts, such as an iron-based
catalyst, were found to contain Lewis acid sites and can perform the hydrolysis of
cellulose efficiently (H. Lee et al., 2014). Iron metal-based catalyst with its Lewis acid
site is potentially to perform as catalyst for acid hydrolysis. Several studies reported that
this catalyst could increase hydrolysis rate for biomass fractionation and nanocellulose
preparation. Iron-based inorganic salts eg: FeCl3 and Fe2(SO4)3 had been selected as
catalyst to accelerate the degradation of hemicellulose in corn stover. Based on the study,
FeCl3 significantly increased the hemicellulose degradation in aqueous solutions under
temperature of 140- 200⁰C with high xylose recovery (∼90% ) and low cellulose
removal(<10%,). The hemicellulose removal increased 11-fold when the corn stover was
pretreated with 0.1 M FeCl3 as compared to pretreatment with hot water under the same
conditions, which was 6-fold greater than pretreatment with dilute H2SO4 at the same pH
(Liu et al., 2009).
Univers
ity of
Mala
ya

32
This fact was supported by Liu’s group (Liu & Wyman, 2006), where FeCl3 treatment
significantly increases the hemicellulose (xylose and xylotriose) degradation at 180⁰C.
The result showed that 0.8% of FeCl3 with acid pH of 1.86 rendered 3-fold and 7-fold
greater of xylose and xylotriose degradation, respectively, than that for treatment with
dilute H2SO4 with similar pH value. The study suggested that different mechanism may
exist for the reaction; first, the presence of FeCl3 may induce the formation of H+ ion from
water for hydrolysis; second, FeCl3 may catalyze the dehydration of carbohydrates. Other
than FeCl3, FeSO4 catalyst also showed strong hydrolysis effects on the pretreatment of
corn stover, where hemicellulose significantly degrades to xylose (60.3%) with high
recover of cellulose (89.8%) under temperature of 180⁰C within 20 min. According to
Zhao et al. (Zhao et al., 2011b), FeSO4 pretreatment is capable of disrupting the ester
linkages between cellulose and hemicellulose. It is a potential pretreatment that is able to
enhance further hydrolysis reaction of lignocellulosic biomass by destructing chemical
composition and altering structural features. In acid hydrolysis, proton (H+ from HCl or
H2SO4) plays an important role to weaken the glycosidic bond energy by attracting
electron, making it easier for bone rupture.
The presence of inorganic metal ions also play same function as proton, which consist
of more positive charge to pair with more electrons, but proton can only pair with one
electron. This fact was in agreement with the studies above, where FeCl3 (trivalent, Fe3+)
rendered better hydrolysis effect than FeSO4 (divalent, Fe2+), while acid solution
performed less effect as compared to inorganic salts (Yan et al., 1996).
Lately, researchers started to use transition metal based catalyst (FeCl3) for preparing
cellulose nanocrystal (CNC) via hydrolysis of cellulose. The results show that 22% of
CNC was produced under 10% FeCl3, temperature of 110⁰C for 60 min, and ultrasonic
time of 180 min. The CNC produced are shaped rod-like with the diameter of 20–50 nm,
Univers
ity of
Mala
ya

33
the length of 200–300 nm, and crystallinity of 76.2%(Lu et al., 2014). The research
findings indicate that Fe3+ from the FeCl3-catalyzed hydrolysis can selectively diffuse
into the amorphous regions of cellulose and promote the cleavage of glycosidic linkages
of cellulose chains into smaller dimensions. Furthermore, the presence of an acidic
medium (HCl) or ultrasonic-assisted treatment can act synergistically to improve the
accessibility of metal ions for the hydrolysis process (Karim et al., 2014; Jinbao Li et al.,
2015; Lu et al., 2014).
Abd Hamid’s group reported that the cellulosic fiber extracted from palm tree trunk
were successfully converted into more valuable products that is MCC by using FeCl3
treatment. The result show that under response surface methodology (RSM) optimized at
97.98°C,4hr,0.8M of FeCl3. The crystallinity index of MCC yielded was 68.66%(Abd
Hamid et al., 2014). Yahya’s group were successfully prepare nanocellulose from MCC
via Ni-salt catalyzed hydrolysis pathway under mild reaction conditions of 45°C for 15
min(Yahya et al., 2015). The mild acid Ni-salt catalyzed hydrolysis was able to
selectively depolymerized the amorphous regions of cellulose and retain its crystalline
region thus improving the crystallinity of the treated product up to 80%. Furthermore, the
synthesized Ni-treated nanocellulose products appeared in the form of cluster fragments
with spider-web-like appearance (fiber diameter of 10 to 60 nm and fiber length of 300
to 600nm).Thus, this study concluded that nickel-based inorganic salt is an efficient and
selective catalyst for the hydrolysis of MCC with high simplicity in operation and short
preparation time. Table 2.5 summarizes all the study from the previous researchers of
converting biomass into valuable products via transition metal salt hydrolysis.
Univers
ity of
Mala
ya

Table 2.5: Transition metal salt hydrolysis
Feedstock Catalyst Acidity Operation condition Final product References Corn stover FeCl3 pH 1.68 0.1M FeCl3,
140⁰C, 20 min
91% removal hemicellulose 91% recovery of cellulose
(Liu et al., 2009)
Hemicellulose compounds: xylose
and xylotriose
FeCl3 pH 1.86 0.8% of FeCl3, 180⁰C, 20 min
65% degrade of xylose, 78% degrade of xylotriose
(Liu & Wyman, 2006)
Corn stover FeSO4 N/A 0.1 mol/L FeSO4, 180⁰C, 20 min
10% FeCl3,110⁰C
60.3% degrade of hemicellulose,
89.8% recovery of cellulose 22% CNC
(Zhao et al., 2011b)
Cellulose FeCl3 N/A 60min of reaction time, 180 min of ultrasonic time
Diameter = 20–50 nm, Length of 200–300 nm,
crystallinity index = 76.2%
(L.Q. Lin, T. L. Rong, Y.H. Juan et
al.,2014)
Cellulose Zn-Ca-Fe based
nanocatalyst
N/A 160⁰C,12hr, 140⁰C 29% of glucose (Zhang et al., 2011)
Palm tree trunk (PTT)
FeCl3 N/A 0.8M FeCl3,97.98⁰C,4hr Crystallinity index=68.66% (Abd Hamid et al., 2014)
MCC (Ni(NO3)2 pH5.0-6.3 1.0M,0.5M and 0.05M (Ni(NO3)2
45°C for 15 min
Nanocellulose Diameter=10nm-60nm Length=300nm-600nm
(Yahya et al., 2015)
34
Univers
ity of
Mala
ya

35
CHAPTER 3: RESEARCH METHODLOGY
3.1 Introduction
This section includes raw material, apparatus and equipment, research design and
research procedure. It describes the experimental procedures to develop a separation
technology in order to prepare nanocellulose from EFB fibres.
3.2 Research design
The process flow of this experiment is shown in Figure 3.1 for the Preparation of
Nanocellulose from Oil Palm Biomass (EFB) via Chemical Route. There are three
sections in this project which has been elaborated more in the below which a step-by-step
account of procedure included:
Univers
ity of
Mala
ya

36
Palm based biomass (EFB)
Biomass pretreatment: Fractionation of cellulose Solubilized hemicellulose and lignin
Cellulose Characterization
Nanocellulose synthesis:
Nanocellulose Characterization
Optimization study (Reaction temperature (⁰C), reaction time(mins) and acidity of
catalyst (pH))
Physicochemical study of synthesized nanocellulose
Soxhlet extraction: Alkaline Oxidation
NO
YES
Hydrolysis route Strong acid
hydrolysis (H2SO4)
Transition metal salt reaction (Ni(NO3)2)
YES
NO
YES
Figure 3.1: Production of Nanocellulose from Oil Palm biomass
Univers
ity of
Mala
ya

37
Figure 3.2: Visual observation: (a) Empty Fruit Bunch (EFB) fibres, (b) Cellulose, and (c) Nanocellulose
(a)
EFB fibresat sizes of 150 µm
(before mashed)
EFB fibres (Before mash)
Pretreatment (Delignification and bleaching)
(b)
Depolymerisation of cellulose via (Ni (NO3)2.6H2O) /H2SO4
catalysed hydrolysis (c)
Nanocellulose (Gelatinous white
nanocellulose)
Nanocellulose suspension Univ
ersity
of M
alaya

38
3.2.1 Raw Material
Empty Fruit Bunch (EFB) fibres were supplied from Malaysian Palm Oil Board
(MPOB) (Figure 3.2a)
3.2.2 Equipment
Equipment Model Grinder machine Daihan, HCP-750A Magnetic stirring hotplate Thermolyne, Cimarec hotplate stirrer pH meter Mettler Toledo, FE20 Orbital shaker Lab Companion,SI-300R Freeze drier Labconco,75408-00 Sonicator Daihan, WUC-A03H Sieve shaker Endecotts EFL, 2000
3.2.3 Chemicals
Chemical Supplier Toluene (C7H8) R&M Chemical. Ethanol (C2H7OH) R&M Chemical. Nickel (II) Nitrate Hexahydrate (Ni(NO3)2.6H2O) Systerm Hydrogen peroxide (H2O2) (35%) R&M Chemical. Sulfuric acid (H2SO4)(97%) R&M Chemical.
Univers
ity of
Mala
ya

39
3.2.4 Powdering biomass
The Oil Palm Fiber (EFB) was collected from Malaysian Palm Oil Board (MPOB)
Bandar Baru Bangi Selangor. It was then milled, sieved and separated in smaller sizes
using a grinder and test sieve shaker (Endecotts EFL, 2000). This grinding process was
carried out to make sure the size of EFB fibres is in similar size (100-150 µm) for further
treatments.
3.3 Catalytic conversion of lignocellulosic biomass into nanocellulose
(i) Extraction of cellulose from Empty Fruit Bunch (EFB) biomass
Figure 3.1 and 3.2 clearly showed the process flow and visual observation for the
production of nanocellulose respectively from EFB fibres. Empty Fruit Bunch (EFB)
biomass was mashed and sieved to EFB powder (150 µm of particle sizes) prior for
soxhlet extraction treatment. Under soxhlet extraction, the EFB fibres was immersed into
mixture of toluene (C7H8) and ethanol (C2H7OH) with a ratio of 2:1 for 360 min as
mentioned in literature studies (Abe & Yano, 2009; Agbor et al., 2011; Fahma et al.,
2010; Iwamoto et al., 2007). The dewaxed EFB fibres was aged in 2 M Potassium
Hydroxide (KOH) and then bleached by 10 % (v/v) of hydrogen peroxide (H2O2) solution
at 75 °C for several times by using orbital shaker. The process was stoped when the
sample color turn into pearl white from brown colour. The extracted cellulose slurry
(named as cellulose derived EFB fibers) was rinsed for few times with deionized water
until it reached neutrality (pH6-pH7). The chemical composition of EFB fibres, alkali
pretreated and bleached cellulose sample is enlisted in Table 3.1.
Univers
ity of
Mala
ya

40
Table 3.1 Chemical composition of raw EFB fibres, alkali pretreated EFB sample and bleached cellulosic sample
EFB Fiber Sample Holocellulose (%)
Cellulose (%)
Hemicellulose (%)
Lignin (%)
Wax (%)
Raw EFB Fiber 18.0 48.4 30.4 18.1 3.1 Alkali Pretreated EFB
44.75 65.4 20.7 13.9 -
Cellulose derived EFB
95.27 97.38 2.11 0.51 -
(ii) Preparation of CNC cellulose
Productions of nanocellulose from EFB-derived cellulose will be prepared by chemical
route: inorganic acid:H2SO4 (Strong acid) and inorganic salt:Ni-salt solution (mild acid).
Cellulose was added into prepared Ni-salt solution and H2SO4 respectively at 45 O C within
15 mins duration. After hydrolysis, the gelatinous white product was washed repeatedly
by using deionized water to remove the residue of H+,SO42−, Ni2+ or NO3
− ions that
attached on the surface of product. Then the gelatinous white nanocellulose were dialyze
for a week until the pH is constant (pH 7) to ensure that the H+,SO42− , Ni2+ or NO3
−ions
have been removed. The slurry was further treated with 40 kHz sonication for 40 min in
a sonicator (WUC-A03H, DAIHAN, Korea) to disperse the nanofibres in water. Finally,
the products were dried in a freeze dryer to obtain a fine white powder from H2SO4 (SA-
NC) and Ni-salt (Ni-NC) hydrolysis.
3.4 Characterization techniques
3.4.1 Fibers characterization
The composition of extractives, cellulose, holocellulose, hemicellulose and lignin of
the samples (EFB fibres, alkaline pretreated EFB and cellulose derived EFB) was
analyzed according to Technical Association of Pulp and Paper Industry (TAPPI)
standards.
Univers
ity of
Mala
ya

41
Holocellulose content
The holocellulose content (𝛼-cellulose and hemicellulose) of the fibres and cellulose
was determined by treating the fibres and cellulose with a NaClO2 and 10 %( v/v)
CH3COOH mixture solution (Schuerch, 1968). The sample was diluted in distilled water
under magnetic agitation (70ᴼC, 30min). Then, NaClO2 and 10 %( v/v) CH3COOH
mixture solution were added. This procedure repeated for 3 hour reaction. Finally, the
resultant mass was filtered and oven dried at 100ᴼC untill the mass is constant. The
content of holocellulose was calculated according to Equation 3.1. MH represent dry of
mass fibres (g), MHOLO is dry mass of holocellulose (g) and (%) PHOLO is the content of
holocellulose(Schuerch, 1968).
Equation 3.1:
PHOLO (%) = MHOLO/MH x 100%
𝜶-cellulose content
The 𝛼-cellulose content was determined by treating the extracted holocellulose
samples with 17.5 %(v/v) NaOH solution(Technical Association of the & Paper, 1973).
After 3.5min, soak the sample with CH3COOH. Lastly, the resultant mixture was filtered
and oven dried for 24hour at 48ᴼC±2. Put in desiccator for 15min (Technical Association
of the & Paper, 1973). The content of 𝛼-cellulose was calculated according to Equation
3.2. MC represent dry mass of 𝛼-cellulose (g), WHOLO is extracted holocellulose samples
(g) and (%) PCELLULOSE is the content of 𝛼-cellulose.
Equation 3.2:
PCELLULOSE (%) =MC/WHOLO x 100%
Univers
ity of
Mala
ya

42
Lignin determination
The lignin content of the fibres and cellulose was found by treating them with a
72(%) v/v H2SO4 solution (15min,2hr) (Technical Association of the & Paper, 1973).
Then, distilled water were added under reflux. Finally, the samples was oven dried at
100ᴼC until constant mass was attained. The content of lignin was defined in Equation
3.3; where MF is the dry mass of fibres (g), ML is the mass of dry lignin (g) and PLIGNIN
(%) is the content of lignin in the sample.
Equation 3.3:
PLIGNIN (%) = ML / MFx100%
Hemicellulose determination
The hemicellulose content was obtained by subtracting the percentage of 𝛼-cellulose
from holocellulose content (Joaquim et al., 2009; Lai & Idris, 2013a). PCELLULOSE (%) is
the 𝛼-cellulose content (Equation 3.2) and PHOLO(%) is the holocellulose content
(Equation 3.1). PHEMI (%) is the percentage of hemicellulose content (Equation 3.4).
Equation 3.4:
PHEMI (%) = PCELLULOSE (%) - PHOLO (%)
3.4.2 Physiochemical properties characterization
X-Ray diffraction (XRD)
XRD patterns were obtained within a 2θ range from 5 to 40° by using Shimadzu
diffractometer model XRD 6000, with CuKα radiation at the operating voltage of 2.7 kW.
The crystallinity index (CrI) of samples was calculated based on the intensity between
(002) and (101) lattice diffraction peaks using Segal’s method (Segal, Creely, Martin, &
Conrad, 1959) (Equation 3.5). I002 represents both crystalline and amorphous region of
Univers
ity of
Mala
ya

43
cellulose (maximum intensity at 2θ = 22°) while Iam represents only amorphous phase
(intensity of diffraction at 2θ = 18ᴼ):
Equation 3.5:
CrI (%) = (I002-Iam)/I002 ×100%
Fourier Transform Infrared Spectroscopy (FTIR)
FTIR was performed by using Perkin Elmer spectrometer (Spectrum Two) in the
range 4000-500cm-1 with a scanning resolution of 4cm-1. Ground samples were mixed
with potassium bromide (KBr) and then pressed into ultra-thin transparent pellets
(approximately 4mm thickness) for analysis.
High Resolution Transmission Electron Microscopy (HR-TEM)
The dimensional measurements were determined by using HR TEM JEOL JEMP-
2100F at an acceleration voltage of 200kV. The CNF samples diluted in ethanol
(C2H6OH) solution was deposited on the surface of copper grid and allowed to dry at
room temperature. Aspect ratios in terms of length to diameter (L/D) of treated samples
were determined based on the HR-TEM measurement.
Field Emission-Scanning Electron Microscopy (FESEM)
The surface morphology were studied by using FESEM, Fei Quanta 200F and
operated at 10 kV and 100 Paunder low vacuum conditions. The samples were mounted
with conductive carbon tape and coated with 5nm thickness of gold before FESEM
viewing process.
Univers
ity of
Mala
ya

44
Thermogravimetric analysis (TGA)
Thermal analysis were studied by using TGA Q-500 (TA Instruments,United States
of America). 1 mg of each sample was heated at 10°C/min from 25°C to 900°C under
nitrogen (N2) gas at the flow rate of 200mL/min.
Atomic Force Microscopy (AFM)
In order to prevent the formation of aggregates, a short sonication (30minutes) were
done. A drop of dilute samples (EFB fibres,EFB derived cellulose,SA-NC and Ni-NC)
suspensions were deposited onto glass slides. After dried at ambient temperature
(24hours) to allow the films to dried, AFM observation were carried out using a Bruker’s
ScanAsyst Mode technology.
Particle Size Distribution (PSD)
The nanocellulose suspension at 4% (w/v) was diluted in water at the ratio of 1:100
(v/v) and ultrasonicated for 30 min in an ultrasonic bath (WUC-A03H, DAIHAN, Korea).
Measurements were made using a Malvern 3600 Zetasizer NanoZS (Malvern
Instruments, UK). This equipment uses dynamic light scattering to measure the diffusion
of particles moving under Brownian motion, and converts this to size and size
distribution.
3.5 Optimization study for nanocellulose production via Response Surface
Methodology (RSM)
The nanocellulose synthesis was developed and optimizes using response surface
methodology (RSM) provided by Design expert software 6.0.8 (Stat-Ease Inc.,
Minneapolis,USA). A standard RSM design tool known as Face Central Composite
Design (FCCD) was applied to study the acid catalyzed hydrolysis reaction variables (Ni
salt catalyzed reaction). Three identified independent variables are A: acidity of catalyst
Univers
ity of
Mala
ya

45
(pH), B: reaction time (minute) and C: reaction temperature (⁰C). The response chosen
was nanocellulose yields (%) which were obtained from the reaction. Table 3.1 lists the
ranges and the levels of the independent variables with actual and coded levels of each
parameter. The independent variables are coded to two levels namely: low (-1) and high
(+1). A three level, three factor face central composite design was develop to fit second
order response surface model which require 20 experiments including 8 factorial, 6 center
and 6 axial at the center points were employed in this study.
The experiment result obtained from FCCD was analyzed using response surface
methodology. The second order polynomial equation variables for prediction of the
optimal point between the response variable (nanocellulose yield, %) and the independent
variables of hydrolysis reaction is expressed by Equation 3.6 where Y is the predicted
response; n is the number os experiments; βo, βi, βii and βij are regression coefficients
for constant, linear, quadratic and interaction coefficient, respectively; Xi and Xj are the
coded independent variables or factors.
Equation 3.6:
Y=β0+∑ 𝛽𝑖𝑋𝑖𝑛𝑖=1 +∑ 𝛽𝑖𝑖 × 𝑋𝑖2𝑛
𝑖=1× 𝑋𝑖+∑ ∑ 𝛽𝑖𝑗 × 𝑋𝑖𝑛
𝑗>1 𝑋𝑗 𝑛
𝑖=1
The quality of fit for the reaction model was studied by the coefficients of variances
(R2) and its regression coefficient significant (analysis of variances (ANOVA)) were
determined with Fisher’s test (F-test). Response surfaces and contour plots were plotted
using the quadratic polynomial equation obtained from regression analysis of experiment
by keeping one of the independent variables at a constant value while changing the other
two variables.
Univers
ity of
Mala
ya

46
Table 3.2: Range of independent variables and the experimental domain
Factor Name Units Low
Actual High
Actual Low
Coded High
Coded
A Acidity
of catalyst pH 2 4 -1 1
B Reaction time mins 20 100 -1 1
C Reaction
temperature °C 25 65 -1 1
Table 3.3: The CCD matrix of experimental and yield response
Type
A: Acidity of
catalyst(pH)
B: Reaction
time (min)
C: Reaction
temperature (°C)
Response (Yield %)
Factorial 2 20 25 40.55 Factorial 4 20 25 40.61 Factorial 2 100 25 19.91 Factorial 4 100 25 33.62 Factorial 2 20 65 60.01 Factorial 4 20 65 56.82 Factorial 2 100 65 50.15 Factorial 4 100 65 62.26
Axial 2 60 45 60.95 Axial 4 60 45 72.1 Axial 3 20 45 70.54 Axial 3 100 45 66.41 Axial 3 60 25 63.91 Axial 3 60 65 82.21 Center 3 60 45 79.89 Center 3 60 45 80.92 Center 3 60 45 83.51 Center 3 60 45 82.91 Center 3 60 45 80.54 Center 3 60 45 80.55
Univers
ity of
Mala
ya

47
CHAPTER 4: RESULTS AND DISCUSSION
The present study was divided into three sections: (i) First section is the extraction of
cellulose from palm based lignocellulosic biomass (EFB); (ii) Preparation of
nanocellulose from the EFB derived cellulose via acid hydrolysis reaction (H2SO4 and
Ni-salt hydrolysis);(iii)Optimization study for nanocellulose preparation. The
physicochemical properties of raw material, intermediate cellulose and final product were
also been investigated. The physicochemical properties of the EFB derived cellulose and
nanocellulose included the particle size distribution, crystallinity index, chemical
functional group, morphology and thermal stability study which will be discussed in this
chapter.
4.1 X-Ray Diffraction Analysis
Figure 4.1 shows the XRD profiles of EFB fibres, EFB derived cellulose and SA-NC
and Ni-NC. All samples exhibited similar XRD patterns at diffraction peaks of 2𝜃 = 15°,
16°, 22.8°, and 35°, which can be attributed to the crystallographic planes (101), (10 ),
(021), (002), and (040) respectively (Park et al., 2010). According to French (2014), the
main contributors of intensity to the three main peaks for cellulose Iβ have miller indices
of (1-10),(110) and (200) (French, 2014). Furthermore, the main crystal structure of
cellulose derived EFB was retained and do not altered during the sulfuric acid and Ni-salt
catalyzed hydrolysis process.
Based on the crystallinity profile (Table 4.1), the crystallinity index of samples was in
the order of EFB fibres < EFB derived cellulose < SA-NC < Ni-NC. The increase in
crystallinity index of treated samples showed a significant removal of amorphous regions
and increased exposure of the crystalline regions of cellulose (Dhepe & Fukuoka, 2008).
Univers
ity of
Mala
ya

48
As for industrial applications, crystallinity of nanocellulose is an important factor
determining its mechanical and thermal properties. Higher crystallinity in nanocellulose
is generally associated with higher tensile strength, which is expected to be beneficial for
producing high-strength composite materials (Bhatnagar & Sain, 2005).
10 20 30 40 50 60 70 80
040101
EFB fibres
EFB derived cellulose
SA-NC
Inte
nsity
(a.u
.)
2theta
Ni-NC
10 002
Figure 4.1: X-ray diffraction patterns of (a) EFB fibres (b) EFB derived cellulose, (c) SA-NC, and (d) Ni-NC
As shown in Table 4.1, the crystallite size was increased after hydrolysis, following
the order of EFB fibres < EFB derived cellulose < SA-NC < Ni-NC. Similar cases in
which the crystallite size was increased have been reported (Das et al., 2010; Sèbe et al.,
2012; Shahabi-Ghahafarrokhi et al., 2015). It is believed that the cellulose with smaller
crystallites with disorderly phases were easily degraded by Ni-solution, which resulted in
high exposure of thicker crystallite phases (Sèbe et al., 2012). Furthermore, the
Univers
ity of
Mala
ya

49
recrystallization of defective crystallites during the hydrolysis reaction may change the
crystallite sizes of nanocellulose (Tang et al., 1996).
Table 4.1: .Crystallinity Index (Crl) and Crystallite Sizes of EFB fibres, EFB derived cellulose, SA-NC and Ni-NC
Sample 2θ(º) FWHM (ᴼ) Crystallite size, D (nm) (perpendicular to 200 plane)
Crystallinity index, Crl
(%) EFB fibres 22.14 4.00 2.00 46.04
EFB derived cellulose 22.19 3.29 2.43 68.35
SA-NC 22.41 2.03 3.94 73.17 Ni-NC 22.81 0.8600 9.44 80.75
Mild inorganic acid hydrolysis (Ni-salt) able to enhance the hydrolysis selectivity of
nanocellulose compared to strong inorganic acid hydrolysis (H2SO4). The reason is that
Ni2+ capable to diffuse into the amorphous region and surfaces of crystalline region of
cellulose fibres, and disrupt the intermolecular hydrogen bonds and intramolecular
glyosidic bonds of cellulose, which leads to physical swelling with the chemical
degradation of cellulose. Swelling of the cellulose will increase the contact area between
acids and cellulose, thus enhances the hydrolysis performances. Under mild acid
hydrolysis conditions (Ni-salt inorganic acid), the rate of cellulose hydrolysis is relatively
low because only a selective amount of the amorphous nanocellulose was degraded into
sugar. This explains of higher nanocellulose yield from Ni salt inorganic acid hydrolysis
compared to strong inorganic H2SO4 hydrolysis. The possible mechanism is that metal
ions such as Ni2+ able to dissociate into complex ions in aqueous solvent such as water.
They form coordinate covalent bond with six water molecules. The nomenclature of
metals ions ligand complexes is given as [M (H2O) n] Z+ (where M is the metal ion, z is
the cation oxidation state and n is solvation number). Six water molecules form
monodentate ligands with the central metal cation. The central metal cation polarizes
(withdraws electron density) from the water molecules. This makes the hydrogen atoms
Univers
ity of
Mala
ya

50
in O-H bonds more electropositive. The complex ions [M(H2O)n]Z+ are then deprotonated
by hydroxonium ions H3O+ causing the solution to be acidic. This phenomenon can be
explained using Ni2+ cation as an example (shown in Equation 4.1). This process
continues until there is no charge on the metal complex.
Equation 4.1:
Ni(NO3)2)+ 6H2O ⇋ [Ni(H2O)6]2+ + 2NO3− (4.1.1)
[Ni (H2O)6]2+ + H2O ⇋ [Ni (H2O)5 (OH)]+ + H3O+ (4.1.2)
[Ni (H2O)6]+ + H2O ⇋ [Ni (H2O)5 (OH)] + H3O+ (4.1.3)
Due to the formation of sophisticated metal ions (Equation 4.1.1 to 4.1.3), more H3O+
was produced. Therefore, the concentration of H3O+ was increased due to the presence of
metal ions. Thus, the results clearly showed that different metal ions concentration (pH)
gives differences in nanocellulose yield.
4.2 Fourier Transform Infrared Spectroscopy (FTIR)
The chemical functional groups of EFB fibres, EFB derived cellulose, SA-NC and Ni-
NC were studied using FTIR analysis (Figure 4.2). The four samples had similar FTIR
patterns, which indicated that the chemical structure of synthesized nanocellulose
remained unchanged after H2SO4 and Ni-catalyzed hydrolysis. Furthermore, the absence
of NO-3 and SO2-
4 peaks at 1384 cm-1 and 1109 cm-1 indicated that the nitrate and sulfate
ions was completely removed during the washing and dialysis process (Bhatt et al., 2008;
Grube et al., 2006; Smidt et al., 2005).
Univers
ity of
Mala
ya

51
4000 3500 3000 2500 2000 1500 1000
11093 300 89910591235
1500-15051625
17502902
3 200
EFB fibres
EFB derived cellulose
SA-NC
(%) T
rans
mitt
ance
(a.u
.)
Wavelength (cm-1)
Ni-NC
Figure 4.2: FTIR spectra of EFB fibres, EFB derived cellulose, SA-NC and Ni-NC
FTIR spectra of the EFB fibres showed an absorption peak at 1750cm-1, which is -C=O
(saturated aldehyde) that attributed to vibration of xylan (hemicellulose)(Lai & Idris,
2013b). The respective peak was noticeable absence after the pretreatment process, which
indicating that hemicellulose was successfully removed from the complex biomass
structures(Gibson, 2012). In addition, non-cellulosic lignin's chemical functional groups
appeared at the band of 1505 cm-1 and 1500 cm-1, which attributed to aromatic skeletal
vibration in lignin(Lai & Idris, 2013b), while FTIR band at 1235cm-1 attributed to
syringyl ring and CO stretch in lignin and xylan. These respective peaks also disappeared
after the bleaching treatment, thus confirming that lignin and small part of hemicellulose
were eliminated.The dominant peak in the region between 3700 and 3000 cm-1 is
Univers
ity of
Mala
ya

52
attributed to O-H stretching. A slight decrease in the peak intensity showed the disruption
of intramolecular and intermolecular hydrogen bonding (Alemdar & Sain, 2008; Yang et
al., 2011).The FTIR peak at 2,800 cm-1 corresponds to the presence of C–H stretching
vibration and –CH2–(C6)– bending vibration (Alemdar & Sain, 2008; Yang et al., 2011).
The weak intensity of the FTIR band at 1640 to 1645 cm-1 can be attributed to the
cellulose-water interaction, i.e., the –OH bending of absorbed water. The chemical
structure of C–O–C pyranose ring skeletal vibration of cellulose was observed in the FTIR
peak at 1,050 cm-1 (Jahan et al., 2011). Furthermore, the absorption bands near 1058
to1060 cm-1 can be attributed to C-O and C-H stretching vibrations, which confirms the
presence of cellulose structures (cellulose I as cellulose Iβ). The increasing peak intensity
of these groups indicated an increase in sample crystallinity (Man et al., 2011; Zain et al.,
2014). The peak at 885 cm-1 is attributed to the characteristic ß-glycosidic linkages
between the glucose units of cellulose chains (Sun et al. 2004; Zhang et al.2011).
4.3 Field-Emission Scanning Electron Microscopy (FESEM)
The surface morphology of EFB fibres, cellulose derived EFB, SA-NC and Ni-NC was
determined using FESEM analysis (Figure 4.3). FESEM images clearly displayed
significant changes of EFB fibres structure after being treated under alkali, bleaching and
acid condition. Based on Figure 4.3a, EFB fibres showed bundles of individual fibres
which was coated with extractive materials such as waxes, pectin, hemicellulose, lignin
and other impurities. Wax and pectin acted as a protective layer for palm fiber's surfaces
(Johar et al., 2012), thus soxhlet extraction treatment was performed to remove this
hydrophobic layer in order to increase the accessibility of cellulose towards chemical
attack. Figure 4.3b showed the de-lignified and bleached cellulose derived from EFB. It
was observed that the treated fiber appeared in smoother and individualized fibrils as most
of the non-cellulosic content and impurities were removed from the fiber surface via
soxhlet extraction, delignification and bleaching. These processes has broken the
Univers
ity of
Mala
ya

53
Continued on next page
lignocellulosic complex, solubilized the lignin and hemicellulose and increase the surface
area of hidden cellulose. Thus, the cellulose will be more accessible to hydrolysis reaction
to produce nanocellulose.
The structures for SA-NC (Figure 4.3c) showed the aggregations of cellulosic
fibres were reduced. Furthermore, the presence of cellulose crystallites (in the form of
rice shape) indicating that the intra-fibrillar structure was disintegrated into individual
cells as the amorphous region of cellulose has been decomposed (Kumar et al., 2014;
Nazir et al., 2013). The Ni-treated products showed the significant changes of structure
as compared to EFB fibres and EFB derived cellulose, where the fibres were degraded
into narrower and less orderly fragments with cracks on the surface.
(a) EFB fibres (b) EFB derived cellulose
Univers
ity of
Mala
ya

54
(a) SA-NC (d)Ni-NC Figure 4.3: The morphology of (a) EFB fibres (b) EFB derived cellulose (c) SA-NC
and (d) Ni-NC
This confirmed the destruction of amorphous fraction remaining in cellulose by
means of mild Ni-hydrolysis, the compact structure of cellulose derived from EFB was
significantly changed to finer fibril and with a longer structure. This indicated that most
of the cellulose fiber was selectively cleaved into smaller sizes during hydrolysis reaction.
It is expected that Ni2+ ions diffused into surface of cellulose fibres and attack the
glycosidic bonding of cellulose chains, which lead to the breakage of amorphous regions
of cellulose fibres (J. Li et al., 2015), thus increased fiber’s surface area. This led to the
breakage of the amorphous regions of cellulose fibres thus resulted in smaller particle
sizes compared to EFB fibres and EFB derived cellulose. Several researchers also proved
that from FESEM images, the destruction of amorphous leaving crystallite region at the
nanocellulose can be observed (Kumar et al., 2014; Nazir et al., 2013). This hypothesis
were further supported by XRD data, which showed the CrI of SA-NC and Ni-NC is
higher than the EFB fibres, and cellulose derived EFB.
Univers
ity of
Mala
ya

55
Continued on next page
4.4 High Resolution Transmission Electron Microscopy (HR-TEM)
HR-TEM images of SA-NC and Ni-NC are shown in Figure 4.4. The Ni-salt-catalyzed
hydrolysis rendered an interconnected of individual cellulose nanocrystals with spider
web-like structure (Fig. 4a-c). Furthermore, the nanocellulose are presented in fine
diameter (10 to 60 nm) and length at 70 to 300 nm according to the results,which implied
that the Ni ion successfully diffuse into the rigid structure of cellulose and resulted in
selective fragmentation of crystal into smaller sizes.
05
1015202530
0-10
10-2
0
20-3
0
30-4
0
40-5
0
50-6
0
60-7
0
Freq
uenc
y
Fiber diameter (nm)
Univers
ity of
Mala
ya

56
Continued on next page
(a) SA-NC
02468
10121416
20-4
0
40-6
0
60-8
0
80-1
00
100-
120
120-
140
Freq
uenc
y
Fiber length (nm)
0
2
4
6
8
10
50-60 60-70 70-80 90-100 30-40 40-50 80-90 20-30
Freq
uenc
y
Fiber diameter (nm)
Univers
ity of
Mala
ya

57
(b) Ni-NC Figure 4.4: HR-TEM micrographs and particle size distribution profile of (a) SA-NC
and (b)Ni-NC
A comparison study was performed for both inorganic metal salt (Ni2+) and inorganic
acid (H2SO4) catalyzed hydrolysis process. H2SO4-treated nanocellulose (SA-NC) was
performed (Figure 4.4). The HR-TEM images clearly revealed the rice-shape structures
of the cellulose crystals with nano-scale diameter (10 to 30 nm) and shorter length (60 to
100 nm). Besides, dimensional profiles of Ni-treated and H2SO4-treated nanocellulose
samples were determined by studying the aspect ratio of length (L) to diameter (D): L/D
(Table 4.2).
The aspect ratio of prepared nanocellulose increases in the order SA-NC< Ni-NC. SA-
NC rendered shorter length of nanocrystal while Ni-NC showed fine width with
controllable length of products. This indicated that Ni-inorganic salt capable to selectively
control the hydrolysis as compared to sulphuric acid reaction although low acid
concentration was used.
0123456789
100-
150
350-
400
400-
450
600-
650
750-
800
500-
550
550-
600
650-
700
700-
750
800-
850
850-
900
300-
350
50-1
00
200-
250
450-
500
150-
200
250-
300
Freq
unec
y
Fiber length (nm)
Univers
ity of
Mala
ya
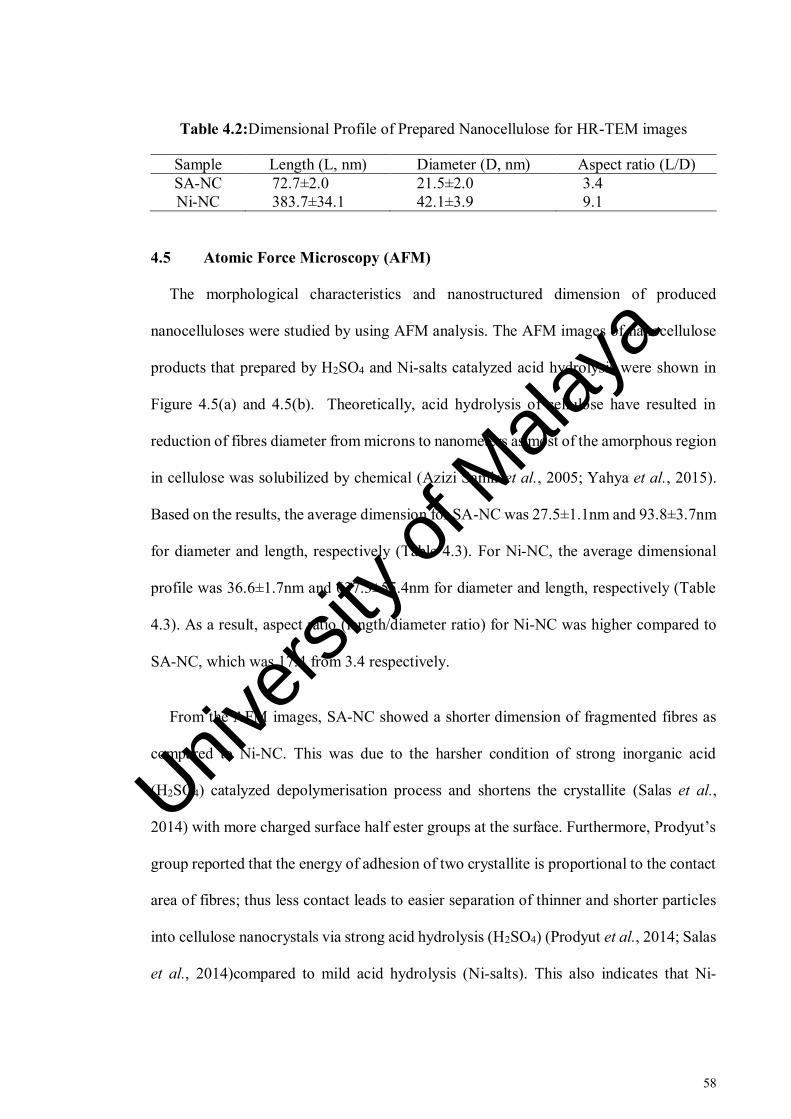
58
Table 4.2:Dimensional Profile of Prepared Nanocellulose for HR-TEM images
Sample Length (L, nm) Diameter (D, nm) Aspect ratio (L/D) SA-NC 72.7±2.0 21.5±2.0 3.4 Ni-NC 383.7±34.1 42.1±3.9 9.1
4.5 Atomic Force Microscopy (AFM)
The morphological characteristics and nanostructured dimension of produced
nanocelluloses were studied by using AFM analysis. The AFM images of nanocellulose
products that prepared by H2SO4 and Ni-salts catalyzed acid hydrolysis were shown in
Figure 4.5(a) and 4.5(b). Theoretically, acid hydrolysis of cellulose have resulted in
reduction of fibres diameter from microns to nanometers as most of the amorphous region
in cellulose was solubilized by chemical (Azizi Samir et al., 2005; Yahya et al., 2015).
Based on the results, the average dimension for SA-NC was 27.5±1.1nm and 93.8±3.7nm
for diameter and length, respectively (Table 4.3). For Ni-NC, the average dimensional
profile was 36.6±1.7nm and 637.3±55.4nm for diameter and length, respectively (Table
4.3). As a result, aspect ratio (length/diameter ratio) for Ni-NC was higher compared to
SA-NC, which was 17.4 from 3.4 respectively.
From the AFM images, SA-NC showed a shorter dimension of fragmented fibres as
compared to Ni-NC. This was due to the harsher condition of strong inorganic acid
(H2SO4) catalyzed depolymerisation process and shortens the crystallite (Salas et al.,
2014) with more charged surface half ester groups at the surface. Furthermore, Prodyut’s
group reported that the energy of adhesion of two crystallite is proportional to the contact
area of fibres; thus less contact leads to easier separation of thinner and shorter particles
into cellulose nanocrystals via strong acid hydrolysis (H2SO4) (Prodyut et al., 2014; Salas
et al., 2014)compared to mild acid hydrolysis (Ni-salts). This also indicates that Ni-
Univers
ity of
Mala
ya

59
Continued on next page
inorganic salt hydrolysis capable to selectively control the hydrolysis as compared to
sulfuric acid reaction.
Table 4.3: Dimensional Profile of Prepared Nanocellulose for AFM images
Sample Length (L, nm) Diameter (D, nm) Aspect ratio (L/D) SA-NC 93.8±3.7 27.5±1.1 3.4 Ni-NC 637.3±55.4 36.6±1.7 17.4
0
5
10
15
20
25
0-10 10-20 20-30 30-40 40-50
Freq
uenc
y
Fiber diameter (nm)
Univers
ity of
Mala
ya

60
Continued on next page
(a)SA-NC
0
1
2
3
4
5
6
7
8
9
10
Freq
uenc
y
Fiber legnth (nm)
02468
101214
Freq
uenc
y
Fiber length (nm)
Univers
ity of
Mala
ya

61
(b)Ni-NC
Figure 4.5: AFM images and dimention analysis for (a) SA-NC and (b) Ni-NC
4.6 Particle Size Distribution (PSD)
PSD or Dynamic Light Scattering (DLS) is a well establish, on-invasive method to
measure particles in a dispersed liquid medium. It use to measures transitional diffusion
coefficient of particles in dispersion medium, which undergo Brownian movement.
Brownian movement motion is a random motion of particles suspended in a fluid (liquid
or gas) resulting from their collision with the quick atom or molecules in the gas or fluid.
A light scattering device (Malvern Zetasizer NanoZS) will determine various dimensions
in average measurement as the particles flow randomly through the light beam, producing
a distribution of sizes from the smallest to the largest dimensions(Instruments, 2012).
Figure 4.6 shows the particle size distribution of EFB, cellulose derived EFB,SA-NC
and Ni-NC. As shown from the results, the particle size distribution for EFB fibres was
present in the sizes at range of 458.7nm to 5560nm, where the majority region of sizes
was exhibit in microscale region of 4568.7nm (Figure4.6a).
The extracted cellulose fibres derived from EFB fibres showed smaller range of size
compared to EFB fibres. Figure 4.6b revealed the particle size distribution ranging from
0
5
10
15
20
25
10-20 20-30 30-40 40-50 50-60 60-70 70-80
Freq
uenc
y
Fiber diameter (nm)
Univers
ity of
Mala
ya

62
396.1nm to 6439nm, with the majority of particle size in the region of 712.4nm. The
smaller size of cellulose reflects that the non-cellulosic compound such as lignin and
hemicellulose was successfully removes from the cellulosic fibres (Gibson, 2012).
In contrast, nanocellulose that treated by sulfuric acid (SA-NC) and Ni-salt (Ni-NC)
rendered smallest nano range of particle size distribution at 32.67nm to 458.7nm (Figure
4.6c) and 37.84nm to 91.28nm (Figure4.6d) respectively. Both nanocellulose products
showed the majority sizes at regions of 50.75nm (SA-NC) and 91.28nm (Ni-NC)
respectively. Apparently, the particles size distribution of nanocellulose analysed by PSD
analysis was bigger in size range as compared to the results of for HRTEM (10-
60nm(D),70-300nm (L)) and AFM analysis (20-40nm (D), 90-600 (L)). This is due to the
occurence of Brownian movement motion and electroviscious effects (presence of
counter ions in double layer) during PDS analysis, which resulted in particles
agglomeration into spherical aggregates, thus increased the sizes range of particle size
distribution of the product. The reduced sizes of cellulose to nanocellulose is because the
acids cleaves the amorphous region of microfibrils transversely, resulting in reduction in
fiber diameter from microns to nanometers (Azizi Samir et al., 2005; Yahya et al., 2015).
Univers
ity of
Mala
ya

63
Continued on next page
(a)
(b)
0 2000 4000 6000 80000
2
4
6
8
10
12
Vol
ume
(%)
Size (d.nm)
0 2000 4000 6000 80000
2
4
6
8
10
12
Vol
ume
(%)
Size (d.nm)
Univers
ity of
Mala
ya

64
(c)
0 100 200 300 400 5000
5
10
15
20
25
30
Vol
ume
(%)
Size (d.nm)
(d)
0 50 100 150 200 2500
5
10
15
20
25
30
35
Vol
ume
(%)
Size (d.nm)
Figure 4.6: Particle size distribution for (a)EFB fibres, (b)EFB derived cellulose,
(c)SA-NC and (d)Ni-NC
Univers
ity of
Mala
ya

65
4.7 Thermogravimetric (TG) and Differential Thermogravimetric (DTG)
Analysis
Figures 4.7a and b show that the thermal decomposition peaks with maximum weight
loss for EFB, cellulose derived EFB,SA-NC and Ni-NC appeared at 232.31°C, 215.46°C,
174.93°C, and 332.74 °C, respectively. The presence of hemicellulose and lignin in EFB
fibres consumed more energy to decompose the non-cellulosic content, especially of
lignin, which require higher temperature (230 oC -400 oC) and longer time to break the
heavily crossed linked aromatic rings(Poletto et al., 2012). This confirmed the existence
of complex hemicellulose and lignin in EFB, which resulted in higher decomposition
temperatures as compared to the cellulose derived EFB. Cellulose in nanodimension (SA-
NC and Ni-NC) showed significant differences of thermal decomposition behaviour from
cellulose fibrils. The long-chain polymer structure of cellulose arranged in well order and
strongly linked with hydrogen bonding consisted of higher thermal stability that is
215.46°C as compared to SA-NC (Yang et al., 2007), this makes extra energy to cleave
the chemical linkages.The nanocellulose product treated with Ni-salt had the highest
thermal stability (332.74°C). According to the literature, the thermal stability of
nanocellulose prepared by sulfuric acid hydrolysis of ionic liquids (composed of sulfate
compounds) is lower than that of native cellulose (Chen et al., 2009; Fahma et al., 2010;
Man et al., 2011; Wang et al., 2007). Sulfate content is thus one of the factors affecting
the thermal stability of prepared nanocellulose. The presence of sulfate (residual H2SO4)
adsorbed on the outer surfaces of cellulose hydroxyl crystals increases the reactivity of
the material with increasing temperature, causing the decomposition of nanocellulose
chains at low temperatures (Wang et al., 2007). In comparison, nanocellulose prepared
by Ni-salt-catalyzed hydrolysis exhibits much higher thermal stability. This is due to the
lesser amount of damage in the crystalline regions of cellulose structure under mild
Univers
ity of
Mala
ya

66
conditions. Thus, the high thermal stability of Ni-NC means that it has many potential
applications in composite materials that require high thermal stability.
(a)
(b)
Figure 4.7: (a) TGA and (b) DTG spectra for EFB fibres, EFB derived cellulose, SA-NC and Ni-NC
0 200 400 600 8000
20
40
60
80
100
Wei
ght (
%)
Temperature (oC)
EFB EFBderived cellulose SA-NC Ni-NC
0 200 400 600 800
0.0
0.5
1.0
1.5
2.0
2.5
3.0
Der
ivat
ived
wei
ght (
%/m
in-1
)
Temperature (oC)
EFB fibres EFB derived cellulose SA-NC Ni-NC
100 200 300 400 500
0.0
0.5
1.0
1.5
2.0
2.5
3.0
Der
ivat
ived
wei
ght (
%/m
in-1)
Temperature (oC)
0 100 200 300 4000
20
40
60
80
100
B
Wei
ght (
%)
Temperature (oC)
Univers
ity of
Mala
ya
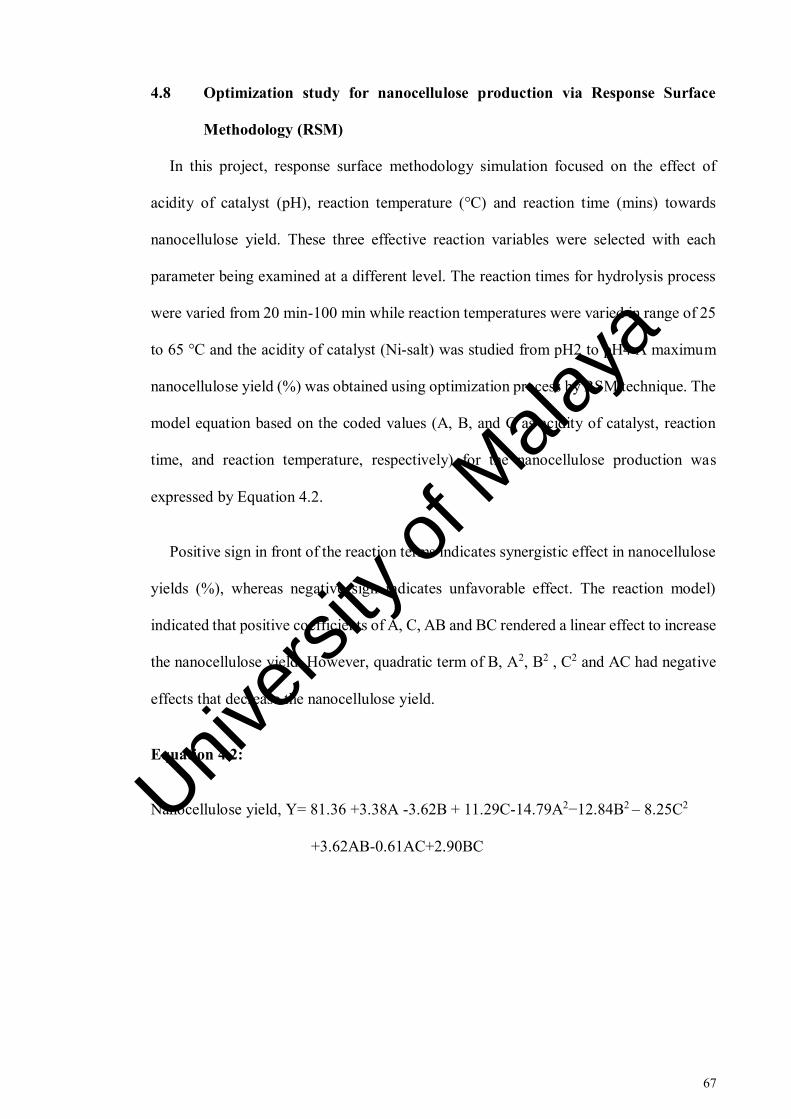
67
4.8 Optimization study for nanocellulose production via Response Surface
Methodology (RSM)
In this project, response surface methodology simulation focused on the effect of
acidity of catalyst (pH), reaction temperature (°C) and reaction time (mins) towards
nanocellulose yield. These three effective reaction variables were selected with each
parameter being examined at a different level. The reaction times for hydrolysis process
were varied from 20 min-100 min while reaction temperatures were varied in range of 25
to 65 °C and the acidity of catalyst (Ni-salt) was studied from pH2 to pH4 A maximum
nanocellulose yield (%) was obtained using optimization process by RSM technique. The
model equation based on the coded values (A, B, and C as acidity of catalyst, reaction
time, and reaction temperature, respectively) for the nanocellulose production was
expressed by Equation 4.2.
Positive sign in front of the reaction terms indicates synergistic effect in nanocellulose
yields (%), whereas negative sign indicates unfavorable effect. The reaction model)
indicated that positive coefficients of A, C, AB and BC rendered a linear effect to increase
the nanocellulose yield. However, quadratic term of B, A2, B2 , C2 and AC had negative
effects that decrease the nanocellulose yield.
Equation 4.2:
Nanocellulose yield, Y= 81.36 +3.38A -3.62B + 11.29C-14.79A2−12.84B2 – 8.25C2
+3.62AB-0.61AC+2.90BC
Univers
ity of
Mala
ya

68
The result of statistical analysis of variance (ANOVA) was performed to determine
the significant and fitness of quadratic reaction model as well as the effect of significant
individual hydrolysis terms and their interaction towards the nanocellulose yield was
presented in Table 4.4. The variables incorporated in the Model-F value of 177.24 with p
–value <0.0001 implies that the model is significant at 95% confidence interval. The p-
value (probability of error value) is used as a tool to check the significance of each
regression coefficient, which also indicates the interaction effect of each cross product.
The smaller the p-value, the bigger the significance of the corresponding coefficient is
(Lee et al., 2011). In the case of model terms, the p-value less than 0.05 indicated that the
particular model terms were statistically significant.
From the ANOVA results, the reaction model suggested that variables with significant
influence on nanocellulose yield response were acidity of catalyst (A), reaction time (B),
reaction temperature (C), A2, B2, C2and the interaction terms were found to exist between
the main factors (AB, AC and BC). A low value of coefficient of variation (CV= 3.17)
indicated a high degree of precision and good deal of reliability of the experimental
values. The lack of fit test with p-value of 0.1429, which is not significant (p-value>0.05
is not significant) showed that the model satisfactorily fitted to experimental data.
Insignificant lack of fit is most wanted as significant lack of fit indicates there might be
contribution in the regressor-response relationship that is not accounted for by the model
(Lee et al., 2011).
Univers
ity of
Mala
ya

69
Table 4.4: ANOVA for nanocellulose yield
Source Sum of squares
aDF
Mean square F-value p-value
Model 6458.52 9 717.61 177.24 < 0.0001 significant A 114.51 1 114.51 28.28 0.0003 B 130.9 1 130.9 32.33 0.0002 C 1273.51 1 1273.51 314.54 < 0.0001 A2 601.32 1 601.32 148.52 < 0.0001 B2 453.19 1 453.19 111.93 < 0.0001 C2 187.28 1 187.28 46.25 < 0.0001 AB 104.76 1 104.76 25.87 0.0005 AC 2.94 1 2.94 0.73 0.4141 BC 67.34 1 67.34 16.63 0.0022 Residual 40.49 10 4.05 Lack of Fit
29.78 5 5.96 2.78 0.1429 not significant
Pure Error
10.7 5 2.14
bSD 2.01217785 R-squared 0.99377003 Mean 63.4185 cAd R-
squared 0.98816307
C.V 3.17285626 dPr R-squared
0.96149893
eAdeq R-squared
45.2078178
a Degree of freedom b Standard deviation c Adjusted R-Squared d Predicted R-Squared e Adequate R-squared
The predicted values versus actual values for nanocellulose yield with adjusted-R2
value of 0.99 indicate the model with 100% variability (Figure 4.8). Furthermore, the R2
value closed to unities, which mean that the data fit, will with the model and given a
convincingly good estimate of response for the system in the range studied. In addition,
investigation on residuals to validate the adequacy of the model was discussed. Residual
is the difference between the observed response and predicted response.
This analysis was examined using normal probability plot of the residuals (Figure 4.9a)
and the plot of the residuals versus predicted response (Figure 4.9b). The normal
Univers
ity of
Mala
ya

70
probability plot of the residuals indicates that the errors are distributed normally in a very
straight line.
Figure 4.8: Predicted versus actual nanocellulose yield
DESIGN-EXPERT PlotResponse 1
Actual
Predic
tedPredicted vs. Actual
19.91
36.03
52.15
68.27
84.39
19.91 36.03 52.15 68.27 84.39
R2=0.99
Univers
ity of
Mala
ya

71
(a)
(b)
Figure 4.9: Normal probability plots of the residuals (a) and plot of the residuals
versus the predicted response (b)
DESIGN-EXPERT PlotResponse 1
Residual
Norm
al %
Proba
bility
Normal Plot of Residuals
-2.23564 -1.13845 -0.0412727 1.05591 2.15309
1
5
10
2030
50
7080
90
95
99
DESIGN-EXPERT PlotResponse 1
Predicted
Stude
ntize
d Resi
duals
Residuals vs. Predicted
-3.00
-1.50
0.00
1.50
3.00
20.07 36.15 52.23 68.31 84.39
Univers
ity of
Mala
ya

72
Figure 4.10 (a) and (b) showed the 3D RSM plot and contour plot for the interaction
effect between acidity of catalyst (A) and reaction time (B) toward nanocellulose yield.
The reaction temperature (°C) was fixed at 45°C. The 3D response surface revealed that
increment of reaction time from 20 to 60 min was lead to increase of nanocellulose yield
(~60%-~80%), further prolong the reaction time to 100 min caused decreased of
nanocellulose yield (~50%). Reaction time plays an important role in the process of
cellulose depolymerization. In the initial step, long period required to soften and
solubilized the amorphous region that present in cellulose fiber (Lu et al., 2014). When
the reaction period reached certain level, the hydrolysis reaction gained enough of energy
to cleave the glycosidic bond of cellulose chain (Abd Hamid et al., 2014; H. V. Lee, S.
B. Hamid, et al., 2014). Furthermore, effects of acidity of catalyst (pH) at different
reaction duration towards nanocellulose yield (%) were investigated. The results shown
that increment of pH2 to pH 3(decrease of acidity) was lead to increase of nanocellulose
yield (~55%-~80%), further decrease of acidity to pH 4 caused a decreased of
nanocellulose yield (~55%). Acidity of pH plays an important role in the hydrolysis
process for cellulose depolymerization. Utilizing lower concentration of Ni ions (pH 4-
lowest acidity), the hydrolysis of cellulose was not occurred effectively, which gives
lower yield of nanocellulose product. However, employing higher acidity of catalyst
(pH2-pH3) lead to Ni2+ ions diffused into surface of cellulose fibres and attacks the
glyosidic bonding of cellulose chains to produce cellulose in nanodimention. The
interaction between reaction time (mins) and acidity of catalyst (pH) have been found to
gives positives effect in this study. However, prolong reaction of time (B) occurred with
high acidity of catalyst (A),cellulose was broken into its component sugar molecule by
hydrolysis reaction (Lu et al., 2014). This process was in agreement with Kumar’s study
which nanocellulose yield increase with the use of different catalyst of increasing acidity
Univers
ity of
Mala
ya

73
due to increase in the acid centers which is mainly responsible for the hydrolysis process
(Kumar & Singh, 2014).
(a)
(b)
Figure 4.10: Effect of acidity of catalyst (A) and reaction time (B) toward
nanocellulose yield, reaction temperature =45°C (a)3D response surface plot and (b) 2D Contour plot
DESIGN-EXPERT Plot
Response 1X = A: Acidity of catalystY = B: Reaction time
Actual FactorC: Reaction temperature = 45.00
43.1
52.8
62.4
72.1
81.7
Nan
ocell
ulose
yield(
%)
2.0
2.5
3.0
3.5
4.0
20
40
60
80
100
A:Acidity of catalyst (pH) B:Reaction time (mins)
DESIGN-EXPERT Plot
Response 1Design Points
X = A: Acidity of catalystY = B: Reaction time
Actual FactorC: Reaction temperature = 45.00
Nanocellulose yield(%)
A:Acidity of catalyst (pH)
B:Re
actio
n tim
e (mi
ns)
2.0 2.5 3.0 3.5 4.0
20
40
60
80
10049.656.0
62.462.4
62.4
62.4
68.9
68.975.3
80.6
81.7666666
Univers
ity of
Mala
ya

74
Figure 4.11 (a) showed the 3D plot and (b) contour plot for the interaction effect
between reaction temperature (C) and acidity of catalyst (A) toward nanocellulose yield.
The reaction time was fixed at 60 mins. At low level of acidity of catalyst (pH2), the
increase of reaction temperature from room temperature to 55 °C showed a positive effect
towards the nanocellulose yield (~40%-~60%). It was observed that the nanocellulose
yield showed better effect at acidity of catalyst (pH4) at high level of temperature, which
rendered ~50% to 70% nanocellulose yield . Among the interaction terms that influenced
the nanocellulose yield response, the interaction effect of acidity of catalyst-reaction
temperature gave the most significant influence toward the yield of nanocellulose. This
interaction effect showed unfavorable influence on nanocellulose yield (Equation 4.2)
which suggests that the interaction between reaction temperature–acidity of catalyst
reduced the nanocellulose yield. This may due to the high acidity of catalyst with high
reaction temperature that favors byproducts formation (glucose) as over-hydrolysis
occurred, thus reduced the nanocellulose yield (Abd Hamid et al., 2014). Subsequently,
it is suggested that the reaction was to perform at optimal condition whereby the
nanocellulose yield will achieve the best value (~80%) at pH3,45°C and for 60min
Univers
ity of
Mala
ya
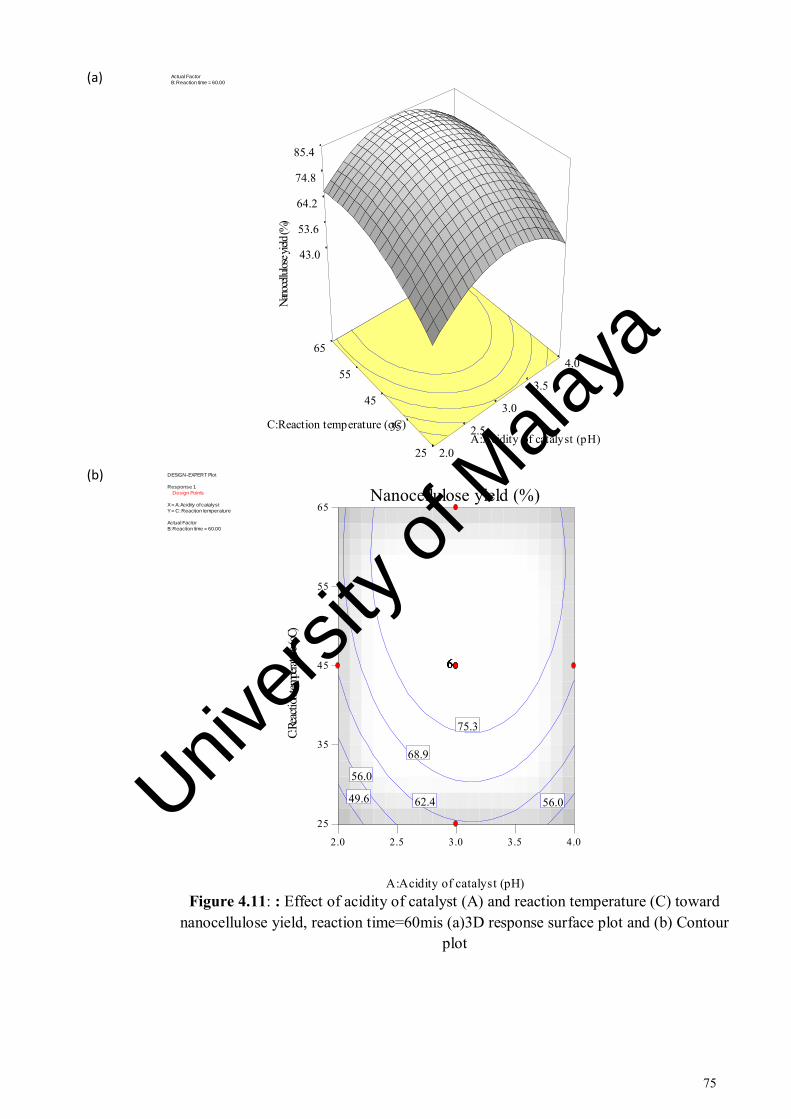
75
(a)
(b)
Figure 4.11: : Effect of acidity of catalyst (A) and reaction temperature (C) toward
nanocellulose yield, reaction time=60mis (a)3D response surface plot and (b) Contour plot
DESIGN-EXPERT Plot
Response 1X = A: Acidity of catalystY = C: Reaction temperature
Actual FactorB: Reaction time = 60.00
43.0
53.6
64.2
74.8
85.4
Nan
ocell
ulose
yield
(%)
2.0
2.5
3.0
3.5
4.0
25
35
45
55
65
A:Acidity of catalyst (pH) C:Reaction temperature (oC)
DESIGN-EXPERT Plot
Response 1Design Points
X = A: Acidity of catalystY = C: Reaction temperature
Actual FactorB: Reaction time = 60.00
Nanocellulose yield (%)
A:Acidity of catalyst (pH)
C:Re
actio
n tem
perat
ure (o
C)
2.0 2.5 3.0 3.5 4.0
25
35
45
55
65
49.6
56.0
56.062.4
68.9
75.3
666666
Univers
ity of
Mala
ya

76
Figure 4.12 a and b showed the 3D plot and contour plot for the relationship between
reaction time (B) and reaction temperature (C) toward nanocellulose yield. The acidity of
catalyst was fixed at pH3. The 3D response surface revealed that increment of reaction
temperature from low level (25°C) to high level (65°C) leads to the increase of
nanocellulose content (62-84 %) with reduced reaction time (20-60 mins). On the
contrary, the increase of reaction time does not improve the nanocellulose yield at low
reaction temperature level. The decreased of nanocellulose yield at longer reaction time
was due to the over-reaction, which convert nanocellulose product into glucose rather
than nanocellulose intermediate (Lu et al., 2014). Results showe that nanocellulose yield
remained <65% with the reaction time increased from 20 to 40 min at the temperature of
25-35 °C. However, the nanocellulose content was raised apparently to >70% at
intermediate level (45 °C) to high level at 65 °C. The nanocellulose content reached
plateau point when both of the reaction temperature and reaction time rise to optimum
level. This might indicate that the hydrolysis reaction process reached ideal condition
(55°C, 60mins), further proceeds the reaction that may lead to decomposition of
nanocellulose (glucose formation) thus reduced the nanocellulose content. Reaction time
and temperature plays an important role in the degradation of cellulose. In a short period
of time and t, the hydrolysis of cellulose could not happen effectively(Lu et al., 2014).
Univers
ity of
Mala
ya

77
Figure 4.12: Effect of reaction temperature (C) and reaction time (B) toward nanocellulose yield, acidity of catalyst=3 (a) 3D response surface plot and (b) Contour
plot
(a)
(b)
DESIGN-EXPERT Plot
Response 1X = B: Reaction timeY = C: Reaction temperature
Actual FactorA: Acidity of catalyst = 3.0
43.0
53.6
64.2
74.8
85.4
Nan
ocell
ulose
yield
(%)
20
40
60
80
100
25
35
45
55
65
B: Reaction time C:Reaction temperature (oC)
DESIGN-EXPERT Plot
Response 1Design Points
X = B: Reaction timeY = C: Reaction temperature
Actual FactorA: Acidity of catalyst = 3.0
Nanocellulose yield (%)
B:Reaction time (mins)
C:Re
actio
n tem
perat
ure (o
C)
20 40 60 80 100
25
35
45
55
65
49.6
56.0
62.4
62.468.9
75.3
80.1
84.4
72.9
82.8
666666
Univers
ity of
Mala
ya

78
There are several previous studies successfully extracted nanocellulose by using
transition metal salt (Fe and Cr based metal salt) hydrolysis with the yield between >50%.
Abd Hamid et. al (2016) successfully hydrolyzed palm tree cellulose (PTC) and alpha
cellulose (AP) to nanocellulose by using HCl-FeCl3 assisted with ultrasonication process.
From XRD analysis results, the isolated CNC from PTC and AC showed higher CrI of
73.51% and 89.03%, with a diameter of 20-70nm and 15-50nm respectively. The yield of
CNC from PTC and AC is 80.88% and 81.20% respectively(Abd Hamid et al., 2016).
Further investigation were made by Chen et. al (2016), which they successfully produced
nanocellulose via chromium nitrate (Cr(NO3)3) assisted H2SO4 hydrolysis and was
optimized using RSM. Based from the optimum condition of producing nanocellulose
(82.2°C,0.22M Cr(NO3)3and 0.80M H2SO4, 1 hr), the CrI and yield of nanocellulose is
85.35% and 82.42% respectively with a average diameter of 18.4±7.3nm (Chen et al.,
2016). The above perusal of literature reflects that several studies have been conducted
for the preparation of nanocellulose using transition metal based gives higher yield as
compared to strong acid hydrolysis. As such, Ni salt hydrolysis process shows that the
yield of nanocellulose is ~40- 80%.
4.9 Optimization of nanocellulose yield
In this project, the optimization of the nanocellulose hydrolysis process was done to
search for optimal operating conditions in which the highest nanocellulose yield is
reached. The variables (acidity of catalyst, reaction temperature and reaction time) were
set in a range between low and high levels which coded −1 and +1 to obtained ultimate
response for the nanocellulose yield (Table 4.5a). The overall average optimized
conditions for nanocellulose yield were obtained as follows: acidity of catalyst (pH3),
reaction time (60 mins), and reaction temperature (45 °C) with nanocellulose yield of
81.37% (Table 4.5b). The predicted nanocellulose yield was 81.40%. This means that the
experimental value achieved was reasonably near to the predicted value calculated from
Univers
ity of
Mala
ya

79
the model (0.69% of standard error mean). It can be concluded that the generated model
is near to predictability and close to precision for the nanocellulose yield in the
experimental conditions used.
Table 4.5: (a) Optimization criteria for ideal nanocellulose yield and (b) Results of model validation at the optimum level
(a)Name Goal Lower Limit
Upper Limit
Lower Weight
Upper Weight
Importance
Acidity of catalyst
Is in range
2 4 1 (-1) 1(+1) 3
Reaction time Is in range
20 100 1 (-1) 1(+1) 3
Reaction temperature
Is in range
25
65
1 (-1) 1(+1) 3
(b)Acidity of catalyst (pH)
Reaction time (mins)
Reaction temperature (⁰C)
Predicted nanocellulose yield (%)
Experimental nanocellulose yield (%)
Standard error mean
3 60 45 81.40 81.37 0.69
Univers
ity of
Mala
ya

80
CHAPTER 5: CONCLUSION
5.1 Conclusion
This project was devoted to study the catalytic synthesis of nanocellulose from oil
palm lignocellulosic biomass. Nanocellulose were successfully extracted from EFB
fibres by conventional chemical pretreatment and mild acid hydrolysis process from
inorganic acid (H2SO4) and inorganic salt (Ni-salt). The physicochemical properties of
EFB-drived nanocelluloses were in terms of product’s crystallinity index, chemical
characteristic, surface chemical functional group, surface morphology and structure,
particle size distribution and thermal stability profile were determined by using analytical
instruments such as TGA and DTG, FT-IR, FESEM ,HRTEM, AFM, PSD and XRD.
XRD analysis was performed to investigate the crystallinity index and crystallite sizes
of cellulose samples. The crystallinity (Crl) of SA-NC (73.17%) and Ni-NC(80.75%)
were higher as compared to raw EFB fibres (46.04%) and EFB-derived cellulose
(68.45%). This shows that the amorphous region of cellulose was successfully attacked
by acid and resulted in higher CrI of SA-NC and Ni-NC than EFB fibres and EFB derived
cellulose. The results also indicated those biomasses pretreatment are successfully
removes non-cellulosic content (lignin and hemicellulose) in EFB fibres and thus, the CrI
of EFB-derived cellulose was higher than EFB. Furthermore, the changes of chemical
composition for all samples (EFB, EFB-derived cellulose, SA-NC and Ni-NC) were
evaluated using FTIR analysis. FTIR results revealed that non-cellulosic contents were
successfully removed from EFB fibres via alkali and bleaching treatments. Based from
the XRD and FTIR analysis, there was an absence of Ni-metal and NO3- ions after the
washing and dialysis processes of nanocellulose, which rendered a higher thermal
stability of nanocellulose product as compared to EFB-derived cellulose.
Thermogravimetric and derivatives thermal analysis shows that the order of starting
decomposition temperature decreased in the trend of Ni-NC > EFB fibres > EFB-derived
Univers
ity of
Mala
ya

81
cellulose > SA-NC, which was 332.74 °C, 232.31 °C, 215.46 °C and 179.93 °C,
respectively. The Ni-NC exhibits higher thermal decomposition as compared to SA-NC,
which indicated the content of damage in the crystalline regions of Ni-NC structure is
lesser as compared to SA-NC structure.
The morphological changes of micro- and nano-structured of all samples were
performed by using FESEM analysis. FESEM images clearly display that outer layer
(waxes, pectins and fats) of EFB fibres has been removed after pretreatment process. The
pretreatment methods eventually enhance the hydrolysis process (SA-NC and Ni-NC) to
produce nano-scale dimension. Furthermore, HR-TEM and AFM analysis indicated that
acid hydrolysis was capable to depolymerize cellulose micro-chain into nano-crystallites,
in which SA-NC and Ni-NC rendered average nano-dimensions in fibres length ( < 700
nm) and fibres width dimension (< 50 nm). In addition, PSD results clearly showed the
particle sizes had been reduced from EFB-derived cellulose to nanocellulose products
(SA-NC and Ni-NC). The particle size distribution of EFB fibres in micro-sizes were
reduced to nanocellulose sizes from <5500 nm to <90.00 nm. The presence study
concluded that Ni-salts is an efficient and selective catalyst for the hydrolysis of cellulose
with high simplicity in operation as compared to inorganic acid (H2SO4).
In order to achieve high yield of nanocellulose, optimization study for Ni-salt
catalyzed hydrolysis of EFB-derived cellulose reaction was investigated via response
surface methodology (RSM). The hydrolysis parameters were selected for the
optimization study were reaction temperature (°C), reaction time (min) and acidity of
catalyst (pH). The reaction model suggested that all the hydrolysis parameters playing an
significant role to influence the nanocellulose yield. Furthermore, based on the reaction
model generated from RSM-CCD, the predicted nanocellulose yield was 81.40 % under
reaction condition of 60 min of reaction time, 45 °C for reaction temperature and acidity
Univers
ity of
Mala
ya

82
of catalyst at pH3. Meanwhile, the experimental value (81.37 %) achieved was reasonably
near to the predicted value generated from the model (0.69% of standard error mean). It
can be concluded that the generated model is near to predictability and close to precision
for the nanocellulose yield in the experimental conditions used.
In summary from the results above, it shows that nano scale of cellulose (Ni-NC and
SA-NC) were successfully produced, characterize as well as optimized from oil palm
biomass (EFB) via Ni-Salt and H2SO4 catalyzed treatment.
5.2 Recommendation
The future production of bio-based chemicals and bio-based materials from
lignocellulosic biomass will grow continuously, whereby shifting society’s dependence
from petroleum-based to renewable biomass-based resources. However, the hardest
challenge of this transformation is the separation technology of chemical components
from complexity of biomass with high recovery of each individual valuable component
for production of advanced chemicals in the application of food, energy, health and
environment. The lignocellulosic biomass is composed mainly of cellulose, hemicellulose
and lignin. The presence of highly cellulose content in biomass is potentially converted
to nanocellulose, which is a promising bio-polymer that useful for various industrial
applications, such as personal cares, chemicals, foods, pharmaceuticals and bio-
composites.
In order to secure the continuous supply of nanocellulose materials for various
applications, an economy- and environmental-friendly synthesis process is required to
provide long term manufacturing process without processing problems. In this study, mild
acid hydrolysis of cellulose using inorganic-salt (Ni-salt) was developed for the
preparation of nanocellulose. The finding showed potential process in preparing high
yield of nanocellulose products under milder reaction condition as compared to inorganic
Univers
ity of
Mala
ya

83
acid process, with less equipment corrosion issues and generation of acid water during
post-treatment process. Further studies are recommended to standardize the range of
features and properties of nanocellulose product achieved from Ni-salt hydrolyzed
reaction. It is important to produce a contants and desired range of nanocellulose’s
properties (crystallinity index, particles’ structure, surface morphology, particle sizes, and
aspect ratio) for certain application. Furthermore, reaction kinetic study and large scale
study of nanocellulose production by using Ni-catalyzed reaction is recommended in
order to confirmed the suitability of this new developed technology for the large scale
manufacturing process.
Univers
ity of
Mala
ya

84
REFERENCES
Abd Hamid, S. B., Chowdhury, Z. Z., & Karim, M. Z. (2014). Catalytic Extraction of Microcrystalline Cellulose (MCC) from Elaeis guineensis using Central Composite Design (CCD). BioResources, 9(4), 7403-7426. doi:10.15376/biores.9.4.7403-7426
Abd Hamid, S. B., Chowdhury, Z. Z., Karim, M. Z., & Ali, M. E. (2016). Catalytic
Isolation and Physicochemical Properties of Nanocrystalline Cellulose (NCC) using HCl-FeCl3 System Combined with Ultrasonication. BioResources, 11(2), 3840-3855. doi:10.15376/biores.11.2.3840-3855
Abe, K., & Yano, H. (2009). Comparison of the characteristics of cellulose microfibril
aggregates of wood, rice straw and potato tuber. Cellulose, 16(6), 1017-1023. doi: 10.1007/s10570-009-9334-9
Agbor, V. B., Cicek, N., Sparling, R., Berlin, A., & Levin, D. B. (2011). Biomass
pretreatment: Fundamentals toward application. Biotechnology Advances, 29(6), 675-685. doi: http://dx.doi.org/10.1016/j.biotechadv.2011.05.005
Alemdar, A., & Sain, M. (2008). Isolation and characterization of nanofibers from
agricultural residues – Wheat straw and soy hulls. Bioresource Technology, 99(6), 1664-1671. doi: http://dx.doi.org/10.1016/j.biortech.2007.04.029
Ashby, M. F., & Jones, D. R. H. (2013). General Introduction. In M. F. A. R. H. Jones
(Eds.), Engineering Materials (pp. xvii-xx). Boston: Butterworth-Heinemann. Azizi Samir, M. A. S., Alloin, F., & Dufresne, A. (2005). Review of Recent Research into
Cellulosic Whiskers, Their Properties and Their Application in Nanocomposite Field. Biomacromolecules, 6(2), 612-626. doi: 10.1021/bm0493685
Beck-Candanedo, S., Roman, M., & Gray, D. G. (2005). Effect of Reaction Conditions
on the Properties and Behavior of Wood Cellulose Nanocrystal Suspensions. Biomacromolecules, 6(2), 1048-1054. doi: 10.1021/bm049300p
Bhatnagar, A., & Sain, M. (2005). Processing of Cellulose Nanofiber-reinforced
Composites. Journal of Reinforced Plastics and Composites, 24(12), 1259-1268. doi: 10.1177/0731684405049864
Bhatt, N., Gupta, P. K., & Naithani, S. (2008). Preparation of cellulose sulfate from α-
cellulose isolated from Lantana camara by the direct esterification method. Journal of Applied Polymer Science, 108(5), 2895-2901. doi: 10.1002/app.27773
Bono, A., Sarbatly, R., Krishnaiah, D., Muei, C., Yan, F. Y., & Ying, P. (2009). Synthesis
and characterization of carboxymethyl cellulose from palm kernel cake. Advances in Natural and Applied Sciences, 3(1), 5-11.
Univers
ity of
Mala
ya

85
Bozell, J. J., O'Lenick, C. J., & Warwick, S. (2011). Biomass Fractionation for the Biorefinery: Heteronuclear Multiple Quantum Coherence–Nuclear Magnetic Resonance Investigation of Lignin Isolated from Solvent Fractionation of Switchgrass. Journal of Agricultural and Food Chemistry, 59(17), 9232-9242. doi: 10.1021/jf201850b
Brinchi, L., Cotana, F., Fortunati, E., & Kenny, J. (2013). Production of nanocrystalline
cellulose from lignocellulosic biomass: technology and applications. Carbohydrate Polymer, 94(1), 154-169.
Chen, Y., Liu, C., Chang, P. R., Cao, X., & Anderson, D. P. (2009). Bionanocomposites
based on pea starch and cellulose nanowhiskers hydrolyzed from pea hull fibre: Effect of hydrolysis time. Carbohydrate Polymer, 76(4), 607-615. doi: http://dx.doi.org/10.1016/j.carbpol.2008.11.030
Chen, Y. W., Lee, H. V., & Abd Hamid, S. B. (2016). A Response Surface Methodology
Study: Effects of Trivalent Cr3+ Metal Ion-Catalyzed Hydrolysis on Nanocellulose Crystallinity and Yield. BioResourse, 11(2), 4645-4662. doi:10.15376/biores.11.2.4645-4662
Correia, J. A. d. C., Júnior, J. E. M., Gonçalves, L. R. B., & Rocha, M. V. P. (2013).
Alkaline hydrogen peroxide pretreatment of cashew apple bagasse for ethanol production: Study of parameters. Bioresource Technology, 139, 249-256. doi: http://dx.doi.org/10.1016/j.biortech.2013.03.153
Cunha, I., Sawaya, A. C., Caetano, F. M., Shimizu, M. T., Marcucci, M. C., Drezza, F.
T., . . . Carvalho, P. d. O. (2004). Factors that influence the yield and composition of Brazilian propolis extracts. Journal of the Brazilian Chemical Society, 15(6), 964-970.
Cybulska, I., Brudecki, G., Rosentrater, K., Julson, J. L., & Lei, H. (2012). Comparative
study of organosolv lignin extracted from prairie cordgrass, switchgrass and corn stover. Bioresource Technology, 118, 30-36. doi: 10.1016/j.biortech.2012.05.073
Das, K., Ray, D., Bandyopadhyay, N. R., & Sengupta, S. (2010). Study of the Properties
of Microcrystalline Cellulose Particles from Different Renewable Resources by XRD, FTIR, Nanoindentation, TGA and SEM. Journal of Polymers and the Environment, 18(3), 355-363. doi: 10.1007/s10924-010-0167-2
de Wild, P., Van der Laan, R., Kloekhorst, A., & Heeres, E. (2009). Lignin valorisation
for chemicals and (transportation) fuels via (catalytic) pyrolysis and hydrodeoxygenation. Environmental Progress & Sustainable Energy, 28(3), 461-469. doi: 10.1002/ep.10391
Dhepe, P. L., & Fukuoka, A. (2008). Cellulose conversion under heterogeneous catalysis.
ChemSusChem, 1(12), 969-975. doi: 10.1002/cssc.200800129 Doherty, W. O. S., Mousavioun, P., & Fellows, C. M. (2011). Value-adding to cellulosic
ethanol: Lignin polymers. Industrial Crops and Products, 33(2), 259-276. doi: http://dx.doi.org/10.1016/j.indcrop.2010.10.022
Univers
ity of
Mala
ya

86
Dufresne, A. (2013). Nanocellulose: from nature to high performance tailored materials. Berlin, Germany: De Gruyter.
Dumitriu, S. (2004). Polysaccharides: structural diversity and functional versatility(2nd
ed.). Canada:Taylor & Francis. Eichhorn, S. J., Dufresne, A., Aranguren, M., Marcovich, N. E., Capadona, J. R., Rowan,
S. J., Peijs, T. (2010). Review: current international research into cellulose nanofibres and nanocomposites. Journal of Materials Science, 45(1), 1-33. doi: 10.1007/s10853-009-3874-0
Eichhorn, S. J., Young, R. J., & Davies, G. R. (2005). Modeling Crystal and Molecular
Deformation in Regenerated Cellulose Fibers. Biomacromolecules, 6(1), 507-513. doi: 10.1021/bm049409x
Esa, F., Tasirin, S. M., & Rahman, N. A. (2014). Overview of Bacterial Cellulose
Production and Application. Agriculture and Agricultural Science Procedia, 2, 113-119. doi: http://dx.doi.org/10.1016/j.aaspro.2014.11.017
Fahma, F., Iwamoto, S., Hori, N., Iwata, T., & Takemura, A. (2010). Isolation,
preparation, and characterization of nanofibers from oil palm empty-fruit-bunch (OPEFB). Cellulose, 17(5), 977-985. doi: 10.1007/s10570-010-9436-4
French, A. (2014). Idealized powder diffraction patterns for cellulose polymorphs.
Cellulose, 21(2), 885-896. doi: 10.1007/s10570-013-0030-4 Fu, D., & Mazza, G. (2011). Aqueous ionic liquid pretreatment of straw. Bioresource
Technology, 102(13), 7008-7011. doi: 10.1016/j.biortech.2011.04.049 Gibson, L. J. (2012). The hierarchical structure and mechanics of plant materials. J R Soc
Interface, 9(76), 2749-2766. doi: 10.1098/rsif.2012.0341 Grube, M., Lin, J. G., Lee, P. H., & Kokorevicha, S. (2006). Evaluation of sewage sludge-
based compost by FT-IR spectroscopy. Geoderma, 130(3–4), 324-333. doi:10.1016/j.geoderma.2005.02.005
Harmsen, P., Huijgen, W., Bermudez, L., & Bakker, R. (2010). Literature review of
physical and chemical pretreatment processes for lignocellulosic biomass. Wageningen, Netherland: Food & Biobased Research.
Henriksson, M., Berglund, L. A., Isaksson, P., Lindström, T., & Nishino, T. (2008).
Biomacromolecules, 9, 1579. Himmel, M. E., Ding, S.-Y., Johnson, D. K., Adney, W. S., Nimlos, M. R., Brady, J. W.,
& Foust, T. D. (2007). Biomass Recalcitrance: Engineering Plants and Enzymes for Biofuels Production. Science, 315(5813), 804-807. doi: 10.1126/science.1137016
Instruments, H.A. (2012). Guidebook to Particle Size Analysis.Understanding and
interpreting particle size distribution. Retrived from http://www.horiba. com/fileadmin/uploads/Scientific/Documents/PSA. PS A_Guidebook
Univers
ity of
Mala
ya

87
Iwamoto, S., Nakagaito, A. N., & Yano, H. (2007). Isolation, preparation, and
characterization of nanofibers from oil palm empty-fruit-bunch (OPEFB). Appl. Phys. A, 89, 461.
Jahan, M. S., Saeed, A., He, Z., & Ni, Y. (2011). Jute as raw material for the preparation of microcrystalline cellulose. Cellulose, 18(2), 451-459. doi: 10.1007/s10570-010-9481-z
Joaquim, A. P., Tonoli, G. H. D., Santos, S. F. D., & Savastano Junior, H. (2009). Sisal
organosolv pulp as reinforcement for cement based composites. Materials Research, 12, 305-314.
Johar, N., Ahmad, I., & Dufresne, A. (2012). Extraction, preparation and characterization
of cellulose fibres and nanocrystals from rice husk. Industrial Crops and Products, 37(1), 93-99. doi: http://dx.doi.org/10.1016/j.indcrop.2011.12.016
Jonoobi, M., Khazaeian, A., Tahir, P. M., Azry, S. S., & Oksman, K. (2011).
Characteristics of cellulose nanofibers isolated from rubberwood and empty fruit bunches of oil palm using chemo-mechanical process. Cellulose, 18(4), 1085-1095.
Kalia, S., Dufresne, A., Cherian, B. M., Kaith, B., Avérous, L., Njuguna, J., &
Nassiopoulos, E. (2011). Cellulose-based bio-and nanocomposites: a review. International Journal of Polymer Science, 2011(1),30-35.
Kamireddy, S. R., Li, J., Tucker, M., Degenstein, J., & Ji, Y. (2013). Effects and
mechanism of metal chloride salts on pretreatment and enzymatic digestibility of corn stover. Industrial & Engineering Chemistry Research, 52(5), 1775-1782.
Karim, M. Z., Chowdhury, Z. Z., Hamid, S. B. A., & Ali, M. E. (2014). Statistical
Optimization for Acid Hydrolysis of Microcrystalline Cellulose and Its Physiochemical Characterization by Using Metal Ion Catalyst. Materials, 7(10), 6982-6999.
Khalil, H. P. S. A., Jawaid, M., Hassan, A., Paridah, M. T., & Zaidon, A. (2012). Oil
Palm Biomass Fibres and Recent Advancement in Oil Palm Biomass Fibres Based Hybrid Biocomposites (Hu, N.Ed.). Croatia: InTech
Kumar, A., Negi, Y. S., Choudhary, V., & Bhardwaj, N. K. (2014). Characterization of
Cellulose Nanocrystals Produced by Acid-Hydrolysis from Sugarcane Bagasse as Agro-Waste. Journal of Materials Physics and Chemistry, 2(1), 1-8.
Kumar, P., Barrett, D. M., Delwiche, M. J., & Stroeve, P. (2009). Methods for
pretreatment of lignocellulosic biomass for efficient hydrolysis and biofuel production. Industrial & Engineering Chemistry Research, 48(8), 3713-3729.
Kumar, S., & Singh, R. K. (2014). Optimization of process parameters by response
surface methodology (RSM) for catalytic pyrolysis of waste high-density polyethylene to liquid fuel. Journal of Environmental Chemical Engineering, 2(1), 115-122. doi: http://dx.doi.org/10.1016/j.jece.2013.12.001
Univers
ity of
Mala
ya

88
Lai, L.-W., & Idris, A. (2013b). Disruption of oil palm trunks and fronds by microwave-alkali pretreatment. BioResources, 8(2), 2792-2804.
Lange, J.-P. (2007). Lignocellulose conversion: an introduction to chemistry, process and
economics. Biofuels, Bioproducts and Biorefining, 1(1), 39-48. doi: 10.1002/bbb.7
Lee, H. V., Hamid, S. B. A., & Zain, S. K. (2014). Conversion of Lignocellulosic Biomass
to Nanocellulose: Structure and Chemical Process. The Scientific World Journal, 2014, 20. doi: 10.1155/2014/631013
Lee, H. V., Yunus, R., Juan, J. C., & Taufiq-Yap, Y. H. (2011). Process optimization
design for jatropha-based biodiesel production using response surface methodology. Fuel Processing Technology, 92(12), 2420-2428. doi: http://dx.doi.org/10.1016/j.fuproc.2011.08.018
Li, J., Zhang, X., Zhang, M., Xiu, H., & He, H. (2015). Ultrasonic enhance acid hydrolysis
selectivity of cellulose with HCl-FeCl3 as catalyst. Carbohydr Polym, 117, 917-922. doi: 10.1016/j.carbpol.2014.10.028
Lindman, B., Karlström, G., & Stigsson, L. (2010). On the mechanism of dissolution of
cellulose. Journal of Molecular Liquids, 156(1), 76-81. doi: http://dx.doi.org/10.1016/j.molliq.2010.04.016
Liu, C., & Wyman, C. E. (2006). The enhancement of xylose monomer and xylotriose
degradation by inorganic salts in aqueous solutions at 180 C. Carbohydrate research, 341(15), 2550-2556.
Liu, L., Sun, J., Cai, C., Wang, S., Pei, H., & Zhang, J. (2009). Corn stover pretreatment
by inorganic salts and its effects on hemicellulose and cellulose degradation. Bioresource Technology, 100(23), 5865-5871.
López-Linares, J. C., Romero, I., Moya, M., Cara, C., Ruiz, E., & Castro, E. (2013).
Pretreatment of olive tree biomass with FeCl 3 prior enzymatic hydrolysis. Bioresource Technology, 128, 180-187.
Lu, Q., Tang, L., Lin, F., Wang, S., Chen, Y., Chen, X., & Huang, B. (2014). Preparation
and characterization of cellulose nanocrystals via ultrasonication-assisted FeCl3-catalyzed hydrolysis. Cellulose, 21(5), 3497-3506. doi: 10.1007/s10570-014-0376-2
Man, Z., Muhammad, N., Sarwono, A., Bustam, M. A., Kumar, M. V., & Rafiq, S. (2011).
Preparation of cellulose nanocrystals using an ionic liquid. Journal of Polymers and the Environment, 19(3), 726-731.
McIntosh, S., & Vancov, T. (2010). Enhanced enzyme saccharification of Sorghum
bicolor straw using dilute alkali pretreatment. Bioresource Technology, 101(17), 6718-6727. doi: http://dx.doi.org/10.1016/j.biortech.2010.03.116
Mikkonen, K. S., & Tenkanen, M. (2012). Sustainable food-packaging materials based
on future biorefinery products: Xylans and mannans. Trends in Food Science & Technology, 28(2), 90-102. doi: http://dx.doi.org/10.1016/j.tifs.2012.06.012
Univers
ity of
Mala
ya

89
Mohamad Haafiz, M. K., Eichhorn, S. J., Hassan, A., & Jawaid, M. (2013). Isolation and characterization of microcrystalline cellulose from oil palm biomass residue. Carbohydr Polym, 93(2), 628-634. doi: 10.1016/j.carbpol.2013.01.035
Morais, J. P. S., Rosa, M. d. F., Nascimento, L. D., do Nascimento, D. M., & Cassales,
A. R. (2013). Extraction and characterization of nanocellulose structures from raw cotton linter. Carbohydr Polym, 91(1), 229-235.
Nazir, M. S., Wahjoedi, B. A., Yussof, A. W., & Abdullah, M. A. (2013). Eco-Friendly
Extraction and Characterization of Cellulose from Oil Palm Empty Fruit Bunches BioResourse, 8(2), 2161-2172. doi:10.15376/biores.8.2.2161-2172
Ng, W. P. Q., Lam, H. L., Ng, F. Y., Kamal, M., & Lim, J. H. E. (2012). Waste-to-wealth:
green potential from palm biomass in Malaysia. Journal of Cleaner Production, 34(0), 57-65. doi: http://dx.doi.org/10.1016/j.jclepro.2012.04.004
Park, S., Baker, J. O., Himmel, M. E., Parilla, P. A., & Johnson, D. K. (2010). Research
cellulose crystallinity index: measurement techniques and their impact on interpreting cellulase performance. Biotechnol Biofuels, 3(10),68.
Peng, B. L., Dhar, N., Liu, H. L., & Tam, K. C. (2011). Chemistry and applications of
nanocrystalline cellulose and its derivatives: A nanotechnology perspective. The Canadian Journal of Chemical Engineering, 89(5), 1191-1206. doi: 10.1002/cjce.20554
Poletto, M., Zattera, A. J., Forte, M. M. C., & Santana, R. M. C. (2012). Thermal
decomposition of wood: Influence of wood components and cellulose crystallite size. Bioresource Technology, 109(0), 148-153. doi: http://dx.doi.org/10.1016/j.biortech.2011.11.122
Prodyut, D., Umesh, B., Amit, K., & Vimal, K. (2014). Cellulose Nanocrystals: A
Potential Nanofiller for Food Packaging Applications Food Additives and Packaging. American Chemical Society, 1162, 197-239:
Química NovaRamos, L. P. (2003). The chemistry involved in the steam treatment of lignocellulosic materials. Química Nova, 26, 863-871. Rosnah, M., Ghazali, A., Wan Rosli, W., & Dermawan, Y. (2010). Influence of alkaline
peroxide treatment duration on the pulpability of oil palm empty fruit bunch. World Applied Sciences Journal, 8(2), 185-192.
Salas, C., Nypelö, T., Rodriguez-Abreu, C., Carrillo, C., & Rojas, O. J. (2014).
Nanocellulose properties and applications in colloids and interfaces. Current Opinion in Colloid & Interface Science, 19(5), 383-396. doi: http://dx.doi.org/10.1016/j.cocis.2014.10.003
Saratale, G. D., & Oh, S. E. (2014). Lignocellulosics to ethanol: The future of the chemical and energy industry. African Journal of Biotechnology, 11(5), 1002-1013.
Sathitsuksanoh, N., Zhu, Z., & Zhang, Y. H. P. (2012). Cellulose solvent-based
pretreatment for corn stover and avicel: concentrated phosphoric acid versus ionic liquid [BMIM]Cl. Cellulose, 19(4), 1161-1172. doi: 10.1007/s10570-012-9719-z
Univers
ity of
Mala
ya

90
Scheller, H. V., & Ulvskov, P. (2010). Hemicelluloses. Annu Rev Plant Biol, 61, 263-
289. doi: 10.1146/annurev-arplant-042809-112315 Schuerch, C. (1968). Methods of wood chemistry. (B. L. Browning, Ed.). New
York:Wiley. Sèbe, G., Ham-Pichavant, F., Ibarboure, E., Koffi, A. L. C., & Tingaut, P. (2012).
Supramolecular Structure Characterization of Cellulose II Nanowhiskers Produced by Acid Hydrolysis of Cellulose I Substrates. Biomacromolecules, 13(2), 570-578. doi: 10.1021/bm201777j
Shahabi-Ghahafarrokhi, I., Khodaiyan, F., Mousavi, M., & Yousefi, H. (2015).
Preparation and characterization of nanocellulose from beer industrial residues using acid hydrolysis/ultrasound. Fibers and Polymers, 16(3), 529-536. doi: 10.1007/s12221-015-0529-4
Shinoj, S., Visvanathan, R., Panigrahi, S., & Kochubabu, M. (2011). Oil palm fiber (OPF)
and its composites: A review. Industrial Crops and Products, 33(1), 7-22. Shuit, S. H., Tan, K. T., Lee, K. T., & Kamaruddin, A. H. (2009). Oil palm biomass as a
sustainable energy source: A Malaysian case study. Energy, 34(9), 1225-1235. doi: http://dx.doi.org/10.1016/j.energy.2009.05.008
Singh, P., Sulaiman, O., Hashim, R., Peng, L. C., & Singh, R. P. (2013). Using biomass
residues from oil palm industry as a raw material for pulp and paper industry: potential benefits and threat to the environment. Environment, development and sustainability, 15(2), 367-383.
Smidt, E., Eckhardt, K. U., Lechner, P., Schulten, H. R., & Leinweber, P. (2005).
Characterization of different decomposition stages of biowaste using FT-IR spectroscopy and pyrolysis-field ionization mass spectrometry. Biodegradation, 16(1), 67-79.
Song, J., Fan, H., Ma, J., & Han, B. (2013). Conversion of glucose and cellulose into
value-added products in water and ionic liquids. Green Chemistry, 15(10), 2619-2635. doi: 10.1039/C3GC41141A
Souza, N., Pinheiro, J., Brígida, A., Morais, J., Filho, M. S., & Rosa, M. (2013, Nov).
Cellulose Nano Whiskers from Oil Palm Fibers. Paper presented at the International Association of Embrapa Agroindústria de Alimentos-Artigo em anais de congresso (ALICE),Mexico.
Sulaiman, F., Abdullah, N., Gerhauser, H., & Shariff, A. (2011). An outlook of Malaysian energy, oil palm industry and its utilization of wastes as useful resources. Biomass and bioenergy, 35(9), 3775-3786.
Sun, R., Fang, J., Mott, L., & Bolton, J. (1999). Extraction and characterization of
hemicelluloses and cellulose from oil palm trunk and empty fruit bunch fibres. Journal of wood chemistry and technology, 19(1-2), 167-185.
Univers
ity of
Mala
ya

91
Tang, L.-G., Hon, D. N. S., Pan, S.-H., Zhu, Y.-Q., Wang, Z., & Wang, Z.-Z. (1996). Evaluation of microcrystalline cellulose. I. Changes in ultrastructural characteristics during preliminary acid hydrolysis. Journal of Applied Polymer Science, 59(3), 483-488. doi: 10.1002/(SICI)1097-4628(19960118)59:3<483::AID-APP13>3.0.CO;2-V
Technical Association of the, P., & Paper, I. (1973). TAPPI directory / Technical
Association of the Pulp and Paper Industry. doi: Technical Association of the Pulp and Paper Industry. Washington, DC: Technical Association of the Pulp & Paper.
Umar, M. S., Jennings, P., & Urmee, T. (2013). Strengthening the palm oil biomass
Renewable Energy industry in Malaysia. Renewable Energy, 60, 107-115. Wang, N., Ding, E., & Cheng, R. (2007). Thermal degradation behaviors of spherical
cellulose nanocrystals with sulfate groups. Polymer, 48(12), 3486-3493. Wittaya, T. (2009). Microcomposites of rice starch film reinforced with microcrystalline
cellulose from palm pressed fiber. International Food Research Journal, 16(4), 493-500.
Wu, Q., Henriksson, M., Liu, X,& Berglund, L. (2007). A high strength nanocomposite
based on Microcrystalline cellulose and Polyurethane. Biomacromolecules, 8, 3687.
Xiao-shu, C., & Wen-xun, F. (1992). Studies of utilization and health effect of palm oil
in China. Nutrition Research, 12, S23-S29. doi: 10.1016/S0271-5317(05)80447-6
Xu, X., Liu, F., Jiang, L., Zhu, J. Y., Haagenson, D., & Wiesenborn, D. P. (2013).
Cellulose Nanocrystals vs. Cellulose Nanofibrils: A Comparative Study on Their Microstructures and Effects as Polymer Reinforcing Agents. ACS Applied Materials & Interfaces, 5(8), 2999-3009. doi: 10.1021/am302624t
Yahya, M. B., Lee, H. V., & Abd Hamid, S. B. (2015). Preparation of Nanocellulose via
Transition Metal Salt-Catalyzed Hydrolysis Pathway. BioResourse, 10(4), 7627-7639. doi:10.15376/biores.10.4.7627-7639
Yan, F. Y., Krishniah, D., Rajin, M., & Bono, A. (2009). Cellulose extraction from palm
kernel cake using liquid phase oxidation. J Engg Sci Tech, 4, 57-68. Yan, Y., Li, T., Ren, Z., & Li, G. (1996). A study on catalytic hydrolysis of peat.
Bioresource Technology, 57(3), 269-273. Yang, H., Yan, R., Chen, H., Lee, D. H., & Zheng, C. (2007). Characteristics of
hemicellulose, cellulose and lignin pyrolysis. Fuel, 86(12–13), 1781-1788. doi: http://dx.doi.org/10.1016/j.fuel.2006.12.013
Yang, Q., Pan, X., Huang, F., & Li, K. (2011). Synthesis and characterization of cellulose
fibers grafted with hyperbranched poly(3-methyl-3-oxetanemethanol). Cellulose, 18(6), 1611-1621. doi: 10.1007/s10570-011-9587-y
Univers
ity of
Mala
ya

92
Zain, N., Yusop, S., & Ahmad, I. (2014). Preparation and Characterization of Cellulose and Nanocellulose From Pomelo (Citrus grandis) Albedo. J Nutr Food Sci, 5(334), 2.
Zhang, F., Deng, X., Fang, Z., Zeng, H., Tian, X., & Kozinski, J. (2011). Hydrolysis of
microcrystalline cellulose over Zn-Ca-Fe oxide catalyst. Petrochemical Technology, 40(1), 43-48.
Zhang, S.-Y., Wang, C.-G., Fei, B.-H., Yu, Y., Cheng, H.-T., & Tian, G.-L. (2013).
Mechanical Function of Lignin and Hemicelluloses in Wood Cell Wall Revealed with Microtension of Single Wood Fiber. BioResourse, 8(2), 2376-2385. doi:10.15376/biores.8.2.2376-2385
Zhang, Y., Li, Q., Su, J., Lin, Y., Huang, Z., Lu, Y., Hu, H. (2015). A green and efficient
technology for the degradation of cellulosic materials: structure changes and enhanced enzymatic hydrolysis of natural cellulose pretreated by synergistic interaction of mechanical activation and metal salt. Bioresource Technology, 177, 176-181.
Zhao, J., Zhang, H., Zheng, R., Lin, Z., & Huang, H. (2011a). The enhancement of
pretreatment and enzymatic hydrolysis of corn stover by FeSO4 pretreatment. Biochemical Engineering Journal, 56(3), 158-164. doi: http://dx.doi.org/10.1016/j.bej.2011.06.002
Zheng, Y., Lee, C., Yu, C., Cheng, Y.-S., Zhang, R., Jenkins, B. M., & VanderGheynst,
J. S. (2013). Dilute acid pretreatment and fermentation of sugar beet pulp to ethanol. Applied Energy, 105, 1-7. doi: http://dx.doi.org/10.1016/j.apenergy.2012.11.070
Univers
ity of
Mala
ya
93
LIST OF PUBLICATIONS AND PAPERS PRESENTED
SCOPUS/ISI Cited Publications:
1. Mazlita, Y, H.V. Lee, S.B.A. Hamid and S.K. Zain (2015), Chemical Conversion
of Palm-based Lignocellulosic Biomass to Nano- Cellulose: Review, Polymer
Research Journal, 9(4), 1-22. (Published-SCOPUS Cited Publication)
2. Yahya, M., Lee, H. V., and Abd Hamid, S. B. (2015). Preparation of
Nanocellulose via Transition Metal Salt- Catalyzed Hydrolysis Pathway.
BioResource 10:7627-7639 (Published-ISI Cited Publication)
3. Mazlita, Y., H.V Lee and S.B.A. Hamid (2016). Preparation of Cellulose
Nanocrystals (CNCs) Bio-polymer from Agro-Industrial Wastes: Separation and
Characterization. Polymer and Polymer Composites (Accepted-ISI Cited
Publication)
Conference Proceedings:
1. Mazlita, Y, H.V. Lee, S.B.A. Hamid (2014). Chemical Conversion of Palm-
based Lignocellulosic Biomass to Nano- Cellulose: Review. Proceeding of 9th
International Materials Technology Conference & Exhibition (IMTCE), 3-4 May
2014, Kuala Lumpur, Malaysia.
2. Mazlita, Y, H.V. Lee, S.B.A. Hamid (2014). Extraction and Characterization of
Cellulose and Nanocellulose from Palm Trunk Biomass via Chemical route.
Proceeding of Seminar on Palm Oil Milling, Refining, Environment and Quality
(POMREQ), 3-5 November 2014, Sarawak, Malaysia.
3. Mazlita, Y, H.V. Lee, S.B.A. Hamid (2015).Extraction and isolation of
Nanocellulose via Nickel Nitrate catalyzed hydrolysis. Proceeding of Malaysia
Polymer International Conference (MPIC), 10-11 June 2015, Putrajaya, Malaysia
Univers
ity of
Mala
ya

94
4. Mazlita, Y, H.V. Lee, S.B.A. Hamid (2015). A Novel Green Approach for The
Preparation Of Nanocellulose From Oil Palm Biomass. Proceeding of
International Conference On Waste And Management (ICWME), 20-22 August
2015, Kuala Lumpur. Malaysia
5. Mazlita, Y, H.V. Lee, S.B.A. Hamid (2015). A Renewable Source for The
Production of Nanocellulose. Proceeding of Malaysian Palm Oil Board
International Palm Oil Congress and Exhibition (PIPOC) 2015, 6-8 October
2015, Kuala Lumpur. Malaysia
Univers
ity of
Mala
ya