Embed Size (px)
Citation preview
1
SYNOPSIS
Mayur Uniquoters Limited engages in
the manufacture and sale of PU, PVC,
and PU-PVC synthetic leather
products in India.
During the quarter ended, the
robust growth of revenue is
increased by 29.00% Rs.695.77
million.
Mayur Uniquoters Ltd has declared
First Interim Dividend of Rs. 1.50/-
(i.e. 15%) per Equity Share of Rs.
10/- each.
The top line & bottom line of the
company are expected to grow at a
CAGR of 30% and 28% over 2010 to
2013E respectively.
Company has been certified with ISO
9001:2008 (Quality Management
System) which is demonstrative of
their commitment towards continual
improvement.
Years Net sales EBITDA Net Profit EPS P/E
FY 11 2485.56 408.58 252.74 46.69 7.52
FY 12E 3032.38 463.57 289.69 53.52 6.56
FY 13E 3578.21 545.11 342.58 63.29 5.55
Stock Data:
Sector: Textiles
Face Value Rs. 10.00
52 wk. High/Low (Rs.) 467.00/227.00
Volume (2 wk. Avg.) 1643
BSE Code 522249
Market Cap (Rs.In mn) 1899.96
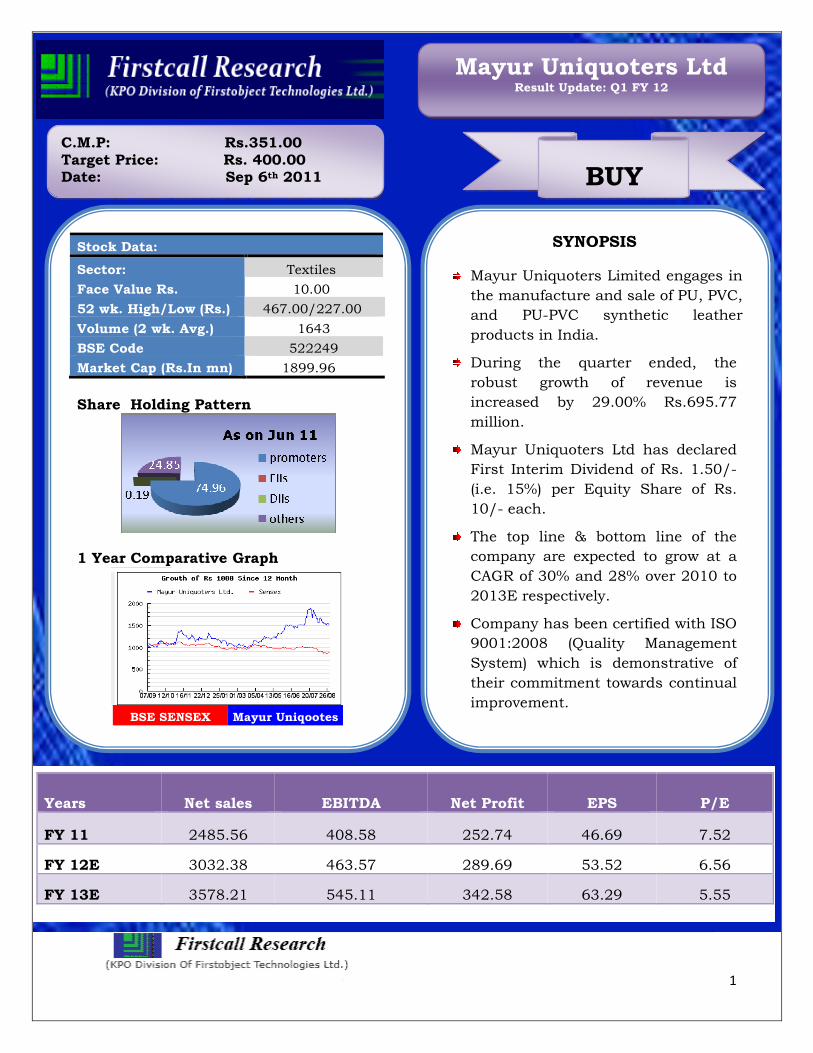
Share Holding Pattern
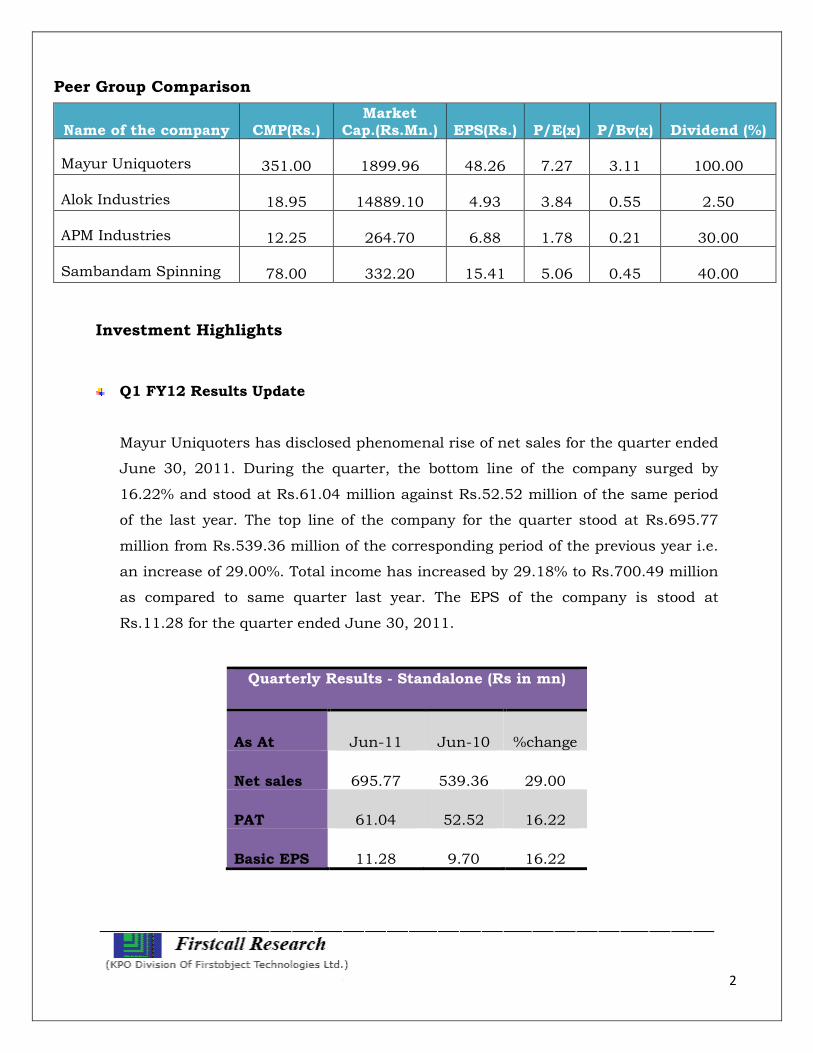
1 Year Comparative Graph
BSE SENSEX Mayur Uniqootes
C.M.P: Rs.351.00 Target Price: Rs. 400.00 Date: Sep 6th 2011 BUY
Mayur Uniquoters Ltd Result Update: Q1 FY 12
2
Peer Group Comparison
Name of the company CMP(Rs.) Market
Cap.(Rs.Mn.) EPS(Rs.) P/E(x) P/Bv(x) Dividend (%)
Mayur Uniquoters 351.00 1899.96 48.26 7.27 3.11 100.00
Alok Industries 18.95 14889.10 4.93 3.84 0.55 2.50
APM Industries 12.25 264.70 6.88 1.78 0.21 30.00
Sambandam Spinning 78.00 332.20 15.41 5.06 0.45 40.00
Investment Highlights
Q1 FY12 Results Update
Mayur Uniquoters has disclosed phenomenal rise of net sales for the quarter ended
June 30, 2011. During the quarter, the bottom line of the company surged by
16.22% and stood at Rs.61.04 million against Rs.52.52 million of the same period
of the last year. The top line of the company for the quarter stood at Rs.695.77
million from Rs.539.36 million of the corresponding period of the previous year i.e.
an increase of 29.00%. Total income has increased by 29.18% to Rs.700.49 million
as compared to same quarter last year. The EPS of the company is stood at
Rs.11.28 for the quarter ended June 30, 2011.
Quarterly Results - Standalone (Rs in mn)
As At Jun-11 Jun-10 %change
Net sales 695.77 539.36 29.00
PAT 61.04 52.52 16.22
Basic EPS 11.28 9.70 16.22
3
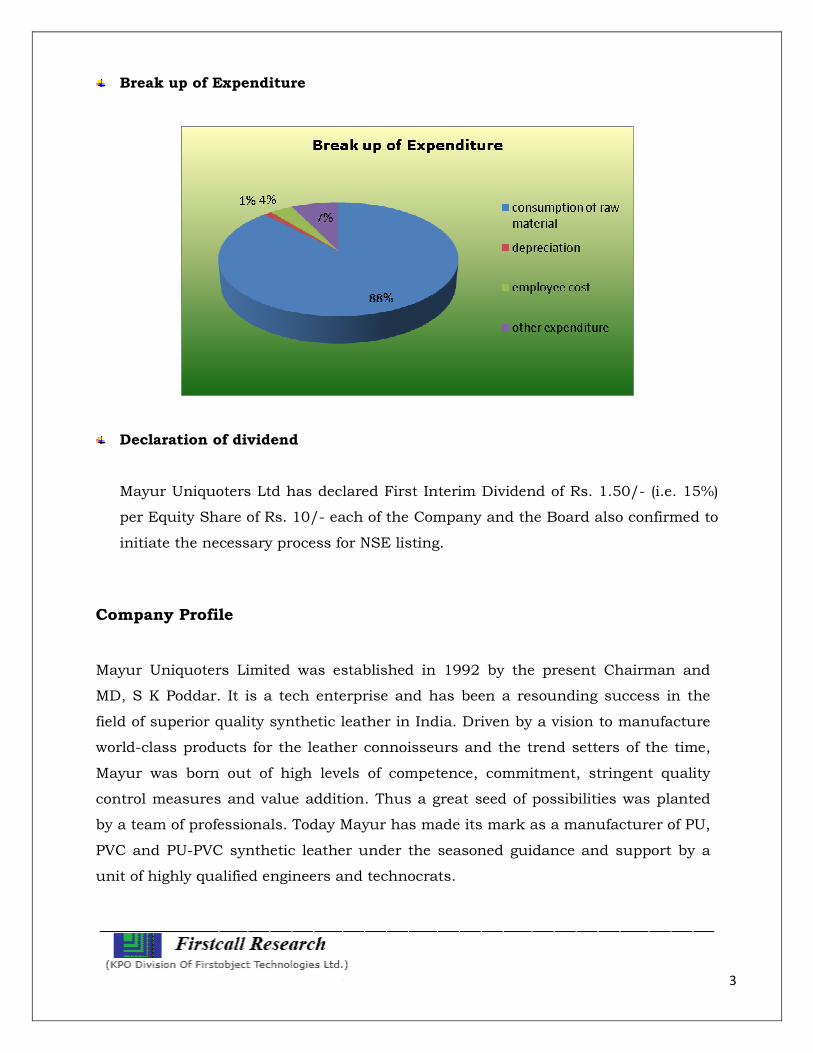
Break up of Expenditure
Declaration of dividend
Mayur Uniquoters Ltd has declared First Interim Dividend of Rs. 1.50/- (i.e. 15%)
per Equity Share of Rs. 10/- each of the Company and the Board also confirmed to
initiate the necessary process for NSE listing.
Company Profile
Mayur Uniquoters Limited was established in 1992 by the present Chairman and
MD, S K Poddar. It is a tech enterprise and has been a resounding success in the
field of superior quality synthetic leather in India. Driven by a vision to manufacture
world-class products for the leather connoisseurs and the trend setters of the time,
Mayur was born out of high levels of competence, commitment, stringent quality
control measures and value addition. Thus a great seed of possibilities was planted
by a team of professionals. Today Mayur has made its mark as a manufacturer of PU,
PVC and PU-PVC synthetic leather under the seasoned guidance and support by a
unit of highly qualified engineers and technocrats.
4
With a large network of premium products, the guiding principle of this enterprise
has always been customer delight, beyond customer satisfaction. And since the limits
of technology can be challenged by the vitality of progressive thinking, with constant
research and development, Mayur marches on in its global pursuit of opening up a
new horizon to the Synthetic leather World.
Making use of the best technologies and raw materials available in the world, having
implemented the best management practices and always striving to be the best in the
business has been the principle of Mayur since it’s inception.
Mayur has responded to changing customer needs of the hour by maintaining state-
of-the-art equipment and facilities like a modern 4 Head Italian Coating Line from
Matex, a fully new coating line, Embossing Machines, Printing machine, Sueding
Machine, Dry and Wet Tumbling Machines. Automated lab with lab-coater from
Werner Mathis, Switzerland, SATRA and Bally Flex Testers and other Laboratory
equipment for quality control.
Product range of the company includes:
Footwear
Automotive
Upholstery / Furnishing
Garments
Luggage / leather goods
Sports goods
5
Clients
Few clients
6
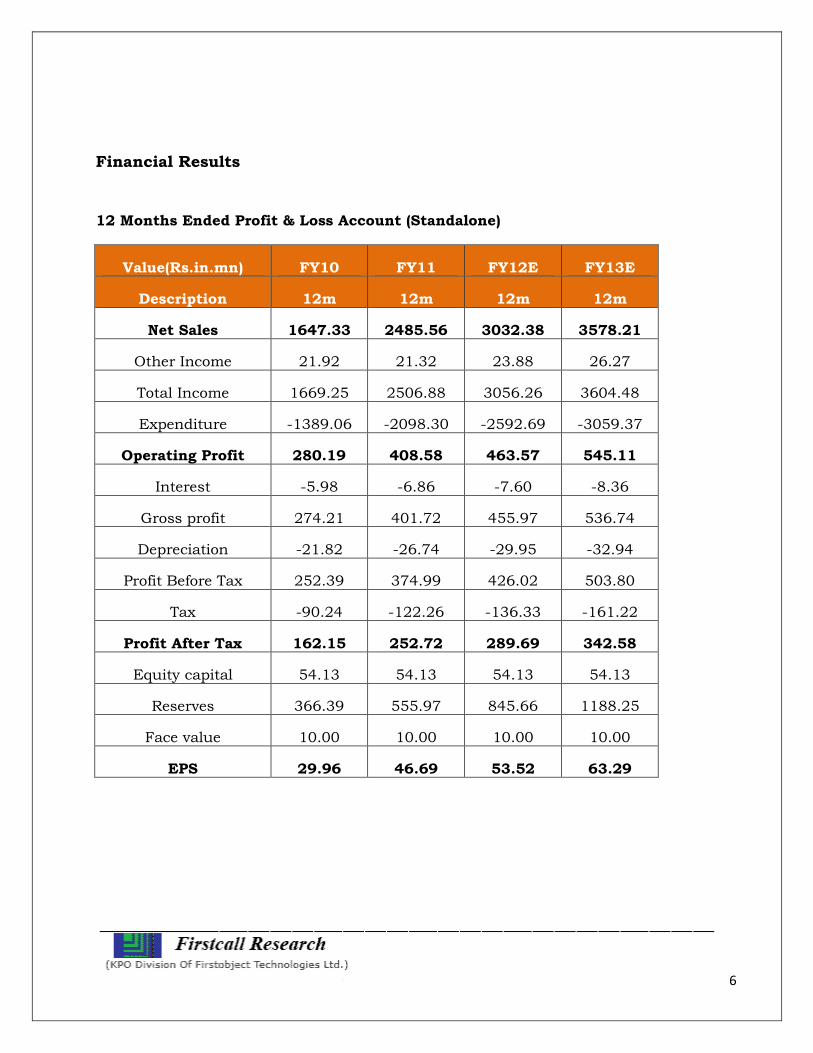
Financial Results
12 Months Ended Profit & Loss Account (Standalone)
Value(Rs.in.mn) FY10 FY11 FY12E FY13E
Description 12m 12m 12m 12m
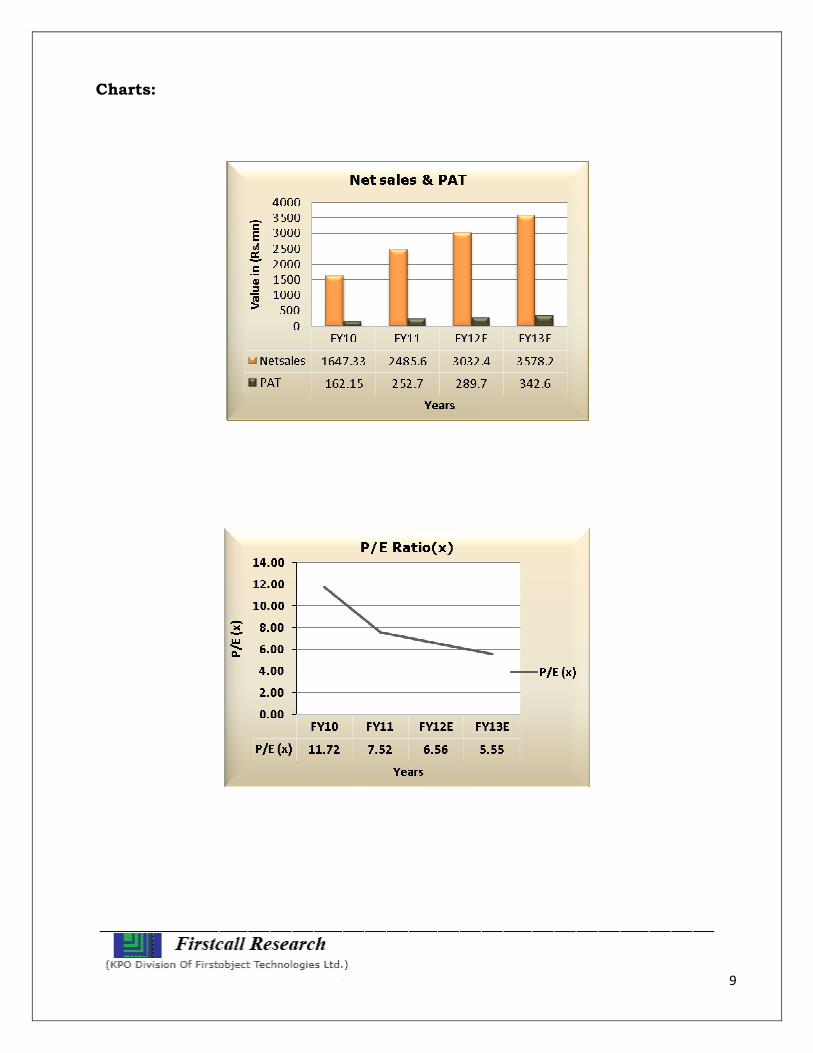
Net Sales 1647.33 2485.56 3032.38 3578.21
Other Income 21.92 21.32 23.88 26.27
Total Income 1669.25 2506.88 3056.26 3604.48
Expenditure -1389.06 -2098.30 -2592.69 -3059.37
Operating Profit 280.19 408.58 463.57 545.11
Interest -5.98 -6.86 -7.60 -8.36
Gross profit 274.21 401.72 455.97 536.74
Depreciation -21.82 -26.74 -29.95 -32.94
Profit Before Tax 252.39 374.99 426.02 503.80
Tax -90.24 -122.26 -136.33 -161.22
Profit After Tax 162.15 252.72 289.69 342.58
Equity capital 54.13 54.13 54.13 54.13
Reserves 366.39 555.97 845.66 1188.25
Face value 10.00 10.00 10.00 10.00
EPS 29.96 46.69 53.52 63.29
7
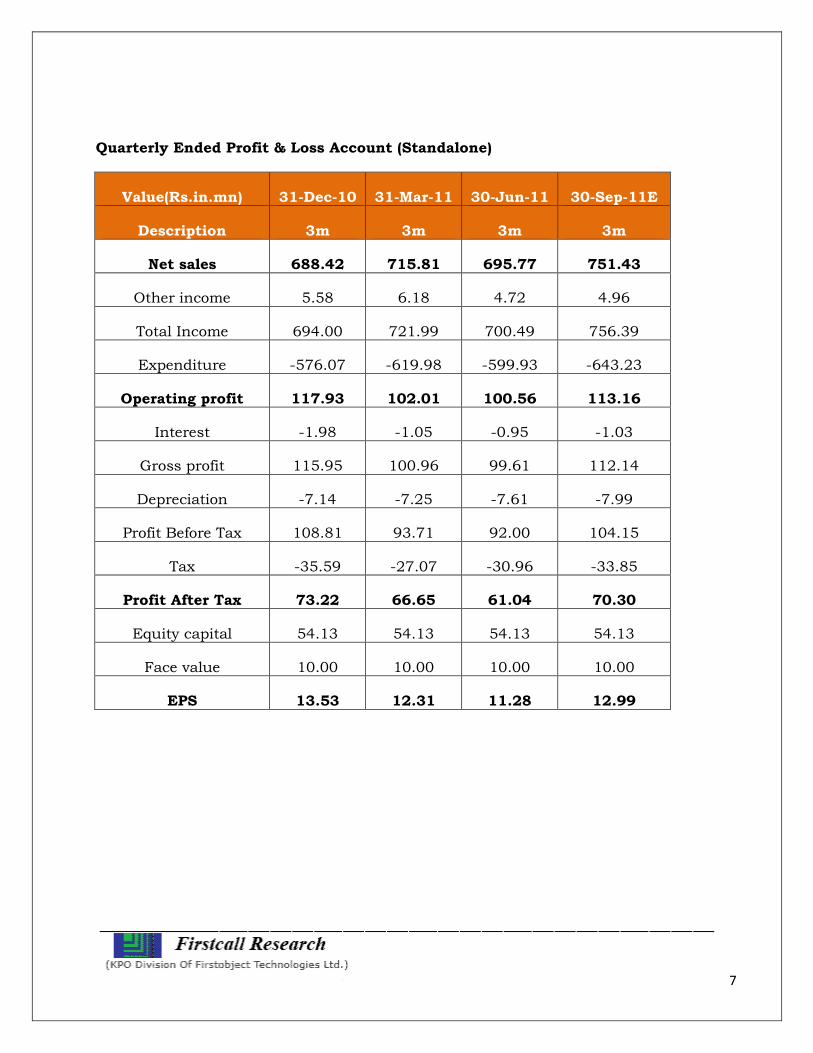
Quarterly Ended Profit & Loss Account (Standalone)
Value(Rs.in.mn) 31-Dec-10 31-Mar-11 30-Jun-11 30-Sep-11E
Description 3m 3m 3m 3m
Net sales 688.42 715.81 695.77 751.43
Other income 5.58 6.18 4.72 4.96
Total Income 694.00 721.99 700.49 756.39
Expenditure -576.07 -619.98 -599.93 -643.23
Operating profit 117.93 102.01 100.56 113.16
Interest -1.98 -1.05 -0.95 -1.03
Gross profit 115.95 100.96 99.61 112.14
Depreciation -7.14 -7.25 -7.61 -7.99
Profit Before Tax 108.81 93.71 92.00 104.15
Tax -35.59 -27.07 -30.96 -33.85
Profit After Tax 73.22 66.65 61.04 70.30
Equity capital 54.13 54.13 54.13 54.13
Face value 10.00 10.00 10.00 10.00
EPS 13.53 12.31 11.28 12.99
8
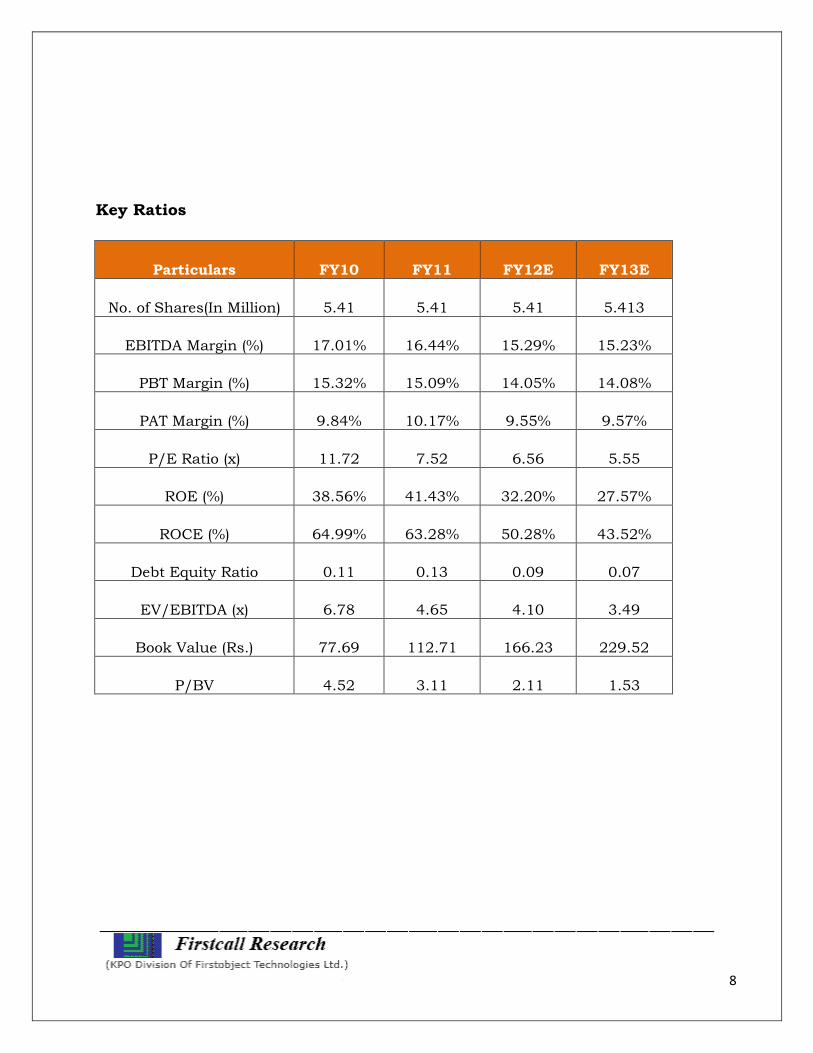
Key Ratios
Particulars FY10 FY11 FY12E FY13E
No. of Shares(In Million) 5.41 5.41 5.41 5.413
EBITDA Margin (%) 17.01% 16.44% 15.29% 15.23%
PBT Margin (%) 15.32% 15.09% 14.05% 14.08%
PAT Margin (%) 9.84% 10.17% 9.55% 9.57%
P/E Ratio (x) 11.72 7.52 6.56 5.55
ROE (%) 38.56% 41.43% 32.20% 27.57%
ROCE (%) 64.99% 63.28% 50.28% 43.52%
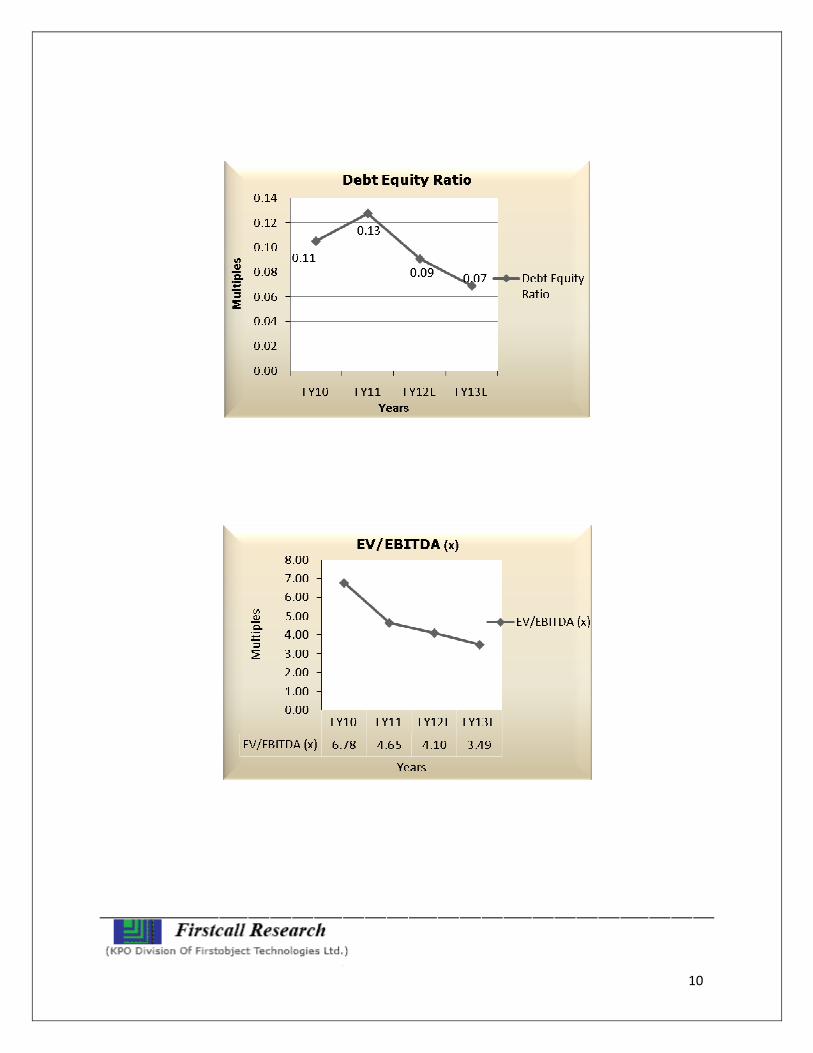
Debt Equity Ratio 0.11 0.13 0.09 0.07
EV/EBITDA (x) 6.78 4.65 4.10 3.49
Book Value (Rs.) 77.69 112.71 166.23 229.52
P/BV 4.52 3.11 2.11 1.53
9
Charts:
10
11
Outlook and Conclusion
At the current market price of Rs.351.00, the stock is trading at 6.56 x FY12E
and 5.55 x FY13E respectively.
Earning per share (EPS) of the company for the earnings for FY12E and FY13E
is seen at Rs.53.52 and Rs.63.29 respectively.
Net Sales and PAT of the company are expected to grow at a CAGR of 30% and
28% over 2010 to 2013E respectively.
On the basis of EV/EBITDA, the stock trades at 4.10 x for FY12E and 3.49 x for
FY13E.
Price to Book Value of the stock is expected to be at 2.11 x and 1.53 x
respectively for FY12E and FY13E.
We expect that the company will keep its growth story in the coming quarters
also. We recommend ‘BUY’ in this particular scrip with a target price of
Rs.400.00 for Medium term investment.
Industry Overview
The textiles industry in India enjoys a distinctive position due to the pivotal role it
plays by way of contribution to industrial output, employment generation (second
largest after agriculture) and export earnings of the country. The industry is rich and
varied, embracing the hand-spun and hand-woven sector at one end and the capital
intensive, sophisticated mill sector at the other. Its association with the ancient
culture and tradition of the country lends it a unique advantage in comparison with
textiles industry of other countries, thus giving it an uncommon edge to cater to a vast
variety of products and market segments both domestically, as well as, globally.
The industry currently contributes about 14 per cent to industrial production, 4 per
cent to GDP, and 17 per cent to the country’s export earnings, according to the
Annual Report 2010-11 of the Ministry of Textiles. The industry accounts for nearly 12
per cent share of the country's total exports basket. It provides direct employment to
more than 35 million people.
12
Industry sub-sectors
The textile industry comprises the following:
• Organised Cotton/Man-Made Fibre Textiles Mill Industry
• Man-Made Fibre / Filament Yarn Industry
• Wool and Woollen Textiles Industry
• Sericulture and Silk Textiles Industry
• Handlooms, Handicrafts, the Jute and Jute Textiles Industry
• Textiles Exports
Market size
The Vision Statement for the textiles industry for the 11th Five Year Plan (2007-12)
sees India securing a 7 per cent share in the global textiles trade by 2012. At current
prices, the Indian textiles industry is valued at US$ 55 billion, 64 per cent of which
caters to domestic demand.
The export of textiles and clothing (T&C) aggregated to US$ 22.42 billion in 2009-10.
The Government fixed the target for 2010-11 at US$ 25.48 billion. So far during the
period April- September 2010, exports of T&C have been achieved at US$ 11.26
billion.
Production
During February 2011, total cloth production rose by 5.8 per cent year-on-year (y-o-y).
During April- February 2011 cloth production increased by 4.5 per cent y-o-y.
Export
Total textile exports during April-December 2010 registered an increase of 16.54 per
cent in rupee terms at Rs 87,582.83 crore as against Rs 75,149.98 crore during the
corresponding period of the previous year, according to the latest data released by
DGCI&S, Kolkata. The same were valued at US$ 19,217.12 million as against US$
13
15,695.07 million during the corresponding period of the previous year, registering an
increase of 22.44 per cent.
The share of textile exports in total exports was 11.29 per cent during April-December
2010 as against 12.34 per cent during April- December 2009.
Technical Textile Segment
The technical textiles segment is expected to grow by 11 per cent per annum till 2012-
13 and is likely to grow at 6-8 per cent per annum till 2020 without any policy
interventions. If the government intervenes by way of regulatory push, the growth of
technical textiles industry can be estimated at 12-15 per cent per annum till 2020,
according to Rita Menon, Secretary, Union Ministry of Textiles. She added that the
technical textiles segment in India has the potential to attract investment and create
additional employment opportunities in coming years. She further said that
investments of US$ 1.1 billion are expected by 2012 and employment is expected to
increase to 1.2 million by 2012.
Government Initiatives
• Technology Upgradation Fund Scheme (TUFS) - The Government has
restructured the TUFS, the flagship scheme of Ministry of Textiles for
upgradation of technology in the textile and jute sectors. The ministry has
issued the Government Resolution on Restructured TUFS for the period
28.04.2011 to 31.03.2012 (both the days inclusive) with an overall subsidy cap
of Rs 1,972 crore (US$ 0.43 billion) during the period. The objective of the
present Scheme is to leverage investments in technology upgradation in the
Textiles and Jute Industry, with a special emphasis on balanced development
across the value chain
• The Scheme for Integrated Textile Park (SITP) - The scheme was approved in
July 2005 to facilitate setting up of textiles parks with world class
infrastructure facilities. Forty parks have been sanctioned till December 31,
2010 in nine states. The estimated project cost (for common infrastructure and
common facilities) is Rs. 4,193.65 Crore (US$ 0.93 billion), of which
Government of India assistance would be Rs. 1,419.69 Crore (US$ 0.31 billion).
14
The projected investment in these parks is Rs. 19,456.90 Crore (US$ 4.32
billion) and estimated annual production is Rs 33,568.50 Crore (US$ 7.45
billion)
• Integrated Skill Development Scheme - The Government launched the
Integrated Skill Development Scheme for the T&C Sector, including Jute &
Handicrafts, in September 2010. The main objective of the scheme is to address
the trained manpower needs of textiles and related segments. The Scheme
would target to train approximately 2,56,000 persons during 2010-11 and
2011-12
• The government has initiated a number of steps to ensure raw materials
security for the textiles industry. In order to balance the interests of all stake
holders across the value chain. A multipronged approach was adopted which
included capping of cotton exports at 55 lac bales for cotton season 2010 – 11;
and permitting yarn exports of 720 million kgs for the year 2010-11
• Fiscal incentives are provided for exports of T&C items under various provisions
of the Foreign Trade Policy 2009-14
• The textile industry is also being supported with an extensive skill development
programme to train 3 million persons over a 5 year period, by leveraging the
strength of existing institutions under the textile ministry
• India has the most liberal and transparent policies in Foreign Direct Investment
(FDI) amongst emerging countries. Under the automatic route, 100 per cent FDI
is allowed in the textile sector. FDI in sectors to the extent permitted under
automatic route does not require any prior approval either by the Government
of India or Reserve Bank of India (RBI)
• The government has proposed some more relaxations for the branded garments
sector, besides enhancement of duty abatement from 40 per cent to 55 per cent
Investment trends
The textile industry plays a significant role in getting the foreign exchange reserves
into the country, contributing to approximately 15 per cent of the total exports from
15
the country. Exports in textiles and apparel have registered a strong growth in last few
years – 11 per cent CAGR from 2004-05 to 2007-08.
India’s liberalisation of its foreign investment regulations, buoyant domestic demand
for textiles, and strong export potential have led to growing foreign investment in the
country. The country has become one of the fastest growing destinations for FDI
inflows and collaboration. India’s Special Economic Zones (SEZs) attract foreign
investment by providing tax incentives, assistance with bureaucratic and
administrative problems, and access to reliable infrastructure.
Foreign companies have been motivated to enter into collaborations with Indian firms
by the increasing profits gains that can be made by producing brands in India and
selling them into the Indian market. Indian companies, on the other hand, have been
motivated by the scope for gaining technical and marketing expertise from foreign
partners.
• The textiles industry has attracted FDI worth US$ 956.97 million between April
2000 and March 2011, according to data released by the Department of
Industrial Policy and Promotion (DIPP)
• Ahmedabad-based textile company Arvind Ltd. has tied up with another major
international brand, Geoffrey Beene, LLC for apparel and non-apparel products.
Geoffrey Beene has licensed Arvind Retail Ltd. to manufacture and market its
men's apparel and non-apparel products
• Ahlstrom Corporation has announced investments of EUR 55 million (US$ 79.2
million) in new and expanded manufacturing capacity, including a new medical
nonwovens plant to be built in India. The new medical nonwovens plant in India
will use spun melt technology and accounts for EUR 38 million (US$ 54.72
million) of the total investment announced.
• India and Russia have signed an agreement to increase investment and trade in
textile industries in both the countries. A memorandum of understanding (MoU)
was signed by the Apparel Export Promotion Council of India (AEPC) and
Russian Union of Entrepreneurs of Textiles and Light Industry. The MoU also
stipulates the promotion of textile trade, participation in fairs and exhibitions,
16
transfer of technology and exchange of know-how in textile manufacturing and
processing
The Road Ahead
India's T&C industry has great potential, and is one of the mainstays of the country’s
economy. The industry has enormous opportunities for domestic as well as
international investors given its consistent growth performance, abundant cheap
skilled manpower and growing domestic demand. With the abolition of quotas, India
has surged ahead of other countries and positioned itself as a value-added
manufacturer with a varied material base, an educated and English-speaking class of
executives with high product development and design orientation.
On the global front, India is set to become an even bigger participant, both as a
consumer and as a producer. The country offers an attractive combination of a large
domestic market, and a base for low cost production. The industry has gained a strong
position in cotton based products, especially in the readymade garments and home
furnishings segment, which are expected to be the key drivers of growth for the
industry.
Besides this, the T&C industry is contributing towards promoting inclusive growth. It
has been contributing to broad based socio-economic development by providing
employment opportunities at local level.
The government envisions building state-of-the-art production capacities and
achieving a preeminent global standing in the textile sector by 2020, which includes
manufacture and export of all types of textiles.

17
________________ ____ _________________________ Disclaimer:
This document prepared by our research analysts does not constitute an offer or solicitation
for the purchase or sale of any financial instrument or as an official confirmation of any
transaction. The information contained herein is from publicly available data or other
sources believed to be reliable but do not represent that it is accurate or complete and it
should not be relied on as such. Firstcall India Equity Advisors Pvt. Ltd. or any of it’s
affiliates shall not be in any way responsible for any loss or damage that may arise to any
person from any inadvertent error in the information contained in this report. This document
is provide for assistance only and is not intended to be and must not alone be taken as the
basis for an investment decision.
18
Firstcall India Equity Research: Email – [email protected]
C.V.S.L.Kameswari Pharma
U. Janaki Rao Capital Goods
D. Ashakirankumar Automobile
A. Rajesh Babu FMCG
H.Lavanya Oil & Gas
T.Joshna Devi Diversified
Dheeraj Bhatia Diversified
Manoj kotian Diversified
Nimesh Gada Diversified
Firstcall India also provides
Firstcall India Equity Advisors Pvt.Ltd focuses on, IPO’s, QIP’s, F.P.O’s,Takeover
Offers, Offer for Sale and Buy Back Offerings.
Corporate Finance Offerings include Foreign Currency Loan Syndications,
Placement of Equity / Debt with multilateral organizations, Short Term Funds
Management Debt & Equity, Working Capital Limits, Equity & Debt
Syndications and Structured Deals.
Corporate Advisory Offerings include Mergers & Acquisitions(domestic and
cross-border), divestitures, spin-offs, valuation of business, corporate
restructuring-Capital and Debt, Turnkey Corporate Revival – Planning &
Execution, Project Financing, Venture capital, Private Equity and Financial
Joint Ventures
Firstcall India also provides Financial Advisory services with respect to raising
of capital through FCCBs, GDRs, ADRs and listing of the same on International
Stock Exchanges namely AIMs, Luxembourg, Singapore Stock Exchanges and
other international stock exchanges.
For Further Details Contact:
3rd Floor,Sankalp,The Bureau,Dr.R.C.Marg,Chembur,Mumbai 400 071
Tel. : 022-2527 2510/2527 6077/25276089 Telefax : 022-25276089
E-mail: [email protected]
www.firstcallindiaequity.com