Embed Size (px)
Citation preview

May 2021
The Japan commercial insurance market
01 Executive summary02 Introduction: corporate
risk management03 Market overview and
outlook08 Growth drivers of future
demand 14 Innovative insurance
solutions16 Conclusion17 Appendix: performance
by line of business


Swiss Re Institute The Japan commercial insurance market 1
Executive summary
We forecast that commercial insurance premiums in Japan will grow by 4.5% this year, compared to an estimated 1.4% growth in 2020 and 2.0% growth on average over the last three years. The upturn will be supported mainly by hardening rates in property premiums. Economic activities and growth are key drivers for insurance demand in the near term. In 2020, Japan’s economy was hit hard by the COVID-19 pandemic, with real GDP contracting 4.8%. Entering 2021, and supported by vaccine roll out and easing of lockdown measures, we expect economic activity to rebound with real GDP to grow by 2.6%. This will lay the foundation for the recovery of insurance demand. On the downside, global interest rates are set to remain low, putting pressure on overall sector profitability.
Japan’s commercial insurance market is the third largest in the world, with premiums of USD 43 billion in 2019. Despite its ranking, we see significant scope for strengthening of business sector risk management. Over the longer term, we expect business disruption (BI) covers to be a source of growth for commercial insurance. Many firms in Japan, particularly small and medium-sized enterprises (SMEs) have little BI coverage in place. The intensifying climate risk and the increasing digitisation of business activities have increased the disruption exposures facing by Japanese firms. According to responses to a survey conducted by World Economic Forum in 2020, natural catastrophes and cyber-attacks are the top two risk concerns for Japanese companies when doing business.1
Japanese companies are eager to go global. In 2019, the total value of outbound investment from Japanese business was USD 1 858 billion, up from USD 301 billion in 2001. However, COVID-19-linked domestic lockdowns and border closures have since caused global supply-chain slowdowns and corresponding business interruption (BI) risk exposures. The pandemic-delayed and potentially “no spectator” Tokyo Olympics, and the Suez Canal blockage in March 2021, have both also disrupted billions-worth of trade.
Innovation is offering new ways to mitigate risks, and there is rising interest in parametric insurance products. Non-physical damage business interruption (NDBI) is a next step in the evolution of solutions for exposures that have been difficult to insure. Over time, the nature of insurable property risks has broadened from traditional property damage to BI and contingent business interruption (CBI). Innovative NDBI insurance solutions can further expand the scope of insurability by helping improve the efficiency of risk transfer.
1 Interactive Map – Regional Risk of Doing Business, World Economic Forum, 2020.
The near-term outlook for premium growth remains positive.
Japanese firms are underinsured for business disruption risk. We see this as a growth area for commercial insurers over the longer term.
The COVID-19 pandemic has resulted in business interruption exposures.
Innovative insurance solutions can make risk transfer more efficient and reduce earnings and cash flow volatility.

2 Swiss Re Institute The Japan commercial insurance market
Introduction: corporate risk management
Corporate risk management is the control and mitigation of an organisation’s exposure to losses and is an inherent part of a company’s economic activity. How companies manage risk impacts their market value, their financial strength and their ability to fund projects. Corporate risk could come from various areas and evolves alongside economic and the legal environment development. Nowadays, new risks emerge and accelerate due to climate change, technology advances, globalisation and geopolitical events, among others.
Given the diversity and ever-changing nature of risk exposures, companies must constantly assess whether to insure or retain risks. A deeper understanding of the extent and composition of risk can deliver significant strategic advantages. Some risks are part of a company’s core business and can be sensibly retained, while others are well-suited for transfer to the insurance market. Large companies facing multiple risks are more likely to have a holistic risk management approach.
Awareness of commercial riskSurveys indicate that large companies in Japan are paying more attention into risk management than in the past. According to an annual survey conducted by a consulting firm, more Japanese companies now provide risk information in their company reports than was the case a few years ago. During 2017 to 2019, around 80% of respondent companies indicated that they disclosed company risk information in their integrated reports, up from around 50% during 2014–2016.2
Source: Survey of integrated reports in Japan in 2018 and 2019, KPMG
2 Survey of integrated reports in Japan in 2019, KPMG, March 2020 and Survey of integrated reports in Japan in 2018, KPMG, March 2019.
Risk management is the process of controlling and mitigating a company’s exposure to losses.
Companies need to constantly assess whether to insure or retain risks.
% of total respondent companies
0%
20%
40%
60%
80%
100%
201920182017201620152014
Figure 1 Companies disclosed risk and opportunities
Companies in Japan are paying more attention to risk management.
Swiss Re Institute The Japan commercial insurance market 3
Market overview and outlook
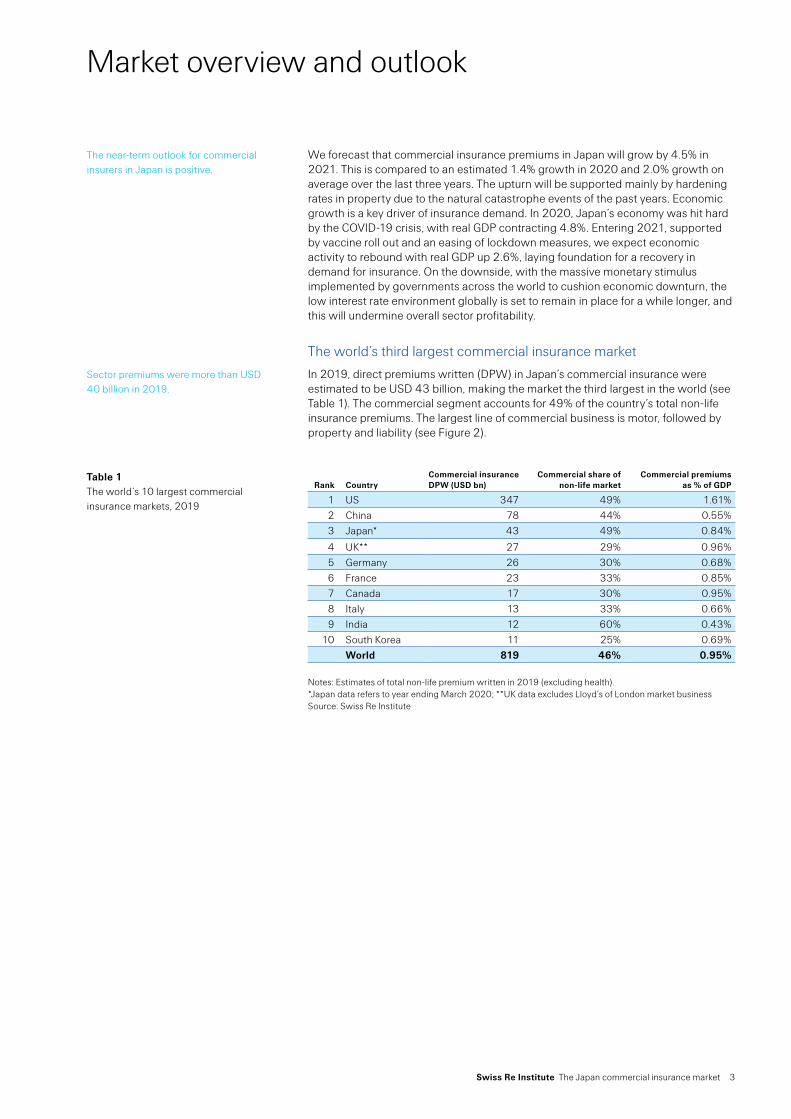
We forecast that commercial insurance premiums in Japan will grow by 4.5% in 2021. This is compared to an estimated 1.4% growth in 2020 and 2.0% growth on average over the last three years. The upturn will be supported mainly by hardening rates in property due to the natural catastrophe events of the past years. Economic growth is a key driver of insurance demand. In 2020, Japan’s economy was hit hard by the COVID-19 crisis, with real GDP contracting 4.8%. Entering 2021, supported by vaccine roll out and an easing of lockdown measures, we expect economic activity to rebound with real GDP up 2.6%, laying foundation for a recovery in demand for insurance. On the downside, with the massive monetary stimulus implemented by governments across the world to cushion economic downturn, the low interest rate environment globally is set to remain in place for a while longer, and this will undermine overall sector profitability.
The world’s third largest commercial insurance market
In 2019, direct premiums written (DPW) in Japan’s commercial insurance were estimated to be USD 43 billion, making the market the third largest in the world (see Table 1). The commercial segment accounts for 49% of the country’s total non-life insurance premiums. The largest line of commercial business is motor, followed by property and liability (see Figure 2).
Rank CountryCommercial insurance DPW (USD bn)
Commercial share of non-life market
Commercial premiums as % of GDP
1 US 347 49% 1.61%2 China 78 44% 0.55%3 Japan* 43 49% 0.84%
4 UK** 27 29% 0.96%5 Germany 26 30% 0.68%6 France 23 33% 0.85%7 Canada 17 30% 0.95%8 Italy 13 33% 0.66%9 India 12 60% 0.43%
10 South Korea 11 25% 0.69%World 819 46% 0.95%
Notes: Estimates of total non-life premium written in 2019 (excluding health). *Japan data refers to year ending March 2020; **UK data excludes Lloyd’s of London market business Source: Swiss Re Institute
Sector premiums were more than USD 40 billion in 2019.
Table 1 The world’s 10 largest commercial insurance markets, 2019
The near-term outlook for commercial insurers in Japan is positive.

4 Swiss Re Institute The Japan commercial insurance market
Commercial lines 49%Personal lines 51%
Motor, voluntary 33.1%CALI 5.7%Marine 4.6%Others 18.1%Liability 17.5%Property, commercial 21%
Note: *2019 refers to year ending March 2020; CALI = Compulsory automobile liability insurance Source: The Statistics of Japanese Non-Life Insurance Business, General Insurance Association of Japan, Swiss Re Institute
Even though it is the world’s third largest commercial insurance, Japanese companies are underinsured relative to firms in the US, the UK, Canada and France, as shown by respective segment penetration rates (see Table 2).3 In 2019, commercial insurance penetration in Japan was 0.84% of gross domestic product (GDP), compared to 1.61% in the US, 0.96% in the UK, and 0.95% in Canada. Table 2 shows segment penetration rates by line of business in Japan.
Premiums as % of GDP Motor, commercial (voluntary and compulsory) 0.32%Property, commercial 0.17%
Liability (excluding motor liability) 0.14%Marine 0.04%Others 0.17%Total commercial insurance 0.84%
Note: * refers to year ending March 2020 Source: The Statistics of Japanese Non-Life Insurance Business, General Insurance Association of Japan, Swiss Re Institute
The COVID-19 effectCommercial insurance premiums in Japan grew by 1.4% in 2020 despite the COVID-19-induced economic downturn (see Figure 3). Property was the main driver of sector growth given the continuous rate hardening following natural catastrophes losses in the previous years (see Figure 4). Liability, motor and marine premium, however. Contracted, impacted by the lockdown and restrictions on mobility imposed in Japan to curtail virus spread.
3 The penetration rate is defined as commercial insurance premium as a percentage of GDP. The penetration rate is typically used to gauge the level of insurance market development in a country. By design, the penetration rate is not able to tell the share of business that is insured (or uninsured), nor the contribution of insurance to risk management or reducing earnings volatility.
Figure 2 Shares of commercial insurance premiums, by line of business, 2019*
Many businesses in Japan are less well insured than in other advanced markets.
Table 2 Penetration of major commercial business lines in Japan, 2019*
On the whole, commercial insurance premiums demonstrated modest growth in spite of the COVID-19 crisis.
Market overview and outlook

Swiss Re Institute The Japan commercial insurance market 5
–2%
0%
2%
4%
6%
8%
10%
12%
2020E2019E201820172016201520142013
Gross premiums earned (RHS)
0
2000
4000
6000
2020E2019E201820172016201520142013
Growth (LHS)Note: Figures in the chart refer to year ending March. For example, 2019 refers to year ending March 2020; E = estimates; Source: The Statistics of Japanese Non-Life Insurance Business, General Insurance Association of Japan, Swiss Re Institute
–3%
0%
3%
6%
9%
12%
15%
18%
21%
Q4 2020Q3 2020Q2 2020Q1 2020
Composite Property Casualty Financial and Professional
Source: Marsh Global Insurance Market Index
According to the latest data from the General Insurance Association of Japan, in 2020, natural catastrophes claims were less extreme than in the previous three year in which major non-life insurers reported relatively high losses. One “positive” from the pandemic experience was lower claims in motor and personal accident, on account of the lockdown and restrictions on mobility. Overall, we estimate that the full-year 2020 commercial lines loss ratio will improve to 82% from 110% in 2019 (see Figure 5).
0%
20%
40%
60%
80%
100%
120%
84.8%
2020E2019E2018201720162015201420132012Note: Gross loss ratio = gross claims paid/gross premium written. Figures in the chart refer to year ending March. For example, 2019 refers to year ending March 2020; E = estimates Source: The Statistics of Japanese Non-Life Insurance Business, General Insurance Association of Japan, Swiss Re Institute
Figure 3Commercial insurance premiums growth rate (year-on-year %, LHS) and premiums earned (JPY billion)
Figure 4Japan commercial insurance premiums rate growth (year-on-year %)
Figure 5Commercial insurance loss ratio
6 Swiss Re Institute The Japan commercial insurance market
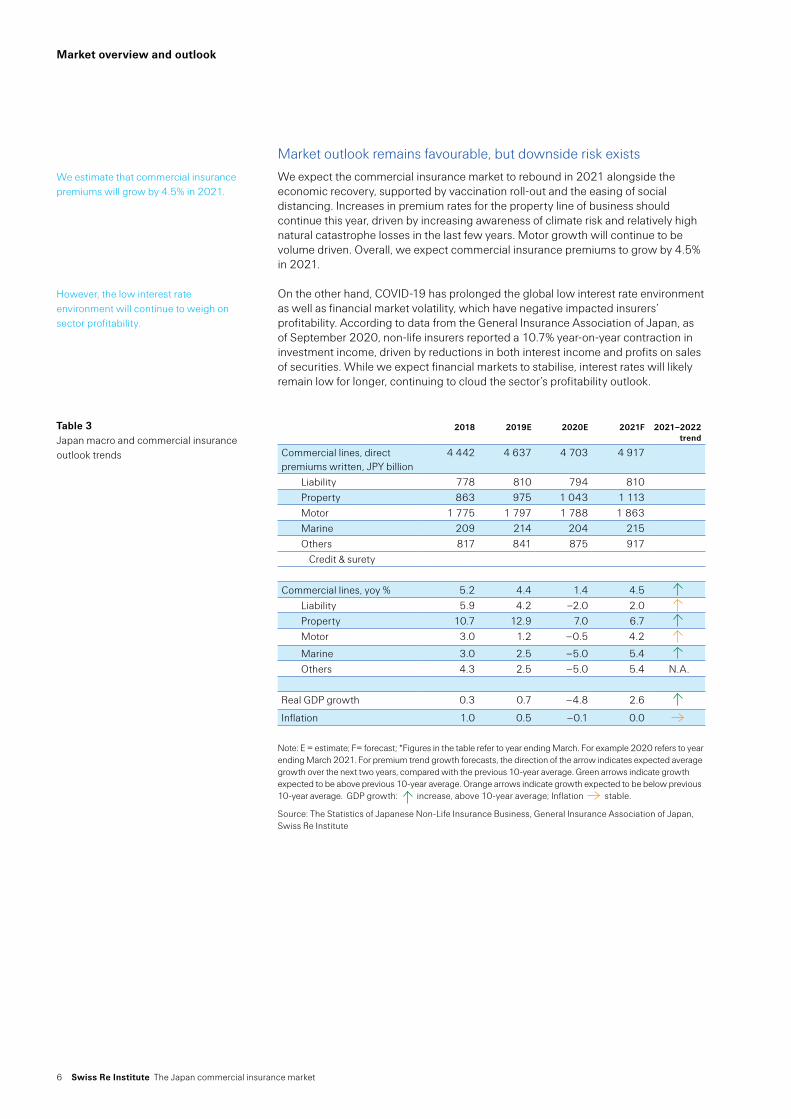
Market outlook remains favourable, but downside risk exists
We expect the commercial insurance market to rebound in 2021 alongside the economic recovery, supported by vaccination roll-out and the easing of social distancing. Increases in premium rates for the property line of business should continue this year, driven by increasing awareness of climate risk and relatively high natural catastrophe losses in the last few years. Motor growth will continue to be volume driven. Overall, we expect commercial insurance premiums to grow by 4.5% in 2021.
On the other hand, COVID-19 has prolonged the global low interest rate environment as well as financial market volatility, which have negative impacted insurers’ profitability. According to data from the General Insurance Association of Japan, as of September 2020, non-life insurers reported a 10.7% year-on-year contraction in investment income, driven by reductions in both interest income and profits on sales of securities. While we expect financial markets to stabilise, interest rates will likely remain low for longer, continuing to cloud the sector’s profitability outlook.
2018 2019E 2020E 2021F 2021‒2022 trend
Commercial lines, direct premiums written, JPY billion
4 442 4 637 4 703 4 917
Liability 778 810 794 810 Property 863 975 1 043 1 113 Motor 1 775 1 797 1 788 1 863 Marine 209 214 204 215 Others 817 841 875 917
Credit & surety
Commercial lines, yoy % 5.2 4.4 1.4 4.5 Liability 5.9 4.2 –2.0 2.0 Property 10.7 12.9 7.0 6.7 Motor 3.0 1.2 –0.5 4.2
Marine 3.0 2.5 –5.0 5.4 Others 4.3 2.5 –5.0 5.4 N.A.
Real GDP growth 0.3 0.7 –4.8 2.6
Inflation 1.0 0.5 –0.1 0.0
Note: E = estimate; F= forecast; *Figures in the table refer to year ending March. For example 2020 refers to year ending March 2021. For premium trend growth forecasts, the direction of the arrow indicates expected average growth over the next two years, compared with the previous 10-year average. Green arrows indicate growth expected to be above previous 10-year average. Orange arrows indicate growth expected to be below previous 10-year average. GDP growth: increase, above 10-year average; Inflation stable.
Source: The Statistics of Japanese Non-Life Insurance Business, General Insurance Association of Japan, Swiss Re Institute
We estimate that commercial insurance premiums will grow by 4.5% in 2021.
However, the low interest rate environment will continue to weigh on sector profitability.
Table 3 Japan macro and commercial insurance outlook trends
Market overview and outlook

Swiss Re Institute The Japan commercial insurance market 7
Natural catastrophes are at the core of business interruption risk scenarios.

8 Swiss Re Institute The Japan commercial insurance market
Growth drivers of future demand
Over the longer term, we expect BI covers to be a source of growth for commercial insurance. Many firms in Japan, particularly SMEs, have little BI coverage. Climate risk and the increasing digitisation of business have increased the disruption exposures facing Japanese companies. According to responses to a survey by the World Economic Forum in 2020, natural catastrophes and cyber-attacks are the top two concerns for Japanese companies when doing business (see Figure 6).4
Source: World Economic Forum
Natural catastrophe risk
We estimate commercial property premiums to increase by 6.7% in 2020, supported by rates hardening after high natural catastrophes losses in the past two years, as well as the rising concern about risks associated with climate change. In 2018 and 2019, including the losses created by Typhoon Jebi and Hagibis, the aggregate natural catastrophe insured losses in Japan were USD 21billion and US 15 billion respectively, well above the 20-year average (USD 6 billion, Figure 7).
Insured losses (2020 values) 2001–2020 average economic losses
2001–2020 average insured losses
20P19181716151413121110090807060504030201
0
10 000
20 000
30 000
40 000
50 000
Note: * All losses are inflation adjusted to 2020 values. p: preliminary estimates Source: Swiss Re Institute
4 Interactive Map – Regional Risk of Doing Business, World Economic Forum, 2020.
We expect BI exposures to be a key growth opportunity for commercial insurers in Japan.
Figure 6Top risk concerns doing business in Japan, 2020
0 20 40 60 80
Data fraud or theftMisuse of technologies
Failure of financial mechanism or institutionInter-state conflict
Failure of climate-change adaptionFiscal crisis
Spread of infectious diseasesExtreme weather events
Cyber attacksNatural catastrophes
% of respondents
Figure 7Natural catastrophe insured losses in Japan (USD million)
Commercial property is heavily exposed to natural catastrophe risk in Japan.

Swiss Re Institute The Japan commercial insurance market 9
Natural catastrophes remain at the core of property risks.5 Japan is exposed to the full range of natural perils including earthquakes, typhoons, windstorms and floods. Asset losses or disruption to production resulting from a disaster events can reduce a firm’s creditworthiness and even lead to bankruptcy. Although most Japanese businesses and households are insured for property damage, the level of cover is often insufficient. For instance, natural catastrophe events in Japan caused total economic losses of USD 7 billion in 2020. However, only 37% were insured, leaving a substantial protection gap.
In addition to human loss and damage to buildings, equipment and infrastructure, natural catastrophes can also disrupt business operations, leading to loss of output. BI risk as a result of natural disasters has become a major concern for businesses all around the world. Experience shows that across the world, the BI proportion of property claims typically account for well over 50% of the incurred loss.
In recent years, the risks associated with climate change have attracted more attention from Japanese companies. Management is now keen to provide climate related information in companies report. In a 2019 survey, 43% of the respondent firms disclosed climate risk information in integrated report according to the “Task Force on Climate-related Financial Disclosure” standard.6 Even so, penetration of earthquake or BI insurance in Japan is still relatively low – particularly for SMEs.7 According to a study by the Japan Cabinet Office in 2017, at the time of the 2011 earthquake, over 90% of SMEs had no earthquake insurance coverage.8 In 2017, six years later, there were 22% more firms that had bought earthquake cover, but the protection gap still remains large. Moreover, in 2019 a white paper showed that only 12% of SMEs had business continuity plans.9
The Great East Japan Earthquake (GEJE): lessons learned, 10 years onOn 11 March 2011, a magnitude 9.0 earthquake hit the coast of eastern Japan. It was the most powerful quake ever in the country and the fourth strongest in the world. A resulting tsunami flooded the coastal region causing immense damage to human lives and the economy. More than 18 000 people were killed or went missing, making it the deadliest seismic event in Japan since the Great Tokyo earthquake of 1923. While the earthquake itself was undoubtedly severe, most of the deaths and approximately one third of the economic damage were caused not by the earthquake directly, but by the following tsunami, which crushed critical infrastructure and caused massive disruption to supply chains. Ten years on, the experience has led to many further developments with respect to disaster response and pre-emptive risk mitigation. Nevertheless, due to a combination of factors, existing seismic exposures in Japan could still lead to very large loss tolls.
Japan is one of the most earthquake-prone countries in the world. As a result, building codes there have long been rigorous and strictly enforced. A strong culture of risk prevention and preparedness explains the limited scale of losses resulting from GEJE ground shake relative to the magnitude of the seismic event itself. At the time of disaster, Japan was already equipped with well-functioning and effective early warning systems and dykes. However, the sheer magnitude of the multiple hazards that struck, such as the tsunami waves that were higher than the dykes, made the event the costliest ever natural catastrophe in world history: economic losses totalled USD 210 billion.
5 For more on recent developments in natural catastrophe and climate risks, see sigma 2/2020: Natural catastrophes in times of economic accumulation and climate change; and sigma 1/2021: Natural catastrophes in 2020: secondary perils in the spotlight, but don’t forget primary-peril risks, Swiss Re Institute
6 Survey of integrated reports in Japan in 2019, KPMG, March 20207 Japan non-life insurance market report, AXCO, accessed on 17 March 20218 Towards improvement of disaster risk management capacity of Japan’s economy, Japan Cabinet Office,
2 April 2017, (in Japanese only).9 White paper on Small and Medium Enterprises in Japan, METI, 2019 (in Japanese only).
The country is vulnerable to a multitude of natural world perils.
Natural catastrophes also cause business disruption…
…but many Japanese companies do not have related insurance cover.
The magnitude and ground motion intensity of the GEJE exceeded all previous assumptions.
Economic losses from the quake and ensuing tsunami were the highest ever.

10 Swiss Re Institute The Japan commercial insurance market
Today reconstruction is mostly complete. The event prompted a massive government disaster-relief response.10 One lesson learned is that today, Japan includes very low frequency but high-impact worst case scenarios for earthquake and tsunami in national planning, mitigating disaster risk to the greatest possible extent. For instance, the height of seawalls has been increased to make mitigation readiness even higher today than 10 years ago.
Insurance claims covered USD 35 billion of the losses resulting from the GEJE and tsunami. Although that is the world’s largest aggregate insurance industry payout for a seismic event ever, the compensation covered just 16% of all losses. The majority of the claims were paid quickly (within three months) but even so, there were big learnings for the industry too. Not least, at the time the assumed maximum magnitude of an earthquake in the Tohoku region was 8.5,11 with tsunami potential modelled on that basis. At 9.0 magnitude, on this occasion reality was worse than ever considered possible. Equally sobering is that the GEJE experience is not necessarily the worst-case scenario that Japan could face. If an earthquake of similar magnitude were to strike more areas of more dense population and value concentration (eg, Tokyo), the human toll and economic fallout could be much more extreme. Despite advancements in seismic science, often the scale of associated loss potential from earthquake events is not fully recognized, even in countries with a long recorded seismic history like Japan. For example, in 2011, while enforced building codes saved lives, there was severe damage to non-structural construction components like ducting, pipework, suspended ceilings and electrical equipment, inflating claims beyond expectations.
Following the GEJE, insurance industry modelling of secondary perils like tsunami and, in the case of New Zealand, liquefaction, and also of the loss potential of buildings’ non-structural elements has progressed. As modelling of all loss drivers improves and mitigation of worst-case scenarios is strengthened, the industry will be better able to offload earthquake risk from businesses and households.
We estimate that the natural catastrophe protection gap in Japan in 2019 was more than USD 30 billion in premium equivalent terms, the second highest in the world. Most of the gap – USD 25 billion – came from underinsurance of seismic risk. Insurance penetration for seismic risks in Japan remains low. In 2011, only 36% of large corporations and less than 10% of SMEs had earthquake cover. Today, the share has risen but the majority of firms still lack protection. With respect to households, an estimated 50–60% have earthquake insurance. But, with coverage limits in residential policies ranging from 20–50% of fire sum insured, the share of overall losses compensated for is around 15%. That’s up from 3% at the time of the 1995 Kobe quake, but is well below levels in other also earthquake-prone countries like Chile (30%) and New Zealand (75%). These discrepancies suggest there is still more to do to extend the reach of earthquake covers across Japan.
10 F. Ranghieri, M. Ishiwatari, Learning from Megadisasters: Lessons from the GEJE, World Bank 2014. 11 Response to the 2011 Great East Japan Earthquake and Tsunami disaster, The Royal Society, 28
October 2015.
The experience has led to the strengthening of already-high standards of disaster mitigation in Japan.
At the time, only around 16% of the economic losses were insured.
The experience prompted insurers to embed secondary perils like tsunami in catastrophe risk modelling.
Even so, we estimate the earthquake protection gap in Japan at USD 25 billion, the second largest in the world.
Growth drivers of future demand
Swiss Re Institute The Japan commercial insurance market 11
Cyber risk
In the artificial intelligence and data era of today, cyber risk is another major threat to business. The 2020 World Economic Forum survey indicate that cyberattack is the second highest concern among business leaders in Japan (see Figure 6). And, according to a survey by an international security firm, over half of 200 responding Japanese companies reported to have encountered ransomware cyber-attacks.12
Cyber-attacks can induce substantial financial loss. For example, a ransom demand to video games giant Capcom was for JPY 1.1billion in exchange for the retrieval of materials stolen through cyberattacks.13 In some case, companies may suffer business interruption. At Honda Motor, production was interrupted because of a ransomware attack.14 According to most recent survey conducted by the Japan Network Security Association, there were 443 cases of cyber-attacks in related to information leakage in 2018, resulting in estimated losses of JPY 268 trillion.15
Overseas interests of Japanese companies
Furthermore, globalisation which leads to more complex supply chains, can result in BI exposures. Amid COVID-19, there was a slowdown in global supply chains due to domestic lockdowns and border closures, impacting business operations all over the world. The Suez Canal blockage in March this year also disrupted trade in many for perishable goods and missed delivery deadlines.
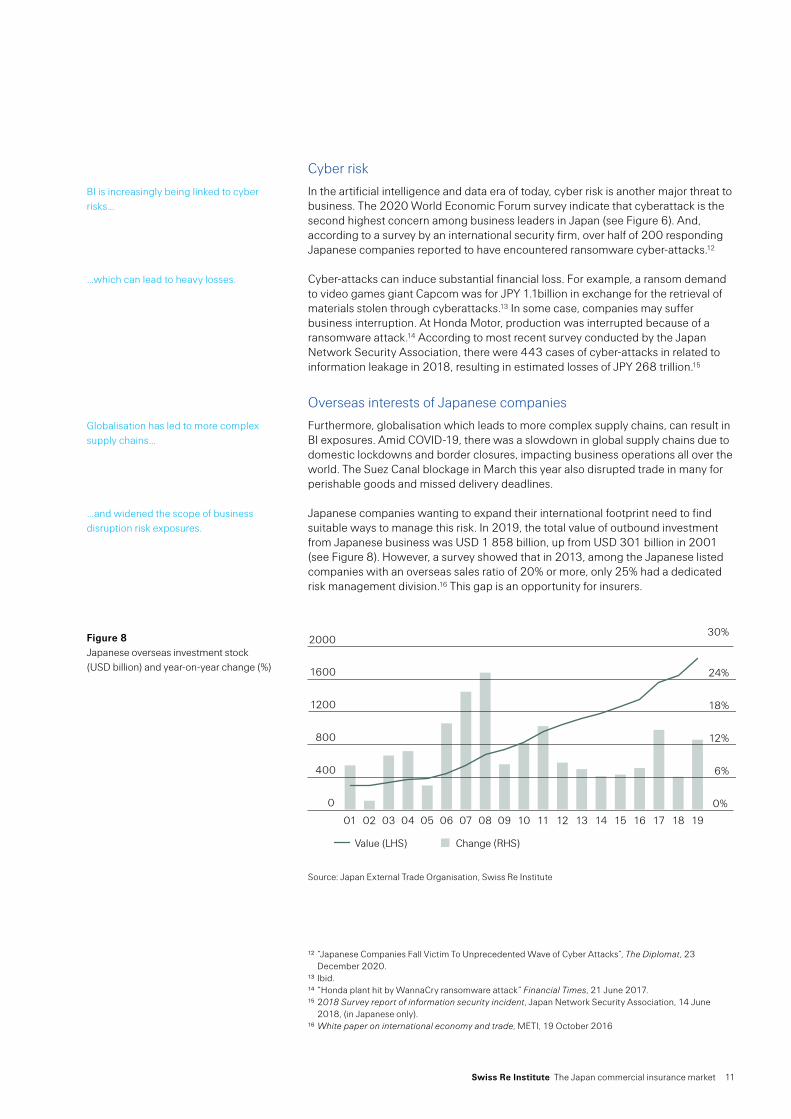
Japanese companies wanting to expand their international footprint need to find suitable ways to manage this risk. In 2019, the total value of outbound investment from Japanese business was USD 1 858 billion, up from USD 301 billion in 2001 (see Figure 8). However, a survey showed that in 2013, among the Japanese listed companies with an overseas sales ratio of 20% or more, only 25% had a dedicated risk management division.16 This gap is an opportunity for insurers.
Change (RHS)Value (LHS)
0%
6%
12%
18%
24%
30%
2019201820172016201520142013201220112010200920082007200620052004200320022001
0
400
800
1200
1600
2000
19181716151413121110090807060504030201
Source: Japan External Trade Organisation, Swiss Re Institute
12 “Japanese Companies Fall Victim To Unprecedented Wave of Cyber Attacks”, The Diplomat, 23 December 2020.
13 Ibid.14 “Honda plant hit by WannaCry ransomware attack” Financial Times, 21 June 2017.15 2018 Survey report of information security incident, Japan Network Security Association, 14 June
2018, (in Japanese only).16 White paper on international economy and trade, METI, 19 October 2016
BI is increasingly being linked to cyber risks…
…which can lead to heavy losses.
Globalisation has led to more complex supply chains…
…and widened the scope of business disruption risk exposures.
Figure 8Japanese overseas investment stock (USD billion) and year-on-year change (%)
12 Swiss Re Institute The Japan commercial insurance market
Pandemic disruption to Tokyo Olympics
The COVID-19 outbreak led to the delay of the 2020 Tokyo Olympics, an example of business interruption risk. The games were originally scheduled to take place in July- August 2020 but were postponed due to the pandemic to July-August 2021. At present no overseas spectators will be allowed to attend. The “no spectator” nature of this year’s games will mean far lower-than-expected revenues for many businesses, particularly in the hospitality sector. According to estimates, holding the game without spectators could generate an economic loss of JPY 2.4 trillion in Japan, which will include the loss in consumption expenditures and reduced business gains from corporate marketing activities.17
17 “Japanese economy would take ¥2.4 trillion hit with no spectators for Olympics” The Japan Times, 23 January 2021.
Pandemic disruption to the Tokyo Olympic has resulted in losses for many businesses in Japan-
Growth drivers of future demand

Swiss Re Institute The Japan commercial insurance market 13
Innovative insurance solutions can improve the efficiency of risk transfer, reduce earnings volatility and expand the scope of insurability

14 Swiss Re Institute The Japan commercial insurance market
Innovative insurance solutions18
Rapid technological progress, digital transformation particularly, is changing the nature of business. There has been a rise of new types of company and business model. For example, Airbnb which owns no rental units, Foodpanda which has no restaurants, and virtual banks with no branch network, are competing with incumbents and increasing their market share. During the COVID-19 pandemic, there was also an increase in online shopping, a trend that is likely to stay. These developments suggest business is transforming from being rich in physical assets to deriving value from intangibles and services. These changes have seen a concurrent emergence of new and innovative insurance solutions, moving from asset and balance sheet covers, to protection for earnings and cash flow risks.
Pure asset risks
Propertydamage
Asset-related risks
Businessinterruption
Contingent businessinterruption
Earnings and cashflow risks
Productrecall
Reputation
Political risk
Cyber
Weather andcommodity
Non-damage businessinterruption
Source: Swiss Re Institute
While traditional property damage, such as damage to buildings and machinery, is still the major portion of overall commercial property insurance, the scope of the protection now extends also to BI and CBI covers. Non-physical damage business interruption (NDBI) will be the next stage in this evolution. NDBI coverage is detached from traditional asset-oriented property risk. It offers protection to business earnings (due to interruption of business operation) even when there is no physical damage at am insured’s or a third-party property. Potential NDBI events can include (but are not limited to) electricity blackouts, organised blockades, withdrawal of regulatory approval or product license, supplier bankruptcy, cyber-attacks and IT system failures.
Events that cause NDBI can result in significant economic loss that has traditionally been difficult to insure. As exposures can vary in each case, there is no standard NDBI solution. Moreover, the disconnect of NDBI risk from traditional property risk factors gives rise to asymmetric information and data availability issues, rendering traditional insurance covers inappropriate. Parametric products can then be used to expand the limits of insurability and facilitate NDBI risk covers, given the solution providers model the insured’s loss scenarios and the triggering events adequately, The following are some examples of innovative trigger-based commercial insurance solutions in Japan that have helped address NDBI risks.
18 For more about product development and innovation, see sigma 5/2017: Commercial insurance: innovating to expand the scope of insurability, Swiss Re Institute.
Innovative risk covers are being developed to meet the needs of new types of business model.
Figure 9Expanding the scope of first party insured risk
Non-physical damage business interruption is the next step in the evolution of BI risk protection covers.
NDBI solutions can improve the efficiency of risk transfer and enhance extend the boundaries of insurability.
Innovation in insurance solutions
Swiss Re Institute The Japan commercial insurance market 15
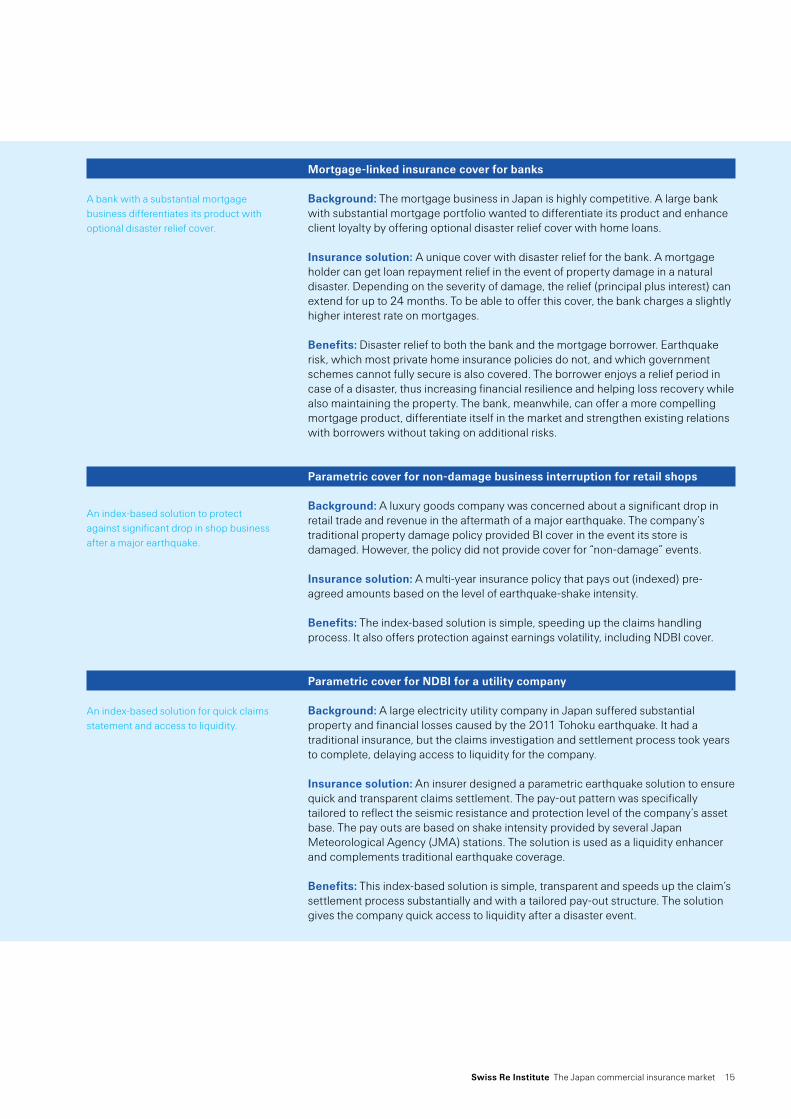
Mortgage-linked insurance cover for banks
Background: The mortgage business in Japan is highly competitive. A large bank with substantial mortgage portfolio wanted to differentiate its product and enhance client loyalty by offering optional disaster relief cover with home loans.
Insurance solution: A unique cover with disaster relief for the bank. A mortgage holder can get loan repayment relief in the event of property damage in a natural disaster. Depending on the severity of damage, the relief (principal plus interest) can extend for up to 24 months. To be able to offer this cover, the bank charges a slightly higher interest rate on mortgages.
Benefits: Disaster relief to both the bank and the mortgage borrower. Earthquake risk, which most private home insurance policies do not, and which government schemes cannot fully secure is also covered. The borrower enjoys a relief period in case of a disaster, thus increasing financial resilience and helping loss recovery while also maintaining the property. The bank, meanwhile, can offer a more compelling mortgage product, differentiate itself in the market and strengthen existing relations with borrowers without taking on additional risks.
Parametric cover for non-damage business interruption for retail shops
Background: A luxury goods company was concerned about a significant drop in retail trade and revenue in the aftermath of a major earthquake. The company’s traditional property damage policy provided BI cover in the event its store is damaged. However, the policy did not provide cover for “non-damage” events.
Insurance solution: A multi-year insurance policy that pays out (indexed) pre-agreed amounts based on the level of earthquake-shake intensity.
Benefits: The index-based solution is simple, speeding up the claims handling process. It also offers protection against earnings volatility, including NDBI cover.
Parametric cover for NDBI for a utility company
Background: A large electricity utility company in Japan suffered substantial property and financial losses caused by the 2011 Tohoku earthquake. It had a traditional insurance, but the claims investigation and settlement process took years to complete, delaying access to liquidity for the company.
Insurance solution: An insurer designed a parametric earthquake solution to ensure quick and transparent claims settlement. The pay-out pattern was specifically tailored to reflect the seismic resistance and protection level of the company’s asset base. The pay outs are based on shake intensity provided by several Japan Meteorological Agency (JMA) stations. The solution is used as a liquidity enhancer and complements traditional earthquake coverage.
Benefits: This index-based solution is simple, transparent and speeds up the claim’s settlement process substantially and with a tailored pay-out structure. The solution gives the company quick access to liquidity after a disaster event.
A bank with a substantial mortgage business differentiates its product with optional disaster relief cover.
An index-based solution to protect against significant drop in shop business after a major earthquake.
An index-based solution for quick claims statement and access to liquidity.
16 Swiss Re Institute The Japan commercial insurance market
Conclusion
We forecast that commercial insurance premiums will grow by 4.5% in 2021. Premium rates for property lines which suffered natural catastrophe-related losses in previous years will likely harden further. However, the low interest rate environment globally, which has been further exacerbated by the COVID-19 crisis, is set to remain in place for a while yet. This will have a negative impact on insurers’ profitability.
Japanese firms are generally underinsured relative to their peers in the US and the UK. Many have yet to develop best practices in risk assessment and preparation for the appropriate risk mitigation response. While most firms have conventional insurance for their property assets, many –SMEs especially – are underinsured for business disruption scenarios.
Natural catastrophes remain the core source of BI risk in Japan given the country’s high exposure to the full range of natural perils. Digital technology, globalisation and the pandemic have broadened the scope of risk pools. We think BI exposures will be an important area of commercial insurance segment growth over the longer term, as more Japanese companies become aware of their vulnerabilities.
Another area of growth for commercial insurance will be parametric solutions, in particular non-physical damage business interruption covers. We see these as the next step in the evolution of covers for exposures that have been difficult to insure, such as earnings and cash flow. In addition to pay-outs, a main benefit of NDBI solutions is that they improve the efficiency of risk transfer.
We forecast that commercial insurance premiums in Japan will grow by 4.5% in 2021.
Japanese businesses have traditional property insurance. But many – SMEs especially – are underinsured for business disruption scenarios.
BI cover is be a growth opportunity for commercial insurers in Japan.
NDBI covers will be the next stage in the extension of the boundaries of insurability.

Swiss Re Institute The Japan commercial insurance market 17
Commercial motor insurance
Motor is the largest line of business in Japan, making up 38.8% of total commercial insurance sector premiums in 2019. Automobile insurance protects companies against liability claims and property damage involving the vehicles they own. Liability insurance is mandatory for all accredited vehicles. Most motor liability claims are of high-frequency and low-severity nature.
Amid COVID, motor premiums contracted by 0.5% to JPY 1788 billion in 2020 (see Figure 10). For compulsory motor premiums, the General Insurance Rating Organization of Japan (GIROJ) cut standard full premium rates by 6.7% on average in April 2021,19 due to a reduced number of traffic accident as supported by advanced driver-assistance technologies and less drivers on the road due to COVID-19 related social distancing.20 We estimate that the commercial motor insurance penetration rate was around 0.32% of GDP (see Figure 11).
0
400
800
1200
1600
2000
2020E2019E201820172016201520142013201220112010
CALIVoluntary
Source: The Statistics of Japanese Non-Life Insurance Business, General Insurance Association of Japan, Swiss Re Institute.
Source: The Statistics of Japanese Non-Life Insurance Business, General Insurance Association of Japan, Swiss Re Institute
19 The General Insurance Rating Organisation of Japan (GIROJ) calculates two types of premium rates: (1) standard full rates for CALI and (2) reference loss rates for voluntary motor insurance. The standard full rates for CALI are determined on a “no-loss, no-profit” basis. All non-life insurance companies are required to adopt the standard full rates. For voluntary motor insurance, insurers can adopt the GIROJ reference rates and add expense costs to decide the premium rate or calculate their own rates. Insurers are required to file their own premium rates for FSA approval.
20 Announcement on revision of standard full rates for compulsory automobile liability insurance, GIROJ, 12 March 2021.
Motor is the largest line of commercial insurance business in Japan.
Standard premium rates have been cut by 6.7% this year.
Figure 10Commercial motor insurance direct premiums written (JPY billion)
Figure 11Penetration rate in commercial motor insurance (% of GDP)
Appendix: performance by line of business

18 Swiss Re Institute The Japan commercial insurance market
Commercial property insurance
Property is the second-largest line of business in Japan. In 2019, commercial property made up 21% of total commercial insurance premiums. In Japan, most corporate earthquake and BI cover is included as a rider to fire insurance policies. Despite the large exposure to the natural catastrophe risk, many large corporations insure their property assets on an indemnity basis, and do not buy loss-of-business or earthquake cover. Many smaller enterprises are largely uninsured.
In 2020, direct premiums of commercial property insurance were an estimated JPY 1.04 trillion, up 7% (see Figure 12). According to the Marsh Global insurance market report,21 Japan’s property rates experienced a double-digit increase in 2020, mainly due to natural catastrophe exposures. We expect rate hardening to continue given rising concern around climate change related risks. The penetration rate of property insurance is estimated to be at around 0.2% of GDP.
500
600
700
800
900
1000
1100
2020E2019E201820172016201520142013201220112010
Source: The Statistics of Japanese Non-Life Insurance Business, General Insurance Association of Japan, Swiss Re Institute
0.12%
0.14%
0.16%
0.18%
0.20%
0.22%
2020E2019E201820172016201520142013201220112010 Source: The Statistics of Japanese Non-Life Insurance Business, General Insurance Association of Japan, Swiss Re Institute
21 Insurance Prices in Asia Increase in Fourth Quarter 2020, Marsh, February 2021.
Property is the second-largest line of commercial insurance business in Japan.
We estimate that segment premiums grew by 7% last year.
Figure 12Commercial property insurance direct premiums written (JPY billion)
Figure 13Penetration rate in commercial property insurance (% of GDP)
Appendix: performance by line of business

Swiss Re Institute The Japan commercial insurance market 19
Liability insurance
Liability is the third largest commercial line of business, with premiums accounting for 17.5% of total commercial sector premiums in 2019. We estimate that liability direct premiums fell by 2.0% to JPY 794 billion in 2020 (see Figure 14), mainly due the decline in business activities amid the COVID-19 induced economic downturn. Compared with other advanced markets, Japanese companies underspend on liability insurance, a reflection of the country’s benign litigation culture. Moreover, Japan’s liability market is highly concentrated and only a few large firms purchase global coverage. We estimate liability penetration at around 0.15% of GDP in 2020 (see Figure 15).
0
200
400
600
800
1000
2020E2019E201820172016201520142013201220112010
Source: The Statistics of Japanese Non-Life Insurance Business, General Insurance Association of Japan, Swiss Re Institute
0.07%
0.09%
0.11%
0.13%
0.15%
0.17%
2020E2019E201820172016201520142013201220112010
Source: The Statistics of Japanese Non-Life Insurance Business, General Insurance Association of Japan, Swiss Re Institute
Japanese firms spend less on liability cover than advanced-market peers.
Figure 14Liability insurance direct premiums written (JPY billion)
Figure 15Liability insurance penetration rate(% of GDP)

20 Swiss Re Institute The Japan commercial insurance market
Marine insurance
The share of marine line of the total commercial insurance market is relatively small. In 2019, marine premiums were 4.6% of the total commercial insurance premiums. With weakness in external trade activities and cruise traveling amid the COVID-19 economic downturn, we estimate that marine premiums contracted by 5.0% to JPY 204 billion in 2020 (see Figure 16). While Europe remains the dominating underwriting region, Asia Pacific has been seen to pick up in the past few years.22 The penetration rate of marine insurance in Japan was an estimated 0.04% in 2020. (see Figure 17).
0
50
100
150
200
250
2020E2019E201820172016201520142013201220112010
Cargo Hull
Source: The Statistics of Japanese Non-Life Insurance Business, General Insurance Association of Japan, Swiss Re Institute
0.0300%
0.0336%
0.0372%
0.0408%
0.0444%
0.0480%
2020E2019E201820172016201520142013201220112010
Source: The Statistics of Japanese Non-Life Insurance Business, General Insurance Association of Japan, Swiss Re Institute.
22 IUMI Stats Report, IUMI, November 2020.
Marine insurance premiums likely declined in 2020.
Figure 16Marine insurance direct premiums written (JPY billion)
Figure 17Marine insurance penetration rate(% of GDP)
Appendix: performance by line of business
Published by
Swiss Re Management Ltd. Swiss Re Institute P.O. Box 8022 ZurichSwitzerland
Telephone +41 43 285 2551Email [email protected]
AuthorChris Ip
EditorPaul Ronke
Managing editorIrina FanHead of Insurance Market Analysis
© 2021 Swiss Re Ltd. All rights reserved.
The editorial deadline for this study was 30 April 2021.The internet version may contain slightly updated information.
Graphic design and productionCorporate Real Estate & Services /Media Production, Zurich
The entire content of this study is subject to copyright withall rights reserved. The information may be used for private or internalpurposes, provided that any copyright or other proprietary notices arenot removed. Electronic reuse of the data published in publication isprohibited. Reproduction in whole or in part or use for any public purpose is permitted only with the prior written approval of Swiss Re and if the source reference “The Japan commercial insurance market, 2021” is indicated. Courtesy copies are appreciated.
Although all the information used in this study was taken from reliable sources, Swiss Re does not accept any responsibility for the accuracy or comprehensiveness of the information given or forward looking statements made. The information provided and forward-looking statements made are for informational purposes only and in no way constitute or should be taken to reflect Swiss Re’s position, in particular in relation to any ongoing or future dispute. In no event shall Swiss Re be liable for any loss or damage arising in connection with the use of this information and readers are cautioned not to place undue reliance on forward-looking statements. Swiss Re undertakes no obligation to publicly revise or update any forward-looking statements, whether as a result of new information, future events or otherwise.

Swiss Re Management Ltd.Swiss Re InstituteMythenquai 50 /60 P.O. Box 8022 Zurich Switzerland
Telephone + 41 43 285 2551 [email protected] institute.swissre.com
© 2021 Swiss Re. All rights reserved.