Embed Size (px)
Citation preview
2006
Japan,s Insurance Market
2006
Japan,s Insurance Market
The new financial environment: flight to quality and enhanced risk management
The Toa Reinsurance Company, Limited
6
5
4
3
2
11
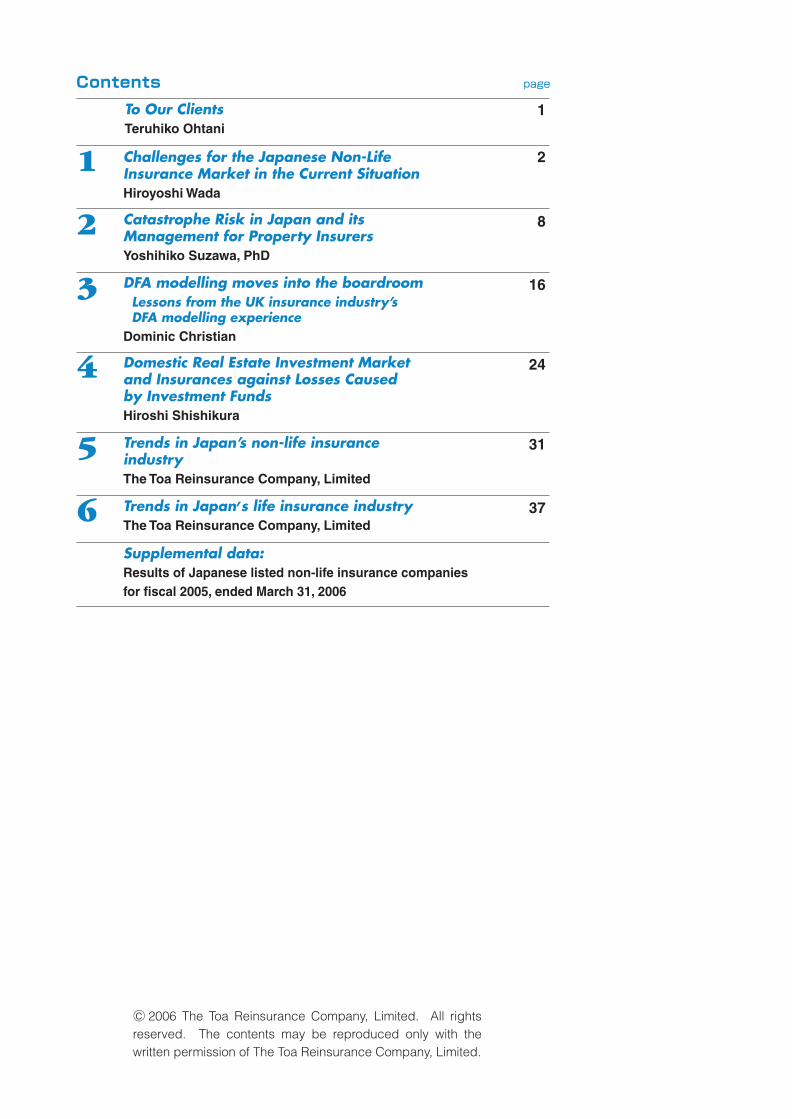
Trends in Japan,s life insurance industryThe Toa Reinsurance Company, Limited
Trends in Japan’s non-life insurance industryThe Toa Reinsurance Company, Limited
Domestic Real Estate Investment Market and Insurances against Losses Caused by Investment FundsHiroshi Shishikura
DFA modelling moves into the boardroom Lessons from the UK insurance industry’s DFA modelling experienceDominic Christian
Contents page
To Our ClientsTeruhiko Ohtani
Challenges for the Japanese Non-Life Insurance Market in the Current SituationHiroyoshi Wada
Catastrophe Risk in Japan and its Management for Property InsurersYoshihiko Suzawa, PhD
6
5
4
3
2
16
37
6 Supplemental data: Results of Japanese listed non-life insurance companiesfor fiscal 2005, ended March 31, 2006
31
24
8
2
1
○c 2006 The Toa Reinsurance Company, Limited. All rights reserved. The contents may be reproduced only with the written permission of The Toa Reinsurance Company, Limited.
6
5
4
3
2
1
6
To Our Clients It gives me great pleasure to have the opportunity to welcome you to our 2006 brochure which is now in its tenth year. It is encouraging to know that over the years our brochures have been well received even beyond our own industry's boundaries as a source of useful, up-to-date information about Japan's insurance market, as well as contributing to further develop an interest in and an understanding of our domestic market.
Turning back to fiscal 2005, the recovery of the Japanese economy contin-ued, supported by the domestic private-sector demand as the generally ro-bust performance of the corporate sector, indicated by the improved cor-porate earnings and higher capital investment, spread to the household sector.
In the non-life insurance industry, premium income trended upward in step with the recovery of the Japanese economy, despite persisting intense competition fanned by the winds of liberalization and consolidation sweep-ing through the industry. Compared with the previous year during which Japan was hit by a remarkable number of typhoons, relatively few natural disasters struck Japan in fiscal 2005.
In the meantime, if we look back on the reinsurance market, the financial strength of many reinsurance companies was adversely affected by a spate of natural disasters around the world, not least Hurricane Katrina in the U.S., which set a new record in terms of insurance claims. Premium rates showed a tendency to rise, mainly in classes and markets affected by major natural disasters.
The environment in which Toa Re operates is being transformed by the fre-quent occurrence of major natural disasters worldwide, structural changes in the non-life insurance industry, including the creation of a scheme for small-amount short-term insurance providers in Japan, and changes in the international regulatory environment for reinsurance.
Considering such situation, Toa Re formulated PROCEED 2008, the current medium-term management plan covering the three-year period through to fiscal 2008, which was launched in fiscal 2006. In PROCEED 2008, Toa Re sets its vision: “As a professional reinsurer, we are striving to become a cor-porate group that continues to provide high quality products and services and is trusted by customers in Japan and overseas.” To this end, we intend to implement various measures throughout the Toa Re Group designed to strengthen our customer base and the sales and marketing structure, rein-force the internal control system including risk management and compli-ance, and maintain and further enhance our robust financial position.
In conclusion, I hope that our brochure will provide a greater insight into the Japanese insurance market and I would like to express my gratitude to all those people who so kindly contributed so much time and effort in the mak-ing of this brochure.
Teruhiko Ohtani,President and Chief Executive,The Toa Reinsurance Company, Limited
1
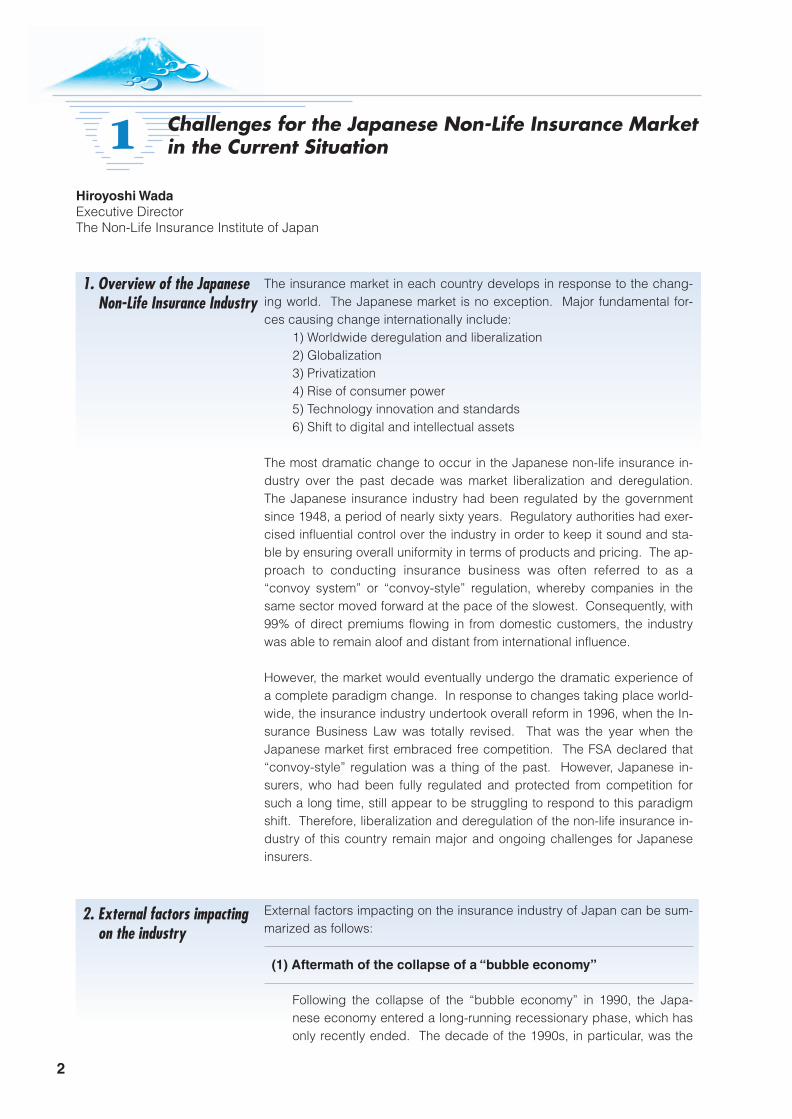
Hiroyoshi WadaExecutive DirectorThe Non-Life Insurance Institute of Japan
1 Challenges for the Japanese Non-Life Insurance Market in the Current Situation
1. Overview of the Japanese Non-Life Insurance Industry
2. External factors impacting on the industry
The insurance market in each country develops in response to the chang-ing world. The Japanese market is no exception. Major fundamental for-ces causing change internationally include:
1) Worldwide deregulation and liberalization2) Globalization 3) Privatization4) Rise of consumer power5) Technology innovation and standards6) Shift to digital and intellectual assets
The most dramatic change to occur in the Japanese non-life insurance in-dustry over the past decade was market liberalization and deregulation. The Japanese insurance industry had been regulated by the government since 1948, a period of nearly sixty years. Regulatory authorities had exer-cised influential control over the industry in order to keep it sound and sta-ble by ensuring overall uniformity in terms of products and pricing. The ap-proach to conducting insurance business was often referred to as a “convoy system” or “convoy-style” regulation, whereby companies in the same sector moved forward at the pace of the slowest. Consequently, with 99% of direct premiums flowing in from domestic customers, the industry was able to remain aloof and distant from international influence.
However, the market would eventually undergo the dramatic experience of a complete paradigm change. In response to changes taking place world-wide, the insurance industry undertook overall reform in 1996, when the In-surance Business Law was totally revised. That was the year when the Japanese market first embraced free competition. The FSA declared that “convoy-style” regulation was a thing of the past. However, Japanese in-surers, who had been fully regulated and protected from competition for such a long time, still appear to be struggling to respond to this paradigm shift. Therefore, liberalization and deregulation of the non-life insurance in-dustry of this country remain major and ongoing challenges for Japanese insurers.
External factors impacting on the insurance industry of Japan can be sum-marized as follows:
Following the collapse of the “bubble economy” in 1990, the Japa-nese economy entered a long-running recessionary phase, which has only recently ended. The decade of the 1990s, in particular, was the
2
(1) Aftermath of the collapse of a “bubble economy”
3. Challenges for the industry
hardest time for the Japanese economy, which experienced a finan-cial crisis. The banking sector was burdened with a massive number of bad debts and the life insurance sector was troubled by negative spread due to the continuing zero interest rate policy. The non-life in-surance sector was also adversely affected by the stagnant economic conditions. The aftermath of the bursting of the “bubble economy” was disastrous.
Of late, the Japanese macro economy has been showing increased stability, but there is no escaping the fact that the economy is entering a maturity phase and, despite the recent recovery, there is little ex-pectation of high economic growth rates comparable to those of the past. The mature economy has inevitably engendered maturity of the insurance industry marketplace.
Social conditions are changing fast, impelled by (1) an aging popula-tion, (2) a declining birth rate, (3) diversification in people’s senses of values and lifestyles, and (4) the rise of consumer power. While these changes may be regarded as threats on the one hand, they also offer opportunities for the insurance industry.
Global temperatures are rising. Precipitation has increased by about 1 percent across the world's continents in the last century. Sea levels worldwide have risen by some 15-20 cm (6-8 inches) in the last centu-ry. Although there are still some scientific uncertainties around the is-sue of global warming, recent experiences of unusual natural cata-strophes have put underwriters on the alert and suggest that close monitoring and prudent underwriting are required.
Among the various challenges that the industry is currently facing and grappling with, the following stand out:
The major insurance companies initiated strategic alliances and mergers in response to ongoing liberalization and maturing of the market. In the past five years, there have been seven instances of merger or integration. This consolidation has resulted in dominance of the market by the major company groups. As of 2005, the top 5 companies dominated market share with 82% while the top 3 control-led over 60% of the market. In other words, the trend to mergers and integration raised the level of market polarization.
(2) Maturing economy
(3) Changing social environments
(4) Environmental change – global warming
(1) Market polarization followed by consolidation
3
<Negative growth following liberalization>The industry has suffered from ongoing negative growth since 1997 as a result of liberalization and maturing of the market. Stagnant growth in the core businesses of non-life insurers is a major challenge. In particular, net premiums from auto insurance, which account for about 50% of total premium income, have been declining. With sec-ond-tier non-life insurers, the decline in net premium income is even more pronounced. So, in order to successfully maintain their business franchises, the medium-size companies will have to adopt strategies that focus on original distribution channels or niche markets, different from those of the larger companies.
<Growth in new entrants from non-financial sectors and direct players>While the growth rate has recently been negative for traditional insur-ers, there are market players who have achieved remarkable increa-ses in premium income, i.e., entrants from non-financial sectors and direct-selling players. In 2004, new entrants showed a 53.1% income increase over the previous year, while direct-selling players achieved an increase of 16.7%. The direct markets and new entrants from the non-financial industry do not present an immediate threat to conven-tional insurers, given their still small premium income and 3% market share, but their influence will steadily increase, reflecting “diversification in people’s senses of values and lifestyles.”
<Auto insurance>Auto insurance still has strategic importance because it is the biggest profit earner among all lines of business, even now that pricing has been set free. Therefore, both Top 5 players and small and medium-size companies are strengthening their competitive edges by devel-oping new auto insurance products with wider coverage and/or lower prices. But, at the same time, excessive dependence on auto insur-ance will require a strategic adjustment in the balance of portfolios, since its profitability is gradually diminishing and its growth is slowing down due to severe competition and a maturing auto market in Japan.
<Progress in economic globalization>Although the Japanese economy has recently been picking up and corporate profits have set new records, it would be unrealistic to look forward to the kind of high GDP growth ratio we enjoyed in the past. In the current global economy, where money, information, labor, etc. freely move across national borders, corporations will choose the opti-mal countries and regions in which to invest for construction of manu-facturing plants. This could mean a loss of insurance business op-portunities in the Japanese domestic market.
<Potential source of growth – “third sector” business>Both non-life and life insurers have placed strategic emphasis on so-called “third sector” insurance business such as medical, cancer, nursing-care, annuity, etc., which certainly promise strong growth po-
4
(2) Mature market – stagnant growth
tential in view of Japan’s aging population. Once the lucrative pre-serve of foreign-owned insurance companies, this market was opened up to domestic players in 2000 as a result of liberalization. Currently, both non-life and life insurance companies, domestic and foreign players alike, are competing fiercely in this field.
Insurers are moving from the traditional core businesses of marine, fire, auto and personal accident into “broad financial business,” in-volving life insurance, annuities, the Japanese version of 401K, fee-based businesses such as nursing-care, medical, risk management services, etc. Generally, life insurance is positioned as the second core business. Life insurance business conducted by non-life insur-ance companies is enjoying steady growth, but there is a widening gap in scale between the three major companies and the rest of the market.
One of the growth strategies espoused by large-scale insurers in re-cent years is a greater focus on overseas business, especially in Asia. While this is certainly a logical and effective strategy in today’s global-ized economic climate, those companies could encounter some sig-nificant problems along the way; even if they try to accelerate over-seas expansion of business, they will eventually have to overcome obstacles in the form of different local attitudes, senses of values and lifestyles. Accordingly, those companies will recognize the urgent need to revamp their overall business systems, which previously were sheltered under the regulated market conditions and worked in the domestic market. Systems must become universally applicable in terms of corporate and individual values, mindsets, and a firm com-mitment to putting client interests first. If globalization is regarded merely as a business opportunity, the companies’ ambitions will not be realized. It will take a little more time for overseas expansion to produce business sources that can contribute to growth and profit-ability.
One of the characteristics of Japanese insurers in respect of invest-ment is that historically they have invested heavily in stocks – as much as 34.7% of total assets.
The difficulty confronting Japanese insurers in reducing the weight of stock investment can be mainly attributed to a traditional business practice in Japan whereby corporate customers, regardless of indus-try, have engaged in cross-shareholding among group companies, and yet such cross-shareholding has contributed to business expan-sion and the maintenance of commercial lines businesses. In other words, large commercial lines customers have mainly placed their in-surance with insurers with whom they have strong financial relation-
(4) Expansion into overseas markets – large companies
5
(3) Shift to “broad financial business” from core insurance business
(5) Heavy investment in stocks
6
(3) Auto insurance for retail customers
(2) Stability vs. cyclical fluctuations
(4) Natural disaster risks
(1) Environment4. Outlook for the industry
ships, including loan arrangements. Selling and thereby reducing customers’ stockholdings is rather a daunting task because it carries the risk of losing commercial lines business, which traditionally has been maintained through that long-established practice.
However, stock investment can be volatile and, in the event of a stock value plunge, revaluation of holdings can have a massive negative im-pact on financial statements. It is only a matter of time until the inter-national accounting system is introduced into the Japanese market. Therefore, insurers have tried to reduce the weight of stock investment in order to avoid such negative impact. Over the past few years there has been a significant reduction in stockholding, but it appears that this has not yet reached the desired level.
The Japanese non-life insurance industry will have to continue to ad-dress such issues as the maturing economy, the intensifying competi-tion and the mature market.
There is little prospect of constant and reliable generation of earnings to the extent the industry enjoyed in the heyday of the regulated mar-ket. Cyclical fluctuations in business results will be unavoidable in the free, competitive market environment. However, compared with that of the broader Japanese financial sector, the financial quality of the non-life insurance sector is strong. Overall, given sound underwriting and reduced asset risks, the outlook for the Japanese non-life sector is one of relative stability.
Competition for auto insurance products targeted at retail customers has been intensifying. Among all lines of business, auto insurance is still a profit leader, but insurers will have to address the challenge of scaling-back their over-reliance on this single line of business and seek new sources of profits.
The recent accelerated frequency of natural disasters such as ty-phoons and earthquakes is a major concern. During fiscal year 2004, when a series of typhoons struck Japan, insurers were obliged to draw on a considerable proportion of their catastrophe reserves. In 2005, a new “Catastrophe Reserve” method was introduced and in-surers have begun strengthening their reserves in preparation for fu-ture catastrophes. Any ongoing frequency of natural disasters may give rise to a widening gap between large insurers and small and me-dium-size operations. Insurers will move to improve their close moni-

7
(5) Polarization
toring of risks related to large-scale natural disasters.
Given the mature domestic market, there are prospects of slow growth in net premium income and widening divergence in underwriting per-formance. Nonetheless, capitalization should remain strong, with re-duced risk assets and sound underwriting.
The market has become extremely polarized into two major groups: large multi-line insurers, and small and medium-size insurers. Big players will continue to advance their strategy of expanding and strengthening their business portfolios in life insurance, overseas business, “third sector” business, asset management, fee business such as risk consulting and nursing care services, etc. Meanwhile, small and medium-size players will be gearing up to meet the chal-lenge of maintaining their market positions by differentiating them-selves from their larger competitors.
Will there be another round of consolidation in the market? This large-ly depends on the performance of the small and medium-size players.
Yoshihiko Suzawa, PhDDeputy Manager Non-Life Insurance Rating Organization
2 Catastrophe Risk in Japan and its Management for Property Insurers
1. Securitization as an Additional Source of Capital
2. Catastrophe Losses in the Japanese Insurance Market
In line with the increase in uncertainty of loss attributable to natural and man-made disasters, financing catastrophe losses has become a crucial challenge for property insurers. Whilst the reinsurance market is the tradi-tional marketplace for risk transfer contracts, securitizing risk through cata-strophe (CAT) bonds transforms reinsurance contracts into securities. These are now being sold in the capital market, and such securitization is an increasingly popular route as both insurers and reinsurers seek alterna-tive sources of capital (Lalonde, 2005). At present CAT bonds are com-monly utilized as a part of reinsurance arrangement in order to supplement more traditional reinsurance capacity.
Traditional reinsurance contracts pay losses in accordance with the actual underlying losses of primary insurers, whereas payments of CAT bonds are tied to an underlying indicator, such as an index of industry losses or the occurrence of an event. Thus, insurers securitizing catastrophe risk can be exposed to significant basis risk*.As discussed later, the degree of basis risk varies among the different types of triggers employed. In addition, it depends on various characteris-tics, such as the comparative size and level of diversification of the insur-ance portfolio to be financed. Insurers, therefore, would need to analyze their own portfolios of insurance policies in order to make their optimal choice of financial instrument.
* Basis risk here refers to the risk that there may be a difference between the recovery from financing tools and the losses sustained from the ex-posure to be financed.
This paper tries to construct a theoretical framework for the optimal choice of securitizing structure, and especially trigger design, by focusing on the characteristics of insurance portfolios and related risk factors, including ba-sis risk, that influence the transaction costs born by insurers. Following this, the paper will apply the framework to sample data for fire and earth-quake insurance from the Japanese market and will analyze the optimal fi-nancial tools for each sample portfolio.
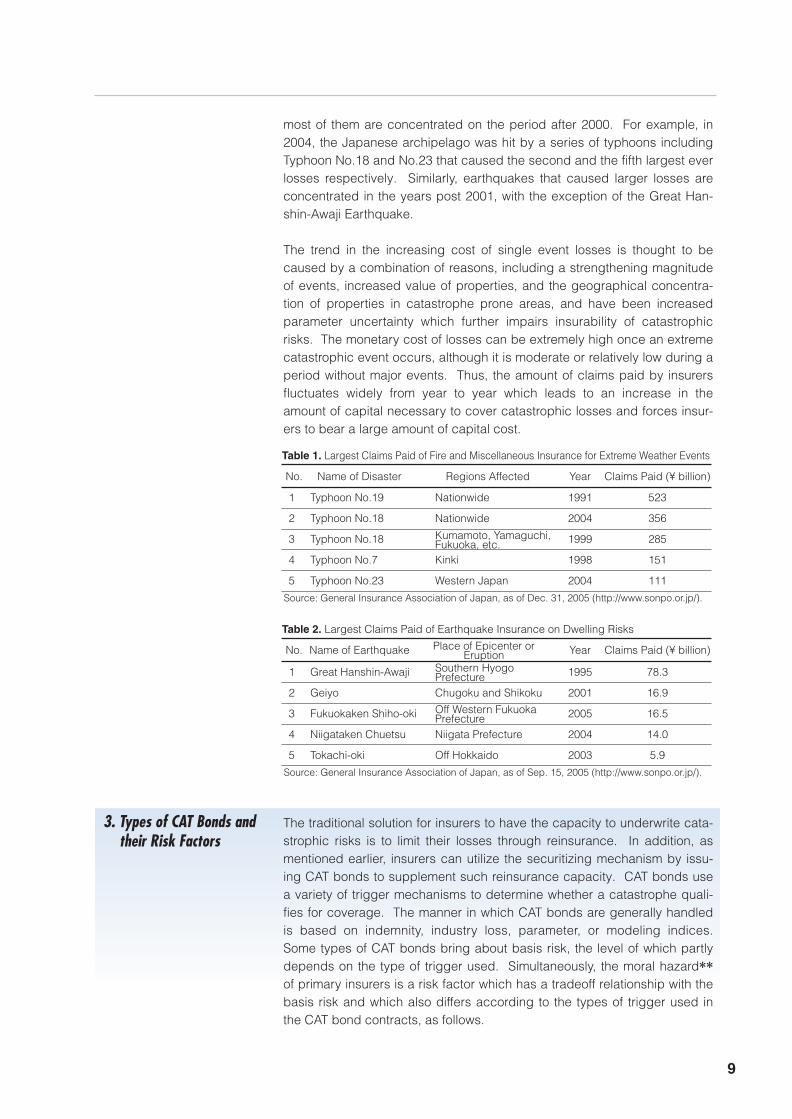
Most of the major catastrophe losses in Japan have been attributable to natural disasters including typhoons and earthquakes, and, at the same time, the monetary amount of losses caused by a single event has been in-creasing. This can be seen from Tables 1 and 2 listing the top five cata-strophic events that have resulted in the largest claims paid by insurers writing fire and earthquake coverage in the Japanese market. Note that all events with the highest monetary values have occurred from the 1990s and
8
3. Types of CAT Bonds and their Risk Factors
most of them are concentrated on the period after 2000. For example, in 2004, the Japanese archipelago was hit by a series of typhoons including Typhoon No.18 and No.23 that caused the second and the fifth largest ever losses respectively. Similarly, earthquakes that caused larger losses are concentrated in the years post 2001, with the exception of the Great Han-shin-Awaji Earthquake.
The trend in the increasing cost of single event losses is thought to be caused by a combination of reasons, including a strengthening magnitude of events, increased value of properties, and the geographical concentra-tion of properties in catastrophe prone areas, and have been increased parameter uncertainty which further impairs insurability of catastrophic risks. The monetary cost of losses can be extremely high once an extreme catastrophic event occurs, although it is moderate or relatively low during a period without major events. Thus, the amount of claims paid by insurers fluctuates widely from year to year which leads to an increase in the amount of capital necessary to cover catastrophic losses and forces insur-ers to bear a large amount of capital cost.
The traditional solution for insurers to have the capacity to underwrite cata-strophic risks is to limit their losses through reinsurance. In addition, as mentioned earlier, insurers can utilize the securitizing mechanism by issu-ing CAT bonds to supplement such reinsurance capacity. CAT bonds use a variety of trigger mechanisms to determine whether a catastrophe quali-fies for coverage. The manner in which CAT bonds are generally handled is based on indemnity, industry loss, parameter, or modeling indices. Some types of CAT bonds bring about basis risk, the level of which partly depends on the type of trigger used. Simultaneously, the moral hazard** of primary insurers is a risk factor which has a tradeoff relationship with the basis risk and which also differs according to the types of trigger used in the CAT bond contracts, as follows.
9
1 Typhoon No.19 Nationwide 1991 523
2 Typhoon No.18 Nationwide 2004 356
3 Typhoon No.18 1999 285
4 Typhoon No.7 Kinki 1998 151
5 Typhoon No.23 Western Japan 2004 111
No. Name of Disaster Regions Affected Year Claims Paid (¥ billion)
Table 1. Largest Claims Paid of Fire and Miscellaneous Insurance for Extreme Weather Events
Source: General Insurance Association of Japan, as of Dec. 31, 2005 (http://www.sonpo.or.jp/).
Kumamoto, Yamaguchi,Fukuoka, etc.
1 Great Hanshin-Awaji 1995 78.3
2 Geiyo Chugoku and Shikoku 2001 16.9
3 Fukuokaken Shiho-oki 2005 16.5
4 Niigataken Chuetsu Niigata Prefecture 2004 14.0
5 Tokachi-oki Off Hokkaido 2003 5.9
No. Name of Earthquake Year Claims Paid (¥ billion)
Table 2. Largest Claims Paid of Earthquake Insurance on Dwelling Risks
Source: General Insurance Association of Japan, as of Sep. 15, 2005 (http://www.sonpo.or.jp/).
Southern HyogoPrefecture
Off Western FukuokaPrefecture
Place of Epicenter orEruption
4. Theoretical Framework of Portfolio Analysis
** Moral hazard refers to the tendency for those covered by insurance to change their behavior in a way that leads to larger claims against the insurer.
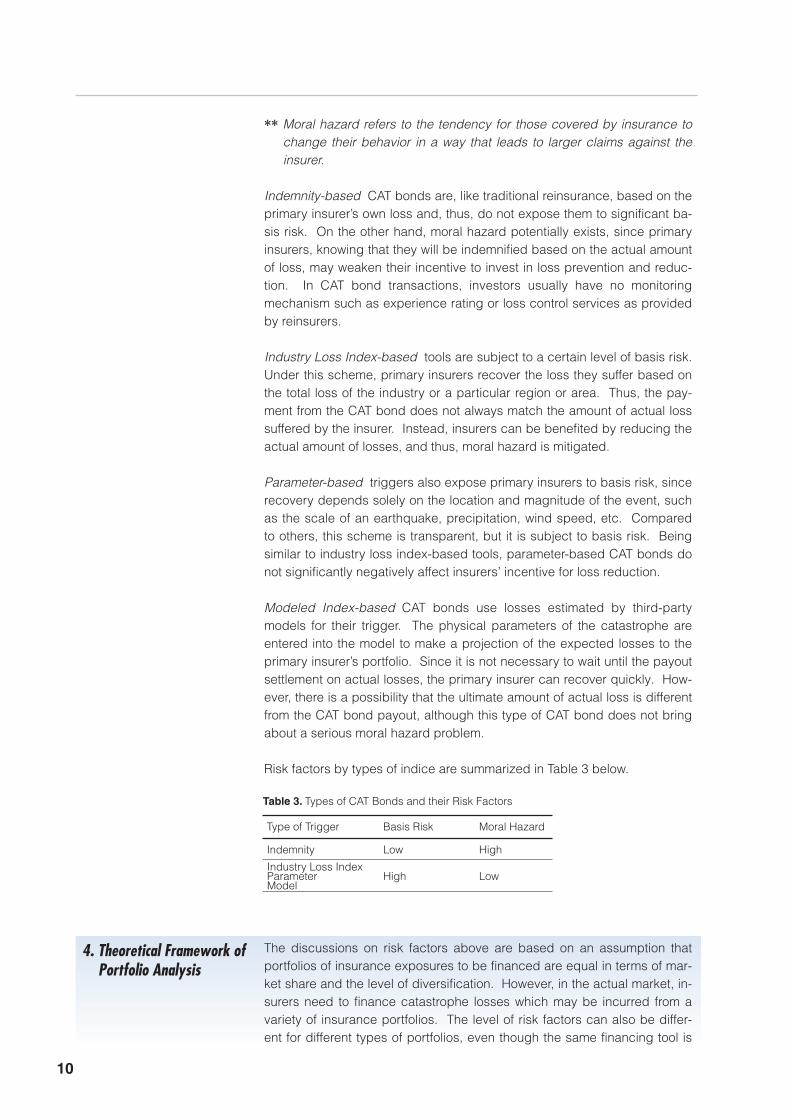
Indemnity-based CAT bonds are, like traditional reinsurance, based on the primary insurer’s own loss and, thus, do not expose them to significant ba-sis risk. On the other hand, moral hazard potentially exists, since primary insurers, knowing that they will be indemnified based on the actual amount of loss, may weaken their incentive to invest in loss prevention and reduc-tion. In CAT bond transactions, investors usually have no monitoring mechanism such as experience rating or loss control services as provided by reinsurers.
Industry Loss Index-based tools are subject to a certain level of basis risk. Under this scheme, primary insurers recover the loss they suffer based on the total loss of the industry or a particular region or area. Thus, the pay-ment from the CAT bond does not always match the amount of actual loss suffered by the insurer. Instead, insurers can be benefited by reducing the actual amount of losses, and thus, moral hazard is mitigated.
Parameter-based triggers also expose primary insurers to basis risk, since recovery depends solely on the location and magnitude of the event, such as the scale of an earthquake, precipitation, wind speed, etc. Compared to others, this scheme is transparent, but it is subject to basis risk. Being similar to industry loss index-based tools, parameter-based CAT bonds do not significantly negatively affect insurers’ incentive for loss reduction.
Modeled Index-based CAT bonds use losses estimated by third-party models for their trigger. The physical parameters of the catastrophe are entered into the model to make a projection of the expected losses to the primary insurer’s portfolio. Since it is not necessary to wait until the payout settlement on actual losses, the primary insurer can recover quickly. How-ever, there is a possibility that the ultimate amount of actual loss is different from the CAT bond payout, although this type of CAT bond does not bring about a serious moral hazard problem.
Risk factors by types of indice are summarized in Table 3 below.
The discussions on risk factors above are based on an assumption that portfolios of insurance exposures to be financed are equal in terms of mar-ket share and the level of diversification. However, in the actual market, in-surers need to finance catastrophe losses which may be incurred from a variety of insurance portfolios. The level of risk factors can also be differ-ent for different types of portfolios, even though the same financing tool is
σσ σ
σσ σ σσσσ σσ
σσ σσσσ σσ
σσ σσ
σ σσσ
10
Indemnity Low High
High Low
Table 3. Types of CAT Bonds and their Risk Factors
Type of Trigger Basis Risk Moral Hazard
Industry Loss IndexParameterModel

used. This comes to light through precedent researches to quantitatively evaluate the basis risk of financing tools.For example, Cummins, Lalonde and Philips (2000) found that financing tools based on a statewide index for Florida can effectively hedge catastro-phe losses only for certain types of insurers, namely, several insurers with a higher than average market share in the state, and a limited number of smaller insurers with insurance portfolios that were highly diversified throughout the state. Through such efforts, the importance of analyzing in-surance portfolios held by individual insurers came to be commonly recog-nized.
Major (1999) is another researcher who empirically measured basis risk by estimating insurer-specific deviations from statewide indices. Major de-signed a measure of basis risk with an industry loss index-based tool by calculating the correlation between the index and losses incurred by an in-dividual insurer’s book of business, which can be exhibited by the following formula:
b = 1 - rim (1)
According to this formula, the level of the basis risk depends solely on rim ; the correlation between the actual loss sustained by an insurer using the instrument and that of the industry total. Doherty (2000) refined formula (1) and separated it into two factors. Consider an insurance portfolio i having a loss amounting to Li . The loss incurred by all portfolios other than i is subscripted as Lj . The total loss of the market Lm is calculated as:
Lm = Li + Lj (2)
Then, covariance between Li and Lm is:
Cov (Li , Lm) = Cov (Li , Li +Lj ) = Cov (Li , Li ) + Cov(Li , Lj )
This can be replaced by the following equation by using rim (the correlation coefficient between Li and Lm ), and rij (that between Li and Lj ), as well as σi, σm and σj (standard deviation of Li , Lm and Lj , respectively).
rimσi σm = σi 2 + rij σi σj
rim = σi /σm + rij σj /σm
By substituting this in formula (1) above, the basis risk is:
b = 1 - rim = 1 - (σi /σm + rij σj /σm ) = (1 - rij σj /σm ) - σi /σm (3)
By focusing on two components of this formula, (rij σj /σm ) and (σi /σm ), we can see that the former component indicates how representative of the whole market i’ s portfolio is. All other things being equal, when portfolio i is as highly diversified as the market, the value of (rij σj /σm ) is close to unity. The latter (σi /σm ) represents how portfolio i dominates the market; the bigger the market share, the closer to unity its value is. Thus, I refer these two components as “market representation indicator” and “market share indicator,” respectively.
11
In this paper, I calculated the market representation indicator and market share indicator based on sample data from accounting statistics of Japa-nese property insurers. These accounting figures are publicly disclosed by insurers and compiled and published as Insurance (Annual Special Is-sue: The Statistics of Japanese Non-Life Insurance Business), 1995-2004 by the Insurance Research Institute.
Net claims paid for fire insurance were used as net losses sustained by in-dividual primary insurers after reinsurance, i.e. Li in the equation (2) above. Net claims paid represent the amount of claims paid after subtracting any recovery from reinsurance contracts and can be regarded as the amount that insurers ultimately bear. Eight sample insurers were selected for the calculations. In order to calculate the index, Lm , the total Direct Net Claims Paid of all domestic insurers writing fire and earthquake insurance are used. Since the industry loss index is usually set based on the amount of actual losses incurred for all primary insurance contracts in a certain line of business in the market, the Direct Net Claims Paid, representing the amount of claims before subtracting recoveries from reinsurance, can be regarded as the industry loss index. The figures cover losses from all per-sonal and commercial fire insurance policies including earthquake by 19 property insurers. According to the Insurance Research Institute in 2004, these 19 insurers wrote approximately 95 percent of all direct premiums for fire insurance including saving type contracts and earthquake insurance.
The data of total direct claims paid were used, without dividing them into catastrophe and non-catastrophe losses, based on the assumption that the distribution of catastrophe losses coincides with that of total losses. Ac-tually, the amount of total losses for fire insurance is significantly influenced by catastrophe losses, including those caused by flood or earthquake, as non-catastrophe losses such as straight fire and theft, etc. are incommens-urably small in size compared with catastrophe losses once they occur. For our calculations of standard deviations and correlations, figures from the most recent decade (1995 to 2004) are used. After 2001, several insur-ers merged into single entities. Their past figures have been combined ac-cording to their present entities, and are regarded as those for single insur-ers.
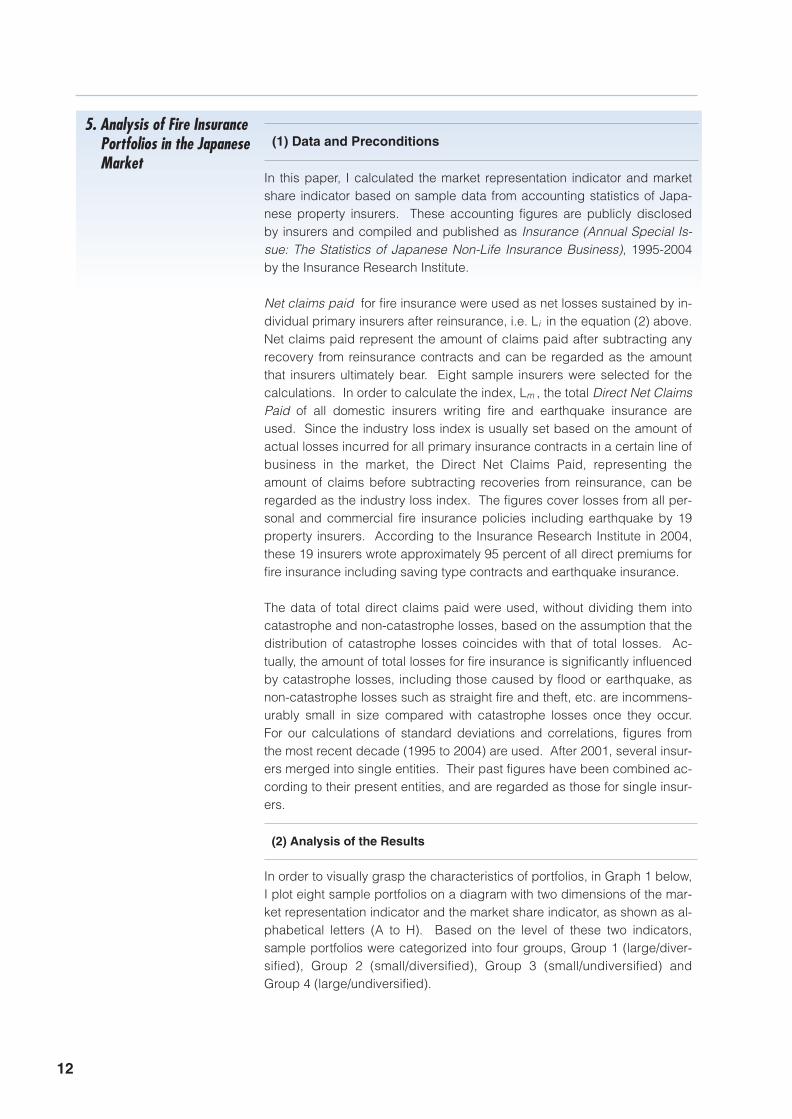
In order to visually grasp the characteristics of portfolios, in Graph 1 below, I plot eight sample portfolios on a diagram with two dimensions of the mar-ket representation indicator and the market share indicator, as shown as al-phabetical letters (A to H). Based on the level of these two indicators, sample portfolios were categorized into four groups, Group 1 (large/diver-sified), Group 2 (small/diversified), Group 3 (small/undiversified) and Group 4 (large/undiversified).
(2) Analysis of the Results
12
5. Analysis of Fire Insurance Portfolios in the Japanese Market
(1) Data and Preconditions
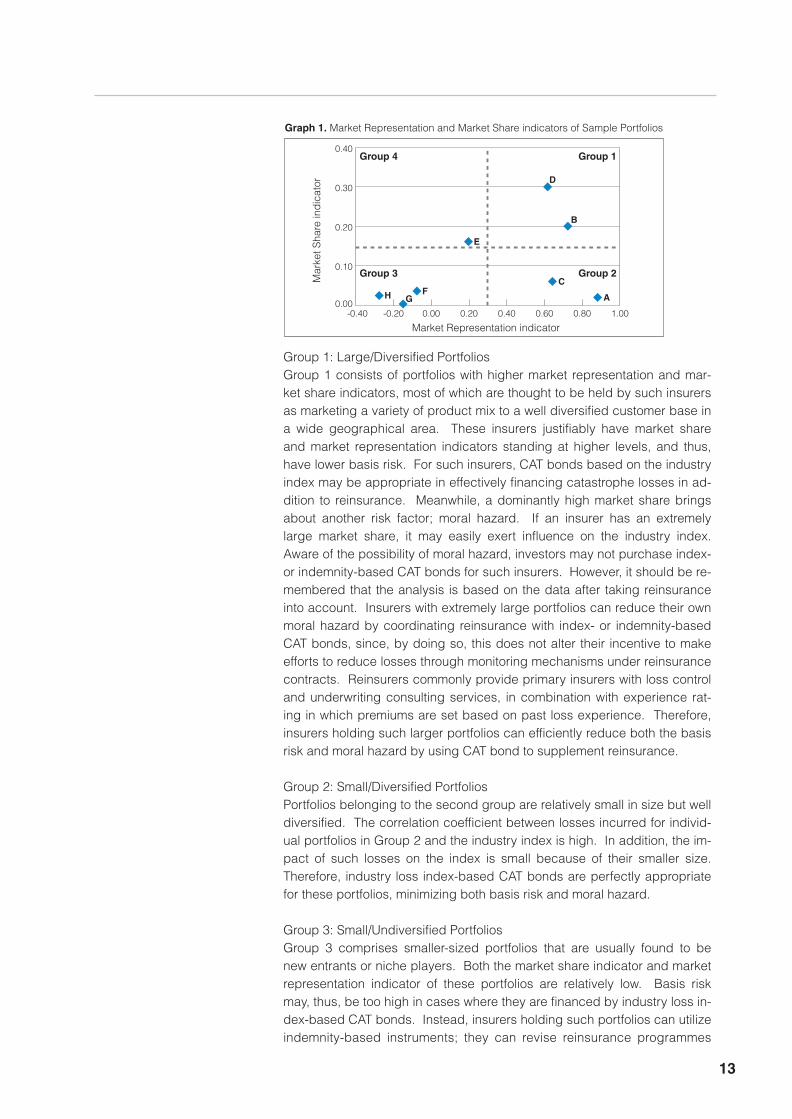
Group 1: Large/Diversified PortfoliosGroup 1 consists of portfolios with higher market representation and mar-ket share indicators, most of which are thought to be held by such insurers as marketing a variety of product mix to a well diversified customer base in a wide geographical area. These insurers justifiably have market share and market representation indicators standing at higher levels, and thus, have lower basis risk. For such insurers, CAT bonds based on the industry index may be appropriate in effectively financing catastrophe losses in ad-dition to reinsurance. Meanwhile, a dominantly high market share brings about another risk factor; moral hazard. If an insurer has an extremely large market share, it may easily exert influence on the industry index. Aware of the possibility of moral hazard, investors may not purchase index- or indemnity-based CAT bonds for such insurers. However, it should be re-membered that the analysis is based on the data after taking reinsurance into account. Insurers with extremely large portfolios can reduce their own moral hazard by coordinating reinsurance with index- or indemnity-based CAT bonds, since, by doing so, this does not alter their incentive to make efforts to reduce losses through monitoring mechanisms under reinsurance contracts. Reinsurers commonly provide primary insurers with loss control and underwriting consulting services, in combination with experience rat-ing in which premiums are set based on past loss experience. Therefore, insurers holding such larger portfolios can efficiently reduce both the basis risk and moral hazard by using CAT bond to supplement reinsurance.
Group 2: Small/Diversified PortfoliosPortfolios belonging to the second group are relatively small in size but well diversified. The correlation coefficient between losses incurred for individ-ual portfolios in Group 2 and the industry index is high. In addition, the im-pact of such losses on the index is small because of their smaller size. Therefore, industry loss index-based CAT bonds are perfectly appropriate for these portfolios, minimizing both basis risk and moral hazard.
Group 3: Small/Undiversified PortfoliosGroup 3 comprises smaller-sized portfolios that are usually found to be new entrants or niche players. Both the market share indicator and market representation indicator of these portfolios are relatively low. Basis risk may, thus, be too high in cases where they are financed by industry loss in-dex-based CAT bonds. Instead, insurers holding such portfolios can utilize indemnity-based instruments; they can revise reinsurance programmes
13
Graph 1. Market Representation and Market Share indicators of Sample Portfolios
Group 4
Market Representation indicatorM
arke
t Sha
re in
dic
ator
-0.40 -0.20 0.00 0.20 0.40 0.60 0.80 1.000.00
0.10
0.20
0.30
0.40Group 1
Group 3 Group 2
A
B
C
D
E
FGH

6. Conclusions
and set excess of loss coverage or indemnity based CAT bond at a higher level. It may be inappropriate for these portfolios to be financed solely by indemnity-based CAT bonds considering their size. For smaller insurers, it may also be more cost effective to utilize monitoring functions such as loss control and underwriting services provided by reinsurers rather than carry out such functions themselves. Thus, indemnity-based CAT bonds should be used in combination with reinsurance coverage. An insurer operating in a limited geographical area may utilize parameter- or modeled index-based instruments as a complement to reinsurance. It may further be eas-ier for such insurers to identify their property exposures and events affect-ing them than larger insurers operating in wider areas. Thus, they may construct loss models that effectively estimate their actual amount of loss, and may identify parameters, such as wind speed at a certain geographi-cal point, that highly correlate with their actual losses.
Group 4: Large/Undiversified PortfoliosOnly one sample portfolio was found to be categorized in Group 4. This can be for a insurer which selectively underwrites a large number of con-tracts according to its unique underwriting policy. The market representa-tion indicator of this portfolio is relatively low despite its market share indi-cator being high. The insurer holding this portfolio can be exposed to significant basis risk when using industry loss index-based CAT bonds, and thus, indemnity-based instruments including reinsurance and CAT bond are appropriate. Considering that an insurer holding this type of portfolio seems to have sufficient economy of scale to efficiently undertake loss controls by itself, indemnity based CAT bonds will be more cost effec-tive than reinsurance to be set at higher layer over the base reinsurance coverage. If individual contracts consisting of the portfolio are homogene-ous, which is often seen in such portfolios held by insurers adopting strict underwriting policies, parameter- or modeled index-based instruments may be appropriate. As discussed above in the analysis of group 3, construct-ing models or identifying parameters suitable for portfolios consisting of uniform exposures may be easier than doing so for those comprising a va-riety of exposures.
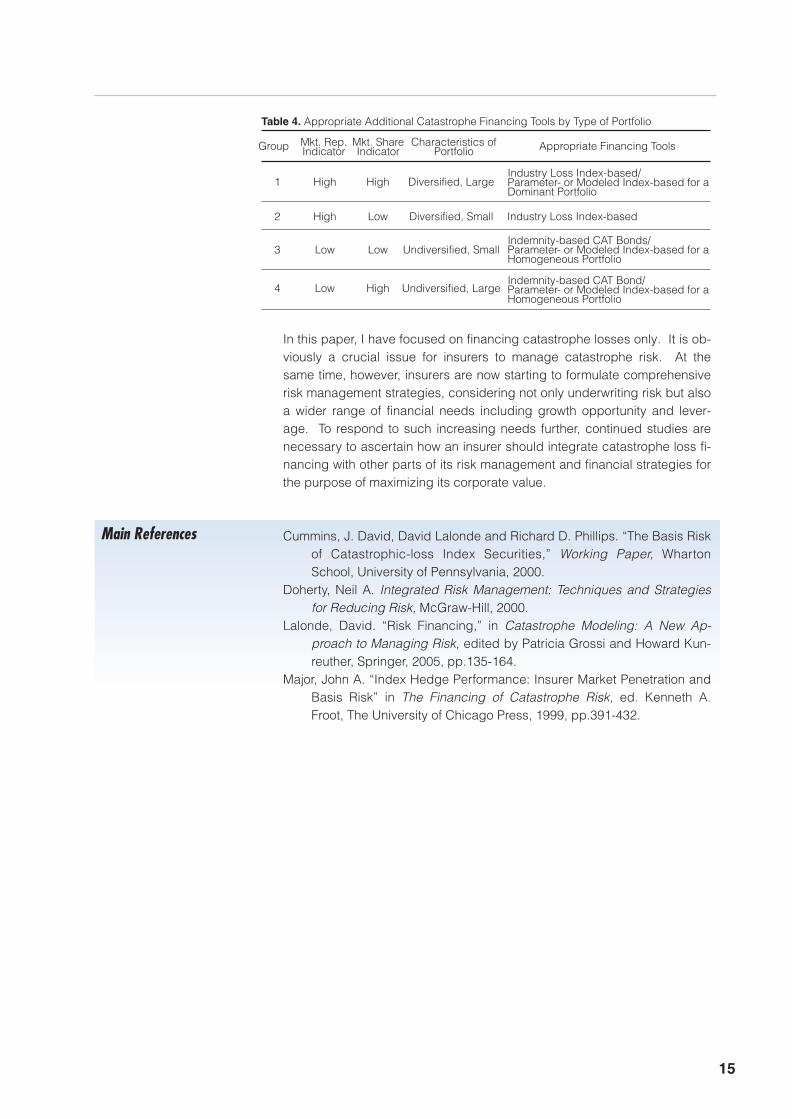
From the portfolio analysis of sample data from Japanese fire and earth-quake insurance, it was found that financing tools for effective hedging of catastrophe risk depend on the characteristics of individual portfolios to be financed. Table 4 below summarizes the optimal choice of financing tools that should be used in addition to the base reinsurance coverage by types of portfolio. The analysis in this paper implies that insurers can make bet-ter decisions to effectively finance catastrophe losses by understanding the characteristics of their respective insurance portfolios. The theoretical framework based on the levels of market representation and market share indicators enables insurers to quantitatively estimate these indicators.
14
Main References
In this paper, I have focused on financing catastrophe losses only. It is ob-viously a crucial issue for insurers to manage catastrophe risk. At the same time, however, insurers are now starting to formulate comprehensive risk management strategies, considering not only underwriting risk but also a wider range of financial needs including growth opportunity and lever-age. To respond to such increasing needs further, continued studies are necessary to ascertain how an insurer should integrate catastrophe loss fi-nancing with other parts of its risk management and financial strategies for the purpose of maximizing its corporate value.
Cummins, J. David, David Lalonde and Richard D. Phillips. “The Basis Risk of Catastrophic-loss Index Securities,” Working Paper, Wharton School, University of Pennsylvania, 2000.
Doherty, Neil A. Integrated Risk Management: Techniques and Strategies for Reducing Risk, McGraw-Hill, 2000.
Lalonde, David. “Risk Financing,” in Catastrophe Modeling: A New Ap-proach to Managing Risk, edited by Patricia Grossi and Howard Kun-reuther, Springer, 2005, pp.135-164.
Major, John A. “Index Hedge Performance: Insurer Market Penetration and Basis Risk” in The Financing of Catastrophe Risk, ed. Kenneth A. Froot, The University of Chicago Press, 1999, pp.391-432.
15
1 High High Diversified, Large
2 High Low Diversified, Small Industry Loss Index-based
3 Low Low Undiversified, Small
4 Low High Undiversified, Large
Group Appropriate Financing Tools
Table 4. Appropriate Additional Catastrophe Financing Tools by Type of Portfolio
Characteristics ofPortfolio
Mkt. Rep.Indicator
Mkt. ShareIndicator
Industry Loss Index-based/Parameter- or Modeled Index-based for a Dominant Portfolio
Indemnity-based CAT Bonds/Parameter- or Modeled Index-based for a Homogeneous Portfolio
Indemnity-based CAT Bond/Parameter- or Modeled Index-based for a Homogeneous Portfolio
Dominic ChristianCEO International DivisionsBenfield Limited
3 DFA modelling moves into the boardroom Lessons from the UK insurance industry’s DFA modelling experience
Introduction
What is DFA?
Dynamic Financial Analysis, or DFA, is now on everybody’s lips in the insur-ance industry.
DFA is one of those insurance terms that is used by many but with no one agreed definition. In purest terms it represents a whole company asset and liability model, but in common usage it is any probabilistic or stochas-tic model. The Japanese market was one of the first to embrace DFA in the early years of this century. For example, four to five years ago Japanese insurance groups represented a significant proportion of the early licens-ees of Benfield’s ReMetrica DFA software. Initially many of the early mod-els in Japan were mainly concerned with reinsurance optimisation. A few began the process with capital modelling explicitly in mind, although typi-cally the models were for a single year only and assets and other non-in-surance classes were modelled separately.
Building a multi-year, multi-risk model (including, say, asset and reserving risk) is a tougher task, a task that most insurers have avoided, unless forced. But what are the practical implications of building and implement-ing such a multi-year, multi-risk DFA model in an insurance company? Are there any benefits to offset the pain of the process?
Fortunately for the global insurance industry, one part of the world has, al-beit reluctantly, pioneered the development of whole company, multi-year asset and liability models. Virtually every UK company of any size now either has a DFA model of their business, or is building one. Demand for DFA software and for actuaries and analysts with DFA experience is rocket-ing.
But why is this? What was the motivation for UK companies to invest so quickly and so heavily in DFA modelling? Are there lessons in the succes-ses and failures in the UK for insurers in relatively mature modelling mar-kets such as Japan and in other markets that have more recently turned to DFA?
DFA is now often used as a catch-all term for any stochastic financial mod-el. A stochastic model does not just seek to model the most likely result, or a worst case, but rather the whole range of possible outcomes, each with its associated probability. It does this by describing each key variable in a system as a probability distribution rather than just a single value. Some distributions may depend upon others, others will be independent. Thou-sands of simulations will be run, perhaps one hundred thousand, each a different version of the following year or years. From the model it is possi-
16
Stochastic modelling comes of age
The early days of DFA
ble to see not only the most likely outcome (the median) but also the aver-age (the mean) or the extremes (e.g. the 1 in 200th worst year).
Stochastic modelling really started to be used in re/insurance modelling in the 1990s, as computer power increased and software tools became avail-able. Typical initial analyses were limited to specific tasks, for example op-timisation of the reinsurance programme for a single class of business. But by the late 1990s whole company DFA models were being attempted, particularly in the USA. The concept was captivating, a single model en-compassing all the risks the company was exposed to. Strategic decisions could be compared based upon their impact on the whole company: for example would reinsurance strategy A deliver a higher return and lower the risk of company failure than strategy B; or is the company investment pol-icy consistent with its underwriting risk appetite?
Unfortunately most of the early projects failed; they tried to do too much, too soon. The software was slow and not very robust, the models became too complicated and impossible to interpret or audit. Whole company DFA models got a very bad name.
Through the late 1990s and early 2000s stochastic analysis became com-mon-place. The modelling was often used by reinsurance brokers to de-termine “optimal” reinsurance arrangements and prove to their customers the value of their reinsurance purchase. Similarly the output was often used to demonstrate the economics of a deal to reinsurers, particularly for non-traditional reinsurances where the behaviour of the contract may not be readily clear.
In parallel, probabilistic peril models were growing in use and influence. A peril model is essentially a specific purpose DFA model, though often, par-ticularly in the early days, with little transparency about the assumptions used to generate the catastrophe events themselves or the damage they cause. People became familiar with the concept of a “1 in 100” event or “1 in 100” aggregate year for catastrophic risk and sought equivalent infor-mation for other classes of business.
At the same time computers were getting faster and DFA software becom-ing readily available, either as an add-in to Microsoft Excel or as a stand-alone product. In 2000, the first component based, flexible DFA tool Re-Metrica was launched. There was now no theoretical barrier to building a stochastic financial model appropriate to each task.
17
Whole company DFA models
An early case study
By the early 2000s full company DFA were still a “nice to have” rather than a “need to have”. But it had become clear to many that business strat-egies could not be properly compared on a departmental basis if one measure of success was the capital efficiency of the company as a whole.
How to model capital is a matter for another paper, but typically companies use some form of Value at Risk (VAR) or Tail Value at Risk (TVAR) method to assess and/or allocate the economic capital required to support a line of business. Note that VAR methods look at a chosen percentile, whilst TVAR methods look at the average over a threshold. For example, every 200 years you may expect an underwriting loss of over JPY 50bn or more (VAR) with the average such large loss being JPY 75bn (TVAR).
Consider two companies with identical, say, motor portfolios; one a mono-line motor company, the other a diversified composite company. The capi-tal implication of cancelling a quota share reinsurance arrangement for the mono-line company is likely to be severe: its 1 in 200 number, and so its re-quired capital, could double. But for the diversified company, things are very different. It could be that its capital is driven not by the motor book but by a much larger property book exposed to catastrophe risk. Cancel-ling the quota share does inject more risk in the motor book, but most of the 1 in 200 year and above scenarios for the company as a whole are driven by the property book. Cancelling the motor quota share thus has lit-tle if any capital implication.
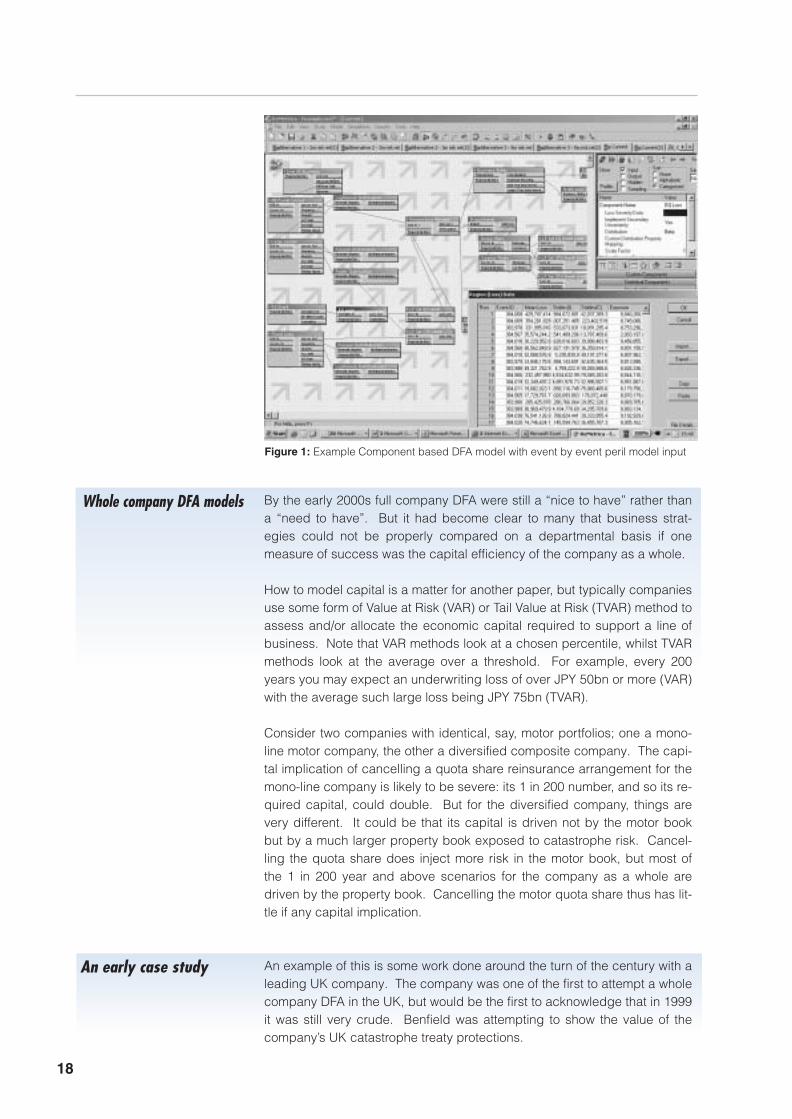
An example of this is some work done around the turn of the century with a leading UK company. The company was one of the first to attempt a whole company DFA in the UK, but would be the first to acknowledge that in 1999 it was still very crude. Benfield was attempting to show the value of the company’s UK catastrophe treaty protections.
18
Figure 1: Example Component based DFA model with event by event peril model input
● Benfield’s initial analysis looked at the impact of the programme on the company’s UK catastrophe losses: the 1 in 100 catastrophe loss, at the time its chosen benchmark, was cut from £500m to under £50m, an excellent result.
● We then looked at the cover in the context of the company’s global catastrophe exposures; it still looked good, no increase in gross or net 1 in 100 numbers, reflecting the UK dominance of their portfolio.
● But when non-catastrophe property losses were included, things be-gan to change. The model probably over-estimated the variability of attritional property losses, but even so the result was unexpected. The gap between the gross and net 1 in 100 result narrowed from £400m to under £200m, as bad attritional loss years dominated the net 1 in 100 number. Whilst still valuable, the catastrophe cover was looking less attractive.
● Adding in all other underwriting risks, eg motor, casualty etc, the im-pact of the catastrophe cover was becoming negligible – the gap be-tween 1 in 100 gross and net of the catastrophe cover fell to under £50m.
● When asset risk was added, the gap almost disappeared – the UK catastrophe programme had no measurable effect on the group’s 1 in 100 number.
Did that company stop buying catastrophe cover on the basis of that ana-lysis? No, for two reasons: firstly the model was known to be flawed, so it would be unwise to base a decision solely on the result of that model; sec-ondly the company was well aware that catastrophe reinsurance is not only bought for capital protection. Should there be a large catastrophe tomor-row and the company reported a larger net loss proportionate to size than its peers, it would appear ill-managed, its share price would fall and man-agement might lose their jobs.
But, the company did at last have the beginnings of a framework to judge the value of its reinsurances objectively. It became aware that these mod-els can be used to educate stakeholders about why decisions were made, managing expectation. Indeed a couple of years later the company was able to use such a model to demonstrate to its Board of Directors why a particular complex transaction that Benfield had been working on for near-ly a year should not be bought – much to Benfield’s regret.
The same company continued to develop its DFA model, achieving by 2005 a “state of the art” Individual Capital Assessment model. Interestingly the model showed that for regulatory capital purposes catastrophe reinsur-ance was important, but capital requirements were dominated by reserving and asset risk.
19
Rating Agency Pressure
The spur for UK companies though was not internal but external. The Eu-ropean Union has long been edging towards a uniform risk-based regula-tory capital regime called Solvency II, but the UK regulator, the Financial Services Authority (FSA), decided to go it alone. In 2005, the FSA intro-duced a risk based capital regime “super-equivalent” to that likely to emerge from European discussion. Essentially the capital assessment ele-ment has three elements:
● Minimum Solvency Requirement (MSR): the current “solvency I” EU minimum capital. Regulatory apital must be at least at this level.
● Economic Capital Required (ECR): an enhanced ratio method with dif-ferent premium loadings for different types of business, plus loads for reserves, different asset classes etc.
● Individual Capital Assessment (ICA): the company’s own view of its capital requirement – with the probability threshold set at 1 in 200. Typically UK companies have used DFA models to derive this number.
From these three the FSA impose Individual Capital Guidance (ICG). Nor-mally this is at least the higher of the MSR, ECR and ICA, perhaps with an additional margin, although the FSA has offered the carrot that it may be willing to accept the ICA number even if lower than the ECR if it is con-vinced by the model.
Contrary to FSA expectation, the vast majority of UK companies decided to use a DFA model to estimate their ICA; the FSA expected most initially to use stress-test methods. This caused the FSA a problem as it did not have enough actuaries to validate the DFA models built. But in truth the FSA is more interested in seeing that there is a robust risk management process in place. The DFA model is part of the evidence that a company has thought through the risks it faces and how they inter-relate.
Similar risk based capital regimes are spreading around the world, for ex-ample a similar system has been announced for Korea. This is generating a demand from companies even in territories where no change is yet pro-posed, they know it will come and want to get ready.
But interestingly, the methodology is now being championed by those that many would call the real regulators of the insurance industry, the rating agencies.
In late 2005 Standard & Poor’s (S&P) announced two initiatives that could have profound implications for many insurers and reinsurers. Firstly, the catastrophe element of its capital adequacy calculation was no longer to be a flat premium charge but rather a modelled 1 in 250 worst case aggre-gate net catastrophe loss year. In many cases this has caused a leap in capital requirement. S&P makes no recommendation about which peril model to use. The agency is aware of the risk of “peril model shopping”, i.e. companies picking the most benign model in the market. It seeks to ameliorate this risk by expecting the same model to be used in internal de-
20
Current drivers of demand
Lessons learnt from the UK exercise
cision making, i.e. the same model should be used to determine reinsur-ance policy and perhaps be included in the corporate DFA.
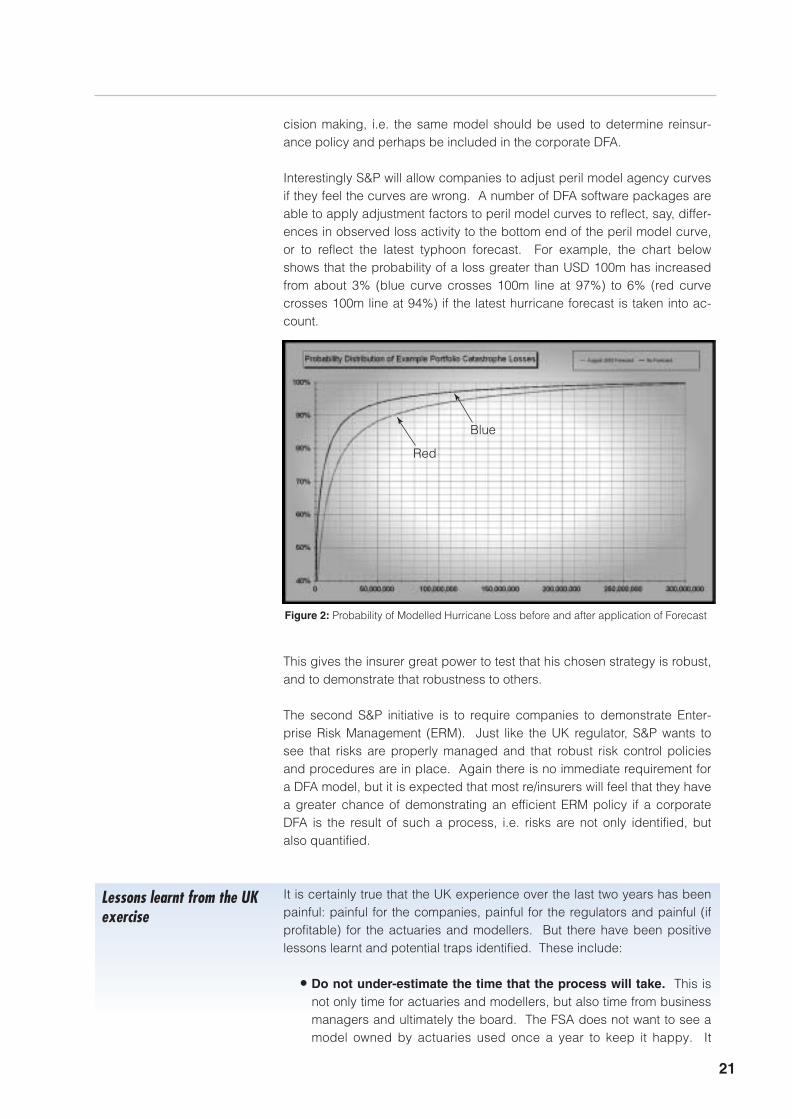
Interestingly S&P will allow companies to adjust peril model agency curves if they feel the curves are wrong. A number of DFA software packages are able to apply adjustment factors to peril model curves to reflect, say, differ-ences in observed loss activity to the bottom end of the peril model curve, or to reflect the latest typhoon forecast. For example, the chart below shows that the probability of a loss greater than USD 100m has increased from about 3% (blue curve crosses 100m line at 97%) to 6% (red curve crosses 100m line at 94%) if the latest hurricane forecast is taken into ac-count.
This gives the insurer great power to test that his chosen strategy is robust, and to demonstrate that robustness to others.
The second S&P initiative is to require companies to demonstrate Enter-prise Risk Management (ERM). Just like the UK regulator, S&P wants to see that risks are properly managed and that robust risk control policies and procedures are in place. Again there is no immediate requirement for a DFA model, but it is expected that most re/insurers will feel that they have a greater chance of demonstrating an efficient ERM policy if a corporate DFA is the result of such a process, i.e. risks are not only identified, but also quantified.
It is certainly true that the UK experience over the last two years has been painful: painful for the companies, painful for the regulators and painful (if profitable) for the actuaries and modellers. But there have been positive lessons learnt and potential traps identified. These include:
● Do not under-estimate the time that the process will take. This is not only time for actuaries and modellers, but also time from business managers and ultimately the board. The FSA does not want to see a model owned by actuaries used once a year to keep it happy. It
21
Figure 2: Probability of Modelled Hurricane Loss before and after application of Forecast
Red
Blue
22
wants to see a model embedded in the risk management and deci-sion making culture of the company. A senior FSA spokesman said in 2005 “We expect the senior management team to "own" the ICA and to understand what it means for the way in which they manage the business”; other regulators and rating agencies will have similar ex-pectations. This is not just a model, it is a cultural change. So start early, don’t wait until you have to do it.
● Do not expect it to be easy. The FSA require a multi-year model, normally 3 of 5 years. They expect the model to behave realistically, e.g. if there is a big loss in year 1 of a simulation, what will happen to reinsurance pricing? It expects companies to think through the im-pact of business and pricing cycles on their business and their volatil-ity. Companies are expected to identify and model dependency and correlation explicitly. All this must be expressed in a way that is not only technical, but also measurable and understandable to non-math-ematicians.
● Do expect some surprises. It is rare for a model not to come up with unexpected results. But it is also rare for a truly unexpected result to not be either due to a mistake or an over-simplified assumption. Checking the model will probably take as long as building it.
● Keep it simple. It is far better to have a simple model which is under-stood, with its flaws identified and known, than an over-complicated model which produces results nobody understands. One leading UK company was forced to scrap its ICA model as it produced results far worse than any of its competitors for reasons that were not fully under-stood. If a flexible DFA tool is used, it is possible to add complexity back in where required once a working, believable, base model is built.
● Don’t build a DFA just because you feel you have to have one. Build a DFA for a purpose. If there is no immediate regulatory pres-sure, then pick a pilot study – perhaps a simple whole company capi-tal model, or a detailed model of one line of business for reinsurance optimisation purposes.
● Have clear responsibilities and deliverables. Every DFA project must have a senior management champion, a strong project leader, buy-in from all levels of management and clear, measurable deliver-ables. If even one of these is not there, the chance of failure is high. If possible, phase the project such that the first real value is delivered in weeks, not months or years.
● Choose your software carefully. In the final reckoning, cost of soft-ware is but a small part of the cost of a DFA exercise. The software must be flexible, fit for purpose, robust and fast. For example, few DFA models can properly import peril model output at event by event level, but this level of detail is vital if events causing losses to multiple business classes, departments, or companies are to be properly modelled. Even then the software must be robust enough to run over

23
100,000 simulations, otherwise, as many UK companies have found, the results are vulnerable to sampling error.
And finally, the most important lesson:
● Remember models advise, models do not decide. Even the most sophisticated model is stupid. Every model requires interpretation; it must be a guide to decision making not the decision maker. A com-pany that lets a model decide its future is dead. But, used intelligent-ly, a DFA model is a superb management tool that can help intelligent management determine optimal policy, test the sensitivity of that pol-icy to changes in assumptions, demonstrate risk management com-petence and explain decisions to others, be they colleagues, super-iors, regulators, rating agencies, shareholders, parent company, analysts or reinsurers.
Embarking on a DFA process is not trivial, but within 3 years every major company, in Japan or elsewhere, will either have a whole company DFA model or be desperately building one. But building a model is the easy part; embedding it in the culture of the company, and so getting the full benefit without damaging but rather improving the efficiency of the compa-ny, is the real challenge.
Hiroshi ShishikuraAccount DirectorGlobal Business UnitAon Risk Services Japan, Ltd.
4 Domestic Real Estate Investment Market and Insurances against Losses Caused by Investment Funds
1. Domestic Real Estate Funds Real estate funds are funds raised from investors and invested in real es-tate properties. Income gains derived from rent revenue and capital gains generated by sales of properties are distributed to investors. The increase in volume of investment in such real estate fund was so rapid that it has contributed to the rising prices of land and real estate in the large-city areas of Japan. The insurances required to cover real estate fund portfo-lios provide potential profit-earning opportunities for insurance brokers, in-cluding us, due to the significant total volume of real estate funds in the market. As an international insurance broker, we are particularly well placed to capitalize on our advanced know-how in order to make a strong showing in this market. Here, I briefly explain how and what lines of insur-ance products are generally arranged for such investment properties. First, I would like to preface discussion of the main topic with an overview of such real estate funds.
I believe that one of the factors contributing to the current development of real estate funds is the high profitability of the real estate fund business on the back of favorable economic environments emerging as after-effects of the collapse of the bubble economy in Japan, which was driven by foreign private equity funds* purchasing large quantities of nonperforming loans from Japanese financial instruments in the late 1990s and enjoying capital gains through sale of the properties used as collateral. Subsequently, such private equity funds were directly invested in properties such as hotels, golf courses, warehouses and office buildings, and as a result, a large number of private equity funds have been established for the purpose of investment in Japanese properties to date. Recently, we have witnessed the appearance of funds in which the total investment amount exceeds no less than 1 trillion yen. * Foreign private equity funds formed to invest globally in secured and
corporate unsecured debt instruments, real estate related assets.
Furthermore, the Investment Trust and Investment Corporation Act, estab-lished in November 2000, boosted the development of REIT schemes and accelerated the influx of enormous amounts of money into the real estate market. REIT is the acronym for “real estate investment trust” (sometimes modified to J-REIT, to denote a “Japanese real estate investment trust”). Whereas a REIT is listed on the market and is funded by a broad range of investors, including individuals, a private equity fund is funded through a major transaction involving specific institutional investors such as pension funds and insurance companies.
As of the end of 2005, the aggregate asset volume of J-REITs was 3.4 tril-
24
2. Terms and Conditions Insured by Financial Institutions
lion yen, while that of private equity funds totaled some 4.4 trillion yen, giv-ing a combined total of 7.8 trillion yen.** It is particularly worth noting that about 10% of Japan’s 2,000-odd golf courses are funded by foreign private equity funds. The actual number being unknown, it is likely that a similar sit-uation applies in respect of domestic hotels. ** Actual investment performance is estimated on the basis of data from
STB Research Institute Co., Ltd.
There has been a rapid increase in the number of real estate funds, particu-larly private equity funds, which acquire properties by leveraging from funds raised at low interest rates from financial institutions that seek high invest-ment efficiency. Such investments are generally funded by financial institu-tions in the form of “nonrecourse loans”. Based on the premise that it is fi-nanced for a specific project, a nonrecourse loan is repaid not by guarantees from other companies but solely by the profits generated from the business or the project assets of separately established SPC. Because this approach involves a risk that the financial institution may not be able to recover the loan amount in the event of a loss affecting in project assets, the insurance terms are generally specified in the loan agreement. The general terms and conditions for nonrecourse loans are as follows:
● Insurances against losses or damages due to casualty or other hazards on an “all-risk” basis, covering a property in an amount equal to one hun-dred percent (100%) or more of the insurable replacement value of the property
● Commercial comprehensive general liability insurances with coverage of at least: (i) ¥300,000,000 per person for bodily injury and/or death; (ii) ¥1,000,000,000 per accident for bodily injury and/or death; and (iii) ¥500,000,000 per accident for property damage, against claims for bodily injury and/or death to one or more persons, or for property dam-age occurring on, in or about the property
● Rent insurances covering all risks in an amount not less than one hundred percent (100%) of the projected rents for the succeeding twelve (12) month period
● If the probable maximum loss (PML) with respect to the property is fifteen percent (15%) or greater, or if the property does not meet the current earthquake-proof design code enacted in 1981, a borrower shall pur-chase earthquake insurance up to the PML amount
● If the property contains central heating, air-conditioning and ventilating systems, boilers, other pressure vessels, high-pressure piping and ma-chinery, elevators, escalators or other similar equipment installed on the property, a borrower shall purchase boiler and machinery insurance
25
Here, we provide an outline of our range of insurance coverage for invest-ment properties, together with a description of the underwriting stance for each class of business of Japanese insurance companies.
For investment properties, an insurance policy is often issued in the form of blanket insurance where the fund scale is large. However, unlike the situa-tion regarding blanket policies issued overseas, there is a requirement to report to the insurance company, as an “ex facto reporting” basis, such de-tails of the property concerned as address, building structure and total floor area, as is the case for property insurance. Moreover, each single building must be assigned a specific amount of insurance, and the fund could suffer a coinsurance penalty in case the insurance amount is under-reported.
In general, the purchase of earthquake insurance for real estate funds is decided mainly on the basis of investor demand, and frequently appears to be required, particularly in cases where the investors are foreign pension or similar funds. With regard to REITs, the policy of purchasing earthquake insurance is often explained to investors in advance, through the prospec-tus. In such situations, it is sometimes seen that purchase of earthquake insurance is mandatory for borrowers of nonrecourse loans if the PML is high for certain assets (or portfolios), regardless of any decision made by the fund concerned. In cases where the PML of earthquake risk for certain assets (or portfolios) exceeds 15-20%, a lender of a nonrecourse loan will usually require the earthquake insurance.
As the reader may be aware, Japan is divided into 12 areas (cresta zones) for the purpose of arranging reinsurance. Reflected by the concerns about the likelihood of a shallow quake hitting the Kanto district or a Tokai earth-quake, earthquake insurance contracts are currently concentrated in Zone 5, which includes Tokyo, Yokohama and other large cities, and Zone 6, which takes in Nagoya and other large cities in the Tokai district. This fact makes it more difficult to arrange new earthquake insurance contracts on properties in these districts.
Under such circumstances, insurance companies show their different "viewpoints" in terms of providing capacity for earthquake risks, pursuant to each business policy. For example, concerning earthquake insurance for such investment properties, some companies tend to provide capacity for earthquake risks in a relatively positive manner for a blanket policy insured by large-scale funds. This stance may reflect the fact that they can enjoy higher insurance premiums for all risks on other insurances in cases where earthquake insurance capacity is provided for single buildings and for the same amount as for a blanket policy. In other words, they are reluctant to provide earthquake insurance capacity in an insurance policy wherein an insurance policy is to be issued for a single building.
On the other hand, there other companies, which keep more meticulous
26
(2) Earthquake Insurance
3. Arrangement of Insurances on Investment Properties
(1) Insurance Policy Form
stance, especially in each earthquake-proof design code of building to be covered by a blanket policy, tend to be extremely reluctant to underwrite earthquake insurance in blanket policies that allow "unexpected" future in-clusion of any additional buildings. Given this factor, earthquake insurance capacity is provided by such insurers more or less extensively for individ-ual contracts that cover Grade A properties once they fulfill the current earthquake-proof design code.
Private equity funds that are established overseas and invest globally often purchase global insurance programs for property damage, however, in many cases Japan’s exposure is excluded from such programs. This may be attributable to the tendency of risk managers and foreign insurance markets to treat Japan’s earthquake risks as a special case.
In a case where a huge amount of earthquake insurance capacity, such as that exceeding 10 billion yen, is required for real estate funds, it is prefer-able to arrange the insurance program by layered structure with the pri-mary layer handled by Japanese insurance companies and the excess lay-er by other direct insurance companies providing the earthquake insurance capacity on the premise that overseas reinsurers can support such coverage. We recognize that this is due to Japanese insurance com-panies being prepared to accept such a contract with an adequate rate, even if the deductible is low. On the other hand, overseas reinsurers would rather accept a blanket policy incorporating earthquake risk when the de-ductible is high.
Real estate players in Japan generally tend to regard the risk of domestic terrorism as remote. So long as the property being purchased by a real estate fund is not a landmark building, or absent any specific request by investors, terrorism risks are not covered by insurances relating to invest-ment properties.
Many Japanese insurance companies believe that terrorism risks are high-er for large-scale buildings. This fact leads to the case that terrorism risks are excluded in respect of buildings for which the insured value exceeds 1 billion yen. Meanwhile, a few insurance companies offer terrorism cover-age up to a certain amount of the sub-limit (about 1.5 billion yen), regard-less of the scale of the building.
In situations where Japanese insurance companies cannot provide insur-ances to cover terrorism risks for investment properties even in cases of necessity, the real estate fund will need to contact foreign insurance com-panies in Japan providing capacity, sometimes on the premise of the sup-port by overseas reinsurers.
Soil contaminated by harmful substances may produce adverse health ef-fects through humans ingesting foods derived from such contaminated soil or groundwater containing harmful substances. Although it was previously
(4) Environmental Impairment Liability Insurance
(3) Terrorism Risks
27
not an issue, such soil contamination caused by heavy metals or volatile organic compounds has come to light with the redevelopment of old pri-vate company factory sites. In the last few years, there has been a notable increase in the number of revealed cases of contamination.
Such soil contamination cases can adversely affect human health if they are not addressed promptly and appropriately. Therefore, in response to increasing societal demands for establishment of countermeasures, the Soil Contamination Measures Law was enacted in February 2003.
This law stipulates that a prefectural governor shall designate and notify land areas that fail to meet soil contamination standards as designated areas in each district. Further, a prefectural governor is entitled to man-date appropriate measures for removal of contaminated substances by the owner of the land concerned if it is deemed possible that human health may be affected by soil contamination of land in the designated area. If the cause of contamination is clear and the landowner admits that the enti-ty responsible for such contamination should take appropriate measures, the prefectural governor concerned may exercise said mandate. In accor-dance with the formulation of said law, insurance companies have progres-sively provided environmental impairment liability insurances to cover the expenses of removal of contaminated substances, together with cover against third-party liability in such contamination cases.
There are three primary cases where arrangement of environmental impair-ment liability insurances is required for investment properties. The first case is where soil contamination has already become evident in relation to an investment property, to the extent that dealing with said property cannot be realized without insurance coverage. The second case is where soil contamination is not yet apparent but insurance coverage is required by the lender of a nonrecourse loan. The third case is where a general part-ner (an entity that manages and operates funds by assembling investors and selecting properties for investment), who could be delegated particu-lar responsibility by the lender of a nonrecourse loan, voluntarily purchases such insurance out of concern that soil contamination may be discovered at some future time and that such risk should be covered by insurance. In actuality, a real estate fund will rarely purchase a property where soil con-tamination has already been identified. Therefore, arrangement of environ-mental impairment liability insurance is seldom required in the first of the above cases.
Submission of an environmental report to the insurance company is re-quired before the fund requests purchase of environmental impairment li-ability insurance, however, Japanese insurance companies generally do not accept contracts in cases where there is any concern about soil con-tamination verified by the Phase I Survey (survey based on the history of land usage). On the other hand, foreign insurance companies in Japan sometimes show more flexible stance against this kind of business. In ca-ses where real estate funds fail to purchase the coverage for such risks, they will seek overseas capacity coordinated by major insurance / reinsur-ance brokers.
28
Until recently, errors and omissions insurances have only been purchased in Japan by doctors, lawyers or members of other specific professions. However, recently there has been a gradual change in this trend. The number of users demanding vendors or suppliers to be covered by E&O insurances has been increasing, even in general business relationships. In these groundbreaking times, Japanese insurance companies do not un-derwrite such insurances in a positive manner. Consequently, some for-eign insurance companies in Japan provide E&O insurances to cover the risks derived from fund management and operation, or property manage-ment companies in relation to real estate fund business. While demand for such errors and omissions insurance is not expected to increase dramati-cally due to the differences in mind toward “liability” between Japanese and European/American companies, this should become one of the more promising insurance areas over the medium to long term.
With regard to D&O insurances, it is easy to arrange a contract for fund management and operation at a reasonable premium in Japan. There ap-pears to be greater demand by REITs than by private equity funds be-cause the former entails risks of litigation by an unspecified majority of in-vestors. Accordingly, we believe that the majority of REIT investment corporations or management/operation companies (investment trust man-agement companies) purchase D&O insurances. Foreign insurance com-panies in Japan, followed by Japanese insurance companies, have made a strong showing in the area of D&O insurance for REITs.
Currently, most investment properties are completed buildings. All funds are now aggressively seeking prime properties for acquisition. Conse-quently, the real estate trading market is experiencing a sellers’ market trend, which is causing land prices to soar in large-city areas, while deplet-ing the stock of properties available for investment by real estate funds. Going forward, we will see more new building development projects de-signed to be owned by real estate funds. Thus, demand for surety bonds will inevitably grow as investors with properties under construction seek protection against credit risks in respect of building constructors.
In Japan, surety bonds are arranged by independent “captive” brokers, which are usually subsidiary companies of the building constructors. In-surance companies in Japan do not adopt a positive approach to under-write surety bonds. It is common for insurance companies that underwrite builders’ risk insurances and liability insurances for building constructors to accept contracts for surety bonds in order to maintain good relationships with building constructors.
29
(5) Errors and Omissions Insurance
(6) Directors and Officers Insurance
(7) Surety Bonds

30
4. Future Real Estate Investment Market
The future real estate market is susceptible to economic trends affecting office space demand, house rental standards and interest rate trends influ-encing the interest rates on nonrecourse loans, as well as market demand for real estate funds as financial products. In accordance with the an-nouncement of quantitative relaxation by the Bank of Japan, domestic in-terest rates are expected to hike. Meanwhile, the Japanese economy con-tinues to be strong enough to maintain office space demand at a steady level and to drag up office rental standards. Consequently, the real estate investment market is expected to continue to expand, according to com-mentators in a number of newspapers and magazines.
Clearly, robust development of the real estate investment market requires that appropriate insurance coverage should be arranged for investment properties. We believe that many foreign reinsurers will be reading this re-port. We look forward to your support for insurance coverage for invest-ment properties.
5 Trends in Japan’s non-life insurance industry
Underwriting & Planning DepartmentThe Toa Reinsurance Company, Limited
1. Industry Trends
It is generally accepted that the market reorganization of the non-life insurance industry, which commenced with the deregulation of premium rates in 1998, settled down in October 2004 when Tokio Marine Insurance merged with Nichido Fire Insurance. In May 2006, Millea Holdings, the parent group of Tokio Marine & Nichido Fire, announced that it would acquire Nisshin Fire Insurance as a wholly owned subsidiary company.
This development further intensified the trend toward oligopoly in the market, whereby the insurance premium revenue of the major five companies accounted for approximately 80% of the industry’s total premium income. These mergers and acquisitions opened up the possibility of a new reorganization movement being initiated at some point in the future, driven primarily by the major non-life insurance companies seeking further market share expansion by leveraging economies of scale.
There is virtually no likelihood that premium income from the domestic non-life insurance industry market will grow significantly in the medium to long term, given Japan’s mature market and declining birthrate. In such circumstances, insurance companies plan to launch new products that address the changing social and economic environment.
They are also looking at introducing new solutions in response to the demand by companies for mitigation of information leak risk, in relation to the Act for Protection of Personal Data, which came into effect in April 2005.
New voluntary automobile insurance products are sufficiently well developed to offer a wide variety of services, with broad coverage. As individual companies seek to expand their respective shares of this mature market, we can expect competition in service and product development to become even more intense.
The lack of any prospect of significant growth in the domestic market over the foreseeable future is motivating the non-life insurance companies to accelerate the expansion of their business activities into countries that have been experiencing remarkable economic growth in recent years, such as from Southeast Asia and BRIC. We have seen Tokio Marine &
(1) Market Reorganization
(2) Domestic Market Trend
(3) Acceleration of Business Expansion into Overseas Markets
31
April 2005
April 2005
April 2005
July 2005
October 2005
December 2005
January 2006
January 2006
April 2006
June 2005
December 2005
April 2005
July 2005
April 2006
Establishment of Moscow representative Office
Acquisition of License for Insurance Business in Saudi Arabia
Purchase of Real Seguros (Brazil) and Real Vida e Previdencia (Brazil)
Establishment of Moscow representative Office
Establishment of St. Petersburg representative Office
Capital Injection into Tianan (China)
Capital Increase for Tokio Millennium Re (Bermuda)
Acquisition of License for Takaful in Malaysia
Purchase of Asia General Holdings (Singapore)
Establishment of Overseas Affiliate Company in Dalian (China)
Establishment of Moscow representative Office
Tokio Marine & Nichido Fire Insurance
Sompo Japan Insurance
Mitsui Sumitomo Insurance
Aioi Insurance
October 2005
Merger of Tokio Marine Newa Insurance (Taiwan) with Newa Insurance (Taiwan)
Adoption of Holding Company System for Overseas Business
Establishment of Moscow representative Office and St. Petersburg representative Office
Purchase of Mingtai Insurance (Taiwan)
32
Nichido Fire Insurance embark on a program of successive mergers and investments in Brazil, China and Singapore. Meanwhile, Mitsui Sumitomo Insurance founded holding companies in foreign countries as part of its overseas business. Thus, the major non-life insurance companies are gearing toward overseas markets with an eye to long- and medium-term growth.
The following table shows recent major overseas business expansion activities by four companies:
○1 BancassuranceSecond only to non-life insurance agencies, bancassurance has become a major distribution channel for long-term fire insurances as a result of the prohibition on such selling by means of this channel having been lifted. As a result, it is predicted that complete removal of the prohibition on selling major products, including voluntary automobile insurances, will have a significant impact on the distribution channels of all non-life insurance companies.
Since April 2001 when the restriction on banks selling insurance products by means of bancassurance was lifted, the number of saleable insurance products in the market has steadily increased. However, out of concern about high-pressure sales toward the banks’ loan customers and about making sales without sufficient advance explanation of the
(4) Trends in sales channels and product development
risks involved, the two years from December 2005 were designated as a monitoring period. If a serious problem were to occur in the relationships with customers during this period, the prohibition could be postponed. Thus, the schedule for the removal of the prohibition has not been precisely fixed.
The following table shows the schedule for the removal of the prohibition against bancassurance:
○2 Expansion of the Medical Care Insurance MarketThe medical care insurance market has been expanding steadily as a result of growing concern about the risks of higher medical fees in post-retirement years. This is driven partly by the increased average life span of the Japanese population and also because of uncertainty about the future shape of the medical care system. Because sales of medical care insurances were originally licensed only to foreign-financed com-panies, they pioneered the market before the prohibition on sales in the domestic market was lifted in 2001. Since the domestic medical care insurance market is one of the very few growing markets, new products are currently being launched in rapid succession by life and non-life in-surance companies.
In Japan, we have insurance business, for underwriting insurances for an unspecified majority, and co-operative business, for trading with specified customers, operating under the same structure.
There has been no governing law for co-operative business, which is simi-lar to insurance business in terms of coverage, except for certain institu-tional co-operatives. Accordingly, a demand for regulation arose from the perspective of protecting customers.
In accordance with the revision to the Insurance Business Law enforced in April 2006, unlicensed co-operatives with more than 1,000 insureds were brought under the control of the Insurance Business Law.
The revised law newly defines a small-amount short-term insurance provid-
33
(5) Creation of a scheme for Small-amount Short-term Insurance providers
Month Products
April 2001
October 2002
December 2005
December 2007
(Plan)
Complete Removal of Prohibition Whole-of-Life Insurances, Term Insurances, Medical Care Insurances, Voluntary automobile Insurances and Others
Credit Life Insurances, Long-term Fire Insurances,Overseas Travelers’ Personal Accident insurances
Personal Pension Insurances,“Zaikei” savings (i.e. asset formation) Insurances,Individual Annuity Savings-type Personal Accident Insurance“Zaikei” savings Personal Accident Insurances
Single Premium Whole-of-Life Insurances, Single Premium Endowment Insurances, Savings-type Personal Accident Insurances, Savings-type Fire Insurances Personal Liability Insurances
( )
34
2. Financial Results for Fiscal Year 2005
3. Financial Year 2005 regulatory topics (1) Development of the rule for underwriting reserves and
outstanding loss reserves
er and requires unlicensed co-operatives either to become a licensed company, to transform into a small-amount short-term insurance provider, or to cease operating by March 2008.
The insurance amount and period for a small-amount short-term insurance provider are limited, and their ranges of saleable products are narrower than those of insurance companies. On the other hand, the minimum capi-tal is 10 million yen (compared to 1 billion yen in the case of an insurance company), which demonstrates that the threshold for market entry is rela-tively low. It is expected that there will be considerable market entry activi-ty by both unlicensed co-operatives and other industries.
The financial results of the 22 members of the General Insurance Associa-tion of Japan for fiscal year 2005 improved on a year-on-year basis, due to an increase in insurance premium revenue as a result of a general recov-ery in the economy which had not seen since FY 2003. The total ordinary income and after-tax income were pushed up because insurance pay-ments for natural disasters decreased from the previous year, when the number of typhoons reached a record-high, and also due to the fact that the expense ratio declined owing to the efforts made by each company to streamline operations and improve business efficiency. The total net premiums written increased by 73.5 billion yen (1.0%) to 7,485.4 billion yen from the previous year. The net premium written for vol-untary automobile insurance, which is one of the major products in the non-life insurance market, recovered to the level of the previous year after three straight years of declining sales since FY 2002. In addition to such signs that the decline was coming to an end for voluntary automobile insurance, sales increased overall for most products including fire insurance and per-sonal accident insurance. The total net losses decreased by 180.8 billion yen (4.1%) to 4,210.9 billion yen from the previous year, as there were no large-scale natural disasters as had occurred in the previous year. The total amount of underwriting and general administrative expenses de-creased by 29.2 billion yen (2.5%) to 1,142.6 billion yen on a year-on-year basis due to the cost reduction efforts made by each company. The ex-pense ratio declined by 0.5% to 32.1% from 32.6%, the seventh consecu-tive year a drop had been recorded. The underwriting profit/loss represented a profit of 15.9 billion yen, revers-ing the loss of 64 billion yen recorded in the previous year. Ordinary income, including investment income, increased by 74.5 billion yen to 483.6 billion yen, and the net income ended up at 306.3 billion yen, up 47.7 billion yen on a year-on-year basis.
Subsequent to the adoption of the underwriting reserve accumulation rule enforced in FY 2005 to ensure sufficient capacity to cover natural disaster risks, a new IBNR accumulation rule will be instituted in FY 2006. The
forthcoming revision will oblige non-life insurance companies to maintainan appropriate control of IBNR reserves based on more accurate calcula-tion.
It is expected that some companies will have to increase their IBNR re-serves in FY 2006 by way of the introduction of this new IBNR rule. In this situation, some of these companies began using the new reserving rule and increased their IBNR reserves ahead of schedule, in FY 2005.
In April 2006, the guidelines for supervision of insurance companies were revised, and the rules on the sale of insurance products were amended.
Under the new rules, insurance companies are required to properly explain their products to customers in product brochures so that there is no risk of customers being misled by irresponsible or inaccurate advertising. It is also mandatory to include in such brochures all important information that should be communicated prior to a sale, as well as cases in which an in-surance recovery may not be expected. Product explanation in such bro-chures must be clear and easy for customers to understand.
This is part of the Financial Services Agency’s policy to tighten the ac-countability regulations in respect of risks and products. This came about as a result of an increasing number of cases of inappropriate insurance payments and problems occurring in selling insurance products. In future, both the insurers or insurance agents and the insured will be required to sign a written confirmation in accordance with the new rules.
Previously, it was necessary for insurers to obtain a license in advance from the Financial Services Agency after reporting the calculation basis for net premiums and the loading, for premium price-setting as well as for the introduction of new insurance products. The rules were changed in April 2006 when the loading requirement was transferred from pre-certification to after-the-fact verification. Henceforth, insurance companies will be able to set the loading in a flexible manner, based on their own management decisions.
35
(2) Establishment of new rules for Insurance Product Sales
(3) Policy on Flexibility for loading

Miyagi-Oki Earthquake August 16, 2005 1.2
Name of Loss Date of Loss Claims incurred(billion yen)
(Source: The General Insurance Association of Japan)
Heavy rain / Typhoon No.14 65.8
Name of Loss Date of Loss Claims incurred(billion yen)
September 4 -September 7, 2005
4. Major natural disasters in FY 2005
36
(1) Earthquake
(2) Wind & Flood
The total amount of insurance claims from natural disasters in FY 2005 was less than that for FY 2004 when ten typhoons landed on Japan and two major earthquakes occurred.
The major claims caused by natural disasters in FY 2005 are illustrated below:
6 Trends in Japan,s life insurance industry
Life Underwriting & Planning DepartmentThe Toa Reinsurance Company, Limited
1. Life Insurance Company Trends
On the back of the revitalization of the entire life insurance industry due to a recovery in the stock market, the trend for mergers and acquisitions in the industry has settled down for the time being. Meanwhile, the trend in diversifying distribution channels has accelerated as a result of business and marketing alliances in the life Industry itself as well as across different industries. The major alliances which took place on or after April 2005 are as follows:
Dai-ichi Mutual Life and IBJ Leasing concluded a basic agreement in February 2006 for a business alliance that included the transfer of Dai-ichi Leasing Co., Ltd., a subsidiary company of Dai-ichi Mutual Life, to IBJ Leasing. Dai-ichi Mutual Life aims to further enhance its customer service level by marketing the financial services of IBJ Leasing Group to its customers, and to thus contribute to promoting the life insurance agency business by IBJ Leasing through the alliance.
Licensed by the FSA as an agent and sub-contractor for insurance business, Asahi Mutual Life became an insurance agent of Sonpo 24 and in January 2006 began marketing and selling motor insurance products on their behalf. Asahi Mutual Life intends to reinforce the range of its non-life insurance coverage and to develop its system to respond to widespread customer demand by marketing motor insurance products provided by Sonpo 24. Taking advantage of Asahi Mutual Life's sales force, Sonpo 24 aims to grow sales in its own-brand motor insurance products.
Licensed by the FSA as an agent and sub-contractor for insurance business, Asahi Mutual Life began selling AXA Life increasing-term life insurance products in October 2005. Asahi Mutual Life intends to develop and maintain customers from medium/small companies and to promote the sales of its own products to these customers by marketing the increasing-term life insurance products provided by AXA Life, for which there is growing demand from such companies. Taking advantage of Asahi Mutual Life's sales force, AXA Life aims to further grow the sales of said products.
Licensed by the FSA as an agent and sub-contractor for insurance
(1) Business Alliance between Dai-ichi Mutual Life Insurance Company and IBJ Leasing Co., Ltd.
(2) Marketing Alliance between Asahi Mutual Life Insurance Company and Sonpo 24 Insurance Co., Ltd.
(3) Marketing Alliance between Asahi Mutual Life Insurance Company and AXA Life Insurance Co., Ltd.
37
(4) Marketing Alliance between Mitsui Life Insurance Co., Ltd. and AXA Life Insurance Co., Ltd.
2. Life insurers: trends in business performance
business, Mitsui Life reached an agreement with AXA Life and began selling long-term personal accident insurance policies in August 2005. Mitsui Life markets long-term personal accident insurance policies, which are employee benefit plans developed by AXA Life, through the distribution channel for its own business lines. This is because Mitsui Life aims to reinforce the range of classes of business which it handles to respond to demand from medium/small companies. In order to establish a sound procedure and a prompt supply of services to customers, Mitsui Life is developing an efficient sales and operation system through the active use of the AXA Life's agent support distribution network, which is the basic infrastructure of their operations. The two companies intend to promote the mutual supply of insurance products.
The financial results of the 38 life insurance companies for FY 2005 are as follows:
● Total Amount of New ContractsThe total amount of new contracts for individual insurance in FY 2005 decreased overall by 11.4% to JPY 80,739 billion from the previous fiscal year, due to the decrease in demand for mortality type products. While the business of major companies remained sluggish, some medium/small life insurance companies as well as the subsidiaries of non-life insurance companies made a strong sales showing. As a result of the favorable results from bancassurance, the total amount of new contracts for individual annuity insurance ended at JPY 8,803 billion, up 16.4% on a year-on-year basis.
● Total Amount of Insurance Contracts in ForceThe total amount of individual insurance contracts in force as of the end of FY 2005 was about JPY 1,070 trillion, which was a modest decrease of 3.7% from the previous fiscal year, owing to the decrease in the number of surrenders and lapses. On the other hand, the total amount of individual annuity insurance contracts in force exceeded JPY 80 trillion, up 8.5% on a year-on-year basis, due to a strong showing in sales. This was the third straight year of increase. The total amount of group insurance contracts in force remained at nearly the same level as the previous fiscal year at about JPY 380 trillion, down 0.5% on a year-on-year basis.
● Amount of Annualized PremiumsThe total amount of annualized premiums* for individual insurance business and individual annuity insurance business reached JPY 2,247 billion, up 10.1% on a year-on-year basis, owing to favorable sales of third-sector insurance products such as medical care insurance business as well as individual annuity insurance business. In-force business produced a stable result reaching JPY 18,614 billion, up 3.8% on a year-on-year basis. * Annualized Premiums : This is an index which shows premium income
of a life insurance company obtained in one year from in-force contracts as of the end of the fiscal year, assuming that insurance
38
premiums are paid equally during the period of insurance with both premium payment periods and methods equalized. This index was newly introduced because it is difficult to show sales performance of medical care and individual annuity insurance by means of the total amount of insurance in force or that of new contracts, as the amount of coverage for such insurance products are relatively small compared with mortality type products.
● Premium RevenuesPremium revenues increased overall by 5.0% to JPY 29,242 billion, due to the favorable business outcomes of individual annuity insurance and third-sector insurance products such as medical care insurance, although the sales of mortality type products continued to be sluggish. As a result, premium revenues have increased for three consecutive years. Although foreign oriented life insurance companies used to have an edge in third-sector insurance, domestic major companies have launched new living benefit type products in rapid succession on the back of slump in sales of mortality type products, which indicates that the market will be more competitive.
● Asset ManagementWhile interest rates remained low during FY 2005, the dividend income generated from stocks as well as other investment income increased on the back of a recovering stock market, and retained earnings were also further increased. The positive upturn in the stock market had a significant impact on the total assets of life insurance companies in the aggregate, which reached JPY 206.9 trillion, after increasing for three consecutive years to finally recover the JPY 200 trillion mark. Major life insurance companies have raised the level of dividends to policyholders of individual insurance contracts. Furthermore, some of them boosted the expected interest rates for single-payment-type products for the first time in 21 years. There have thus been more positive moves to return profits to policyholders.
The total value of individual insurance policies in force decreased for the ninth consecutive year as of the end of FY 2005. The insurance market for mortality risk is still experiencing difficulties. At the same time, third-sector insurances, including medical care insurance, remain strong on the back of a declining birthrate and a growing proportion of elderly people, and there is fierce competition between the life and the non-life insurance sectors. There has been a steady increase in sales of variable annuity insurance and other foreign-currency products with high returns expected, and these are mainly distributed by bancassurance.
As a general trend, there is polarization in the market toward products providing broad coverage on the one hand, and those offering low cost or simple benefit plans on the other. The major line-ups of medical care insurance products launched during FY 2005 were as follows: Mitsui Life launched a medical care product, MENU-X, which mainly covers hospital
39
(1) Medical Care Insurance
3. Market Trend
stays due to stress related diseases. The Prudential Life Insurance Company, Ltd. developed a product that covers surgical insurance benefits for bone-marrow extraction from donors. In connection with the launch of this product, the Insurance Business Law was partly revised. AIG Edison Life Insurance Co., Ltd. developed a new cancer product that pays a lump-sum benefit on an ascending scale of one to five according to the type of cancer involved, including intraepithelial cancers and leukemic diseases. The group medical care insurance product introduced by American Life Insurance Company, Japan covers a one-day hospital stay, and is an industry 'first'.
Many variable annuity insurance products are sold by means of bancassurance, mainly by foreign oriented life insurance companies. Tokio Marine & Nichido Financial Life Insurance Co., Ltd. launched a new product with the following feature: When a policy is issued, a performance goal is set and the fund is automatically transferred from a separate account to a general account at the point when the goal is attained. Asset management by a general account guarantees a certain expected interest rate regardless of its actual performance, while a separate account provides its policyholders with the investment profit which is directly connected with its actual performance. It is available to secure results achieved by investment, because when the agreed target is reached, the accumulated fund is transferred to certain annuities. Mitsui Sumitomo Met Life Insurance Co., Ltd. introduced a new product for which a investment with separate account is available during annuity payment. Hartford Life Insurance K.K. released a product in which periodic dividends payments (special refunds) can start one year after inception date.
Nippon Life Insurance Company and Tokio Marine & Nichido Life Insurance Co., Ltd. launched US dollar-based whole-life insurance products for bancassurance. US dollar-based insurance is expected to yield higher levels of interest compared with those that are Japanese yen-based, although there is a risk of an exchange loss caused by the sharp fall of the dollar. American Life Insurance Company, Japan introduced a US dollar-based, cash-value life insurance product that refunds the cumulative premiums at the time of death or at maturity. Aioi Life Insurance Co., Ltd. released a US dollar-based individual annuity insurance product, in which a single premium is paid on a Japanese yen basis and the benefit is received on a US dollar basis.
Sumitomo Life Insurance Co.'s Senkyakubanrai is a new type of product that involves a simple, five-point questionnaire. It is available to those currently undergoing medical treatment or those that have previously received medical treatment. Tokio Marine & Nichido Life Insurance Co., Ltd. launched a long-term personal accident insurance product that only requires one's occupation to be disclosed. This aims to provide a total
40
(2) Variable Annuity Insurance
(3) Foreign-Currency Products
(4) Other Products
4. Third-sector Insurance Underwriting Reserve: Legal Regulations
employee benefit plan in combination with 401k.
Rapid aging of the population resulting from the falling birthrate has progressed, as demonstrated by the first total population decrease since World War II. Under such circumstances, the number of new contracts has declined. The reason for this phenomenon is because demand for mortality risk insurance has decreased due to the decrease in the birthrate while demand for living benefit type insurance has increased. On the other hand, the market for third-sector insurance (life insurances relating to personal accident, specific diseases and nursing care, positioned between “first-sector” life insurance, and “second-sector” property & casualty insurance) has been rapidly expanded by life and non-life insurance companies due to the overall growing demand for such insurance.
Consequently, the expected incidence rates used to calculate both premiums and the underwriting reserve have diversified in parallel with product diversification due to the fierce competition seen in product development.
Third-sector products are mainly long-term, for example whole-life insurances, which involve a higher risk of uncertainty because they are susceptible to changes in demographics, the death rate or the illness rate, as well as breakthroughs in medical technology, and alterations to public medical care systems.
With a view to maintaining appropriate premium rates and underwriting reserves for third-sector insurance, the Financial Services Agency established a study team in collaboration with the private sector in 2005 which delivered its findings in June 2005. It was subsequently announced that a revision to “The Enforcement Regulations of The Insurance Business Law” would be introduced, based on feedback of public comments in March 2006.
[Summary of Revision to the Law]The revision to the cabinet office regulations comprises the following three pillars which are aimed at enhancing the solvency margin for third-sector insurance:
① Stress Test & Liability Adequacy Test (Notification and Guidelines for Supervision)Maintain sufficient funding of underwriting reserves by checking that the expected incidence rates for third-sector insurances duly cover the risks. ● Contracts: All third-sector insurances excluding those products for
which the period is less than one year, personal accident insurance, and others that provide equivalent benefits.
● Contract Category & Test Period: 10 years by contract category for the same basic assumptions
● Frequency of Risk: Conduct a test using a risk frequency that covers
41
(1) Enforcement of the Rules on Underwriting Reserve Funding
99% of the incidence rates, depending on the actual conditions for each company
● Timing: Conduct a test in April 2007. Trial test will be conducted by each company as of FY 2006.
② Disclosure (Enforcement Regulations of the Insurance Business Law & Guidelines for Supervision)Disclosure of the implementation of stress tests and liability adequacy tests
③ Off-Site Monitoring by the Financial Services AgencyConduct periodic monitoring of trends in contracts by class of business and profit-earning ratio as well as loss ratio, and use the data as a basis for requesting insurance companies to implement appropriate actions.
① Ensuring Right to Change assumed rates (Enforcement Regulations of the Insurance Business Law & Guidelines for Supervision)Clarify the operational rules for the right to change the expected mortality rate, expected interest rate and expected expense rate in preparation for any possible deterioration in the loss ratio
② Reinforcement of the Functions of Chief Actuaries (Enforcement Regulations of the Insurance Business Law, Notification and Guidelines for Supervision)Liability adequacy test for third-sector insurances was newly added to the verification requirements of chief actuaries. Submission of a statement of actuarial opinion became mandatory in applications for the acquisition of product licenses.
③ Ensuring the Appropriateness of Reinsurance (Enforcement Regulation of the Insurance Business Law & Guidelines for Supervision)Disclosure of reinsurance utilization became mandatory for the reduction of risk in long-term third-sector insurances through purchasing reinsurance.
① Added a contingency reserve (non-life insurances: catastrophe loss reserve) for third-sector insurances newly funded as a result of stress tests on solvency margin volume
② Added a risk volume for stress tests to the insurance risk volume (non-life insurances: ordinary insurance risk volume) for the calculation of solvency margin ratios.
In the insurance market-place itself, it is understood that the development of new products including the revision of insurance premium rates has been further accelerated as a result of changes in both the demographic structure and the profit structure (disclosure of mortality profit, profit loading and interest surplus), the establishment and permission of small-
42
(2) Reinforcement of Risk Management
(3) Ensuring an Appropriate Solvency Margin Ratio (Enforcement Regulations of the Insurance Business Law & Notification)
5. Underwriting Reserve Funding Rule for Variable Annuity Insurances
amount short-term insurance providers and complete approval of bancassurance. Insurance companies are seeking to improve convenience for customers, and promote business activities which enhance their claims paying ability by increasing the underwriting reserve in order to respond to the reinforced monitoring by the Financial Services Agency.
In April 2005, the Financial Services Agency enforced the underwriting reserve funding rule for life insurance companies, related to the minimum guarantee risk for variable annuity insurances.
The rule can be summarized as follows:
① For variable annuity insurances with minimum guarantees, the reserve is required to fund the standard underwriting reserve appropriately.
② Besides ① above, the reserve is also required to fund the contingency reserve III (minimum guarantee risk). Types of reserve include contingency reserve I (insurance risk), contingency reserve II (risk of expected interest rate) and contingency reserve III.
The minimum guarantee risk (R7) shall be added to the risk volume for the purpose of calculating the solvency margin ratio. Calculation of the minimum guarantee risk (R7) can be carried out by the standard method or an alternative method. This is a risk caused by an unexpected asset value change in separate account. The risk volume on the basis of standard method is the minimum standard required for covering risks that have an incidence of approximately 90%.
Aggregate Risk for Life Insurance Companies = [(R1)2+(R2+R3+R7)2]1/2+ R4
R1: Insurance RiskR2: Expected Interest Rate RiskR3: Asset Management RiskR4: Business Administration RiskR7: Minimum Guarantee Risk
Under the new rule, life insurance companies that offer variable annuity insurance products with minimum guarantees are required to further fund an underwriting reserve. They plan and implement various measures represented by the use of reinsurance, strengthening their capital base, a revision of variable annuity products, and also by reviewing marketing strategies.
43
(1) Underwriting Reserve
(2) Solvency Margin Ratio
6. Unregulated Co-operatives and Revision of the Insurance Business Law
The Insurance Business Law provides regulation for nonexclusive customers. Unregulated co-operatives, which provide co-operative products (similar to insurance products) to exclusive customers are not controlled by a specific law. Therefore, this area has been identified as being problematic from the perspectives of business soundness and policyholders' protection.
In consideration of the above, a revision to the Insurance Business Law came into force on April 1, 2006. Co-operatives not controlled under a specific law came under regulation by the Insurance Business Law, generating a new form of company called a small-amount short-term insurance provider. It is expected that there will be considerable market entry activity by both unlicensed co-operatives and other industries.Following a two-year transitional period, a provider of co-operative products that is not controlled under a specific law is required to run its business either as an insurance company or as a small-amount short-term insurance provider.
Compared with insurance companies, the available products and asset management methods are limited to small-amount short-term insurance providers, although the requirements for starting a business and the minimum capital requirement are not unduly stringent. Regulations on underwriting reserves and solvency margin standards equate to those on other insurance companies are imposed upon them.The major products that can be handled by small-amount short-term insurance providers are as follows:
Local-community co-operatives, intra-corporate co-operatives and labor-union co-operatives were excluded from the definition of insurance business under the Insurance Business Law. Small-scale co-operatives involving 1,000 members or less were also excluded.
As of the end of FY 2004, the total amount of insurance in force under the “Kampo”, postal life insurance service managed by Japan Post, the successor institution of the Japan Postal Services Agency, reached about 178 trillion yen. This is an extremely large amount in comparison with the total amount of individual insurance in force under life insurance companies in Japan, which was about 1,112 trillion yen.
44
7. Privatization of Postal Life Insurance Service
Non-life Insurances 2 years
Life Insurances and Medical Care Insurances 1 year
Insurance Type
Ceiling of Insurance PeriodInsurance Period
(Ceiling)
Death or total permanent disability due to Disease 3 million yen
Non-life Insurances 10 million yen
Hospital Stay Benefits for Treatment of Disease or Injury 0.8 million yen
Death or total permanent disability due to Injury 6 million yen
Insurance Category
Upper Limit of Insurance AmountInsurance Amount
(Upper Limit)
8. The Life Insurance Association of Japan "The Guideline for Receiving Appropriate Notification from Policyholders" and "The Approaches to Establish Appropriate Claims Payment Management System"
Together with the postal mail services and the postal savings services, postal insurance services have been managed by the Japan Postal Services Agency as a state-managed service. These services have played a significant role in the institutional infrastructure that supports the development of Japan's economy and society. However, a law for the privatization of the postal insurance services was enacted in October 2005, in response to changes in the social and economic environment, with the aim of improving creativity and efficiency in its operations as well as offering more diverse and higher-quality services. The privatization of Japan Post is scheduled to be finally completed in 2007, following a transitional period.
Upon completion of privatization, a new postal life insurance company will commence business in accordance with the Insurance Business Law and other general financial regulations, in the same manner as other private life insurance companies. As with other private companies, the new postal life insurance company will have a tax-paying obligation, and will join the Life Insurance Policyholders Protection Corporation of Japan because government guarantees will no longer be applied to new contracts.In the meantime, another new company will be established to take over existing postal insurance contracts and the equivalent asset accounts as a partial replacement for the Japan Post. Management and operation of the former national accounts will be entrusted to the new postal life insurance company.
In June 2005, The Life Insurance Association of Japan issued voluntary guidelines for industry, “The Guideline for Receiving Appropriate Notification from Policyholders”, and “The Instructions for Asserting Invalidity of Insurance Contract due to Fraud or Misrepresentation”. In recent years, the procedures for insurance contracts and payments have become more varied in line with the diversification of insurance products. Thus, it is necessary to win policyholders' understanding regarding the significance and importance of notification about insurance contracts. “The Guideline for Receiving Appropriate Notification from Policyholders” was prepared in response to such requirement. “The Instructions for Asserting Invalidity of Insurance Contract due to Fraud or Misrepresentation” specify in a prudent manner the concerns and cautions, together with the models to which the rule of invalidity of insurance contracts due to fraud or misrepresentation is applied. However, because disclosure may induce certain moral risks (such as the abuse of insurance), the details are not disclosed to the public. The guideline clearly specifies the requirements for the proper application of the invalidity of an insurance contract due to fraud and an explanation to customers in the course of insurance sales.
In February 2006, the Life Insurance Association of Japan prepared measures for the establishment of an appropriate claims payment system, as follows:(1) Voluntary industry guidelines for the proper processing of insurance
claims payment(2) Measures for consolidating and enhancing the complaint response
45

system of the Life Insurance Association of Japan(3) Measures for reinforcing the functions of the arbitration board
Based on these strategies, life insurance companies are determined to continue implementing proper measures.
Bancassurance is now gradually being allowed and the complete clear-ance of bancassurance is planned by the end of FY 2007 (see table be-low). Formerly, major life insurance companies expressed concerns about banks taking advantage of their standing to make high-pressure sales to their loan customers. However, the major life insurance companies laun-ched bancassurance as a new distribution channel on the back of meas-ures to avoid the negative effects of such sales, which were implemented as sales regulations to loan customers in July 2005. As shown by the fa-vorable sales of individual annuity insurances by bancassurance after the removal of the prohibition in October 2002, insurance companies are seek-ing to further reinforce their strategies for this channel. However, while they are able to establish a completely new distribution channel in the form of bancassurance, insurance companies are concerned about the negative impact on existing channels such as their sales staffs and agencies. Re-cently, distribution channels were further diversified, as insurance agent shops as well as internet based insurance sales have become available alongside bancassurance.
46
9. Bancassurance
April 2001
October 2002
December 2005
By the End of 2007 (Plan)
Credit Life Insurances for Mortgage Loan
Individual Annuity Insurances and "Zaikei" savings Insurances
Single Premium Endowment Insurances and Single Premium Whole Life Insurances
Complete Approval of Bancassurance (Plan)
Bancassurance Sales in Japan (Life Insurance Products)

47
Su
pp
lem
enta
l dat
a: R
esu
lts
of
Jap
anes
e lis
ted
no
n-l
ife in
sura
nce
co
mp
anie
s fo
r fi
scal
200
5, e
nd
ed M
arch
31,
200
6
(Uni
t: M
illio
ns o
f Yen
, %)
Sou
rces
: Eac
h co
mp
any'
s b
rief a
nnou
ncem
ent o
f the
Fin
anci
al S
tate
men
ts o
f FY
2005
.
FY
2005
FY
2005
FY
2005
FY
2005
FY
2005
FY
2005
FY
2005
FY
2005
FY
2005
FY
2005
FY
2005
FY20
04
FY20
04
FY20
04
FY20
04
FY20
04
FY20
04
FY20
04
FY20
04
FY20
04
FY20
04
FY20
04
1,89
2,75
4
1,07
7,63
2
34,6
02
166,
080
122,
180
10,8
14,7
96
60.6
30.2
2.06
3.44
1,07
6.6
1,88
3,33
2
1,12
2,84
7
9,55
1
175,
280
96,8
57
9,30
6,28
1
63.4
31.4
1.94
3.88
968.
2
1,37
0,92
0
776,
042
24,0
60
114,
288
67,8
58
5,93
4,76
1
61.3
30.3
2.33
3.42
1,13
0.9
1,35
1,91
5
813,
096
16,4
64
74,2
36
56,8
98
5,15
7,08
0
64.8
30.9
2.09
2.72
1,07
0.9
1,33
2,83
7
740,
036
5,34
3
115,
489
64,8
42
7,53
7,44
3
59.9
30.9
2.70
3.38
1,11
5.4
1,31
4,33
2
783,
710
(13,
923)
79,3
86
60,7
65
6,58
0,69
4
63.8
31.2
2.23
3.24
1,02
6.0
834,
284
488,
046
1,94
9
24,9
04
19,7
50
2,76
1,11
6
62.7
33.1
2.09
2.34
1,05
8.7
827,
807
498,
969
(9,9
24)
22,3
94
16,1
32
2,56
9,11
3
64.6
33.2
1.95
2.67
951.
9
708,
319
409,
007
1,10
8
26,7
98
13,2
73
3,47
7,78
7
62.7
35.7
1.99
2.31
1,05
6.5
722,
858
428,
819
(35,
962)
22,5
34
14,5
59
3,20
2,96
2
64.5
34.4
1.80
3.67
1,01
5.9
321,
786
177,
379
(12,
942)
11,7
70
7,33
3
1,35
0,42
6
59.7
32.5
2.40
4.14
1,15
5.2
321,
827
199,
453
(17,
023)
10,7
80
5,04
4
1,21
1,71
9
66.8
33.5
2.07
4.53
1,23
7.8
295,
407
160,
461
836
11,5
99
7,51
2
1,07
7,49
2
59.4
34.8
2.47
2.53
833.
2
295,
788
165,
993
3,76
4
14,9
21
7,01
4
1,03
7,26
6
60.9
34.6
2.12
2.38
799.
1
144,
620
78,1
26
(2,4
96)
5,35
9
2,94
3
517,
768
59.0
36.5
1.94
3.03
1,13
2.5
144,
962
84,5
29
1,79
3
5,25
4
2,65
9
493,
070
63.4
35.9
1.70
1.94
1,11
0.9
111,
660
79,5
30
(21,
970)
5,97
0
3,33
3
489,
457
71.2
27.8
2.71
12.1
7
777.
0
102,
909
73,4
26
(5,0
00)
3,90
1
3,03
8
408,
152
71.3
31.1
2.01
4.17
698.
7
Net
Pre
miu
ms
Wri
tten
Net
Cla
ims
Pai
d
Un
der
wri
tin
g P
rofi
t (L
oss
)
Ord
inar
y P
rofi
t (L
oss
)
Net
Pro
fit
(Lo
ss) f
or
the
year
Tota
l Ass
ets
Rat
io 1
Lo
ss R
atio
(%
)
Rat
io 2
Exp
ense
Rat
io (
%)
Rat
io 3
Yie
ld o
n In
vest
men
ts (I
nco
me)
(%)
Rat
io 4
Yie
ld o
n In
vest
men
ts(R
ealis
ed G
ain
s / L
oss
es) (%
)
Rat
io 5
So
lven
cy M
arg
in R
atio
(%
)
Toki
o M
arin
e&
Nic
hid
oS
OM
PO
JA
PAN
Mit
sui
Su
mit
om
oA
ioi
NIP
PO
NK
OA
NIS
SA
Y D
OW
AF
uji
Nis
shin
Toa
Re
The Toa Reinsurance Company, Limited6, Kanda-Surugadai 3-chome, Chiyoda-ku, Tokyo 101-8703, Japan
http://www.toare.co.jp
Printed in Japan on recycled paper with soy ink
PRINTED WITH
SOY INKTM