Embed Size (px)
Citation preview

MAXIMUS INC ( MMS )
10−KAnnual report pursuant to section 13 and 15(d)Filed on 11/19/2010 Filed Period 9/30/2010
Table of Contents
UNITED STATESSECURITIES AND EXCHANGE COMMISSION
Washington, D.C. 20549
FORM 10−KANNUAL REPORT PURSUANT TO SECTION 13 OR 15(d) OF
THE SECURITIES EXCHANGE ACT OF 1934
For the fiscal year ended September 30, 2010
Commission file number: 1−12997
MAXIMUS, INC.(Exact name of registrant as specified in its charter)
VIRGINIA(State or other jurisdiction of incorporation or organization)
54−1000588(I.R.S. Employer Identification No.)
11419 Sunset Hills Road, Reston, Virginia(Address of principal executive offices)
20190(Zip Code)
Registrant’s telephone number, including area code: (703) 251−8500
Securities registered pursuant to Section 12(b) of the Act:
Title of each class Name of each exchange on which registeredCommon Stock, no par value New York Stock Exchange
Securities registered pursuant to Section 12(g) of the Act: None
Indicate by check mark if the registrant is a well−known seasoned issuer, as defined in Rule 405 of the Securities Act. Yes x No o
Indicate by check mark if the registrant is not required to file reports pursuant to Section 13 or Section 15(d) of the Act. Yes o No x
Indicate by check mark whether the registrant (1) has filed all reports required to be filed by Section 13 or 15(d) of the Securities Exchange Act of1934 during the preceding 12 months (or for such shorter period that the registrant was required to file such reports), and (2) has been subject to such filingrequirements for the past 90 days. Yes x No o
Indicate by check mark whether the registrant has submitted electronically and posted on its corporate Web site, if any, every Interactive Data Filerequired to be submitted and posted pursuant to Rule 405 of Regulation S−T (§232.405 of this chapter) during the preceding 12 months (or for such shorterperiod that the registrant was required to submit and post such files). Yes£ No£
Indicate by check mark if disclosure of delinquent filers pursuant to Item 405 of Regulation S−K is not contained herein, and will not be contained, tothe best of registrant’s knowledge, in definitive proxy or information statements incorporated by reference in Part III of this Form 10−K or any amendmentto this Form 10−K. o
Indicate by check mark whether the registrant is a large accelerated filer, an accelerated filer, or a non−accelerated filer. See definition of “acceleratedfiler and large accelerated filer” in Rule 12b−2 of the Exchange Act. (Check one):
Large accelerated filer x Accelerated filer o
Non−accelerated filer o(Do not check if a smaller reporting company)
Smaller reporting company o
Indicate by check mark whether the registrant is a shell company (as defined in Rule 12b−2 of the Act). Yes o No x
The aggregate market value of outstanding voting stock held by non−affiliates of the registrant as of March 31, 2010 was $925,056,016 based on thelast reported sale price of the registrant’s Common Stock on The New York Stock Exchange as of the close of business on that day.
There were 17,210,381 shares of the registrant’s Common Stock outstanding as of November 1, 2010.
DOCUMENTS INCORPORATED BY REFERENCE
Portions of the registrant’s definitive Proxy Statement for its 2011 Annual Meeting of Shareholders to be held on March 18, 2011, which definitiveProxy Statement will be filed with the Securities and Exchange Commission not later than 120 days after the end of the registrant’s fiscal year, areincorporated by reference into Part III of this Form 10−K.

Table of Contents
MAXIMUS, Inc.Form 10−K
September 30, 2010
Table of Contents
PART I 3ITEM 1. Business 3ITEM 1A. Risk Factors 11ITEM 2. Properties 11ITEM 3. Legal Proceedings 12PART II 13ITEM 5. Market for Registrant's Common Equity, Related Stockholder Matters and Issuer Purchases of Equity Securities 13ITEM 6. Selected Financial Data 15ITEM 7. Management's Discussion and Analysis of Financial Condition and Results of Operation 17ITEM 7A. Quantitative and Qualitative Disclosures About Market Risk 29ITEM 8. Financial Statements and Supplementary Data 30ITEM 9. Changes in and Disagreements with Accountants on Accounting and Financial Disclosure 59ITEM 9A. Controls and Procedures 59PART III 61ITEM 10. Directors, Executive Officers and Corporate Governance 61ITEM 11. Executive Compensation 61ITEM 12. Security Ownership of Certain Beneficial Owners and Management and Related Stockholder Matters 61ITEM 13. Certain Relationships and Related Transactions, and Director Independence 61ITEM 14. Principal Accounting Fees and Services 61PART IV 62ITEM 15. Exhibits, Financial Statement Schedules 62
2

Table of Contents
PART I
ITEM 1. Business.
General
We provide business process outsourcing services to government health and human services agencies under our mission of Helping GovernmentServe the People.® Our business is primarily focused on administering government−sponsored programs such as Medicaid, the Children’s Health InsuranceProgram (CHIP), health care reform, welfare−to−work, Medicare, child support enforcement and other government programs. Founded in 1975, we are oneof the largest pure−play health and human services administrative providers to governments in the United States, Australia, Canada and the UnitedKingdom. We use our expertise, innovative business processes and advanced technological solutions to help government agencies run efficient,cost−effective programs and to improve program accountability, while enhancing the quality of services provided to beneficiaries.
Our core health and human services business has benefited from steady demand over the last five years. We have not experienced any materialadverse change in demand as a result of government budgetary pressures. We believe the critical nature of our services in helping governments provide andadminister important safety net programs in the United States, such as Medicaid, welfare−to−work and CHIP, to the most vulnerable populations helpsinsulate our services from significant downward pressure, particularly during an economic downturn. We also administer several internationalgovernment−sponsored health and human services programs, most notably welfare−to−work, to help people find employment and achieve self−sufficiencyin Australia and the United Kingdom. Favorable legislation and austerity measures that seek to help governments run more efficiently and cost effectivelywill continue to create demand for our core services.
During fiscal 2010, the Company acquired DeltaWare, an eHealth business in Canada, and sold the non−strategic ERP business unit. In fiscal2008, MAXIMUS acquired a workforce services business in the United Kingdom and divested five non−core business units. These transactions weredesigned to allow the Company to better focus on its core health and human services businesses, as well as expand our geographic presence and enhance ourservice offerings through complementary acquisitions. For more details on these transactions, see “Note 3. Acquisition” and “Note 21. DiscontinuedOperations” within Item 8 of this Form 10−K.
For the fiscal year ended September 30, 2010, we had revenue from continuing operations of $831.7 million and net income from continuingoperations of $69.4 million.
Market Overview
We expect that demand for our core health and human services offerings will continue to increase driven by new legislation, austerity measuresand increasing caseloads as governments strive to deliver more services with fewer resources. New legislation such as the Affordable Care Act (ACA) in theUnited States and welfare reform initiatives abroad has created increased demand for our services and should continue to create increased demand for ourservices over the next several years. We believe that we remain well−positioned to benefit from this increasing demand as governments look for ways toimprove overall program efficiency and achieve value for funds spent on social programs.
Demand for our services is contingent upon factors that affect government, including:
• The need for state governments, which run federally mandated and federally funded programs such as Medicaid and CHIP, to deliver efficient,cost−effective services to program beneficiaries while meeting requirements to maintain federal matching funds.
• The requirement of state governments to implement federal initiatives, such as the ACA (health care reform), which will expand health insurancecoverage to millions of Americans.
• The impact of continued budgetary pressures, which compels governments to operate more programs with the same level of resources and/or implementausterity measures as a method to address rising costs associated with social benefits programs.
• The need to improve business processes, innovate, and update technology. In the United States, governments are likely to seek outside sources as theyface the possibility of an increasing number of government workers eligible for retirement, coupled with the stovepipe systems and antiquated processes thatcannot scale effectively to support projected caseload growth.
3

Table of Contents
As a result, governments utilize business process outsourcing companies, such as MAXIMUS, to help them deliver efficient, cost−effectiveservices to beneficiaries on their behalf. MAXIMUS possesses the knowledge and resources to efficiently operate government health and human programsand maintain requirements to achieve the maximum ongoing federal funding. With the ability to tightly balance resources with demand, MAXIMUS alsooffer flexibility and scalability that governments do not always possess.
Health Services Market Environment
Over the past decade, health care costs have substantially risen in the United States, a trend likely to continue over the long term. U.S. health carespending, among the highest of all industrialized countries, is increasing at a rate that outpaces inflation and national income growth. Stemming these costsas well as improving quality and access to health care is a major policy priority for government.
As a result, in March 2010, Congress passed the Affordable Care Act (ACA), a comprehensive overhaul of the health insurance system in theUnited States that initially seeks to expand beneficiaries’ access to health care, while ultimately improving quality and reducing overall costs of health caredelivery. Most notably, ACA aims to expand health insurance coverage to over 30 million Americans in 2014 and beyond, primarily by expanding theMedicaid program through federal matching funds to cover more low−income individuals and families. In the interim, state fiscal realities have alsoprompted the expansion of Medicaid managed care to new populations — including the aged, blind and disabled populations — that have historically beenserved through fee−for−service Medicaid. Although these populations represent only 30% of the Medicaid population, they are responsible forapproximately 70% of the costs. We believe we are well−positioned to benefit from the expected volume increases associated with Medicaid expansion dueto our existing client base of states where we serve as the administrative enrollment vendor for 13 Medicaid managed care programs, which is 64% of themarket served by third party administrators. ACA also extends CHIP through 2019, provides increased matching federal funds, and guarantees fundingthrough 2015. We currently serve as the administrative vendor for CHIP in five states, which comprises approximately 68% of the market served by thirdparty administrators.
The law also promotes the integration of new health insurance exchanges with existing state Medicaid and CHIP programs to provide for “nowrong door” of entry for program beneficiaries. A health insurance exchange isan insurance marketplace where individuals and small businesses can shop,compare and buy affordable and qualified health benefit plans. As a consequence, and in light of persistent budget pressures, state priorities now include themodernization of eligibility and enrollment processes for public health insurance programs such as Medicaid and CHIP. The goal of these modernizationefforts is to improve access to health insurance for beneficiaries by simplifying and streamlining the eligibility and enrollment process, and allow for theseamless movement of subsidized populations among the various programs. We are currently supporting efforts in Colorado and New York to modernizetheir eligibility and enrollment processes for their subsidized health insurance programs. These programs may serve as the model as these states seek to setup their health insurance exchange to meet the ACA requirement of establishing an operational health insurance exchange by January 1, 2014. Many of thefunctions of a health insurance exchange are similar to the functions that we provide under Medicaid and CHIP: consumer outreach and education,eligibility and enrollment, customer contact centers, and comprehensive business process managed services to help beneficiaries navigate the new healthinsurance exchanges.
Other important features of ACA include funding for long−term care allowing states to offer home and community based services to elderly anddisabled individuals through Medicaid rather than institutional care in nursing homes. As the population continues to age there is an increasing demand forquality and cost effective, long−term care in the least restrictive environment.
ACA also includes enhanced consumer protections for health insurance appeals. The law requires an independent, evidence−based externalreview process and the option for individuals to appeal coverage determinations or claims to insurance companies. This expands the requirement to ERISAplans which previously were not required to have an objective independent health appeals process. We are one of the largest providers of evidence−basedhealth insurance appeals to Medicare and over 30 state agencies.
We believe the current health environment positions us to benefit from demand as governments must meet the requirements established underACA. We believe states may be challenged to achieve these requirements and, as a result, are turning to business process outsourcers such as MAXIMUS toprovide repeatable processes, proven solutions and consumer−friendly services. Overall, we expect the underlying demand for our services to increase dueto the fundamental need for governments to provide these services to beneficiaries on an expanding and ongoing basis.
4

Table of Contents
Human Services Market Environment
The Human Services market has experienced increased demand driven by the need for governments to reduce costs and improve efficiency. Themost dynamic portion of the market is in the welfare−to−work area where governments worldwide are seeking to model new welfare reforms after theWisconsin Works (W−2) program. Since 1997, we have provided welfare−to−work services in Wisconsin when the W−2 program was launched and wecontinue to serve as one of its vendor agencies today. W−2 is considered to be one of the most ambitious and comprehensive welfare reform initiativesundertaken and is credited with breaking the cycle of poverty and beneficiaries remaining on welfare for life. The “Wisconsin Model” also paved the wayfor privatization of welfare−to−work programs and demanded accountability from its vendor partners through performance−based measures andemployment outcomes. This model, with which MAXIMUS has a substantial amount of knowledge and expertise, is being emulated around the world andprivatized, with MAXIMUS being a leading provider.
We believe we are well positioned to compete for these global welfare−to−work opportunities because of our established presence, strong brandrecognition and ability to achieve the requisite performance requirements and outcomes outlined in the new reform measures. We offer clients demonstratedresults and over twenty years of proven experience in administering welfare−to−work programs. MAXIMUS provides welfare−to−work services in severalstates and countries. In Australia, MAXIMUS is one of the largest and highest rated welfare−to−work providers where we operate 74 sites and 40 outreachlocations. We also have an established presence in the U.K.’s welfare−to−work market and presently provide employment and job training services underthe UK’s previous Flexible New Deal program which is planned to be consolidated into the new Work Programme. We believe reform initiatives coupledwith our experience, expertise and proven solutions will continue to drive demand for our welfare−to−work services.
In 2010, the United Kingdom’s coalition government unveiled an austerity program to reduce mounting debt. A key feature of the plan involvescomprehensive system−wide welfare reform, which is expected to yield a total savings of approximately £18 billion each year by 2014−2015. Under theDepartment of Work and Pensions (DWP), the welfare system overhaul will be complemented by the new Work Programme. The new Work Programmeconsolidates many of the U.K.’s disparate welfare−to−work programs — including the Flexible New Deal, Pathways to Work and Work Choice — into asingle back−to−work program. Eligible providers must bid onto the Buying Framework prior to bidding for the 11 regional lots. DWP expects to appointbetween three to eight organizations to each of the 11 regional lots and use the Buying Framework to identify organizations that have the capacity andexpertise to deliver not only the Work Programme, but other potential employment related support services contracts, including those that may attractEuropean Social Fund (ESF) support.
In addition to welfare reform, we have seen an increase in initiatives to utilize private firms for children’s services such as child supportenforcement. MAXIMUS currently provides services to the Family Maintenance Enforcement Program in British Columbia as well as several jurisdictions’throughout the United States including Shelby County, Tennessee, which was one of the largest child support privatization efforts in the United States.
As a result of measures to reduce costs and improve efficiency, coupled with our established presence, we believe we are well−positioned tobenefit from an increase in demand for our core human services business across several geographies.
Our Clients
Our primary customers are government agencies at the federal and state level and, to a lesser extent, at the county and municipal level. In theUnited States, while certain of our direct customers may be state governments, a significant amount of our revenue from states is ultimately provided by thefederal government in the form of cost sharing arrangements with the states, such as is the case with Medcaid programs. In fiscal 2010, approximately 59%of our total revenue was derived from state and local government agencies whose programs received significant federal funding, 27% from foreigngovernment agencies, 9% from U.S.−based federal government agencies, and 5% from other sources (such as municipal or commercial customers).
For the year ended September 30, 2010, we derived approximately 12% and 18% of our consolidated revenue from contracts with the States ofCalifornia and Texas, respectively, and 16% of our consolidated revenue from the Government of Australia.
5

Table of Contents
We typically contract with government clients under four primary contract types including performance based, cost plus, fixed fee for service,and time and materials. For the year ended September 30, 2010, 47% of our contracts were performance based, 29% were cost plus, 21% were fixed fee forservice, and 3% were time and materials.
Generally, the relationships with our clients are long−term multi−year contracts, subject to option years and periodic rebids. See below under“Backlog” for more details.
Our Business Segments
During the fourth quarter, the Company aligned its organization of the business to reflect its focus on the administration of government healthand human services programs. As a result of this organizational realignment, the Company has reclassified its segment financial information to reflect thetwo new operating segments of Health Services and Human Services. The results of the segments have been reclassified for all periods shown. For moreinformation concerning our segment presentation, including comparative revenue, gross profit, operating profit, identifiable assets and related financialinformation for the 2008, 2009 and 2010 fiscal years, see “Note 19. Business Segments” within Item 8 of this Form 10−K.
Health Services Segment
Our Health Services Segment generated 62% of our total revenue in fiscal 2010. The Health Services Segment provides a variety of businessprocess outsourcing (BPO) and administrative support services, as well as consulting services for state, provincial, and federal government programs, suchas: Medicaid, CHIP, SNAP (Supplemental Nutrition Assistance Program), Medicare and Health Insurance BC (British Columbia). The segment’s serviceshelp improve the efficiency, cost effectiveness, quality and accountability of government sponsored health benefit programs. Our BPO services are centeredon legislative initiatives and mandated programs such as the Affordable Care Act (Health Care Reform), Medicaid, CHIP, Medicare and Long−term Care.In this segment, our BPO and consulting services include:
• Comprehensive government health insurance program administration• Health insurance program eligibility and enrollment services to improve access to health care for citizens and help beneficiaries make the best choice for
their health insurance coverage• Eligibility and enrollment modernization for government health benefit programs• Consumer outreach and education to support government health insurance programs and provide multi−channel self−service options, including
consumer friendly toll−free phone numbers, Websites and Web−based portals for easy enrollment• Application assistance and enrollment counseling to beneficiaries• Premium payment processing and administration such as invoicing and reconciliation• Multilingual customer contact centers• Objective, evidence−based health appeals• Comprehensive eHealth solutions with the Medigent® product suite• Independent medical reviews• Health plan oversight• Medicaid Management Information System (MMIS) planning and oversight• Specialized program consulting services
Human Services Segment
Our Human Services Segment generated 38% of our total revenue in fiscal 2010, with over half generated outside the United States, primarily inAustralia and the United Kingdom. The Human Services Segment provides a variety of administrative support and case management services for federal,national, state and county human services agencies including welfare−to−work programs, child support enforcement, higher education services and K−12special education services. Our services include:
• Comprehensive workforce services — including eligibility determination, case management, job−readiness preparation, job search and employeroutreach, job retention and career advancement, and selected educational and training services — to help disadvantaged individuals transition fromgovernment assistance programs to employment
• Full and specialized child support case management services, call center operations, and program and systems consulting services• Management tools and professional consulting services for higher education institutions• K−12 special education case management solutions
6

Table of Contents
• Program consulting services including independent verification and validation, cost allocation plans, and repeatable management services and otherspecialized consulting offerings
• Business and tax credit services for employers
Foreign Operations
The Company operates in the United States, Australia, Canada, the United Kingdom and Israel. The distribution of revenues and assets betweenthe United States, Australia and the rest of the world are included in “Note 19. Business Segments” within Item 8 of this Form 10−K.
Competitive Advantages
We offer a private sector alternative for the administration and management of critical government−funded health and human services programs.Our reputation and extensive experience over the last 35 years give us a competitive advantage as governments value the level of expertise and brandrecognition that MAXIMUS brings to its customers. The following are the competitive advantages that allow us to capitalize on various marketopportunities:
Proven track record and exceptional brand recognition. Since 1975, we have successfully assisted governments in delivering cost−effectiveservices to beneficiaries on government programs. We operate large−scale program management operations on behalf of government agencies, improvingthe quality of services provided to beneficiaries, which has further enhanced our brand recognition with government agencies.
Subject matter expertise. Our workforce includes many individuals who possess substantial subject matter expertise in areas critical to thesuccessful design, implementation, administration, and operation of government health and human services programs. Many of our employees have workedfor governments in management positions and are better able to understand and advance service capabilities that are of the most value, practical, andeffective for our clients.
Intellectual property that supports the administration of government programs. We have proprietary case management solutions to support ourhealth and human services business lines. By leveraging a common framework, MAXIMUS shortens, and sometimes eliminates, the development lifecycleto enable configuration for accelerated takeover of operations, providing clients with a significant amount of flexibility and support. By taking advantage ofa large number of shared technical and business components, we reduce development costs and deliver clients increased capabilities and efficiencies relatedto workflow, calendaring and action plan management. As a market−share leader in CHIP and enrollment Broker, our shared core infrastructure providesprice competitive advantages over other potential competitors. We have deployed these proven product solutions across several health and human servicesprojects for clients such as Pennsylvania, New York and the United Kingdom. We have also made investments in business process modeling and monitoringtools to further enhance our operational efficiency. These assets, when combined with our subject matter expertise offer clients significant advantages overpure service providers who depend on third−party software.
Financial strength. We maintain a strong balance sheet, generate consistent annual cash flow, and have minimal long−term debt. We possess thefinancial flexibility and sufficient cash on−hand to support client operations including ongoing technology investments and working capital for high−profilepublic health and human services programs.
Focused portfolio of services with a single−market emphasis. We are one of the largest publicly traded companies that provide a portfolio ofBPO health and human services specifically to government customers. Our government program expertise differentiates us from other firms and non−profitorganizations with limited resources and skill sets, as well as from large consulting firms that serve multiple industries but lack the focus necessary tomanage the complexities of pursuing opportunities and serving health and human services government agencies efficiently. Our focused portfolio offersclients a continuum of service capabilities from consulting engagements to component services to full−service solutions.
Established international presence. International governments are seeking to implement austerity measures as a means to improvegovernment−sponsored health and human services programs and contain costs. We have an established presence in Australia, Canada and the UnitedKingdom with a focus on delivering cost effective welfare−to−work and health insurance eligibility and enrollment services to beneficiaries on behalf ofgovernments.
Expertise in competitive bidding. Government agencies typically award contracts through a comprehensive, complex and competitive Requestsfor Proposals (RFPs) and bidding process. With over 35 years of experience in responding to RFPs, we have the necessary experience to navigategovernment procurement processes. We possess the expertise and experience to assess and allocate the appropriate resources necessary for successfulproject completion in accordance with contractual terms.
7

Table of Contents
Competition
The market for providing our services to government agencies can be competitive and subject to rapid change. However, given the specializednature of our services and the programs we serve, the market is difficult for new, unknown competitors. The complex nature of competitive bidding andrequired investment in subject−matter expertise, repeatable processes, and support infrastructure creates significant barriers to entry for potential newcompetitors unfamiliar with the nature of government procurement.
Our primary competitors in the Health Services Segment in the United States are ACS, a Xerox Company (ACS); EDS, an HP Company andspecialized private service providers. Our primary competitors in the Human Services Segment market include Serco, Atos Origin, private services andspecialized consulting companies and non−profit organizations.
Business Growth Strategy
Our goal is to enable future growth by remaining a leading provider of operations program management and consulting services to governmentagencies. The key components of our business growth strategy include the following:
• Pursue new domestic and international business opportunities and expand our customer base. With over 30 years of business expertise in thegovernment market, we continue to be a leader in developing innovative solutions to meet the evolving needs of government agencies. We seek to grow ourdomestic and international base business by leveraging our existing core capabilities and pursuing opportunities with new and current clients.
• Grow long−term, recurring revenue streams. We seek to enter into long−term relationships with clients to meet their ongoing and long−term businessobjectives. As a result, long−term contracts (three to five years with additional option years) are often the preferred method of delivery for customers andare also beneficial to the Company.
• Pursue strategic acquisitions. We will selectively identify and pursue strategic acquisitions. Acquisitions can provide us with a rapid, cost−effectivemethod to enhance our services, obtain additional skill sets, expand our customer base, cross−sell additional services, enhance our technical capabilities, andestablish or expand our geographic presence.
• Continue to optimize our current operations and drive innovation and quality to customers. MAXIMUS continues to seek efficiencies and optimizeoperations in order to achieve sustainable, profitable growth. We will continue to drive improved business process managed services to clients to improvecost effectiveness, program efficiency and overall program scalability as governments deal with rising demand and increasing caseloads.
• Recruit and retain highly skilled professionals. We continually strive to recruit motivated individuals including top managers from larger organizations,former government officials, and consultants experienced in our service areas. We believe we can continue to attract and retain experienced personnel bycapitalizing on our single−market focus and our reputation as a premier government services provider.
• Focus on core health and human services business lines. We have focused our core business offerings around delivering business process managedservices to government health and human services agencies. Our sharpened focus and established presence positions us to benefit from Health Care Reformin the United States and Welfare Reform initiatives abroad.
See Exhibit 99.1 of this Annual Report on Form 10−K under the caption “Special Considerations and Risk Factors” for information on risks anduncertainties that could affect our business growth strategy.
8

Table of Contents
Marketing and Sales
We generate new business opportunities by establishing and maintaining relationships with key government officials, policy makers and decisionmakers to understand the evolving needs of government agencies as they seek to optimize their programs. We have a team of business developmentprofessionals who ensure that we understand the needs, requirements, legislative initiatives, and priorities of our current and prospective customers. Inconjunction with our subject matter experts and marketing consultants, our business development professionals create and identify new businessopportunities and ensure that we proactively introduce our solutions and services early in the procurement cycle. As part of the procurement, we respond tocompetitive requests for bids through the government procurement process.
Legislative Initiatives
MAXIMUS actively monitors legislative initiatives and responds to opportunities as they develop. Over the past several years, legislativeinitiatives created new growth opportunities and potential markets for MAXIMUS. Legislation passed in the United States and in the United Kingdom havelarge public policy implications for all levels of government and present viable business opportunities in the health and human services arena. MAXIMUS iswell−positioned to meet the operations program management and consulting needs resulting from legislative actions and subsequent regulatory and programimplementation efforts.
Some recent legislative initiatives that have created new growth opportunities for us in the government market include the following:
Affordable Care Act. In March 2010, the United States enacted comprehensive health care reform, known as the Affordable Care Act (ACA).This new law expands access to health coverage to more than 30 million Americans, protects consumer rights, controls health care costs, and improves theoverall health care delivery system over the course of the next four years and beyond. Many components of the ACA will require states to pass legislationand create program regulations. The law presents several business opportunities for MAXIMUS to offer our expertise in the administration of publicprograms, including:
• Establishment of Exchanges, insurance marketplaces where individuals and small businesses can buy affordable and qualified health benefit plans.• Expansion of Medicaid where states will receive federal matching funds to cover more low−income individuals and families.• Extension of CHIP through 2019 and the extension of funding through 2015, which is two additional years beyond the Children’s Health Insurance
Program Reauthorization Act (CHIPRA) of 2009 .• Modernization of eligibility and enrollment processes for public health insurance programs.• Development of consumer−friendly education and outreach materials, including easy−to−use Websites, so beneficiaries with varying literacy levels can
compare options and select the appropriate health insurance coverage.• Funding for long−term care allowing states to offer home and community based services to elderly and disabled individuals through Medicaid rather
than institutional care in nursing homes.• Creation of Pre−Existing Condition Insurance Plans (PCIP) to provide health coverage to individuals, who have been denied health insurance by private
insurance companies because of a pre−existing condition, through high risk pools.• Consumer protection through an external review process and the option for individuals to appeal coverage determinations or claims to insurance
companies.• Implementation of eHealth requirements for a secure, confidential and electronic exchange of health information.
Education, Jobs and Medical Assistance Act.Signed into law in August 2010, this act extends the 6.2% increase in theFederal MedicalAssistance Percentage (FMAP) set by the American Recovery and Reinvestment Act (ARRA) through June 30, 2011. The passage of this bill has bothpreserved and expanded Medicaid potential business for MAXIMUS.
Children’s Health Insurance Program Reauthorization Act (CHIPRA). CHIPRA was signed into law on February 2, 2009, extending the previousSCHIP program. As part of the Affordable Care Act of 2010 (ACA), CHIP has been extended through 2019 and funding has been extended through 2015,which is two additional years beyond the original CHIPRA Act. By expanding state options to find and enroll eligible children through “express laneeligibility” and “auto enrollment,” CHIPRA has presented MAXIMUS with an opportunity to expand our partnerships with states for the administration ofCHIP programs.
9

Table of Contents
Work Programme in the United Kingdom. The Work Programme, part of the new Coalition government’s austerity and debt reduction measures,is a new government−sponsored welfare−to−work model that consolidates several existing employment programs into a single comprehensiveback−to−work program in an effort to achieve higher quality, longer−term and sustainable employment outcomes for job seekers in the United Kingdom.MAXIMUS previously performed work under the Flexible New Deal. In 2010, the Department of Work and Pensions notified all FND vendors and vendorsunder several other welfare−to−work programs that all current contracts will expire on June 30, 2011 and that vendors may bid for a spot on a contractvehicle called the Buying Framework for the new Work Programme. Vendors who successfully bid to be a qualified vendor on the Buying Framework willthen be eligible to bid for the estimated 11 regions throughout the United Kingdom, where it is expected that these 11 regions will be served by three toeight vendor organizations in each region.
American Recovery and Reinvestment Act of 2009 (ARRA).ARRA provides states with opportunities to accelerate the adoption of healthinformation technology under the Health Information Technology for Economic and Clinical Health (HITECH) provisions. ARRA also contains anexpansion of HIPAA (Health Information Portability and Accountability Act) rules beyond “covered entities” to include business associates of coveredentities. These provisions provide MAXIMUS with business opportunities in the health information technology and eHealth market.
Deficit Reduction Act of 2005 (DRA). Enacted in the spring of 2006, the DRA reauthorized the TANF program of 1996 through 2010. OnSeptember 30, 2010, a TANF block grant was signed as part of a continuing resolution that extends government funding of programs through December 3,2010. The DRA includes a number of key health and human service issues important to the MAXIMUS core health and human service businesses in theUnited States. The DRA requires states to engage more TANF cases in productive activities to find employment in order to achieve self−sufficiency, as wellas establish and maintain work participation rates and verification procedures. The DRA also provides states with additional flexibility to make reforms totheir Medicaid programs.
Backlog
At September 30, 2010, we estimated that we had approximately $2.1 billion of revenue in backlog. Backlog represents an estimate of theremaining future revenue from existing signed contracts and revenue from contracts that have been awarded, but not yet signed. Our backlog estimateincludes revenue expected under the current terms of executed contracts and revenue from contracts in which the scope and duration of the services requiredare not definite but estimable (such as performance− based contracts), but does not assume any contract renewals.
Increases in backlog result from the awarding of new contracts or the extension or renewal of existing contracts and option periods. Reductionscome from fulfilling contracts and early termination of contracts. Increases and decreases can follow from changes in estimates.
Our contracts typically contain provisions permitting government customers to terminate the contract on short notice, with or without cause. Thebacklog associated with our performance−based contracts are generally estimates based upon management experience of case loads and similar transactionvolume from which actual results may vary.
We believe that period−to−period backlog comparisons are difficult and do not necessarily accurately reflect future revenue we may receive. Theactual timing of revenue receipts, if any, on projects included in backlog could change for any of the aforementioned reasons. The dollar amount by segmentof our backlog as of September 30, 2009 and 2010, were as follows:
As ofSeptember 30,
2009 2010(In millions)
Health Services $ 1,050 $ 1,515Human Services 750 $ 585Total $ 1,800 $ 2,100
The Company’s BPO businesses typically involve contracts covering a number of years. At September 30, 2010, the average weighted life ofthese contracts was in excess of five years, including options. Although the exercise of options is uncertain, we believe the incumbent enjoys significantadvantages. The longevity of these contracts assists management in predicting revenues, operating income and cash flows. The Company expectsapproximately 41% of the backlog balance to be recognized in fiscal 2011 and expects backlog, in addition to anticipated option period renewals, torepresent 97% of estimated 2011 revenues.
10

Table of Contents
Seasonal Nature of Business
We may experience seasonality in our business particularly in our fourth fiscal quarter as a result of tax credit work in the Human ServicesSegment. In addition, the summer and winter holiday vacations can impact the financial results for all of our segments. Specifically, reductions in workingdays due to holidays and vacations may impact our sales and accounts receivable, primarily in our first fiscal quarter.
Employees
As of September 30, 2010, we had 6,834 employees, consisting of 4,470 employees in the Health Services Segment, 2,187 employees in theHuman Services Segment and 177 corporate administrative employees. Our success depends in large part on attracting, retaining, and motivating talented,innovative, and experienced professionals at all levels.
As of September 30, 2010, 343 of our employees in Canada were covered under three different collective bargaining agreements, each of whichhas different components and requirements. There are 184 employees covered by the MAXIMUS BC Health Benefits Operations, Inc. collective bargainingagreement with the British Columbia Government and Services Employees’ Union (“BCGEU”). Within our subsidiary Themis Program Management andConsulting Limited, we have two agreements. Under the first agreement, 148 employees are covered by a collective bargaining agreement with the BCGEUand, under the second agreement, 11 employees are covered by a collective bargaining agreement with the Professional Employees Association (“PEA”).These collective bargaining agreements expire on March 31, 2011.
As of September 30, 2010, 1,019 of our employees in Australia were covered under a Collective Agreement, which is similar in form to acollective bargaining agreement. The Collective Agreement is renewed annually.
None of our other employees are covered under any such agreement. We consider our relations with our employees to be good.
Website Access to U.S. Securities and Exchange Commission Reports
Our Internet address is http://www.maximus.com and includes access to our corporate governance materials and our code of business conduct andethics. Through our website, we make available, free of charge, access to all reports filed with the U.S. Securities and Exchange Commission (SEC)including our Annual Reports on Form 10−K, our Quarterly Reports on Form 10−Q, our Current Reports on Form 8−K, Section 16 filings by our officersand directors, as well as amendments to these reports, as filed with or furnished to the SEC pursuant to Section 13(a) or 15(d) of the Securities ExchangeAct of 1934, after we electronically file such material with, or furnish it to, the SEC. Copies of any materials we file with, or furnish to, the SEC can also beobtained free of charge through the SEC’s website at http://www.sec.gov or at the SEC’s Public Reference Room at 100 F St., N.E., Washington, DC 20549.You may obtain information on the operation of the Public Reference Room by calling the SEC at 1−800−SEC−0330.
ITEM 1A. Risk Factors.
Our operations are subject to many risks that could adversely affect our future financial condition and performance and, therefore, the marketvalue of our securities. See Exhibit 99.1 of this Annual Report on Form 10−K under the caption “Special Considerations and Risk Factors” for informationon risks and uncertainties that could affect our future financial condition and performance. The information in Exhibit 99.1 is incorporated by reference intothis Item 1A.
ITEM 2. Properties.
We own a 60,000 square foot office building in Reston, Virginia. We also lease offices for management and administrative functions inconnection with the performance of our services. At September 30, 2010, we leased 67 offices in the United States totaling approximately 1,055,000 squarefeet. In four countries outside the United States, we leased 113 offices containing approximately 430,000 square feet. The lease terms vary frommonth−to−month to seven−year leases and are generally at market rates.
We believe that our properties are maintained in good operating condition and are suitable and adequate for our purposes.
11

Table of Contents
ITEM 3. Legal Proceedings.
The Company is involved in various legal proceedings, including the matters described below, in the ordinary course of its business.
In March 2009, a state Medicaid agency asserted a claim against MAXIMUS in the amount of $2.3 million in connection with a contractMAXIMUS had through February 1, 2009 to provide Medicaid administrative claiming services to school districts in the state. MAXIMUS entered intoseparate agreements with the school districts under which MAXIMUS helped the districts prepare and submit claims to the state Medicaid agency which, inturn, submitted claims for reimbursement to the Federal government. No legal action has been initiated. The state has asserted that its agreement withMAXIMUS requires the Company to reimburse the state for the amounts owed to the Federal government. However, the Company’s agreements with theschool districts require them to reimburse MAXIMUS for such payments and therefore MAXIMUS believes the school districts are responsible for anyamounts disallowed by the state Medicaid agency or the Federal government. Accordingly, the Company believes its exposure in this matter is limited to itsfees associated with this work and that the school districts will be responsible for the remainder. During the second quarter of fiscal 2009, MAXIMUSrecorded a $0.7 million reduction of revenue reflecting the fees it earned under the contract. MAXIMUS has exited the Federal healthcare claiming businessand no longer provides the services at issue in this matter.
In August 2010 the Company received a draft audit report prepared on behalf of one of its former SchoolMAX customers. The SchoolMAXbusiness line was sold as part of the divestiture of the MAXIMUS Education Systems division in 2008. The draft audit report recommends a refund ofapproximately $11.6 million primarily arising out of the alleged failure of MAXIMUS and the buyer of the division to observe the most favored customerpricing term of the contract. MAXIMUS believes the audit report is incorrect and that no amounts are owed as a refund. The Company is working with thecustomer to resolve this matter before the audit report is finalized. To the extent that a resolution is not reached, MAXIMUS will contest the matter throughthe dispute resolution process set forth in the contract.
12

Table of Contents
PART II
ITEM 5. Market for Registrant’s Common Equity, Related Stockholder Matters and Issuer Purchases of Equity Securities.
Our common stock trades on the New York Stock Exchange under the symbol “MMS.” The following table sets forth, for the fiscal periodsindicated, the range of high and low sales prices for our common stock and the cash dividends per share declared on the common stock.
Price RangeHigh Low Dividends
Year Ended September 30, 2009:First Quarter $ 37.02 $ 25.94 $ 0.10Second Quarter 40.93 32.78 0.12Third Quarter 43.61 37.27 0.12Fourth Quarter 48.49 39.10 0.12Year Ended September 30, 2010:First Quarter $ 51.28 $ 43.41 $ 0.12Second Quarter 62.01 47.57 0.12Third Quarter 65.21 57.00 0.12Fourth Quarter 62.25 53.52 0.12
As of October 31, 2010, there were 63 holders of record of our outstanding common stock. The number of holders of record is not representativeof the number of beneficial owners due to the fact that many shares are held by depositories, brokers, or nominees. We estimate there are approximately11,075 beneficial owners of our common stock.
We declared quarterly cash dividends on our common stock at the rate of $0.10 per share beginning with the quarter ended March 31, 2005,increasing the rate to $0.12 per share beginning with the period ended March 31, 2009. We expect to continue our policy of paying regular cash dividends,although there is no assurance as to future dividends. Future cash dividends, if any, will be paid at the discretion of our Board of Directors and will depend,among other things, upon our future operations and earnings, capital requirements and surplus, general financial condition, contractual restrictions and suchother factors as our Board of Directors may deem relevant.
The following table sets forth the information required regarding repurchases of common stock that we made during the three months endedSeptember 30, 2010:
Period
TotalNumber of
SharesPurchased
AveragePrice Paidper Share
Total Number ofShares Purchased as
Part of PubliclyAnnounced Plans (1)
Approximate DollarValue of Shares that
May Yet BePurchased
Under the Plan(in thousands)
Jul. 1, 2010 — Jul. 31, 2010 40,000 $ 57.23 40,000 $ 36,116
Aug. 1, 2010 — Aug 31, 2010 239,752 56.35 239,752 $ 23,813
Sep. 1, 2010 — Sep. 30, 2010 28,235 56.46 28,235 $ 122,755
Total 307,987 $ 56.48 307,987
(1) Under a resolution adopted on July 22, 2008, which rescinds and supersedes all previous resolutions, the Board of Directors has authorized therepurchase, at management’s discretion, of up to an aggregate of $75.0 million of the Company’s common stock. The resolution also authorized the use ofoption exercise proceeds for the repurchase of the Company’s common stock. In September 2010, a further board resolution increased the authorizedpurchases by an additional $100 million. The Board of Directors has not set an expiration date for this authorized repurchase.
13

Table of Contents
Stock Performance Graph
The following graph compares the cumulative total shareholder return on our common stock for the five−year period from September 30, 2005 toSeptember 30, 2010, with the cumulative total return for the NYSE Stock Market (U.S. Companies) Index and a peer group comprising Accenture, CGI,Hewlett Packard, IBM and Xerox. The peer group companies represent a mix of information technology, outsourcing and management consultancybusinesses and reflect a cross section of businesses against whom the Company competes for business and executive talent. The peer group is weighted bymarket capitalization. In prior years, the cumulative shareholder return of our stock has been compared with the NYSE/AMEX/NASDAQ Stocks (SIC8740−8749 U.S. Companies) Management and Public Relations Services Index. As MAXIMUS has divested a number of businesses, the index is no longerseen as an appropriate gauge against which to monitor the Company’s performance. It has been included below for reference. This graph assumes theinvestment of $100 on September 30, 2005 in our common stock, the NYSE Stock Market (U.S. Companies) Index, our peer group and theNYSE/AMEX/NASDAQ Stocks (SIC 8740−8749 U.S. Companies) Management and Public Relations Services Index and assumes dividends arereinvested.
Comparison of Five—Year Cumulative Total ReturnsPerformance Graph for
MAXIMUS, INC.
Notes:
A. The lines represent index levels derived from compounded daily returns that include all dividends.
B. The indexes are reweighted daily, using the market capitalization on the previous trading day.
C. If the monthly interval, based on the fiscal year−end, is not a trading day, the preceding trading day is used.
D. The index level for all series was set to $100.0 on 09/30/2005.
Prepared by Zacks Investment Research, Inc. Copyright 1960−2010 CRSP Center for Research in Security Prices, Graduate School of Business,University of Chicago. Used with permission. All rights reserved.
14

Table of Contents
ITEM 6. Selected Financial Data.
We have derived the selected consolidated financial data presented below, as adjusted for discontinued operations, from our consolidatedfinancial statements and the related notes. The revenue and operating results related to the acquisition of companies using the purchase accounting methodare included from the respective acquisition dates. The selected financial data should be read in conjunction with “Management’s Discussion and Analysisof Financial Condition and Results of Operations” included as Item 7 of this Annual Report on Form 10−K and with the Consolidated Financial Statementsand related Notes included as Item 8 of this Annual Report on Form 10−K. The historical results set forth in this Item 6 are not necessarily indicative of theresults of operations to be expected in the future.
Year Ended September 30,2006 2007 2008 2009 2010
(In thousands, except per share data)Statement of Operations Data:Revenue $ 557,974 $ 584,586 $ 699,552 $ 720,108 $ 831,749Legal and settlement expense (recovery), net (1) 9,394 44,438 38,358 (4,271) (5,351)Write−off of deferred contract costs (2) 17,109 — — — —Gain on sale of building (3) — — 3,938 — —Operating income (loss) from continuing operations (13,590) (7,146) 46,028 88,589 107,406Income (loss) from continuing operations (4,053) (10,954) 29,462 53,841 69,397Income (loss) from discontinued operations (4) 6,513 2,699 (22,785) (7,301) 1,012Net income (loss) (5) $ 2,460 $ (8,255) $ 6,677 $ 46,540 $ 70,409Basic Earnings (loss) per share:Income (loss) from continuing operations $ (0.19) $ (0.50) $ 1.55 $ 3.06 $ 3.99Income (loss) from discontinued operations 0.30 0.12 (1.20) (0.41) 0.05Basic earnings (loss) per share $ 0.11 $ (0.38) $ 0.35 $ 2.65 $ 4.04Diluted Earnings (loss) per share:Income (loss) from continuing operations $ (0.19) $ (0.50) $ 1.53 $ 3.01 $ 3.86Income (loss) from discontinued operations 0.30 0.12 (1.18) (0.41) 0.06Diluted earnings (loss) per share $ 0.11 $ (0.38) $ 0.35 $ 2.60 $ 3.92Weighted average shares outstanding:Basic 21,465 21,870 19,060 17,570 17,413Diluted 21,465 21,870 19,305 17,886 17,965Cash dividends per share of common stock $ 0.40 $ 0.40 $ 0.40 $ 0.46 $ 0.48
15

Table of Contents
At September 30,2006 2007 2008 2009 2010
(In thousands)Balance Sheet Data:Cash, cash equivalents, and marketable securities $ 156,860 $ 196,682 $ 119,605 $ 87,815 $ 155,321Working capital 254,811 267,145 149,966 164,646 191,461Total assets 558,501 564,464 454,954 433,234 527,741Long−term debt, including capital lease obligations 2,044 417 — — 1,411Total shareholders’ equity 404,899 409,400 275,706 297,128 338,789
(1) Legal and settlement expense (recovery), net consists of costs, net of reimbursed insurance claims, related to significant legal settlements andnon−routine legal matters, including future probable legal costs estimated to be incurred in connection with those matters. Legal expenses incurred in theordinary course of business are included in selling, general and administrative expense. See “Note 17. Legal and Settlement Expense (Recovery), Net” toour consolidated financial statements for additional information.
(2) During the quarter ended June 30, 2006, we determined that the estimated undiscounted cash flows associated with the Texas Integrated Eligibilityproject over its remaining term were insufficient to recover the project’s deferred contract costs. As a result, we recognized a non−cash impairment chargeof $17.1 million to write off the full unamortized balance of the project’s deferred contract costs.
(3) During the year ended September 30, 2008, the Company sold a 21,000 square foot administrative building in McLean, Virginia and recognized apre−tax gain on the sale of $3.9 million. This gain has been classified as a gain on sale of building in the consolidated statement of operations. See “Note 22.Sale of Building” to our consolidated financial statements for additional information.
(4) On September 30, 2010, the Company sold its ERP division for cash proceeds of $5.6 million, net of transaction costs of $0.7 million, andrecognized a pre−tax loss on sale of less than $0.1 million. The Company previously recorded a pre−tax loss on sale of $1.3 million in fiscal 2009. Incompleting this sale, the Company elected to retain a single contract that had previously been included within the ERP division. This contract hadidentifiable cash flows and requires MAXIMUS to provide services which are dissimilar to other projects within the ERP division. The retained contract hasbeen transferred to another business division within continuing operations. The results of this contract have been included in continuing operations for allthe periods shown above. See “Note 21. Discontinued Operations” to our consolidated financial statements for additional information.
(5) Under new accounting guidance effective since October 1, 2007, the Company has accounted for uncertain tax positions by recognizing the financialstatement effects of a tax position only when, based upon the technical merits, it is “more−likely−than−not” that the position will be sustained uponexamination. See “Note 18. Income Taxes” to our consolidated financial statements.
16

Table of Contents
ITEM 7. Management’s Discussion and Analysis of Financial Condition and Results of Operation.
The following discussion and analysis of financial condition and results of operations is provided to enhance the understanding of, and should beread in conjunction with, our Consolidated Financial Statements and the related Notes.
Forward−Looking Statements
Included in this Annual Report on Form 10−K are forward−looking statements within the meaning of the Private Securities Litigation ReformAct of 1995. These forward−looking statements are based on current expectations, estimates, forecasts and projections about our company, the industry inwhich we operate and other matters, as well as management’s beliefs and assumptions and other statements that are not historical facts. Words such as“anticipate,” “believe,” “could,” “expect,” “estimate,” “intend,” “may,” “opportunity,” “plan,” “potential,” “project,” “should,” and “will” and similarexpressions are intended to identify forward−looking statements and convey uncertainty of future events or outcomes. These statements are not guaranteesand involve risks, uncertainties and assumptions that are difficult to predict. Actual outcomes and results may differ materially from such forward− lookingstatements due to a number of factors, including without limitation, the factors set forth in Exhibit 99.1 of this Annual Report on Form 10−K under thecaption “Special Considerations and Risk Factors.” As a result of these and other factors, our past financial performance should not be relied on as anindication of future performance. Additionally, we caution investors not to place undue reliance on any forward−looking statements as these statementsspeak only as of the date when made. We undertake no obligation to publicly update or revise any forward−looking statements, whether resulting from newinformation, future events or otherwise.
Business Overview
We provide business process outsourcing services to government health and human services agencies under our mission of Helping GovernmentServe the People.® Our business is focused almost exclusively on administering government−sponsored programs such as Medicaid, the Children’s HealthInsurance Program (CHIP), health care reform, welfare−to−work, Medicare, child support enforcement and other government programs. Founded in 1975,we are one of the largest pure−play health and human services administrative providers to governments in the United States, Australia, Canada and theUnited Kingdom. We use our expertise, experience and advanced technological solutions to help government agencies run efficient, cost−effectiveprograms and to improve program accountability, while enhancing the quality of services provided to program beneficiaries.
During recent years, the Company has made a number of changes to the business to eliminate unprofitable lines of business, focus on theCompany’s core health and human services business, and put into place a risk management structure to enable focus on profitable growth. These steps haveincluded the expansion of the Company’s core business, both domestically and internationally, the divestiture of several non−core businesses during 2008and 2010, and the exit from an unprofitable contract in 2008, which resulted in a large legal and settlement expense in that year. The growth in 2010 in thewelfare−to−work business in Australia and the United Kingdom has increasingly made the company a global competitor. We believe the growth in revenuesand net income in these periods reflects the steps taken to improve the focus of this business.
During the fourth quarter, the Company aligned its organization of the business to reflect its focus on the administration of government healthand human services programs. As a result of this organizational realignment, the Company has reclassified its segment financial information to reflect thetwo new operating segments of Health Services and Human Services. All historical results have been recast to reflect the organization in its current form.See “Note 20. Quarterly Information” to our consolidated financial statements for our unaudited quarterly segment income statement data.
17

Table of Contents
Results of Operations
Consolidated
The following table sets forth, for the fiscal year ends indicated, selected statements of operations data:
Year ended September 30,2008 2009 2010
(dollars in thousands,except per share data)
Revenue $ 699,552 $ 720,108 $ 831,749Gross profit 190,891 191,346 220,833Selling, general and administrative expense 110,443 107,028 118,778Selling, general and administrative expense as a percentage of revenue 15.8% 14.9% 14.3%Gain on sale of building 3,938 — —Legal and settlement expense (recovery), net 38,358 (4,271) (5,351)Operating income from continuing operations 46,028 88,589 107,406Operating margin from continuing operations 6.6% 12.3% 12.9%Interest and other income, net 2,423 145 916Provision for income taxes 18,989 34,893 38,925Income (loss) from discontinued operations, net of income taxes (17,150) (5,734) 1,040Loss on disposal (5,635) (1,567) (28)Net income $ 6,677 $ 46,540 $ 70,409Basic Earnings (loss) per share:Income from continuing operations $ 1.55 $ 3.06 $ 3.99Income (loss) from discontinued operations (1.20) (0.41) 0.05Basic earnings per share $ 0.35 $ 2.65 $ 4.04Diluted Earnings (loss) per share:Income from continuing operations $ 1.53 $ 3.01 $ 3.86Income (loss) from discontinued operations (1.18) (0.41) 0.06Diluted earnings per share $ 0.35 $ 2.60 $ 3.92
We discuss constant currency revenue information to provide a framework for assessing how our business performed excluding the effect offoreign currency rate fluctuations. To provide this information, revenue from foreign operations is converted into United States dollars using averageexchange rates from the previous fiscal year.
We also discuss organic growth revenue information to provide a framework for assessing how the business performed excluding the effect ofbusiness combinations. To provide this information, revenue from recently−acquired entities is removed from the current and prior years with no full−yearcomparative revenues.
Both constant currency and organic growth revenue information are non−GAAP numbers. We believe that these numbers provide a useful basisfor assessing the Company’s performance. The presentation of these non−GAAP numbers is not meant to be considered in isolation, or as an alternative torevenue growth as a measure of performance.
Revenue increased 15.5% to $831.7 million for the year ended September 30, 2010, compared with the prior year. Organic growth wasresponsible for 14.5% of this growth. On a constant currency basis, the revenue growth would have been 11.2%.
The principal driver of growth was the Human Services Segment. See “Human Services Segment” below.
Revenue increased 2.9% to $720.1 million for the year ended September 30, 2009, compared with the prior year. Organic growth was responsiblefor 2.0% of this growth. On a constant currency basis, the revenue increase would have been 6.1%.
18

Table of Contents
The principal driver of growth for the 2009 fiscal year was strong results in our Health Services Segment. The Human Services Segment wasadversely affected by the strong United States Dollar, which was partially offset by the benefit of a full year of operations from the Company’s UKsubsidiary, which was acquired in the fourth quarter of fiscal 2008.
Selling, general and administrative expense (SG&A) consists of costs related to general management, marketing and administration. These costsinclude salaries, benefits, bid and proposal efforts, travel, recruiting, continuing education, employee training, non−chargeable labor costs, facilities costs,printing, reproduction, communications, equipment depreciation, intangible amortization, and legal expenses incurred in the ordinary course of business. Infiscal 2008, SG&A includes an additional charge of $2.2 million related to the under−estimation of stock option charges in 2006 and 2007. Without thisadjustment, SG&A expenses in that year as a percentage of revenue would have been 15.5%. In 2010, SG&A included a bad debt charge of $2.2 millionrelated to a long−term receivable balance. Without this charge, SG&A as a percentage of revenue would have been 14.0%. SG&A as a percentage ofrevenue has declined year−on−year for each of the last two years. This is the result of improved efficiencies within the business.
Operating income from continuing operations increased 21.2% in fiscal 2010 compared to fiscal 2009, from $88.6 million to $107.4 million.The increase of $18.8 million has been driven by growth in the business, the benefits of favorable exchange rates on foreign−sourced income, andincreasing economies of scale in operating the business.
Operating income from continuing operations increased 92% in fiscal 2009, compared to fiscal 2008, from $46.0 million to $88.6 million. Theincrease of $42.6 million is primarily attributable to a $4.3 million legal and settlement recovery in 2009 compared with a charge of $38.4 million in 2008.See the discussion of Legal and Settlement expense below for a breakdown of this balance. In addition, fiscal 2008 benefited from a non−recurring$3.9 million gain on the sale of a property in McLean, Virginia.
Legal and settlement expense (recovery), net for fiscal years 2008, 2009 and 2010 was $38.4 million, ($4.3 million), and ($5.4 million),respectively. Legal and settlement expense (recovery) consists of costs, net of reimbursed insurance claims, related to significant legal settlements andnon−routine legal matters, including future probable legal costs estimated to be incurred in connection with those matters. Legal expenses incurred in theordinary course of business are included in selling, general and administrative expense.
Following a change in accounting standards, from October 1, 2009 the incremental costs of acquisitions, including legal fees, brokerage fees, andvaluation reports, are included in this balance. Under previous accounting guidance, these expenses were included as part of the acquisition consideration ofsuccessful acquisitions. The following table sets forth the matters that represent legal and settlement expense (recovery), net:
Year ended September 30,2008 2009 2010
(Dollars in thousands)Acquisition expenses $ — $ — $ 254Accenture Arbitration, Related Settlement and Insurance
Recoveries, net 38,377 (6,300) (7,500)Other (19) 2,029 1,895Total $ 38,358 $ (4,271) $ 5,351
In December 2008, MAXIMUS, Accenture LLP and the Texas Health and Human Services Commission (“HHSC”) entered into an agreementsettling all claims among the parties arising from a prime contract between Accenture and HHSC for integrated eligibility services and a subcontractbetween MAXIMUS and Accenture in support of the prime contract. In connection with that settlement, MAXIMUS paid a total of $40.0 million andagreed to provide services to HHSC valued at an additional $10.0 million. The Company’s primary insurance carrier paid $12.5 million of the amount duefrom MAXIMUS at the time of the settlement. In fiscal 2009, the Company recovered an additional $6.3 million from one of its excess insurance carriers,and in fiscal 2010 the Company recovered $7.5 million from another excess insurance carrier.
The decrease in interest and other income between 2008 and 2010 is primarily attributable to declines in market rates. At the beginning of fiscal2008, the Company held a balance of cash and cash equivalents and marketable securities of $196.7 million. During the first quarter, $150 million was usedas part of a share buyback, significantly reducing the cash balance and the consequent interest income. At the current time, the Company holds cash andcash equivalents in excess of $150 million but is generating significantly lower returns on this balance due to the decline of market rates. Approximatelyhalf of the interest earned in 2010 relates to interest on the loan note related to the sale of Unison MAXIMUS Inc., discussed below under DiscontinuedOperations.
19

Table of Contents
Provisions for income taxes from continuing operations were 39.2%, 39.3%, and 35.9% in 2008, 2009 and 2010, respectively. The principalreason for the decline in the tax rate reflects the increasing amount of profit being recorded in foreign jurisdictions where income tax rates are lower thanthose within the United States of America. Certain non−recurring items, including adjustments to tax uncertainties and our operations in Israel, wereresponsible for a decline of 0.8% in the tax rate in 2010.
Health Services Segment
Year ended September 30,2008 2009 2010
(dollars in thousands)Revenue $ 465,660 $ 495,141 $ 514,258Gross profit 126,729 131,547 130,276Operating income 70,176 72,874 64,725Operating margin percentage 15.1% 14.7% 12.6%
The Health Services Segment provides a variety of business process outsourcing and administrative support services, as well as consultingservices for state, provincial and federal programs, such as Medicaid, CHIP, Medicare, and the British Columbia Health Insurance Program.
In fiscal 2010, revenue increased 3.9% compared to fiscal 2009 driven by the acquisition of DeltaWare in 2010, which accounted for 1.4% of thisgrowth, with the rest of the growth attributable to new work. Operating margin in 2010 was lower compared to fiscal 2009, principally due to the timing oncontract rebids and the expansion of lower−risk, cost−reimbursable programs, where margins are typically lower.
Revenue increased 6.3% to $495.1 million in fiscal 2009 compared with fiscal 2008, driven by new work. Operating margin in fiscal 2009 wasslightly lower compared to fiscal 2008, driven principally by the timing of contract rebids.
Human Services Segment
Year ended September 30,2008 2009 2010
(dollars in thousands)Revenue $ 233,892 $ 224,967 $ 317,491Gross profit 64,162 59,799 90,557Operating income 12,196 12,353 39,490Operating margin percentage 5.2% 5.5% 12.4%
The Human Services Segment includes a variety of business process outsourcing, case management, job training, and support services forprograms such as welfare−to−work programs, child support enforcement, K−12 special education, and other specialized consulting services.
Revenues increased 41.1% to $317.5 million in fiscal 2010 compared to fiscal 2009. The increase is primarily driven by program expansion inAustralia (which commenced in the fourth quarter of fiscal 2009) and new work in the United Kingdom (which commenced in the first quarter fiscal 2010).Operating margin improvement in fiscal 2010 compared to fiscal 2009 was driven by margin improvement attributed to revenue growth in Australia and theUnited Kingdom, with the results tempered by cost growth on a fixed price education contract in the United States.
Revenues decreased 3.8% to $225.0 million in fiscal 2009 compared to 2008. Revenue growth in Australia was offset by declines related to theCompany’s wind down of its Federal claiming business, which the Company formally exited in fiscal 2009. The Company had approximately $6.1 millionof acquired growth from the United Kingdom business acquired in 2008, offset by $15.0 million of decline caused by foreign exchange. Operating marginof 5.5% was consistent with an operating margin of 5.2% in fiscal 2008.
20

Table of Contents
Discontinued Operations
Enterprise Resource Planning (ERP)
On September 30, 2010, the Company sold its ERP division for cash proceeds of $5.6 million, net of transaction costs of $0.7 million, andrecognized a pre−tax loss on sale of less than $0.1 million. The Company previously recognized a pre−tax loss on sale of $1.3 million in fiscal 2009. Incompleting this sale, the Company elected to retain a single contract that had previously been included within the ERP division. This contract hadidentifiable cash flows and requires MAXIMUS to provide services which are dissimilar to other projects within the ERP division. The retained contract hasbeen transferred to another business division within the Health Services segment.
Security Solutions
On April 30, 2008, the Company sold its Security Solutions division for cash proceeds of $4.6 million, net of transaction costs of $0.4 million,and recognized a pre−tax gain on the sale of $2.9 million.
Unison MAXIMUS, Inc.
On May 2, 2008, the Company sold Unison MAXIMUS, Inc. for proceeds of $6.5 million. The sale transaction is structured as a sale of stock tothe management team of the subsidiary. The sale price of $6.5 million consists of $0.1 million in cash and $6.4 million in the form of a promissory notesecured by (1) a security interest in all of the assets of the former subsidiary; (2) a pledge of shares by the buyer; and (3) a personal guaranty by members ofthe management team who are shareholders of the buyer. The Company has deferred recognition of a pre−tax gain on the sale of $3.9 million, and interestincome on the promissory note, until realization is more fully assured. The deferred gain and deferred interest of $4.6 million and $4.5 million is reflected asa deduction from the note receivable on the consolidated balance sheets as of September 30, 2009 and 2010, respectively.
Justice Solutions, Education Systems and Asset Solutions
On September 30, 2008, the Company sold its Justice Solutions, Education Systems, and Asset Solutions divisions, which were previouslyreported as part of its Systems Segment. At that time, the Company recognized a pre−tax loss of $12.2 million, subject to adjustment for purchase priceadjustments and estimated transaction costs. During fiscal 2009, the Company reached a final settlement with the purchaser, resulting in a pre−tax gain of$0.7 million.
The following table summarizes the operating results of the discontinued operations included in the Consolidated Statements of Operations (inthousands):
Year Ended September 30,2008 2009 2010
(Dollars in thousands)Revenue $ 131,113 $ 29,393 $ 27,054Income (loss) from operations before income taxes $ (28,332) $ (9,478) $ 1,664Provision (benefit) for income taxes (11,182) (3,744) 624Income (loss) from discontinued operations $ (17,150) $ (5,734) $ 1,040Loss on disposal before income taxes $ (9,314) $ (686) $ (45)Provision (benefit) for income taxes (3,679) 881 (17)Loss on disposal $ (5,635) $ (1,567) $ (28)Income (loss) from discontinued operations $ (22,785) $ (7,301) $ 1,012
Quarterly Results
Set forth in “Note 20. Quarterly Information (unaudited)” to our consolidated financial statements (Item 8 of this Annual Report on Form 10−K)is selected income statement data for the eight quarters ended September 30, 2010. We derived this information from unaudited quarterly financialstatements that include, in the opinion of our management, all adjustments necessary for a fair presentation of the information for such periods. You shouldread this information in conjunction with the audited consolidated financial statements and notes thereto. Results of operations for any fiscal quarter are notnecessarily indicative of results for any future period.
21

Table of Contents
Our revenue and operating results are subject to significant variation from quarter to quarter depending on a number of factors, including:
• the progress of contracts;
• the revenue earned on contracts;
• the timing of revenue on license sales;
• the timing of revenue on performance−based contracts;
• the commencement and completion of contracts during any particular quarter;
• the schedule of government agencies for awarding contracts; and
• the term of each contract that we have been awarded.
Because a significant portion of our expenses are relatively fixed, successful contract performance and variation in the volume of activity as wellas in the number of contracts commenced or completed during any quarter may cause significant variations in operating results from quarter to quarter.Further, we have occasionally experienced a pattern in our results of operations pursuant to which we incur greater operating expenses during the start−upand early stages of significant contracts prior to receiving related revenue. Our quarterly results may fluctuate, causing a material adverse effect on ouroperating results and financial condition.
Obligations and Commitments
The following table summarizes our contractual obligations at September 30, 2010 that require the Company to make future cash payments (inthousands):
Payments due by period
Contractual Obligations TotalLess than
1 year 1−3 years 3−5 yearsMore than
5 years(Dollars in thousands)
Operating leases $ 74,894 $ 28,984 $ 30,102 $ 10,702 $ 5,106Long−term debt 1,411 — 176 282 953Acquisition−related contingent consideration(1) 3,061 923 2,138 — —Deferred compensation plan liabilities 9,893 — 1,080 269 8,544Total(2) $ 89,259 $ 29,907 $ 33,496 $ 11,253 $ 14,603
(1) Acquisition related contingent liabilities are based upon the achievement of profitability and sales targets. The fair value was determined based on aprobability−weighted approach derived from management’s estimates. The timing and amount of these contingent payments are based upon our currentassessment of the fair value of the liability. See “Note 3. Acquisition.”
(2) Due to the uncertainty with respect to the timing of future cash flows associated with the Company’s unrecognized income tax benefits at September 30,2010, we are unable to reasonably estimate settlements with taxing authorities. The above Contractual Obligations table does not reflect unrecognizedincome tax benefits of approximately $1.5 million, of which approximately $0.3 million is related interest and penalties. See “Note 18. Income Taxes” ofthe Consolidated Financial Statements for a further discussion on income taxes.
22
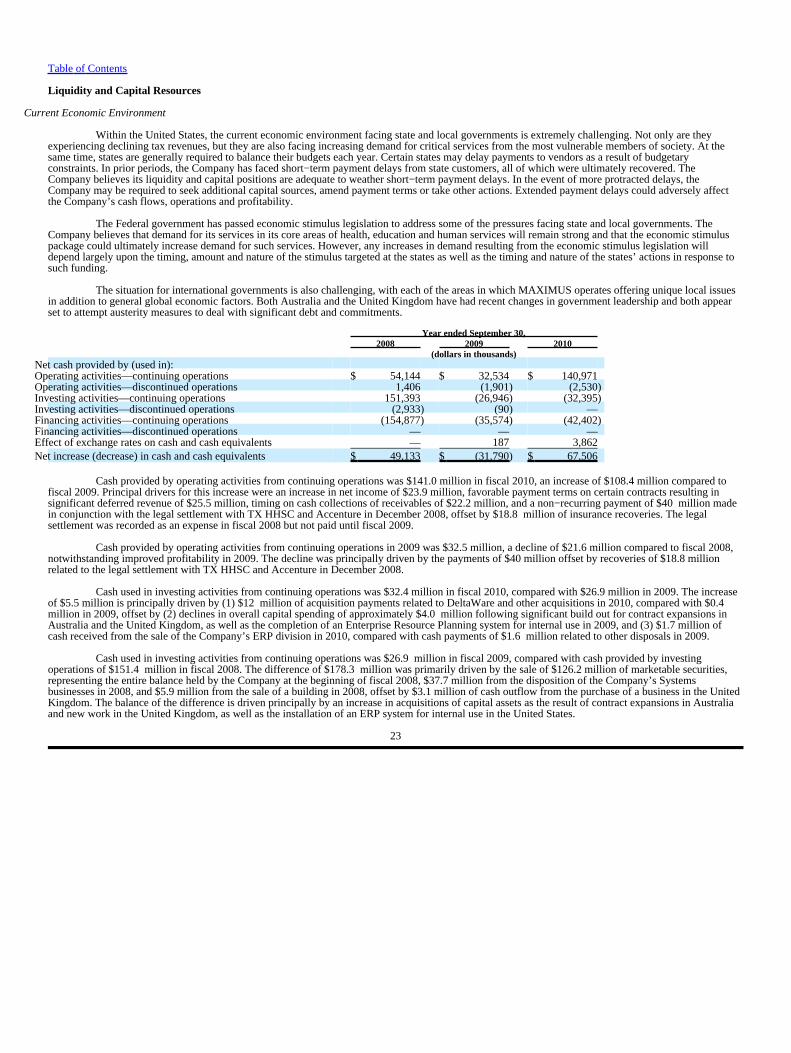
Table of Contents
Liquidity and Capital Resources
Current Economic Environment
Within the United States, the current economic environment facing state and local governments is extremely challenging. Not only are theyexperiencing declining tax revenues, but they are also facing increasing demand for critical services from the most vulnerable members of society. At thesame time, states are generally required to balance their budgets each year. Certain states may delay payments to vendors as a result of budgetaryconstraints. In prior periods, the Company has faced short−term payment delays from state customers, all of which were ultimately recovered. TheCompany believes its liquidity and capital positions are adequate to weather short−term payment delays. In the event of more protracted delays, theCompany may be required to seek additional capital sources, amend payment terms or take other actions. Extended payment delays could adversely affectthe Company’s cash flows, operations and profitability.
The Federal government has passed economic stimulus legislation to address some of the pressures facing state and local governments. TheCompany believes that demand for its services in its core areas of health, education and human services will remain strong and that the economic stimuluspackage could ultimately increase demand for such services. However, any increases in demand resulting from the economic stimulus legislation willdepend largely upon the timing, amount and nature of the stimulus targeted at the states as well as the timing and nature of the states’ actions in response tosuch funding.
The situation for international governments is also challenging, with each of the areas in which MAXIMUS operates offering unique local issuesin addition to general global economic factors. Both Australia and the United Kingdom have had recent changes in government leadership and both appearset to attempt austerity measures to deal with significant debt and commitments.
Year ended September 30,2008 2009 2010
(dollars in thousands)Net cash provided by (used in):Operating activities—continuing operations $ 54,144 $ 32,534 $ 140,971Operating activities—discontinued operations 1,406 (1,901) (2,530)Investing activities—continuing operations 151,393 (26,946) (32,395)Investing activities—discontinued operations (2,933) (90) —Financing activities—continuing operations (154,877) (35,574) (42,402)Financing activities—discontinued operations — — —Effect of exchange rates on cash and cash equivalents — 187 3,862Net increase (decrease) in cash and cash equivalents $ 49,133 $ (31,790) $ 67,506
Cash provided by operating activities from continuing operations was $141.0 million in fiscal 2010, an increase of $108.4 million compared tofiscal 2009. Principal drivers for this increase were an increase in net income of $23.9 million, favorable payment terms on certain contracts resulting insignificant deferred revenue of $25.5 million, timing on cash collections of receivables of $22.2 million, and a non−recurring payment of $40 million madein conjunction with the legal settlement with TX HHSC and Accenture in December 2008, offset by $18.8 million of insurance recoveries. The legalsettlement was recorded as an expense in fiscal 2008 but not paid until fiscal 2009.
Cash provided by operating activities from continuing operations in 2009 was $32.5 million, a decline of $21.6 million compared to fiscal 2008,notwithstanding improved profitability in 2009. The decline was principally driven by the payments of $40 million offset by recoveries of $18.8 millionrelated to the legal settlement with TX HHSC and Accenture in December 2008.
Cash used in investing activities from continuing operations was $32.4 million in fiscal 2010, compared with $26.9 million in 2009. The increaseof $5.5 million is principally driven by (1) $12 million of acquisition payments related to DeltaWare and other acquisitions in 2010, compared with $0.4 million in 2009, offset by (2) declines in overall capital spending of approximately $4.0 million following significant build out for contract expansions inAustralia and the United Kingdom, as well as the completion of an Enterprise Resource Planning system for internal use in 2009, and (3) $1.7 million ofcash received from the sale of the Company’s ERP division in 2010, compared with cash payments of $1.6 million related to other disposals in 2009.
Cash used in investing activities from continuing operations was $26.9 million in fiscal 2009, compared with cash provided by investingoperations of $151.4 million in fiscal 2008. The difference of $178.3 million was primarily driven by the sale of $126.2 million of marketable securities,representing the entire balance held by the Company at the beginning of fiscal 2008, $37.7 million from the disposition of the Company’s Systemsbusinesses in 2008, and $5.9 million from the sale of a building in 2008, offset by $3.1 million of cash outflow from the purchase of a business in the UnitedKingdom. The balance of the difference is driven principally by an increase in acquisitions of capital assets as the result of contract expansions in Australiaand new work in the United Kingdom, as well as the installation of an ERP system for internal use in the United States.
23

Table of Contents
Cash used in financing activities from continuing operations was $154.9 million, $35.6 million, and $42.4 million in fiscal years 2008, 2009,and 2010, respectively. These cash flows were principally driven by repurchases of common stock, including a price adjustment under an accelerated sharerepurchase agreement in 2008, of $150.6 million, $30.0 million, and $40.2 million in 2008, 2009, and 2010, respectively. Details of the Company’s sharerepurchase activity are set forth in “Note 13. Shareholders’ Equity”. The Company also paid $7.8 million, $8.1 million and $8.4 million in dividends in2008, 2009, and 2010, respectively.
The beneficial effect of exchange rates of cash and cash equivalents of $3.9 million in the current year reflects the weakening of the United StatesDollar and increases in our overseas cash balances, notably in Australia.
To supplement our statements of cash flows presented on a GAAP basis, we use the non−GAAP measure of free cash flows from continuingoperations to analyze the funds generated from operations. We believe free cash flow from continuing operations is a useful basis for comparing ourperformance with our competitors. The presentation of non−GAAP free cash flows from continuing operations is not meant to be considered in isolation, oras an alternative to net income as an indicator of performance, or as an alternative to cash flows from operating activities as a measure of liquidity. Wecalculate free cash flow from continuing operations as follows:
Year ended September 30,2008 2009 2010
(dollars in thousands)
Cash provided by operating activities – continuingoperations $ 54,144 $ 32,534 $ 140,971
Purchases of property and equipment (10,380) (19,694) (13,936)Capitalized software costs (5,131) (6,888) (8,672)Free cash flow from continuing operations $ 38,633 $ 5,952 $ 118,363
Repurchases of the Company’s common stock
On November 14, 2007, the Company announced that its Board of Directors had authorized the repurchase of up to $150.0 million of theCompany’s outstanding common stock under an Accelerated Share Repurchase (“ASR”) program. Under the ASR agreement, the Company acquired andretired 3,758,457 shares at an initial price of $39.91 per share for $150.0 million plus fees of approximately $0.4 million. The counter−party purchased anequivalent number of shares in the open market over the nine−month period ended August 15, 2008. Pursuant to the ASR agreement, at its completion theCompany’s initial price under the ASR agreement was adjusted down based on the volume−weighted average price (“VWAP”) of the Company’s stockduring this period. Such adjustment could be settled in cash or stock at the Company’s discretion. On July 11, 2008, the counter−party completed thepurchase of shares in the open market, and the Company elected to receive the price adjustment of $13.9 million in cash. In the fourth quarter of fiscal 2008,this receipt of cash was recorded as a decrease to common stock in the full amount of $13.9 million.
Under a resolution adopted in July 2008, the Board of Directors authorized the repurchase, at management’s discretion, of up to an aggregate of$75.0 million of the Company’s common stock. The resolution also authorized the use of option exercise proceeds for the repurchase of the Company’scommon stock. In September 2010, a further board resolution increased the authorized repurchases by an additional $100 million.
Total share purchases under these plans are summarized as follows (in thousands):
Year ended September 30,2008 2009 2010
Number of share acquired under:ASR Agreement 3,758,457 — —July 2008 and September 2010 resolutions 386,600 927,690 750,764Total 4,145,057 927,690 750,764Total cost of shares (in thousands of dollars) acquired under:ASR Agreement $ 150,400 $ — $ —Price adjustment under ASR Agreement (13,903) — —July 2008 and September 2010 resolutions 14,066 30,046 40,217Total $ 150,563 $ 30,046 $ 40,217
As of November 19, 2010, the Company had repurchased an additional 37,500 shares at a cost of $2.3 million during the first quarter of fiscal2011.
24

Table of Contents
Credit arrangements
On January 25, 2008, the Company entered into a Revolving Credit Agreement providing for a senior secured revolving credit facility, withSunTrust Bank as administrative agent, issuing bank and swingline lender, and a syndicate of other lenders (the “Credit Facility”). The Credit Facilityprovides for a $35.0 million revolving line of credit commitment, which may be used (i) for revolving loans, (ii) for swingline loans, subject to a sublimit of$5.0 million, and (iii) to request the issuance of letters of credit on the Company’s behalf, subject to a sublimit of $25.0 million. The Company may requestan increase in the commitment under the Credit Facility, such that the aggregate commitments under the Credit Facility shall at no time exceed$75.0 million. The credit available under the Credit Facility may be used, among other purposes, to refinance the Company’s current indebtedness, torepurchase shares of the Company’s capital stock and to finance the ongoing working capital, capital expenditure, and general corporate needs of theCompany.
Subject to applicable conditions, the Company may elect interest rates on its revolving borrowings calculated by reference to (i) the primelending rate as announced by SunTrust Bank (or, if higher, the federal funds effective rate plus 0.50%) (a “Base Rate Borrowing”), or (ii) the reserveadjusted rate per annum equal to the offered rate for deposits in U.S. dollars for a one (1), two (2), three (3) or six (6) month period in the LondonInter−Bank Market (a “LIBOR Borrowing”), and, in each case, plus an applicable margin that is determined by reference to the Company’s then−currentleverage ratio. For swingline borrowings, the Company will pay interest at the rate of interest for a one (1) month LIBOR Borrowing, plus the applicablemargin, or at a rate to be separately agreed upon by the Company and the administrative agent.
At September 30, 2010, the Company had issued three letters of credit under the credit facility totaling $10.3 million. A letter of credit for$10 million may be called by a customer in the event that the Company defaults under the terms of a contract. The letter was renewed in March 2010 andexpires in March 2011. Two letters of credit totaling $0.3 million have been issued in relation to the Company’s insurance policies. These letters of creditexpire in May 2011 and may be renewed annually thereafter. At September 30, 2010, the Company has capacity to borrow, subject to covenant constraints,of up to $23.3 million under this agreement.
The Credit Facility matures on January 25, 2013, at which time all outstanding borrowings must be repaid and all outstanding letters of creditmust be terminated or cash collateralized.
The Credit Facility, as amended by the Company and its lender on December 12, 2008, provides for the payment of specified fees and expenses,including an up−front fee and commitment and letter of credit fees, and contains customary financial and other covenants that require the maintenance ofcertain ratios including a maximum leverage ratio and a minimum fixed charge coverage ratio. The Company was in compliance with all covenants in theamended Credit Facility as of September 30, 2010. The Company’s obligations under the Credit Facility are guaranteed by certain of the Company’s directand indirect subsidiaries (collectively, the “Guarantors”) and are secured by substantially all of MAXIMUS’ and the Guarantors’ present and future tangibleand intangible assets, including the capital stock of subsidiaries and other investment property.
In addition to this credit facility, the Company has a loan agreement with the Atlantic Innovation Fund of Canada, which was acquired as part ofthe DeltaWare acquisition (see “Note 3. Acquisition”). This provides for a loan of up to 1.7 million Canadian Dollars, which must be used for specifictechnology−based research and development. The loan has no interest charge and is repayable in installments between 2012 and 2022. At September 30,2010, $1.4 million (1.4 million Canadian Dollars) was outstanding under this agreement. The balance will be repayable in forty quarterly installmentscommencing from July 1, 2012, with the final payment no later than fiscal 2022. Borrowings using this facility reduce the availability of credit under theRevolving Credit Agreement.
Other
Our working capital at September 30, 2009 and 2010 was $164.6 million and $191.5 million, respectively. At September 30, 2010, we had cashand cash equivalents of $155.3 million and debt of $1.4 million. Management believes this liquidity and financial position, along with the revolving creditfacility discussed above, provides sufficient liquidity to continue any contemplated stock repurchase program (depending on the price of the Company’scommon stock), to pursue selective acquisitions, and to consider the continuation of dividends on a quarterly basis. Restricted cash represents amountscollected on behalf of certain customers and its use is restricted to the purposes specified under our contracts with these customers.
25

Table of Contents
Under the provisions of certain long−term contracts, we may incur certain reimbursable transition period costs. During the transition period, theseexpenditures result in the use of our cash and in our entering into lease financing arrangements for a portion of the costs. Reimbursement of these costs mayoccur in the set−up phase or over the contract operating period. Related revenue may also be deferred during the set−up phase. As of September 30, 2010,$6.7 million in net costs had been incurred and reported as deferred contract costs on our consolidated balance sheet.
On October 8, 2010, the Company’s Board of Directors declared a quarterly cash dividend of $0.12 for each share of the Company’s commonstock outstanding. The dividend will be paid on November 30, 2010 to shareholders of record on November 15, 2010. Based on the number of sharesoutstanding, the payment will be approximately $2.1 million.
We believe that we will have sufficient resources to meet our currently anticipated capital expenditure and working capital requirements for atleast the next twelve months.
Off−balance sheet arrangements
We do not have material off−balance sheet risk or exposure to liabilities that are not recorded or disclosed in our financial statements.
Effects of Inflation
As measured by revenue, approximately 29% of our business is conducted under cost−reimbursable contracts which adjust revenue to cover costsincreased by inflation. Approximately 3% of the business is time−and−material contracts where labor rates are often fixed for several years. We generallyhave been able to price these contracts in a manner that accommodates the rates of inflation experienced in recent years. The remaining portions of ourcontracts are fixed price and performance based and are typically priced to account for the likely inflation from period to period to mitigate the risk of ourbusiness being adversely affected by inflation.
Critical Accounting Policies and Estimates
Our discussion and analysis of financial condition and results of operations are based on our consolidated financial statements, which have beenprepared in accordance with accounting principles generally accepted in the United States. The preparation of these financial statements requires us to makeestimates and assumptions that affect the reported amounts of assets and liabilities, the disclosure of contingent liabilities and the reported amounts ofrevenue and expenses. On an ongoing basis, we evaluate our estimates including those related to revenue recognition and cost estimation on certaincontracts, the realizability of goodwill, and amounts related to income taxes, certain accrued liabilities and contingencies and litigation. We base ourestimates on historical experience and on various other assumptions that are believed to be reasonable under the circumstances, the results of which form thebasis for making judgments about the carrying values of assets and liabilities. Actual results could differ from those estimates.
We do not have material off−balance sheet risk or exposure to liabilities that are not recorded or disclosed in our financial statements. While wehave significant operating lease commitments for office space, those commitments are generally tied to the period of performance under related contracts.Additionally, although on certain contracts we are bound by performance bond commitments and standby letters of credit, we have not had any defaultsresulting in draws on performance bonds. Also, we do not speculate in derivative transactions.
We believe the following critical accounting policies affect the significant judgments and estimates used in the preparation of our consolidatedfinancial statements:
Revenue Recognition.In fiscal 2010, approximately 59% of our total revenue was derived from state and local government agencies; 27% fromforeign customers; 9% from federal government agencies; and 5% from other sources, such as commercial customers. Revenue is generated from contractswith various pricing arrangements, including: (1) fixed−price; (2) performance−based criteria; (3) costs incurred plus a negotiated fee (“cost−plus”); and(4) time and materials. Also, some contracts contain “not−to−exceed” provisions. Of the contracts with “not−to−exceed” provisions, to the extent weestimate we will exceed the contractual limits, we treat these contracts as fixed price. For fiscal 2010, revenue from performance−based contracts wasapproximately 47% of total revenue; revenue from cost−plus contracts was approximately 29% of total revenue; revenue from fixed−price contracts wasapproximately 21% of total revenue; and revenue from time and materials contracts was approximately 3% of total revenue. A majority of the contracts withstate and local government agencies have been fixed−price and performance−based, and our contracts with the federal government generally have beencost−plus. Fixed−price and performance−based contracts generally offer higher margins but typically involve more risk than cost−plus or time and materialsreimbursement contracts.
26

Table of Contents
We recognize revenue on general service arrangements as work is performed and amounts are earned. We consider amounts to be earned onceevidence of an arrangement has been obtained, services are delivered, fees are fixed or determinable, and collectability is reasonably assured.
We recognize revenue on fixed−price contracts when earned, as services are provided. For certain fixed−price contracts, primarily systemsdesign, development and implementation, we recognize revenue based on costs incurred using estimates of total expected contract revenue and costs to beincurred. The cumulative impact of any revisions in estimated revenue and costs is recognized in the period in which the facts that give rise to the revisionbecome known. Provisions for estimated losses on incomplete contracts are provided for in full in the period in which such losses become known.
For other fixed−price contracts, revenue is recognized on a straight−line basis unless evidence suggests that revenue is earned or obligations arefulfilled in a different pattern. Where obligations are fulfilled in a different pattern, revenue is generally recognized as services are provided, based uponoutputs provided to the customer. With fixed−price contracts, we are subject to the risk of potential cost overruns. Costs related to contracts may be incurredin periods prior to recognizing revenue. These costs are generally expensed. However, certain direct and incremental set−up costs may be deferred untilservices are provided and revenue begins to be recognized, when such costs are recoverable from a contractual arrangement. Set−up costs are costs relatedto activities that enable us to provide contractual services to a client. The timing of expense recognition may result in irregular profit margins.
We recognize revenue on performance−based contracts as such revenue becomes fixed or determinable, which generally occurs when amountsare billable to customers. For certain contracts, this may result in revenue being recognized in irregular increments.
Revenue on cost−plus contracts is recognized based on costs incurred plus an estimate of the negotiated fee earned. Revenue on time andmaterials contracts is recognized based on hours worked and expenses incurred.
Our most significant expense is cost of revenue, which consists primarily of project−related costs such as employee salaries and benefits,subcontractors, computer equipment and travel expenses. Our management uses its judgment and experience to estimate cost of revenue expected onprojects. Our management’s ability to accurately predict personnel requirements, salaries and other costs as well as to effectively manage a project orachieve certain levels of performance can have a significant impact on the gross margins related to our fixed−price, performance−based and time andmaterials contracts. If actual costs are higher than our management’s estimates, profitability may be adversely affected. Service cost variability has littleimpact on cost−plus arrangements because allowable costs are reimbursed by the customer.
We also license software under license agreements. Software license revenue is recognized when a customer enters into a non−cancelable licenseagreement, the software product has been delivered, there are no uncertainties surrounding product acceptance, there are no significant future performanceobligations, the license fees are fixed or determinable and collection of the license fee is considered probable. Amounts received in advance of meetingthese criteria are deferred and classified as deferred revenue in the accompanying consolidated balance sheets. The Company determines the value of thesoftware component of its multiple−element arrangements using the residual method as vendor specific objective evidence (“VSOE”) of fair value exists forthe undelivered elements such as the support and maintenance agreements and related implementation and training services, but not for all deliveredelements such as the software itself. The residual method requires revenue to be allocated to the undelivered elements based on the fair value of suchelements, as indicated by VSOE. VSOE is based on the price charged when the element is sold separately. Maintenance and post−contract customer supportrevenue are recognized ratably over the term of the related agreements, which in most cases is one year. Revenue from software−related consulting servicesunder time and material contracts and for training is recognized as services are performed. Revenue from other software−related contract services requiringsignificant modification or customization of software is recognized under the percentage−of−completion method.
Where contracts have multiple deliverables, we evaluate these deliverables at the inception of each contract and as each item is delivered. As partof this evaluation, we consider whether (i) a delivered item has value to a customer on a stand−alone basis; (ii) there is objective and reliable evidence of thefair market value of the undelivered items; and (iii) whether the delivery of the undelivered items is considered probable and substantially within ourcontrol, if a general right of return exists. Where deliverables, or groups of deliverables, have all three of these characteristics, we treat each deliverable itemas a separate unit of accounting and apply the relevant revenue recognition guidance to each deliverable. For transactions entered into after September 30,2010, the Company will adopt updated accounting rules with respect to multiple−element arrangements. See “Note 2. Recent Accounting Pronouncements”in Item 8 of this Form 10−K.
27

Table of Contents
Impairment of Goodwill. Goodwill is typically obtained by the Company as a result of business combinations. Goodwill represents the differencebetween the consideration paid in acquiring the business and the fair value of the identifiable net assets acquired.
Goodwill is not amortized but is subject to impairment testing on an annual basis, or more frequently if impairment indicators arise. Impairmenttesting is performed at the reporting unit level. Performing the goodwill impairment test requires judgment, including how we define reporting units anddetermine their fair value. A reporting unit is the operating segment, or a business one level below that operating segment (the component level) if discretefinancial information is prepared and reviewed regularly by segment management. However, components are aggregated if they have similar economiccharacteristics. We recognize an impairment charge for any amount by which the carrying amount of a reporting unit’s goodwill exceeds its fair value. Weuse discounted cash flows to establish fair values. When available and as appropriate, we use comparative market multiples to corroborate the discountedcash flow results. When a portion of a reporting unit is disposed of, goodwill is allocated using the relative fair value method for purposes of calculating thegain or loss on disposal. In addition, a goodwill impairment test is performed for the remaining portion of the reporting unit.
The Company performs its annual impairment test as of July 1st of each year. At July 1, 2010, the Company performed the annual impairment testbased upon the reporting units in existence at this time, which were consistent with the Company’s operating segments at this time, Consulting andOperations. Based upon this test, management determined that there had been no impairment of goodwill. Upon the reorganization of the business in thefourth quarter, goodwill balances were reallocated to the new reporting units and a further test for goodwill impairment was performed. This also did notdemonstrate any evidence of goodwill impairment.
Changes in estimates and assumptions we make in conducting our goodwill impairment assessment could affect the estimated future fair value ofone or more of our reporting units and could result in a goodwill impairment in the future. However, a 25% decline in the estimated fair value of any of ourreporting units at July 1, 2010 or September 30, 2010 would not have resulted in a goodwill impairment charge.
Acquisition−related contingent consideration. For all acquisitions occurring after October 1, 2009, the Company is required to calculate the fairvalue of any contingent consideration included within the acquisition agreement. Subsequent changes to the fair value of the contingent consideration willbe included as an expense or a benefit in the financial statements of the Company. The Company reassesses the most likely value of the considerationpayable at each reporting period, based upon the financial performance or sales performance of the acquired entities and adjusts the liability to reflect theserevised estimates. Any differences from the Company’s expectations of future profitability, both beneficially and adverse, will have an effect on theacquisition−related contingent consideration liability.
Capitalized Software Development Costs. All of the software development costs included within continuing operations relate to software which isintended for the Company’s internal use. Direct costs of time and material incurred for the development of application software for internal use arecapitalized and amortized using the straight−line method over the estimated useful life of the software, ranging from three to eight years.
Allowance for Doubtful Accounts. We maintain an allowance for doubtful accounts at an amount we estimate to be sufficient to cover the risk ofcollecting less than full payment on our receivables. On a regular basis we re−evaluate our client receivables, especially receivables that are past due, andreassess our allowance for doubtful accounts based on specific client collection issues. If our clients were to express dissatisfaction with the services wehave provided, additional allowances may be required.
Deferred Contract Costs. Deferred contract costs consist of contractually recoverable direct set−up costs relating to long−term service contractsin progress. These costs include direct and incremental costs incurred prior to the commencement of us providing service to enable us to provide thecontracted services to our customer. Such costs are expensed over the period services are provided under the long−term service contract. We reviewdeferred contract costs for impairment whenever events or changes in circumstances indicate that the carrying amount may not be recoverable. Our reviewis based on our projection of the undiscounted future operating cash flows of the related customer project. To the extent such projections indicate that futureundiscounted cash flows are not sufficient to recover the carrying amount, we recognize a non−cash impairment charge to reduce the carrying amount toequal projected future discounted cash flows. No impairment charges were recorded in the three years ending September 30, 2010.
Contingencies. From time to time, we are involved in legal proceedings, including contract and employment claims, in the ordinary course ofbusiness. We assess the likelihood of any adverse judgments or outcomes to these contingencies as well as potential ranges of probable losses and establishreserves accordingly. The amount of reserves required may change in future periods due to new developments in each matter or changes in approach to amatter such as a change in settlement strategy.
28

Table of Contents
Legal and Settlement Expense (Recovery), Net. Legal and settlement expense consists of costs, net of reimbursed insurance claims, related tosignificant legal settlements and non−routine legal matters, including future probable legal costs estimated to be incurred in connection with those matters.Legal expenses incurred in the ordinary course of business are included in selling, general and administrative expense.
Income taxes. To record income tax expense, we are required to estimate our income taxes in each of the jurisdictions in which we operate. Inaddition, income tax expense at interim reporting dates requires us to estimate our expected effective tax rate for the entire year. This process involvesestimating our actual current tax liability together with assessing temporary differences that result in deferred tax assets and liabilities and expected futuretax rates. Circumstances that could cause our estimates of income tax expense to change include: the impact of information that subsequently becomesavailable as we prepare our tax returns; revision to tax positions taken as a result of further analysis and consultation; changes in the geographic mix of ourbusiness; the actual level of pre−tax income; changes in tax rules, regulations and rates; and changes mandated as a result of audits by taxing authorities.
We may also establish tax reserves when, despite our belief that our tax return positions are fully supportable, we believe that certain positionsare subject to challenge and that we may not fully succeed. We adjust these reserves in light of changing facts, such as the progress of a tax audit, new caselaw, or expiration of a statute of limitations.
The Company accounts for uncertain tax positions by recognizing the financial statement effects of a tax position only when, based upon thetechnical merits, it is “more−likely−than−not” that the position will be sustained upon examination.
ITEM 7A. Quantitative and Qualitative Disclosures About Market Risk.
We believe that our exposure to market risk related to the effect of changes in interest rates, commodity prices and other market risks with regardto instruments entered into for trading or for other purposes is immaterial.
The Company is exposed to foreign exchange fluctuations in the Australian Dollar, Canadian Dollar, British Pound and Israeli Shekel. During theyear ended September 30, 2010, the Company earned approximately 27% of revenues and 39% of operating income from foreign subsidiaries. AtSeptember 30, 2010, approximately 35% of the Company’s assets are held by foreign subsidiaries. The Company mitigates its foreign exchange risksthrough maintaining sufficient capital within its foreign subsidiaries to support the short−term and long−term capital requirements of these businesses. TheCompany’s foreign subsidiaries typically incur costs in the same currency as they earn revenues, thus limiting the Company’s exposure to unexpectedexpenditures. The operations of the U.S. business do not depend upon cash flows from foreign subsidiaries.
29

Table of Contents
ITEM 8. Financial Statements and Supplementary Data.
The following consolidated financial statements and supplementary data are included as part of this Annual Report on Form 10−K:
Report of Independent Registered Public Accounting Firm 31Consolidated Balance Sheets at September 30, 2009 and 2010 32Consolidated Statements of Operations for the years ended September 30, 2008, 2009 and 2010 33Consolidated Statements of Changes in Shareholders’ Equity for the years ended September 30, 2008, 2009 and 2010 34Consolidated Statements of Cash Flows for the years ended September 30, 2008, 2009 and 2010 35Notes to Consolidated Financial Statements 36
30

Table of Contents
REPORT OF INDEPENDENT REGISTERED PUBLIC ACCOUNTING FIRM
The Board of Directors and Shareholders of MAXIMUS, Inc.
We have audited the accompanying consolidated balance sheets of MAXIMUS, Inc. as of September 30, 2009 and 2010, and the relatedconsolidated statements of operations, changes in shareholders’ equity, and cash flows for each of the three years in the period ended September 30, 2010.These financial statements are the responsibility of the Company’s management. Our responsibility is to express an opinion on these financial statementsbased on our audits.
We conducted our audits in accordance with the standards of the Public Company Accounting Oversight Board (United States). Those standardsrequire that we plan and perform the audit to obtain reasonable assurance about whether the financial statements are free of material misstatement. An auditincludes examining, on a test basis, evidence supporting the amounts and disclosures in the financial statements. An audit also includes assessing theaccounting principles used and significant estimates made by management, as well as evaluating the overall financial statement presentation. We believethat our audits provide a reasonable basis for our opinion.
In our opinion, the financial statements referred to above present fairly, in all material respects, the consolidated financial position ofMAXIMUS, Inc. at September 30, 2009 and 2010, and the consolidated results of its operations and its cash flows for each of the three years in the periodended September 30, 2010, in conformity with U.S. generally accepted accounting principles.
We also have audited, in accordance with the standards of the Public Company Accounting Oversight Board (United States), MAXIMUS, Inc.’sinternal control over financial reporting as of September 30, 2010, based on criteria established in Internal Control−Integrated Framework issued by theCommittee of Sponsoring Organizations of the Treadway Commission and our report dated November 19, 2010 expressed an unqualified opinion thereon.
/s/Ernst & Young LLP
McLean, VirginiaNovember 19, 2010
31

Table of Contents
MAXIMUS, Inc.
CONSOLIDATED BALANCE SHEETS
(Dollars in thousands)
September 30,2009 2010
ASSETSCurrent assets:Cash and cash equivalents $ 87,815 $ 155,321Restricted cash 3,919 4,182Accounts receivable—billed, net 133,485 136,260Accounts receivable—unbilled 19,510 17,245Current portion of note receivable 736 —Prepaid income taxes 7,501 4,149Deferred income taxes 5,389 13,290Prepaid expenses and other current assets 19,749 25,702Current assets of discontinued operations 14,007 —Total current assets 292,111 356,149Property and equipment, net 45,286 48,873Capitalized software, net 18,969 24,715Deferred contract costs, net 8,206 6,708Goodwill 61,029 71,251Intangible assets, net 2,455 7,778Deferred income taxes 1,239 1,844Deferred compensation plan assets — 8,317Other assets 3,939 2,106Total assets $ 433,234 $ 527,741
LIABILITIES AND SHAREHOLDERS’ EQUITYCurrent liabilities:Accounts payable $ 44,644 $ 49,200Accrued compensation and benefits 31,738 40,807Deferred revenue 22,177 58,070Acquisition−related contingent consideration — 923Income taxes payable — 7,120Accrued liabilities 15,083 7,934Liabilities of discontinued operations 13,823 634Total current liabilities 127,465 164,688Deferred revenue, less current portion 6,527 4,083Long−term debt — 1,411Acquisition−related contingent consideration, less current portion — 2,138Income taxes payable, less current portion 1,871 1,793Deferred income taxes 243 4,946Deferred compensation plan liabilities — 9,893Total liabilities 136,106 188,952Commitments and contingencies (Notes 11 and 12)Shareholders’ equity:Common stock, no par value; 60,000,000 shares authorized; 27,161,849 and 27,487,725 shares issued and
17,599,029 and 17,174,141 outstanding at September 30, 2009 and September 30, 2010, at stated amount,respectively 338,739 352,696
Treasury stock, at cost; 9,562,820 and 10,313,584 shares at September 30, 2009 and September 30, 2010,respectively (319,149) (359,366)
Accumulated other comprehensive income 8,268 14,530Retained earnings 269,270 330,929Total shareholders’ equity 297,128 338,789Total liabilities and shareholders’ equity $ 433,234 $ 527,741
See notes to consolidated financial statements.
32
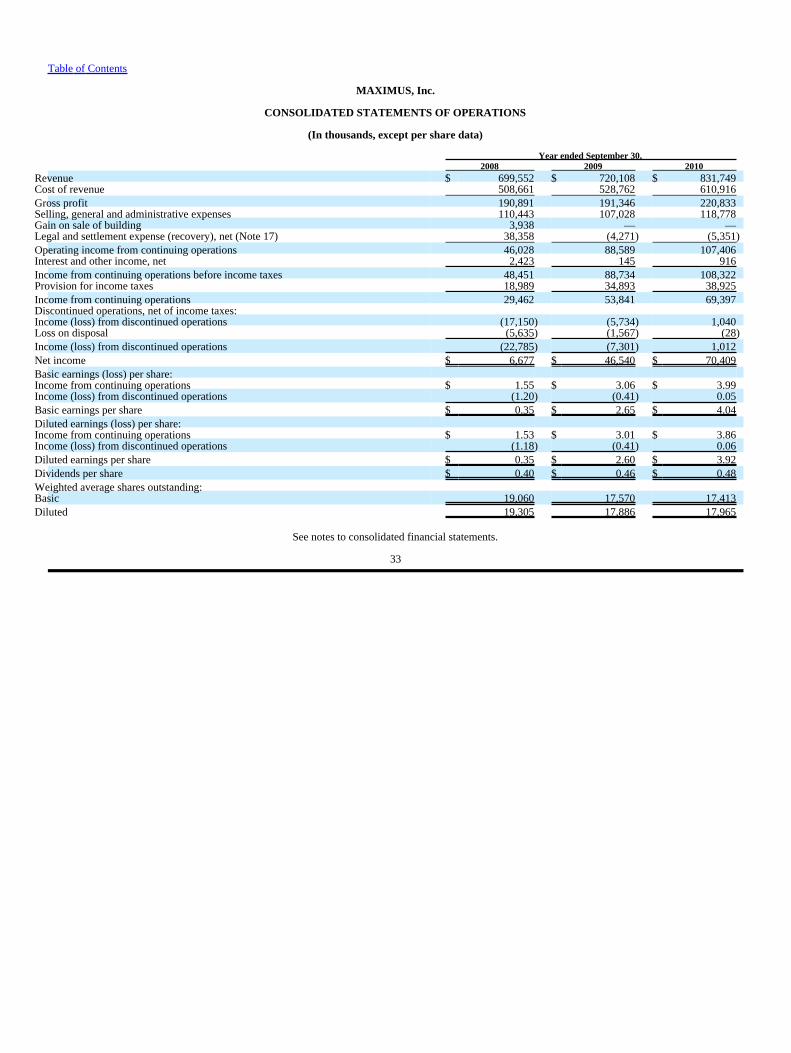
Table of Contents
MAXIMUS, Inc.
CONSOLIDATED STATEMENTS OF OPERATIONS
(In thousands, except per share data)
Year ended September 30,2008 2009 2010
Revenue $ 699,552 $ 720,108 $ 831,749Cost of revenue 508,661 528,762 610,916Gross profit 190,891 191,346 220,833Selling, general and administrative expenses 110,443 107,028 118,778Gain on sale of building 3,938 — —Legal and settlement expense (recovery), net (Note 17) 38,358 (4,271) (5,351)Operating income from continuing operations 46,028 88,589 107,406Interest and other income, net 2,423 145 916Income from continuing operations before income taxes 48,451 88,734 108,322Provision for income taxes 18,989 34,893 38,925Income from continuing operations 29,462 53,841 69,397Discontinued operations, net of income taxes:Income (loss) from discontinued operations (17,150) (5,734) 1,040Loss on disposal (5,635) (1,567) (28)Income (loss) from discontinued operations (22,785) (7,301) 1,012Net income $ 6,677 $ 46,540 $ 70,409Basic earnings (loss) per share:Income from continuing operations $ 1.55 $ 3.06 $ 3.99Income (loss) from discontinued operations (1.20) (0.41) 0.05Basic earnings per share $ 0.35 $ 2.65 $ 4.04Diluted earnings (loss) per share:Income from continuing operations $ 1.53 $ 3.01 $ 3.86Income (loss) from discontinued operations (1.18) (0.41) 0.06Diluted earnings per share $ 0.35 $ 2.60 $ 3.92Dividends per share $ 0.40 $ 0.46 $ 0.48Weighted average shares outstanding:Basic 19,060 17,570 17,413Diluted 19,305 17,886 17,965
See notes to consolidated financial statements.
33

Table of Contents
MAXIMUS, Inc.
CONSOLIDATED STATEMENTS OF CHANGES IN SHAREHOLDERS’ EQUITY
(In thousands)
CommonShares
OutstandingCommon
Stock
AccumulatedOther
ComprehensiveIncome
RetainedEarnings
TreasuryStock
TotalShareholders’
EquityBalance at September 30, 2007 22,194 $ 299,846 $ 1,730 $ 232,071 $ (124,637) $ 409,010Net income — — — 6,677 — 6,677Foreign currency translation — — 3,806 — — 3,806Comprehensive income 10,483Employee stock transactions 253 4,422 — — — 4,422Cash dividends — — — (7,798) — (7,798)Repurchases of common stock (4,145) — — — (164,466) (164,466)Price adjustment under Accelerated Share
Repurchase agreement — 13,903 — — — 13,903Non−cash equity based compensation — 9,463 — — — 9,463Tax benefit due to option exercises — 689 — — — 689Balance at September 30, 2008 18,302 328,323 5,536 230,950 (289,103) 275,706Net income — — — 46,540 — 46,540Foreign currency translation — — 2,732 — — 2,732Comprehensive income 49,272Employee stock transactions 225 2,292 — — — 2,292Cash dividends — — — (8,054) — (8,054)Repurchases of common stock (928) — — — (30,046) (30,046)Dividends on RSUs — 166 — (166) — —Non−cash equity based compensation — 7,307 — — — 7,307Tax benefit due to option exercises — 651 — — — 651Balance at September 30, 2009 17,599 338,739 8,268 269,270 (319,149) 297,128Net income — — — 70,409 — 70,409Foreign currency translation — — 6,262 — — 6,262Comprehensive income 76,671Employee stock transactions 326 2,763 — — — 2,763Cash dividends — — — (8,375) — (8,375)Repurchases of common stock (751) — — — (40,217) (40,217)Dividends on RSUs — 375 — (375) — —Non−cash equity based compensation — 7,918 — — — 7,918Tax benefit due to option exercises — 2,901 — — — 2,901Balance at September 30, 2010 17,174 $ 352,696 $ 14,530 $ 330,929 $ (359,366) $ 338,789
See notes to consolidated financial statements.
34

Table of Contents
MAXIMUS, Inc.
CONSOLIDATED STATEMENTS OF CASH FLOWS
(Dollars in thousands)
Year ended September 30,2008 2009 2010
Cash flows from operating activities:Net income $ 6,677 $ 46,540 $ 70,409Adjustments to reconcile net income to net cash provided by operating activities:(Income) loss from discontinued operations 22,785 7,301 (1,012)Depreciation 8,845 8,882 12,857Amortization 3,396 3,350 5,483Deferred income taxes (28,851) 26,471 (3,172)Gain on sale of building (3,938) — —Gain on sale of fixed assets — (51) —Deferred interest income on note receivable 147 376 263Non−cash equity based compensation 9,123 7,307 7,918Changes in assets and liabilities, net of effects from divestitures:Accounts receivable—billed (12,694) (13,052) 38Accounts receivable—unbilled (1,259) (6,677) 2,415Due from insurance carrier (12,500) 12,500 —Prepaid expenses and other current assets (1,207) (11,801) (1,740)Deferred contract costs 2,792 (2,882) 1,541Other assets (1,250) (822) (6,773)Accounts payable 1,021 993 (407)Accrued compensation and benefits 2,422 5,497 7,883Deferred revenue (90) 5,820 31,294Income taxes 11,223 (20,503) 6,374Other liabilities 47,502 (36,715) 7,600Cash provided by operating activities—continuing operations 54,144 32,534 140,971Cash provided by (used in) operating activities—discontinued operations 1,406 (1,901) (2,530)Cash provided by operating activities 55,550 30,633 138,441Cash flows from investing activities:Proceeds (payments) from sales of discontinued operations, net of transaction costs 37,678 (1,626) 1,700Proceeds from sale of building, net of transaction costs 5,929 — —Acquisition of businesses, net of cash acquired (3,150) (406) (11,960)Proceeds from note receivable 237 972 473Purchases of property and equipment (10,380) (19,694) (13,936)Capitalized software costs (5,131) (6,888) (8,672)Decrease in marketable securities 126,210 — —Proceeds from sale of equipment — 696 —Cash provided by (used in) investing activities—continuing operations 151,393 (26,946) (32,395)Cash used in investing activities—discontinued operations (2,933) (90) —Cash provided by (used in) investing activities 148,460 (27,036) (32,395)Cash flows from financing activities:Employee stock transactions 4,422 2,292 2,763Repurchases of common stock (164,466) (30,046) (40,217)Price adjustment under Accelerated Share Repurchase agreement 13,903 — —Payments on capital lease obligations (1,627) (417) —Tax benefit due to option exercises and restricted stock units vesting 689 651 2,901Repayment of long−term debt — — (7)Issuance of long−term debt — — 533Cash dividends paid (7,798) (8,054) (8,375)Cash used in financing activities—continuing operations (154,877) (35,574) (42,402)Cash provided by financing activities—discontinued operations — — —Cash used in financing activities (154,877) (35,574) (42,402)Effect of exchange rate changes on cash — 187 3,862Net increase (decrease) in cash and cash equivalents 49,133 (31,790) 67,506Cash and cash equivalents, beginning of period 70,472 119,605 87,815Cash and cash equivalents, end of period $ 119,605 $ 87,815 $ 155,321
See notes to consolidated financial statements.
35

Table of Contents
MAXIMUS, Inc.
Notes to Consolidated Financial Statements
For the years ended September 30, 2008, 2009 and 2010
1. Business and Summary of Significant Accounting Policies
(a) Description of Business
MAXIMUS, Inc. (the “Company” or “we”) provides business process outsourcing services to government health and human services agencies inthe United States and to foreign governments. During the year, management made changes to the manner in which they operated the business. Followingthis reorganization, the Company conducts its operations through two business segments: Health Services and Human Services. The Health ServicesSegment provides a variety of business process managed services and administrative support services for state, federal, national and local governmentprograms, including: Medicaid, Medicaid Managed Care, CHIP, Health Care Reform, Medicare and Health Insurance BC (British Columbia). The HumanServices Segment provides a variety of administrative support and case management services for federal, national, state and county human services agenciesincluding welfare−to−work programs, child support enforcement, higher education services and K−12 special education services.
Other than disclosed in Note 21, the Notes to Consolidated Financial Statements reflect operating results from continuing operations.
The Company operates predominantly in the United States. Revenue from foreign−based projects and offices was 17%, 17%, and 27% of totalrevenue for the years ended September 30, 2008, 2009 and 2010, respectively.
(b) Principles of Consolidation
The consolidated financial statements include the accounts of MAXIMUS, Inc. and its wholly−owned subsidiaries. All significant intercompanybalances and transactions have been eliminated in consolidation.
(c) Revenue Recognition
In fiscal 2010, approximately 59% of our total revenue was derived from state and local government agencies; 27% from foreign customers; 9%from federal government agencies; and 5% from other sources, such as commercial customers. Revenue is generated from contracts with various pricingarrangements, including: (1) fixed−price; (2) performance−based criteria; (3) costs incurred plus a negotiated fee (“cost−plus”); and (4) time and materials.Also, some contracts contain “not−to−exceed” provisions. Of the contracts with “not−to−exceed” provisions, to the extent we estimate we will exceed thecontractual limits, we treat these contracts as fixed price. For fiscal 2010, revenue from performance−based contracts was approximately 47% of totalrevenue; revenue from cost−plus contracts was approximately 29% of total revenue; revenue from fixed−price contracts was approximately 21% of totalrevenue; and revenue from time and materials contracts was approximately 3% of total revenue. A majority of the contracts with state and local governmentagencies have been fixed−price and performance−based, and our contracts with the federal government generally have been cost−plus. Fixed−price andperformance−based contracts generally offer higher margins but typically involve more risk than cost−plus or time and materials reimbursement contracts.
We recognize revenue on general service arrangements as work is performed and amounts are earned. We consider amounts to be earned onceevidence of an arrangement has been obtained, services are delivered, fees are fixed or determinable, and collectability is reasonably assured.
We recognize revenue on fixed−priced contracts when earned, as services are provided. For certain fixed−price contracts, primarily systemsdesign, development and implementation, we recognize revenue based on costs incurred using estimates of total expected contract revenue and costs to beincurred. The cumulative impact of any revisions in estimated revenue and costs is recognized in the period in which the facts that give rise to the revisionbecome known. Provisions for estimated losses on incomplete contracts are provided for in full in the period in which such losses become known.
36

Table of Contents
For other fixed−price contracts, revenue is recognized on a straight−line basis unless evidence suggests that revenue is earned or obligations arefulfilled in a different pattern. Where obligations are fulfilled in a different pattern, revenue is generally recognized as services are provided, based uponoutputs provided to the customer. With fixed−price contracts, we are subject to the risk of potential cost overruns. Costs related to contracts may be incurredin periods prior to recognizing revenue. These costs are generally expensed. However, certain direct and incremental set−up costs may be deferred untilservices are provided and revenue begins to be recognized, when such costs are recoverable from a contractual arrangement. Set−up costs are costs relatedto activities that enable us to provide contractual services to a client. The timing of expense recognition may result in irregular profit margins.
We recognize revenue on performance−based contracts as such revenue becomes fixed or determinable, which generally occurs when amountsare billable to customers. For certain contracts, this may result in revenue being recognized in irregular increments.
Revenue on cost−plus contracts is recognized based on costs incurred plus an estimate of the negotiated fee earned. Revenue on time andmaterials contracts is recognized based on hours worked and expenses incurred.
Our most significant expense is cost of revenue, which consists primarily of project−related costs such as employee salaries and benefits,subcontractors, computer equipment and travel expenses. Our management uses its judgment and experience to estimate cost of revenue expected onprojects. Our management’s ability to accurately predict personnel requirements, salaries and other costs as well as to effectively manage a project orachieve certain levels of performance can have a significant impact on the gross margins related to our fixed−price, performance−based and time andmaterials contracts. If actual costs are higher than our management’s estimates, profitability may be adversely affected. Service cost variability has littleimpact on cost−plus arrangements because allowable costs are reimbursed by the customer.
We also license software under license agreements. Software license revenue is recognized when a customer enters into a non−cancelable licenseagreement, the software product has been delivered, there are no uncertainties surrounding product acceptance, there are no significant future performanceobligations, the license fees are fixed or determinable and collection of the license fee is considered probable. Amounts received in advance of meetingthese criteria are deferred and classified as deferred revenue in the accompanying consolidated balance sheets. The Company determines the value of thesoftware component of its multiple−element arrangements using the residual method as vendor specific objective evidence (“VSOE”) of fair value exists forthe undelivered elements such as the support and maintenance agreements and related implementation and training services, but not for all deliveredelements such as the software itself. The residual method requires revenue to be allocated to the undelivered elements based on the fair value of suchelements, as indicated by VSOE. VSOE is based on the price charged when the element is sold separately. Maintenance and post−contract customer supportrevenue are recognized ratably over the term of the related agreements, which in most cases is one year. Revenue from software−related consulting servicesunder time and material contracts and for training is recognized as services are performed. Revenue from other software−related contract services requiringsignificant modification or customization of software is recognized under the percentage−of−completion method.
Where contracts have multiple deliverables, we evaluate these deliverables at the inception of each contract and as each item is delivered. As partof this evaluation, we consider whether (i) a delivered item has value to a customer on a stand−alone basis; (ii) there is objective and reliable evidence of thefair market value of the undelivered items; and (iii) whether the delivery of the undelivered items is considered probable and substantially within ourcontrol, if a general right of return exists. Where deliverables, or groups of deliverables, have all three of these characteristics, we treat each deliverable itemas a separate unit of accounting and apply the relevant revenue recognition guidance to each deliverable. For transactions entered into after September 30,2010, the Company will adopt updated accounting rules with respect to multiple−element arrangements. See “Note 2. Recent Accounting Pronouncements.”
(d) Cash Equivalents
The Company considers all highly liquid investments with an original maturity of three months or less when purchased to be cash equivalents.Cash equivalents are valued at cost, which approximates market.
(e) Restricted Cash
Restricted cash represents amounts collected on behalf of certain customers and its use is restricted to the purposes specified under our contractswith these customers.
37

Table of Contents
(f) Accounts Receivable and Allowance for Doubtful Accounts
Accounts receivable are recorded at their face amount less an allowance for doubtful accounts. We maintain an allowance for doubtful accountsat an amount we estimate to be sufficient to cover the risk of collecting less than full payment on our receivables. On a regular basis we re−evaluate ourclient receivables, especially receivables that are past due, and reassess our allowance for doubtful accounts based on specific client collection issues.
(g) Property and Equipment
Property and equipment is stated at cost and depreciated using the straight−line method based on estimated useful lives not to exceed 39.5 yearsfor the Company’s buildings and between three and seven years for office furniture and equipment. Leasehold improvements are amortized over their usefullife or the remaining term of the lease, whichever is shorter.
(h) Software Development Costs
All of the software development costs included within continuing operations relate to software which is intended for the Company’s internal use.Direct costs of time and material incurred for the development of application software for internal use are capitalized and amortized using the straight−linemethod over the estimated useful life of the software, ranging from three to eight years.
(i) Deferred Contract Costs
Deferred contract costs consist of contractually recoverable direct set−up costs relating to long−term service contracts in progress. These costsinclude direct and incremental costs incurred prior to the commencement of us providing service to enable us to provide the contracted services to ourcustomer. Such costs are expensed over the period services are provided under the long−term service contract. We review deferred contract costs forimpairment whenever events or changes in circumstances indicate that the carrying amount may not be recoverable. Our review is based on our projectionof the undiscounted future operating cash flows of the related customer project. To the extent such projections indicate that future undiscounted cash flowsare not sufficient to recover the carrying amount, we recognize a non−cash impairment charge to reduce the carrying amount to equal projected futurediscounted cash flows. No impairment charges were recorded in the three years ending September 30, 2010.
(j) Goodwill and Intangible Assets
Goodwill is typically obtained by the Company as a result of business combinations. Goodwill represents the difference between theconsideration paid in acquiring the business and the fair value of the identifiable net assets acquired.
Goodwill is not amortized but is subject to impairment testing on an annual basis, or more frequently if impairment indicators arise. Impairmenttesting is performed at the reporting unit level. A reporting unit is the operating segment, or a business one level below that operating segment (thecomponent level) if discrete financial information is prepared and reviewed regularly by segment management. However, components are aggregated if theyhave similar economic characteristics. We recognize an impairment charge for any amount by which the carrying amount of a reporting unit’s goodwillexceeds its fair value. We use discounted cash flows to establish fair values. When available and as appropriate, we use comparative market multiples tocorroborate the discounted cash flow results. When a portion of a reporting unit is disposed of, goodwill is allocated using the relative fair value method forpurposes of calculating the gain or loss on disposal. In addition, a goodwill impairment test is performed for the remaining portion of the reporting unit.
The Company performs its annual impairment test as of July 1st of each year. At July 1, 2010, the Company performed the annual impairment testbased upon the reporting units in existence at this time, which were consistent with the Company’s operating segments, Consulting and Operations. Basedupon this test, management determined that there had been no impairment of goodwill.
During the fourth quarter, management reorganized the manner in which the Company is operated, which resulted in changes to the operatingsegments and reporting units. A further assessment was made of goodwill at this time, and no impairment was noted.
38

Table of Contents
Intangible assets from acquisitions, which consist primarily of customer contracts and relationships, technology−based intangibles andnon−competition agreements, are amortized using the straight−line method over one to ten years, based on their estimated useful lives.
(k) Long−Lived Assets (excluding Goodwill)
The Company reviews long−lived assets for impairment whenever events or circumstances indicate that the carrying amount of an asset may notbe fully recoverable. An impairment loss is recognized if the sum of the long−term undiscounted cash flows is less than the carrying amount of thelong−lived assets being evaluated and a determination is made that the fair value of the asset is less than its book value. Any write−downs are treated aspermanent reductions in the carrying amount of the assets. The Company believes that the carrying values of its assets as of September 30, 2010 are fullyrealizable.
(l) Legal and Settlement Expense (Recovery), Net
Legal and settlement expense consists of costs, net of reimbursed insurance claims, related to significant legal settlements and non−routine legalmatters, including future probable legal costs estimated to be incurred in connection with those matters. Legal expenses incurred in the ordinary course ofbusiness are included in selling, general and administrative expense.
(m) Income Taxes
Deferred tax liabilities and assets are determined based on the difference between the financial statement and tax basis of assets and liabilitiesusing enacted rates expected to be in effect during the year in which the differences reverse. The effect on deferred tax assets and liabilities due to a changein tax rates is recognized in income tax expense in the period that includes the enactment date. A tax benefit or expense is recognized for the net change inthe deferred tax asset or liability during the year and the current tax liability for the year. As of September 30, 2010, the Company had $4.0 million of netoperating loss carryforwards related to a Canadian subsidiary. A full valuation allowance of $1.1 million has been established against the related deferredtax asset. Evaluating the net operating loss carryforwards requires us to make certain estimates relating to the future operating results and cash flows toassess the valuation of the deferred tax assets.
The Company accounts for uncertain tax positions by recognizing the financial statement effects of a tax position only when, based upon thetechnical merits, it is “more−likely−than−not” that the position will be sustained upon examination.
(n) Comprehensive Income
Comprehensive income includes changes in the balances of the items that are reported directly as separate components of shareholder’s equity.Comprehensive income includes net income plus changes in cumulative foreign currency translation adjustments.
(o) Foreign Currency
The assets and liabilities of foreign operations are translated into U.S. dollars at current exchange rates, and revenue and expenses are translatedat average exchange rates for the period. The resulting cumulative translation adjustment is included in accumulated other comprehensive income on theconsolidated balance sheet. For the years ended September 30, 2008, 2009, and 2010, accumulated foreign currency gains included in accumulated othercomprehensive income (loss) were $3.8 million, $2.7 million, and $6.3 million, respectively. Foreign currency transaction gains (losses), including foreigncurrency gains (losses) on short−term loans with our foreign subsidiaries, are included in other income and were $0.2 million, $0.2 million, and ($0.1 million) for the years ended September 30, 2008, 2009 and 2010, respectively.
(p) Earnings per Share
The Company presents both basic and diluted earnings per share on the face of the Consolidated Statements of Operations.
Basic earnings per share exclude dilution and are computed by dividing net income by the weighted average number of common sharesoutstanding for the period.
39

Table of Contents
Diluted earnings per share reflect potential dilution that could occur if securities or other contracts to issue common stock were exercised orconverted into common stock. Diluted earnings per share include the incremental effect of stock options and restricted stock units calculated using thetreasury stock method.
(q) Fair Value of Financial Instruments
The Company considers the recorded value of its financial assets and liabilities, which consist primarily of cash and cash equivalents, accountsreceivable and accounts payable, acquisition−related contingent consideration and deferred compensation plan liabilities, to approximate the fair value ofthe respective assets and liabilities at September 30, 2009 and 2010.
(r) Use of Estimates
The preparation of financial statements in conformity with accounting principles generally accepted in the United States requires management tomake estimates and assumptions that affect the reported amounts of assets and liabilities, the disclosure of contingent assets and liabilities, and the reportedamounts of revenue and expenses during the reporting period. Actual results could differ from those estimates. Significant estimates used by the Companyinclude estimates of profits or loss on contracts in process, estimates of collectability of receivables, evaluation of asset impairment, accrual of estimatedliabilities, and valuation of acquisition−related contingent consideration liabilities.
(s) Reclassifications
Certain financial results have been reclassified to conform to the current year presentation.
In fiscal 2009, we presented our consolidated balance sheet as of September 30, 2009 to show the assets and liabilities of the ERP division asdiscontinued operations. We also previously reclassified our consolidated statements of operations and statements of cash flows for the years endedSeptember 30, 2008 and 2009 to show the results of this division as discontinued operations. The sale of the ERP division was concluded in 2010 but thecompany retained a single contract. Accordingly, this contract has been removed from discontinued operations for all comparative periods and shown withincontinuing operations.
(t) Contingencies
From time to time, we are involved in legal proceedings, including contract and employment claims, in the ordinary course of business. Weassess the likelihood of any adverse judgments or outcomes to these contingencies as well as potential ranges of probable losses and establish reservesaccordingly. The amount of reserves required may change in future periods due to new developments in each matter or changes in approach to a matter suchas a change in settlement strategy.
2. Recent Accounting Pronouncements
In December 2007, the Financial Accounting Standards Board (“FASB”) issued a new accounting standard that provides guidance for businesscombinations. Under this standard, more transactions will be recorded as business combinations, as it changes the definitions of a business, which would nolonger be required to be self−sustaining or revenue generating, and a business combination, which would include combinations that occur by contract aloneor due to changes in substantive participation rights, such as a lapse in minority veto rights. Certain acquired contingencies will be recorded initially at fairvalue on the acquisition date. After the acquisition, if new information is available, contingent liabilities will be measured at the higher of the likely amountto be paid and the acquisition−date fair value. Contingent assets will be measured subsequently at the lower of the current estimated future amount to berealized and the acquisition−date fair value. Transaction and restructuring costs generally will be expensed as incurred. The Company adopted this standardin the current fiscal year, and applied the standard to the acquisition of DeltaWare (see “Note 3. Acquisition”). The Company will utilize this standard on allsuch future transactions.
In December 2007, the FASB issued a new accounting standard that provides guidance on the accounting and reporting requirements fornoncontrolling interests in financial statements. The guidance requires ownership interests in subsidiaries other than MAXIMUS, Inc. to be clearlyidentified, labeled and presented in the consolidated statement of financial position within equity, but separate from MAXIMUS, Inc.’s equity. It alsorequires the amount of consolidated net income attributable to MAXIMUS, Inc. and to the noncontrolling interest to be clearly identified and presented onthe face of the consolidated statement of income. The Company does not have any material noncontrolling interests and, accordingly, there was no materialimpact on the adoption of this standard.
40

Table of Contents
In February 2008, the FASB issued revised guidance delaying the effective date for requirements relating to the fair valuation of non−financialassets and liabilities, except for items that are recognized or disclosed at fair value in the financial statements on a recurring basis. For items within itsscope, the update deferred the effective date of the fair value measurement to the start of the Company’s current fiscal year, or October 1, 2009. TheCompany has assessed the impact of this guidance for its non−financial assets and liabilities and determined that there was no material impact.
In September 2009, the FASB issued revised guidance for accounting for arrangements that contain more than one contract element. The revisedguidance establishes a selling price hierarchy for determining the selling price of each contract element. The guidance also expands the required disclosures.The Company will adopt this standard on a prospective basis on October 1, 2010. We do not believe the adoption of this standard would have materiallyaffected the accounting treatment for our existing contracts.
3. Acquisition
DeltaWare
On February 10, 2010 (the acquisition date), the Company acquired 100% of the share capital of DeltaWare, Inc. (DeltaWare). DeltaWare is aCanadian company specializing in health administration management systems. MAXIMUS acquired DeltaWare, among other reasons, to broaden its corehealth services offerings and strengthen its position in the administration of public health programs. The acquired assets and business have been integratedinto the Company’s Health Services segment.
The estimated acquisition date fair value of consideration transferred, assets acquired and liabilities are presented below and representmanagement’s best estimates (in thousands).
Cash, net of cash acquired $ 10,385Contingent consideration obligations 3,015Total fair value of consideration $ 13,400
Accounts receivable $ 2,010Other tangible assets 1,571Intangible assets 6,060Total identifiable assets acquired 9,641
Accounts payable and other liabilities 2,125Loans payable 870Deferred revenue 723Total liabilities assumed 3,718
Net identifiable assets acquired 5,923
Goodwill 7,477Net assets acquired $ 13,400
On the acquisition date, we paid $9.1 million to the previous owners of DeltaWare in return for all of the outstanding ownership interests.Additional payments of $1.3 million were made to the previous owners based upon the final calculation of the tangible net worth of the business acquired.
In addition, we may make future additional payments (contingent consideration) totaling up to seven million Canadian Dollars in cash over thecourse of the next seven years. The contingent consideration payments are based upon the achievement of profitability and sales targets over the seven yearperiod.
A liability totaling $3.0 million was recognized for an estimate of the acquisition date fair value of the contingent consideration. We determinedthe fair value of the liability based on a probability−weighted approach derived from management’s own estimates of profitability and sales targets. Anychange in the estimated liability subsequent to the acquisition date fair value will be recognized in earnings in the period in which the change of estimateoccurs. From the acquisition date through September 30, 2010, there has been no change to the estimated liability except foreign exchange fluctuations.
41

Table of Contents
The identifiable assets acquired and liabilities assumed were recognized and measured as of the acquisition date based upon their estimated fairvalues. The excess of the acquisition date fair value of consideration over the estimated fair value of the net assets acquired was recorded as goodwill. TheCompany considers the goodwill to represent a number of potential strategic and financial benefits that are expected to be realized as a result of theacquisition, including, but not limited to bringing new capabilities to MAXIMUS in the adjacent markets and opportunities to expand its geographic reach
The valuation of the intangible assets acquired is summarized below (in thousands).
Useful life Fair valueTechnology−based intangibles 8.5 years $ 3,733Customer contracts and relationships 8−10 years 1,474Non−compete arrangements 4 years 239Trade name 10 years 614Total intangible assets $ 6,060
The total weighted average amortization period is 8.6 years.
The fair value of the accounts receivable balance comprises gross receivables of $2.0 million. There is no material valuation allowance againstthis balance at acquisition.
Of the total fair value of consideration, $7.5 million was allocated to goodwill. Goodwill is not expected to be deductible for income taxpurposes.
DeltaWare contributed $7.0 million of revenue and $0.6 million of net income for the year ending September 30, 2010.
4. Goodwill and Intangible Assets
Changes in goodwill for the years ended September 30, 2009 and 2010 are as follows (in thousands):
Health Services Human Services TotalBalance as of September 30, 2008 $ 35,678 $ 23,781 $ 59,459Goodwill activity during year related to acquisitions — 724 724Foreign currency translation — 846 846Balance as of September 30, 2009 35,678 25,351 61,029Goodwill activity during year related to acquisitions 7,477 1,058 8,535Foreign currency translation 115 1,572 1,687Balance as of September 30, 2010 $ 43,270 $ 27,981 $ 71,251
During the year ended September 30, 2010, the Company acquired DeltaWare, resulting in additional goodwill of $7.5 million (see “Note 3.Acquisition”). The Company also had an adjustment to goodwill of approximately $1.1 million relating to the finalization of amounts related to previousacquisitions.
During the year ended September 30, 2008, the Company acquired 100% of the shares of Westcountry Training and Consultancy ServicesLimited. The transaction included additional purchase consideration contingent upon the attainment of certain business performance criteria. These criteriawere attained during the year ended September 30, 2009.
Included within discontinued operations for 2008 and 2009 were goodwill impairment charges of $7.6 million and $1.2 million respectively. Bothcharges relate to our ERP division which we sold in the current year.
The following table sets forth the components of intangible assets (in thousands):
As of September 30, 2009 As of September 30, 2010
CostAccumulatedAmortization
IntangibleAssets, net Cost
AccumulatedAmortization
IntangibleAssets, net
Technology−based intangible assets $ 3,370 $ 3,370 $ — $ 7,160 $ 3,654 $ 3,506Customer contracts and relationships 6,100 3,645 2,455 8,989 5,504 3,485Non−compete arrangements — — — 243 39 204Trademark — — — 622 39 583Total $ 9,470 $ 7,015 $ 2,455 $ 17,014 $ 9,236 $ 7,778
42

Table of Contents
The intangible assets include $3.4 million of fully−amortized technology−based assets still in use by the Company. Excluding these assets, theCompany’s intangible assets have a weighted average remaining life of 6.4 years, comprising 7.9 years for technology−based intangible assets, 4.5 years forcustomer contracts and relationships, 3.4 years for non−compete arrangements and 9.4 years for the trademark. Amortization expense for the year endedSeptember 30, 2010 was $2.1 million. Future amortization expense is estimated as follows (in thousands):
Year ending September 30, 2011 $ 2,106Year ending September 30, 2012 1,141Year ending September 30, 2013 1,063Year ending September 30, 2014 700Year ending September 30, 2015 677Thereafter 2,091Total $ 7,778
5. Contract Receivables and Deferred Revenue
Uncompleted contracts consist of the following components (in thousands):
Accountsreceivable—
unbilledDeferredrevenue
September 30, 2009:Revenue $ 507,178 $ 1,109,228Billings 487,668 1,137,932Total $ 19,510 $ (28,704)September 30, 2010:Revenue $ 328,505 $ 1,637,295Billings 311,260 1,699,448Total $ 17,245 $ (62,153)
Unbilled accounts receivable and deferred revenue relate primarily to contracts wherein the timing of billings to customers varies based onindividual contracts and often differs from the period of revenue recognition. At September 30, 2009 and 2010, there was $1.5 million and $3.3 million,respectively, billed but not paid by customers pursuant to contractual retainage provisions. Such balances are included in billed accounts receivable in theaccompanying consolidated balance sheets.
At September 30, 2009 and 2010, $2.2 million and $3.1 million of billed long−term contract receivables, net of reserves of $0.6 million and $3.1 million, are included in other assets.
In evaluating the net realizable value of accounts receivable, the Company considers such factors as current economic trends, customercredit−worthiness, and changes in the customer payment terms and collection trends. Changes in the assumptions used in analyzing a specific accountreceivable may result in a reserve being recognized in the period in which the change occurs.
Changes in the reserves against current billed accounts receivable were as follows (in thousands):
Year ended September 30,2008 2009 2010
Balance at beginning of year $ 27,993 $ 4,930 $ 5,249Additions to cost and expense 4,158 1,486 1,594Deductions (27,221) (1,167) (4,998)Balance at end of year $ 4,930 $ 5,249 $ 1,845
43

Table of Contents
Deductions from reserves against billed accounts receivable in fiscal year 2008 of $27.2 million include $21.9 million related to the write−off ofa fully−reserved account receivable due from Accenture. The write−off of the fully−reserved account receivable due from Accenture arose from the relatedsettlement with Accenture in the fourth quarter of fiscal 2008.
6. Property and Equipment
Property and equipment, at cost, consist of the following (in thousands):
As of September 30,2009 2010
Land $ 1,800 $ 1,800Building and improvements 11,318 11,393Office furniture and equipment 79,382 97,714Leasehold improvements 6,281 4,833
98,781 115,740Less: Accumulated depreciation and amortization (53,495) (66,867)Total property and equipment, net $ 45,286 $ 48,873
Fixed asset depreciation expense for the years ended September 30, 2008, 2009 and 2010 was $8.8 million, $8.9 million, and $12.9 millionrespectively.
7. Software Development Costs
Software development costs consist of the following (in thousands):
As of September 30,2009 2010
Capitalized software development costs $ 26,475 $ 35,648Less: Accumulated amortization (7,506) (10,933)Total Software development costs, net $ 18,969 $ 24,715
Capitalized software amortization expense for the years ended September 30, 2008, 2009 and 2010 was $1.8 million, $2.0 million, and$3.4 million respectively.
8. Deferred Contract Costs
Deferred contract costs consist of contractually recoverable direct set−up costs relating to long−term service contracts in progress. These costsinclude direct and incremental costs incurred prior to the commencement of us providing contracted services to our customers totaling $13.0 million and$9.8 million at September 30, 2009 and 2010, respectively. Deferred contract costs are expensed ratably as services are provided under the contracts. AtSeptember 30, 2009 and 2010, accumulated amortization of deferred contract costs was $4.8 million and $3.1 million, respectively.
9. Fair Value Measurements
The Company is required to disclose the fair value of all assets and liabilities subject to fair value measurement and the nature of the valuationtechniques, including their classification within the fair value hierarchy, utilized by the Company in performing these measurements.
The FASB provides a fair value framework which requires the categorization of assets and liabilities into three levels based upon the assumptions(or inputs) used to price the assets or liabilities. Level 1 provides the most reliable measure of fair value, whereas Level 3 generally requires significantmanagement judgment. The three levels are defined as follows:
44

Table of Contents
Level 1: Observable inputs such as quoted prices (unadjusted) in active markets for identical assets or liabilities.
Level 2: Inputs other than quoted prices that are observable for the asset or liability, either directly or indirectly. These include quoted pricesfor similar assets or liabilities in active markets and quoted prices for identical or similar assets or liabilities in markets that are notactive.
Level 3: Unobservable inputs that reflect the reporting entity’s own assumptions.
The Company’s financial assets subject to fair value measurements and the necessary disclosures are as follows (in thousands):
Fair Value as ofSeptember 30,
Fair Value Measurements as of September 30, 2010 Using FairValue Hierarchy
Description 2010 Level 1 Level 2 Level 3Current portion of acquisition−related contingent consideration$ (923) $ — $ — $ (923)Acquisition−related contingent consideration, less current
portion (2,138) — — (2,138)Deferred compensation plan liabilities (9,893) — (9,893) —
The Company’s only acquisition−related contingent consideration liability resulted from the acquisition of DeltaWare in the current fiscal year.The fair value of the acquisition−related contingent consideration liability is based on a probability−weighted approach derived from management’s ownestimates of profitability and sales targets. There has been no change to management’s estimates of profitability and sales targets between the acquisitiondate and September 30, 2010 and the only change to the value of the liability relates to foreign−exchange adjustments, which have been recorded as acomponent of other comprehensive income.
10. Credit Facilities
On January 25, 2008, the Company entered into a Revolving Credit Agreement providing for a senior secured revolving credit facility, withSunTrust Bank as administrative agent, issuing bank and swingline lender, and a syndicate of other lenders (the “Credit Facility”). The Credit Facilityprovides for a $35.0 million revolving line of credit commitment, which may be used (i) for revolving loans, (ii) for swingline loans, subject to a sublimit of$5.0 million, and (iii) to request the issuance of letters of credit on the Company’s behalf, subject to a sublimit of $25.0 million. The Company may requestan increase in the commitment under the Credit Facility, such that the aggregate commitments under the Credit Facility shall at no time exceed$75.0 million. The credit available under the Credit Facility may be used, among other purposes, to refinance the Company’s current indebtedness, torepurchase shares of the Company’s capital stock and to finance the ongoing working capital, capital expenditure, and general corporate needs of theCompany.
Subject to applicable conditions, the Company may elect interest rates on its revolving borrowings calculated by reference to (i) the primelending rate as announced by SunTrust Bank (or, if higher, the federal funds effective rate plus 0.50%) (a “Base Rate Borrowing”), or (ii) the reserveadjusted rate per annum equal to the offered rate for deposits in U.S. dollars for a one (1), two (2), three (3) or six (6) month period in the LondonInter−Bank Market (a “LIBOR Borrowing”), and, in each case, plus an applicable margin that is determined by reference to the Company’s then−currentleverage ratio. For swingline borrowings, the Company will pay interest at the rate of interest for a one (1) month LIBOR Borrowing, plus the applicablemargin, or at a rate to be separately agreed upon by the Company and the administrative agent.
At September 30, 2010, the Company had issued three letters of credit totaling $10.3 million. A letter of credit for $10 million may be called by acustomer in the event that the Company defaults under the terms of a contract. The letter was renewed in March 2010 and expires in March 2011. Twoletters of credit totaling $0.3 million have been issued in relation to the Company’s insurance policies. These letters of credit expire in May 2011 and maybe renewed annually thereafter. At September 30, 2010, the Company has capacity to borrow, subject to covenant constraints, of up to $23.3 million underthis agreement.
The Credit Facility matures on January 25, 2013, at which time all outstanding borrowings must be repaid and all outstanding letters of creditmust be terminated or cash collateralized.
45

Table of Contents
The Credit Facility, as amended by the Company and its lender on December 12, 2008, provides for the payment of specified fees and expenses,including an up−front fee and commitment and letter of credit fees, and contains customary financial and other covenants that require the maintenance ofcertain ratios including a maximum leverage ratio and a minimum fixed charge coverage ratio. The Company was in compliance with all covenants in theamended Credit Facility as of September 30, 2010. The Company’s obligations under the Credit Facility are guaranteed by certain of the Company’s directand indirect subsidiaries (collectively, the “Guarantors”) and are secured by substantially all of MAXIMUS’ and the Guarantors’ present and future tangibleand intangible assets, including the capital stock of subsidiaries and other investment property.
In addition to this credit facility, the Company has a loan agreement with the Atlantic Innovation Fund of Canada, which was acquired as part ofthe DeltaWare acquisition (see “Note 3. Acquisition”). This provides for a loan of up to 1.7 million Canadian Dollars, which must be used for specifictechnology−based research and development. The loan has no interest charge. At September 30, 2010, $1.4 million (1.4 million Canadian Dollars) wasoutstanding under this agreement. The balance will be repayable in forty quarterly installments commencing from July 1, 2012, with the final payment nolater than fiscal 2022. Borrowings using this facility reduce the availability of credit under the Revolving Credit Agreement.
Certain contracts require us to provide a surety bond as a guarantee of performance. At September 30, 2009 and September 30, 2010, theCompany had performance bond commitments totaling $71.1 million and $33.5 million, respectively. These bonds are typically renewed annually andremain in place until the contractual obligations have been satisfied. Although the triggering events vary from contract to contract, in general, we wouldonly be liable for the amount of these guarantees in the event of default in our performance of our obligations under each contract, the probability of whichwe believe is remote.
11. Commitments and Contingencies
Litigation
The Company is involved in various legal proceedings, including the matters described below, in the ordinary course of its business.
In March 2009, a state Medicaid agency asserted a claim against MAXIMUS in the amount of $2.3 million in connection with a contractMAXIMUS had through February 1, 2009 to provide Medicaid administrative claiming services to school districts in the state. MAXIMUS entered intoseparate agreements with the school districts under which MAXIMUS helped the districts prepare and submit claims to the state Medicaid agency which, inturn, submitted claims for reimbursement to the Federal government. No legal action has been initiated. The state has asserted that its agreement withMAXIMUS requires the Company to reimburse the state for the amounts owed to the Federal government. However, the Company’s agreements with theschool districts require them to reimburse MAXIMUS for such payments and therefore MAXIMUS believes the school districts are responsible for anyamounts disallowed by the state Medicaid agency or the Federal government. Accordingly, the Company believes its exposure in this matter is limited to itsfees associated with this work and that the school districts will be responsible for the remainder. During the second quarter of fiscal 2009, MAXIMUSrecorded a $0.7 million reduction of revenue reflecting the fees it earned under the contract. MAXIMUS has exited the Federal healthcare claiming businessand no longer provides the services at issue in this matter.
In August 2010 the Company received a draft audit report prepared on behalf of one of its former SchoolMAX customers. The SchoolMAXbusiness line was sold as part of the divestiture of the MAXIMUS Education Systems division in 2008. The draft audit report recommends a refund ofapproximately $11.6 million primarily arising out of the alleged failure of MAXIMUS and the buyer of the division to observe the most favored customerpricing term of the contract. MAXIMUS believes the audit report is incorrect and that no amounts are owed as a refund. The Company is working with thecustomer to resolve this matter before the audit report is finalized. To the extent that a resolution is not reached, MAXIMUS will contest the matter throughthe dispute resolution process set forth in the contract.
Employment Agreements
The Company has an employment agreement with its chief executive officer with a term ending in fiscal 2014.
Collective bargaining agreements
Approximately 20% of our employees are covered by collective bargaining agreements or similar arrangements. These agreements are typicallyrenewed annually.
46

Table of Contents
12. Leases
The Company leases office space under various operating leases which typically contain clauses permitting cancellation upon certain conditions,including the early termination, non−renewal or material alteration of the related customer contract. The terms of these leases typically provide for certainminimum payments as well as increases in lease payments based upon the operating cost of the facility and the consumer price index. Rent expense for theyears ended September 30, 2008, 2009, and 2010 was $19.5 million, $24.5 million, and $30.2 million respectively.
Minimum future payments under leases in effect as of September 30, 2010 are as follows (in thousands):
OperatingLeases
Year ended September 30,2011 $ 28,9842012 20,6612013 9,4412014 6,1172015 4,585Thereafter 5,106Total minimum lease payments $ 74,894
13. Concentrations of Credit Risk and Major Customers
Financial instruments that potentially subject the Company to significant concentrations of credit risk consist primarily of accounts receivable,billed and unbilled. To date, these financial instruments have been derived from contract revenue earned primarily from federal, state and local governmentagencies located in the United States.
For the years ended September 30, 2008, 2009, and 2010, the Company derived approximately 16%, 11% and 12% respectively, of itsconsolidated revenue from contracts with the State of California, principally within our Health Services segment.
For the years ended September 30, 2008, 2009 and 2010, the Company derived approximately 15%, 18% and 16% respectively, of itsconsolidated revenue from contracts with the State of Texas, principally within our Health Services segment.
For the years ended September 30, 2008, 2009 and 2010, the Company derived approximately 7%, 8% and 16% respectively, of its consolidatedrevenue from contracts with the Government of Australia, wholly within our Human Services segment.
14. Earnings Per Share
The following table sets forth the components of basic and diluted earnings per share (in thousands):
Year ended September 30,2008 2009 2010
Numerator:Income from continuing operations $ 29,462 $ 53,841 $ 69,397Income (loss) from discontinued operations (22,785) (7,301) 1,012Net income $ 6,677 $ 46,540 $ 70,409Denominator:Weighted average shares outstanding 19,060 17,570 17,413Effect of dilutive securities:Employee stock options and unvested restricted stock awards 245 316 552Denominator for diluted earnings per share 19,305 17,886 17,965
In computing diluted earnings per share for the years ended September 30, 2009, 76,000 employee stock options were excluded from thecomputation of diluted loss per share as a result of their anti−dilutive effect. No shares were excluded from the computation in computing earnings per sharein the years ended September 30, 2008 and 2010.
47

Table of Contents
15. Employee Benefit Plans and Deferred Compensation
The Company has 401(k) plans and other defined contribution plans for the benefit of all employees who meet certain eligibility requirements.The plans provide for Company match, specified Company contributions, and/or discretionary Company contributions. During the years endedSeptember 30, 2008, 2009, and 2010, the Company contributed $3.9 million, $3.2 million, and $3.2 million to the 401(k) plans, respectively.
The Company also has a deferred compensation plan, which is a non−qualified plan available to a restricted number of highly−compensatedemployees. The plan enables participants to defer compensation for tax purposes. These deferred employee contributions are held within a rabbi trust withinvestments directed by the respective employees. The assets of the rabbi trust are available to satisfy the claims of general creditors in the event ofbankruptcy of the Company.
During the current year, the Company determined the assets and liabilities associated with the defined compensation plan should be recorded inthe consolidated financial statements. The cumulative effect of the correction during the year resulted in an additional pre−tax charge of $0.3 million and anafter tax charge of $0.3 million. The impact to both the balance sheet and income statement are not material for the year or any previous periods. The planassets contain life insurance policies, which are valued at cash surrender value. The balance sheet at September 30, 2010 includes an addition $0.6 millionof cash and cash equivalents, an asset of $8.3 million related to the other rabbi trust assets, which are held at cash surrender value, and a long−term liabilityof $9.9 million related to the deferred compensation plan liabilities.
16. Shareholders’ Equity
Stock−Based Compensation
The Company’s Board of Directors established stock option plans during 1997 pursuant to which the Company may grant non−qualified stockoptions to officers, employees and directors of the Company. Such plans also provide for stock awards and direct purchases of the Company’s commonstock. At September 30, 2010, 1.4 million shares remained available for grants under the Company’s stock plans. The Company typically issues new sharesin satisfying its obligations under its stock plans.
The Company previously granted stock options to certain employees. These were granted at exercise prices equal to the fair market value of theCompany’s common stock at the date of grant and generally vest ratably over a period of four years. Options issued prior to fiscal 2005 expire ten yearsafter date of grant; those issued since expire after six years. The Company has transitioned towards providing Restricted Stock Units rather than options and,accordingly, no options have been granted since 2008. For the fiscal years ended September 30, 2008, 2009, and 2010, compensation expense related tostock options was $2.7 million, $1.4 million, and $0.8 million, respectively.
The Company issues Restricted Stock Units (RSUs) to officers, employees and directors of the Company under its 1997 Equity Incentive Plan(“Plan”). Generally, RSUs issued before 2009 vest ratably over six years. RSUs issued since then vest ratably over five years. The fair value of the RSUs,based on the Company’s stock price at the grant date, is expensed over the vesting period. For the fiscal years ended September 30, 2008, 2009 and 2010,compensation expense recognized related to RSUs was $6.8 million, $5.9 million and $7.1 million, respectively.
In calculating stock−based compensation cost, the Company takes into account the expected fair value of the awards to be granted to employeesand recognizes this over the service period. The methodology for calculating fair value of stock options typically utilizes the Black−Scholes method. Thevaluation of RSUs is based upon the share price on the day of grant. The Company considers the effect of estimated forfeitures and adjusts for changes inthese estimates over the life of each grant. Stock−based compensation was $9.5 million, $7.3 million and $7.9 million for the fiscal years endedSeptember 30, 2008, 2009 and 2010, respectively.
48

Table of Contents
During the first quarter of fiscal 2008, the Company identified an error in prior periods in recorded stock−based compensation expense related tostock options and RSUs. The error was due, in part, to how the software used by the Company applied estimated forfeiture rates to fully vested stock optionsand RSUs. The impact was to underestimate stock compensation expense by $1.1 million in each of fiscal 2006 and 2007. The Company corrected this errorby recording additional stock compensation expense of $2.2 million in the first quarter of fiscal 2008.
The total income tax benefit recognized in the income statement for share− based compensation arrangements was $3.8 million, $2.9 million and$3.1 million for the fiscal years ended September 30, 2008, 2009 and 2010, respectively.
The weighted average fair value of stock options was estimated at the date of the grant using the Black−Scholes option pricing method with thefollowing assumptions for the fiscal year ended September 30, 2008:
2008Dividend yield 0.9%Risk−free interest rate 4.1%Expected volatility 33%Expected life of option term (in years) 4.3Weighted average fair value at grant date $ 14.12
The dividend yield is based on historical experiences and expected future changes. The risk−free interest rate is derived from the U.S. Treasuryyields in effect at the time of grant. Expected volatilities are based on the historical volatility of our common stock. The expected life of the option isderived from historical data pertaining to option exercises and employee terminations.
A summary of the Company’s stock option activity for the year ended September 30, 2010, is as follows:
OptionsWeighted Average
Exercise PriceOutstanding at September 30, 2009 956,257 $ 32.27Exercised (186,417) 31.91Forfeited or expired (441) 27.04Outstanding at September 30, 2010 769,399 32.36Exercisable at September 30, 2010 754,399 32.21
The intrinsic value of exercisable stock options at September 30, 2010, was $22.2 million with a weighted average remaining life of 2.4 years.
The following table summarizes information pertaining to the stock options vested and exercised for the years presented:
Year ended September 30,2008 2009 2010
Aggregate fair value of all stock options vesting $ 3,300 $ 1,735 $ 1,233Aggregate intrinsic value of all stock options exercised 2,000 1,752 4,730
The following table provides certain information with respect to stock options outstanding at September 30, 2010:
Range ofExercise Prices
Stock OptionsOutstanding
Weighted AverageExercise Price
Weighted AverageRemaining Life
$19.88−$46.20 769,399 32.36 2.01
The following table provides certain information with respect to stock options exercisable at September 30, 2010:
Range ofExercise Prices
Stock OptionsExercisable
Weighted AverageExercise Price
$19.88−$46.20 754,399 32.21
A summary of the Company’s RSU activity for the year ended September 30, 2010, is as follows:
49

Table of Contents
Shares
Weighted−Average
Grant−DateFair Value
Non−vested shares outstanding at September 30, 2009 639,465 $ 33.38Granted 262,884 47.16Vested (158,950) 36.48Forfeited (16,400) 35.28Non−vested shares outstanding at September 30, 2010 726,999 37.64
As of September 30, 2010, the total remaining unrecognized compensation cost related to unvested stock options and RSUs was $0.1 million and$22.0 million, respectively. This charge is expected to be realized over one year for stock options and 4.5 years for RSUs.
Cash flows resulting from the tax benefits generated from tax deductions in excess of the compensation costs recognized for those options andRSUs (excess tax benefits) are classified as financing cash flows.
Stock Repurchase Programs
On November 14, 2007, the Company announced that its Board of Directors had authorized the repurchase of up to $150.0 million of theCompany’s outstanding common stock under an Accelerated Share Repurchase (“ASR”) program. Under the ASR agreement, the Company acquired andretired 3,758,457 shares at an initial price of $39.91 per share for $150.0 million plus fees of approximately $0.4 million. The counter−party purchased anequivalent number of shares in the open market over the nine−month period ended August 15, 2008. Pursuant to the ASR agreement, at its completion theCompany’s initial price under the ASR agreement was adjusted down based on the volume−weighted average price (“VWAP”) of the Company’s stockduring this period. Such adjustment could be settled in cash or stock at the Company’s discretion. On July 11, 2008, the counter−party completed thepurchase of shares in the open market, and the Company elected to receive the price adjustment of $13.9 million in cash. In the fourth quarter of fiscal 2008,this receipt of cash was recorded as a decrease to common stock in the full amount of $13.9 million.
Under a resolution adopted in July 2008, the Board of Directors authorized the repurchase, at management’s discretion, of up to an aggregate of$75.0 million of the Company’s common stock. The resolution also authorized the use of option exercise proceeds for the repurchase of the Company’scommon stock. In September 2010, a further board resolution increased the authorized repurchases by an additional $100 million.
Total share purchases under these plans are summarized as follows (in thousands):
Year ended September 30,2008 2009 2010
Number of share acquired under:ASR Agreement 3,758,457 — —July 2008 and September 2010 resolutions 386,600 927,690 750,764Total 4,145,057 927,690 750,764Total cost of shares (in thousands of dollars) acquired under:ASR Agreement $ 150,400 $ — $ —Price adjustment under ASR Agreement (13,903) — —July 2008 and September 2010 resolutions 14,066 30,046 40,217Total $ 150,563 $ 30,046 $ 40,217
As of November 19, 2010, the Company had repurchased an additional 37,500 shares at a cost of $2.3 million during the first quarter of fiscal2011.
17. Legal and Settlement Expense (Recovery), Net
Legal and settlement expense (recovery), net consists of costs, net of reimbursed insurance claims, related to significant legal settlements andnon−routine legal matters, including future probable legal costs estimated to be incurred in connection with those matters. Legal expenses incurred in theordinary course of business are included in selling, general and administrative expense.
50

Table of Contents
Following a change in accounting standards, from October 1, 2009 the incremental costs of acquisitions, including legal fees, brokerage fees, andvaluation reports, are included in this balance. Under previous accounting guidance, these expenses were included as part of the acquisition consideration ofsuccessful acquisitions. The following table sets forth the matters that represent legal and settlement expense (recovery), net (in thousands):
Year ended September 30,2008 2009 2010
Acquisition expenses $ — $ — $ 254Accenture Arbitration, Related Settlement and Insurance
Recoveries, net 38,377 (6,300) (7,500)Other (19) 2,029 1,895Total $ 38,358 $ (4,271) $ 5,351
In December 2008, MAXIMUS, Accenture LLP and the Texas Health and Human Services Commission (“HHSC”) entered into an agreementsettling all claims among the parties arising from a prime contract between Accenture and HHSC for integrated eligibility services and a subcontractbetween MAXIMUS and Accenture in support of the prime contract. In connection with that settlement, MAXIMUS paid a total of $40.0 million andagreed to provide services to HHSC valued at an additional $10.0 million. The Company’s primary insurance carrier paid $12.5 million of the amount duefrom MAXIMUS at the time of the settlement. In fiscal 2009, the Company recovered an additional $6.3 million from one of its excess insurance carriers,and in fiscal 2010 the Company recovered $7.5 million from another excess insurance carrier.
18. Income Taxes
The Company’s provision for income taxes is as follows (in thousands):
Year ended September 30,2008 2009 2010
Current provision:Federal $ 39,410 $ 5,013 $ 23,712State and local 5,611 1,143 5,197Foreign 2,819 2,266 13,188Total current provision 47,840 8,422 42,097Deferred tax expense (benefit):Federal $ (25,573) $ 21,203 $ (1,678)State and local (4,633) 4,534 (278)Foreign 1,355 734 (1,216)Total deferred tax expense (benefit) (28,851) 26,471 (3,172)Income tax expense $ 18,989 $ 34,893 $ 38,925
The provision for income taxes differs from that which would have resulted from the use of the federal statutory income tax rate as follows (inthousands):
Year ended September 30,2008 2009 2010
Federal income tax provision at statutory rate of 35% $ 16,958 $ 31,057 $ 37,913Valuation allowance on net operating loss carryforwards — (330) (33)Permanent items 886 512 1,263Municipal interest (264) — —State income taxes, net of federal benefit 2,217 3,811 3,153Foreign taxes (595) (518) (2,177)Other (213) 361 (1,194)Income tax expense $ 18,989 $ 34,893 $ 38,925
51

Table of Contents
The significant items comprising the Company’s deferred tax assets and liabilities as of September 30, 2009 and 2010 are as follows (inthousands):
As of September 30,2009 2010
Deferred tax assets—current:Costs deductible in future periods $ 6,823 $ 8,060Deferred revenue 8,043 13,177
Total deferred tax assets—current 14,866 21,237Deferred tax liabilities—current:Accounts receivable—unbilled 9,035 6,701Other 442 1,246Total deferred tax liabilities—current: 9,477 7,947Net deferred tax asset —current $ 5,389 $ 13,290Deferred tax assets (liabilities)—non−current:Non−cash equity compensation $ 4,432 $ 4,852Costs deductible in future periods 3,512 5,093Net operating loss carryforwards 1,853 1,079Valuation allowance on net operating loss carryforwards (1,773) (1,079)Amortization of intangible assets (243) (2,064)Amortization of goodwill 1,591 (164)Depreciation (5,909) (6,723)Capitalized software (3,779) (4,332)Deferred contract costs 177 464Other 1,135 (228)Net deferred tax asset (liability) — non−current $ 996 $ (3,102)
Due to deferred tax assets and liabilities in different tax jurisdictions, the net long−term assets and liabilities are reflected on the accompanyingconsolidated balance sheet as follows (in thousands):
As of September 30,2009 2010
Long−term assets $ 1,239 $ 1,844Long−term liabilities 243 4,946Net deferred tax asset (liability)—non−current $ 996 $ (3,102)
We do not provide for U.S. income taxes on the undistributed earnings of our foreign subsidiaries, as we consider these to be permanentlyreinvested in the operations of such subsidiaries. If some of these earnings were distributed, some countries may impose withholding taxes; in addition, asforeign taxes have been previously paid on these earnings, we would expect to be entitled to a U.S. foreign tax credit that would reduce the U.S. taxes owedon such distributions. As at September 30, 2010, the approximate amount of cumulative earnings from foreign subsidiaries is $44.3 million. The amount oftaxes that may be applicable on earnings planned to be reinvested indefinitely outside the United States is not readily determinable given the various taxplanning alternatives the Company could employ should it decide to repatriate these earnings.
As of September 30, 2010, the Company had $4.0 million of net operating loss carryforwards related to a Canadian subsidiary. A full valuationallowance of $1.1 million has been established against the related deferred tax asset. These net operating loss carryforwards begin to expire at the end offiscal 2013 through fiscal 2017.
Cash paid for income taxes during the years ended September 30, 2008, 2009, and 2010 was $23.8 million, $24.1 million, and $33.3 million,respectively.
Approximately 60% of the Company’s total goodwill is expected to be deductible for income tax purposes.
The Company accounts for uncertain tax positions by recognizing the financial statement effects of a tax position only when, based upon thetechnical merits, it is “more−likely−than−not” that the position will be sustained upon examination. The Company’s net unrecognized tax benefits totaled$2.0 million, $1.9 million, and $1.5 million at September 30, 2008, 2009, and 2010, respectively. The total amount of unrecognized tax benefits that, ifrecognized, would affect the annual effective income tax rate is $1.5 million at September 30, 2010.
52

Table of Contents
The Company has elected to report interest and penalties as a component of income tax expense. In the fiscal years ending September 30, 2008,2009, and 2010, the Company recognized interest expense relating to unrecognized tax benefits of less than $0.1 million in each year. The net liabilitybalance at September 30, 2008, 2009 and 2010 includes approximately $0.2 million, $0.3 million, and $0.3 million, respectively, of interest and penalties.
It is reasonably possible that the total amount of unrecognized tax benefits could decrease by as much as $0.1 million within the next twelvemonths as a result of settlement of expiration of statute of limitations, which could have an impact on the effective tax rate. The anticipated reversals arerelated to state tax items, none of which individually are significant.
The Company recognizes and presents uncertain tax positions on a gross basis (i.e., without regard to likely offsets for deferred tax assets,deductions, and/or credits that would result from payment of uncertain tax amounts). The reconciliation of the beginning and ending amount of grossunrecognized tax benefits is as follows (in thousands):
Year EndedSeptember 30
2008 2009 2010Balance at beginning of year $ 2,439 $ 2,291 $ 2,045Additions based on tax positions related to the current year 79 — 45Reductions for tax positions of prior years (85) — (196)Lapse of statute of limitations (142) (68) —Settlements — (178) (341)Balance at end of year $ 2,291 $ 2,045 $ 1,553
The Company files income tax returns in the United States Federal jurisdiction and in various state and foreign jurisdictions. The Company is nolonger subject to U.S. Federal income tax examinations for years before 2006 and is no longer subject to state and local, or foreign income tax examinationsby tax authorities for years before 2004.
53

Table of Contents
19. Business Segments
During the fourth quarter, the Company aligned its organization of the business to reflect its focus on the administration of government healthand human services programs. As a result of this organizational realignment, the Company has reclassified its segment financial information to reflect thetwo new operating segments of Health Services and Human services. The results of the segments for the three years ended September 30, 2010, as well asinformation related to their asset base, are shown below (in thousands):
Year ended September 30,2008 2009 2010
Revenue:Health Services $ 465,660 $ 495,141 $ 514,258Human Services 233,892 224,967 317,491Total $ 699,552 $ 720,108 $ 831,749Gross Profit:Health services $ 126,729 $ 131,547 $ 130,276Human Services 64,162 59,799 90,557Total $ 190,891 $ 191,346 $ 220,833Selling, General and Administrative expense:Health Services $ 56,553 $ 58,673 $ 65,551Human Services 51,966 47,442 51,067Corporate / Other 1,924 913 2,160Total $ 110,443 $ 107,028 $ 118,778Operating income from continuing operations (before income taxes):Health Services $ 70,176 $ 72,874 $ 64,725Human Services 12,196 12,357 39,490Consolidating adjustments (1,924) (913) (2,160)Gain on sale of building 3,938 — —Legal and settlement expense (recovery), net 38,358 (4,271) (5,351)Total $ 46,028 $ 88,589 $ 107,406Identifiable assets:Health Services $ 169,705 $ 192,121 $ 202,339Human Services 95,394 93,881 190,695Corporate / Other 189,855 147,232 134,707Total $ 454,954 $ 433,234 $ 527,741Depreciation and amortization:Health Services $ 5,504 $ 6,545 $ 9,055Human Services 4,481 4,006 6,623Corporate / Other 2,256 1,681 2,662Total $ 12,241 $ 12,232 $ 18,340
The Company operates in the United States, Australia, Canada, the United Kingdom and Israel.
Revenues for the Company were distributed as follows (in thousands):
Year ended September 30,2008 2009 2010
United States $ 578,346 $ 601,060 $ 606,396Australia 51,570 54,487 135,635Rest of World 69,636 64,561 89,718Total $ 699,552 $ 720,108 $ 831,749
54

Table of Contents
Total assets of the Company were distributed as follows (in thousands):
Year EndedSeptember 30
2009 2010United States $ 348,545 $ 349,795Australia 41,105 84,777Rest of World 43,584 93,169Total $ 433,234 $ 527,741
20. Quarterly Information (Unaudited)
Set forth below are selected quarterly income statement data for the fiscal years ended September 30, 2009 and 2010. The Company derived thisinformation from unaudited quarterly financial statements that include, in the opinion of Company’s management, all adjustments necessary for a fairpresentation of the information for such periods. Results of operations for any fiscal quarter are not necessarily indicative of results for any future period.
The information below differs from information previously reported by the Company on Forms 10−K and 10−Q. As discussed in “Note 19.Business Segments”, the Company has reclassified its segment financial information to reflect the two new operating segments of Health Services andHuman services. As discussed in “Note 21. Discontinued Operations”, in completing this sale of the ERP business, the Company retained a single contractthat was previously reported in discontinued operations. The results of this contract have been reclassified as continuing operations for all periods presented.
Earnings per share amounts are computed independently each quarter. As a result, the sum of each quarter’s earnings per share amount may notequal the total earnings per share amount for the respective year.
Quarter EndedDec. 31,
2008March 31,
2009June 30,
2009Sept. 30,
2009(In thousands, except per share data)
Fiscal Year 2009Revenue:Health Services $ 121,995 $ 121,228 $ 122,415 $ 129,503Human Services 47,715 55,930 56,019 65,303Total revenue 169,710 177,158 178,434 194,806Gross profit 46,904 46,534 47,370 50,538Selling, general and administrative expenses 26,414 26,714 27,255 26,645Operating income from continuing operations:Health Services 20,625 18,429 14,804 19,016Human Services 100 1,746 5,355 5,156Consolidating adjustments (235) (355) (44) (279)Legal and settlement expense (recovery) — 368 (4,829) 190Operating income from continuing operations 20,490 19,452 24,944 23,703Discontinued operations, net of income taxesLoss from discontinued operations (485) (763) (186) (4,300)Loss on disposal (5) — — (1,562)Loss from discontinued operations (490) (763) (186) (5,862)Net income $ 11,963 $ 11,027 $ 14,983 $ 8,567Basic earnings (loss) per share:Income from continuing operations $ 0.70 $ 0.68 $ 0.87 $ 0.82Loss from discontinued operations (0.03) (0.05) (0.01) (0.33)Basic earnings per share $ 0.67 $ 0.63 $ 0.86 $ 0.49Diluted earnings (loss) per share:Income from continuing operations $ 0.69 $ 0.66 $ 0.85 $ 0.80Loss from discontinued operations (0.02) (0.04) (0.01) (0.32)Diluted earnings (loss) per share $ 0.67 $ 0.62 $ 0.84 $ 0.48
55

Table of Contents
Quarter EndedDec. 31,
2009March 31,
2010June 30,
2010Sept. 30,
2010(In thousands, except per share data)
Fiscal Year 2010Revenue:Health Services $ 130,640 $ 127,279 $ 127,307 $ 129,032Human Services 72,680 77,107 84,220 83,484Total revenue 203,320 204,386 211,527 212,516Gross profit 52,175 50,551 57,013 61,094Selling, general and administrative expenses 27,429 28,787 31,658 30,904Operating income from continuing operations:Health Services 17,508 12,723 14,509 19,985Human Services 7,379 9,037 10,684 12,390Consolidating adjustments (141) 4 162 (2,185)Legal and settlement expense (recovery), net 686 (6,037) — —Operating income from continuing operations 24,060 27,801 25,355 30,190Discontinued operations, net of income taxesIncome (loss) from discontinued operations (1,972) 752 1,200 1,060Loss on disposal — — — (28)Income (loss) from discontinued operations (1,972) 752 1,200 1,032Net income $ 12,628 $ 18,743 $ 17,325 $ 21,713Basic earnings per share:Income from continuing operations $ 0.83 $ 1.03 $ 0.93 $ 1.20Income (loss) from discontinued operations (0.11) 0.05 0.06 0.06Basic earnings per share $ 0.72 $ 1.08 $ 0.99 $ 1.26Diluted earnings per share:Income from continuing operations $ 0.81 $ 1.00 $ 0.90 $ 1.16Loss from discontinued operations (0.11) 0.04 0.06 0.06Diluted earnings per share $ 0.70 $ 1.04 $ 0.96 $ 1.22
56

Table of Contents
21. Discontinued Operations
The Company has classified the results of the following divisions within discontinued operations: Enterprise Resource Planning (ERP), SecuritySolutions, Justice Solutions, Education Systems and Asset Solutions. In completing the sale of the ERP division, a single contract was not transferred to thebuyer. The remaining contract has been included within the Human Services segment.
The Company has also classified the results of its Unison MAXIMUS, Inc. subsidiary (Unison) within discontinued operations.
The results of these entities had previously been recorded within operating segments which no longer correspond to the operating segmentsdisclosed in these financial statements. The associated financial position, results of operations, and cash flows of these businesses are reported asdiscontinued operations for all periods presented.
Enterprise Resource Planning (ERP)
On September 30, 2010, the Company sold its ERP division for cash proceeds of $5.6 million, net of transaction costs of $0.7 million, andrecognized a pre−tax loss on sale of less than $0.1 million. The Company previously recorded a pre−tax loss on sale of $1.3 million in fiscal 2009. Incompleting this sale, the Company elected to retain a single contract that had previously been included within the ERP division. This contract hadidentifiable cash flows and requires MAXIMUS to provide services which are dissimilar to other projects within the ERP division.
Security Solutions
On April 30, 2008, the Company sold its Security Solutions division for cash proceeds of $4.6 million, net of transaction costs of $0.4 million,and recognized a pre−tax gain on the sale of $2.9 million.
Unison MAXIMUS, Inc.
On May 2, 2008, the Company sold Unison for proceeds of $6.5 million. The sale transaction was structured as a sale of stock to the managementteam of the subsidiary. The sale price of $6.5 million consists of $0.1 million in cash and $6.4 million in the form of a promissory note secured by (1) asecurity interest in all of the assets of the former subsidiary; (2) a pledge of shares by the buyer; and (3) a personal guaranty by members of the managementteam who are shareholders of the buyer. The Company has deferred recognition of a pre−tax gain on the sale of $3.9 million, and interest income on thepromissory note, until realization is more fully assured. The deferred gain and deferred interest of $4.6 million and $4.5 million is reflected as a deductionfrom the note receivable on the consolidated balance sheets as of September 30, 2009 and 2010, respectively.
Justice Solutions, Education Systems and Asset Solutions
On September 30, 2008, the Company sold its Justice Solutions, Education Systems, and Asset Solutions divisions, which were previouslyreported as part of its Systems Segment. At that time, the Company recognized a pre−tax loss of $12.2 million, subject to adjustment for purchase priceadjustments and estimated transaction costs. During fiscal 2009, the Company reached a final settlement with the purchaser, resulting in a pre−tax gain of$0.7 million.
The following table summarizes the operating results of the discontinued operations included in the Consolidated Statements of Operations (inthousands):
Year Ended September 30,2008 2009 2010
Revenue $ 131,113 $ 29,393 $ 27,054Income (loss) from operations before income taxes $ (28,332) $ (9,478) $ 1,664Provision (benefit) for income taxes (11,182) (3,744) 624Income (loss) from discontinued operations $ (17,150) $ (5,734) $ 1,040Loss on disposal before income taxes $ (9,314) $ (686) $ (45)Provision (benefit) for income taxes (3,679) 881 (17)Loss on disposal $ (5,635) $ (1,567) $ (28)Income (loss) from discontinued operations $ (22,785) $ (7,301) $ 1,012
57

Table of Contents
The following table summarizes the carrying values of the assets and liabilities associated with discontinued operations included in theConsolidated Balance Sheets (in thousands):
As ofSeptember 30,
2009
As ofSeptember 30,
2010Accounts receivable—billed $ 5,250 $ —Accounts receivable—unbilled 8,704 —Prepaid expenses and other current assets 53 —Current assets of discontinued operations $ 14,007 $ —Accounts payable $ 5,919 $ 95Accrued compensation and benefits 909 539Other accrued liabilities 6,995 —Current liabilities of discontinued operations $ 13,823 $ 634
22. Sale of Building
During the year ended September 30, 2008, the Company sold a 21,000 square foot administrative office building in McLean, Virginia forproceeds of $5.9 million, net of transactions costs of $0.2 million, and recognized a pre−tax gain on the sale of $3.9 million. This gain has been classified asgain on sale of building in the consolidated statement of operations.
23. Related Party Transactions
Governor James R. Thompson, one of our outside directors who the Company’s Board of Directors has determined to be independent, is SeniorChairman of the law firm of Winston & Strawn in Chicago. Winston & Strawn has provided certain legal services to the Company. These services wereprovided in the normal course of business on terms and conditions consistent with the standard practices of Winston & Strawn and MAXIMUS. GovernorThompson had no personal involvement in the services provided. In 2008, 2009, and 2010, the Company paid Winston & Strawn $620,800, $934,391 and$150,609, respectively. These transactions do not represent a significant portion of Winston & Strawn’s annual revenues.
24. Subsequent Events
Dividend
On October 8, 2010, the Company’s Board of Directors declared a quarterly cash dividend of $0.12 for each share of the Company’s commonstock outstanding. The dividend will be paid on November 30, 2010 to shareholders of record on November 15, 2010. Based on the number of sharesoutstanding, the payment will be approximately $2.1 million.
Share Repurchases
As of November 19, 2010, the Company had repurchased an additional 37,500 shares at a cost of $2.3 million during the first quarter of fiscal2011.
58

Table of Contents
ITEM 9. Changes in and Disagreements with Accountants on Accounting and Financial Disclosure.
None.
ITEM 9A. Controls and Procedures.
Evaluation of Disclosure Controls and Procedures. Our management, with the participation of our principal executive officer and principalfinancial officer, has evaluated the effectiveness of the design and operation of our disclosure controls and procedures (as defined in Rule 13a−15(e) underthe Securities Exchange Act of 1934 (the “Exchange Act”)) as of the end of the period covered by this Annual Report on Form 10−K. Based on thisevaluation, our principal executive officer and principal financial officer concluded that our disclosure controls and procedures are effective and designed toensure that the information required to be disclosed in our reports filed or submitted under the Exchange Act is recorded, processed, summarized andreported within the requisite time periods.
Management’s Report on Internal Control Over Financial Reporting. Our management is responsible for establishing and maintaining adequateinternal control over financial reporting (as defined in Rule 13a−15(f) under the Exchange Act). Our internal control over financial reporting is designed toprovide reasonable assurance regarding the reliability of our financial reporting and the preparation of published financial statements in accordance withgenerally accepted accounting principles.
Because of its inherent limitations, internal control over financial reporting may not prevent or detect misstatements. Therefore, even thosesystems determined to be effective can provide only reasonable assurance with respect to financial statement preparation and presentation. Also, projectionsof any evaluation of effectiveness to future periods are subject to the risk that controls may become inadequate because of changes in conditions, or that thedegree of compliance with the policies or procedures may deteriorate.
Management assessed the effectiveness of our internal control over financial reporting as of September 30, 2010. In making this assessment,management used the criteria set forth by the Committee of Sponsoring Organizations of the Treadway Commission (COSO) in InternalControl—Integrated Framework. Based on our assessment, we believe that as of September 30, 2010, our internal control over financial reporting waseffective based on criteria set forth by COSO in Internal Control—Integrated Framework.
The attestation report concerning the effectiveness of our internal control over financial reporting as of September 30, 2010, issued by Ernst &Young LLP, the independent registered public accounting firm who also audited our consolidated financial statements, is included following this Item 9A.
Changes in Internal Control Over Financial Reporting. During the fourth quarter of fiscal 2010, the Company completed the phasedimplementation of an enterprise resource planning system and completed installation of core financial modules for all US based divisions. We have updatedthe Company’s internal controls over financial reporting as necessary to accommodate modifications to business processes and accounting procedures.However, the internal control design remained substantially unchanged for the implementation.
Other than the matter noted above, there was no change in our internal control over financial reporting (as defined in Rules 13a−15(f) and15d−15(f) under the Exchange Act) identified in connection with the evaluation of our internal control that occurred during our fourth fiscal quarter of 2010that has materially affected, or is reasonably likely to materially affect, our internal control over financial reporting.
59

Table of Contents
REPORT OF INDEPENDENT REGISTERED PUBLIC ACCOUNTING FIRM
The Board of Directors and Shareholders of MAXIMUS, Inc.
We have audited MAXIMUS, Inc.’s internal control over financial reporting as of September 30, 2010, based on criteria established in InternalControl—Integrated Framework issued by the Committee of Sponsoring Organizations of the Treadway Commission (the COSO criteria). MAXIMUS,Inc’s management is responsible for maintaining effective internal control over financial reporting, and for its assessment of the effectiveness of internalcontrol over financial reporting included in the accompanying Management Report on Internal Control Over Financial Reporting. Our responsibility is toexpress an opinion on the company’s internal control over financial reporting based on our audit.
We conducted our audit in accordance with the standards of the Public Company Accounting Oversight Board (United States). Those standardsrequire that we plan and perform the audit to obtain reasonable assurance about whether effective internal control over financial reporting was maintained inall material respects. Our audit included obtaining an understanding of internal control over financial reporting, assessing the risk that a material weaknessexists, testing and evaluating the design and operating effectiveness of internal control based on the assessed risk, and performing such other procedures aswe considered necessary in the circumstances. We believe that our audit provides a reasonable basis for our opinion.
A company’s internal control over financial reporting is a process designed to provide reasonable assurance regarding the reliability of financialreporting and the preparation of financial statements for external purposes in accordance with generally accepted accounting principles. A company’sinternal control over financial reporting includes those policies and procedures that (1) pertain to the maintenance of records that, in reasonable detail,accurately and fairly reflect the transactions and dispositions of the assets of the company; (2) provide reasonable assurance that transactions are recorded asnecessary to permit preparation of financial statements in accordance with generally accepted accounting principles, and that receipts and expenditures ofthe company are being made only in accordance with authorizations of management and directors of the company; and (3) provide reasonable assuranceregarding prevention or timely detection of unauthorized acquisition, use, or disposition of the company’s assets that could have a material effect on thefinancial statements.
Because of its inherent limitations, internal control over financial reporting may not prevent or detect misstatements. Also, projections of anyevaluation of effectiveness to future periods are subject to the risk that controls may become inadequate because of changes in conditions, or that the degreeof compliance with the policies or procedures may deteriorate.
In our opinion, MAXIMUS, Inc. maintained, in all material respects, effective internal control over financial reporting as of September 30, 2010,based on the COSO criteria.
We also have audited, in accordance with the standards of the Public Company Accounting Oversight Board (United States), the 2010consolidated financial statements of MAXIMUS, Inc. and our report dated November 19, 2010 expressed an unqualified opinion thereon.
/s/ Ernst & Young LLP
McLean, VirginiaNovember 19, 2010
60

Table of Contents
PART III
The information required by Items 10, 11, 12, 13 and 14 of Part III of Form 10−K has been omitted in reliance on General Instruction G(3) toForm 10−K and is incorporated herein by reference to the Company’s Proxy Statement relating to its Annual Meeting of Shareholders scheduled for March18, 2011 (the “Proxy Statement”) to be filed with the SEC, except as otherwise indicated below:
ITEM 10. Directors, Executive Officers and Corporate Governance.
The information required by this Item is incorporated by reference to the Proxy Statement.
ITEM 11. Executive Compensation.
The information required by this Item is incorporated by reference to the Proxy Statement.
ITEM 12. Security Ownership of Certain Beneficial Owners and Management and Related Stockholder Matters.
Except for the information disclosed in this Item below, the information required by this Item is incorporated by reference to the ProxyStatement.
Securities Authorized for Issuance Under Equity Compensation Plans
The following table provides information as of September 30, 2010 with respect to shares of our common stock that may be issued under ourexisting equity compensation plans:
Number of securities to beissued upon exercise ofoutstanding options,warrants and rights
Weighted averageexercise price of
outstanding options,warrants and rights
Number of securities remainingavailable for future issuance under
equity compensation plans(1)Equity compensation plans/arrangements approved by
the shareholders(2) 1,496,398 $ 16.56 1,406,442Equity compensation plans/arrangements not
approved by the shareholders — — —Total 1,496,398 $ 16.56 1,406,442
(1) In addition to being available for future issuance upon exercise of options that may be granted after September 30, 2010, all shares under the 1997Equity Incentive Plan may be issued in the form of restricted stock, performance shares, stock appreciation rights, stock units, or other stock−based awards.
(2) Includes the 1997 Equity Incentive Plan, the 1997 Employee Stock Purchase Plan and the 1997 Director Stock Option Plan.
ITEM 13. Certain Relationships and Related Transactions, and Director Independence.
The information required by this Item is incorporated by reference to the Proxy Statement.
ITEM 14. Principal Accounting Fees and Services.
The information required by this Item is incorporated by reference to the Proxy Statement.
61

Table of Contents
PART IV
ITEM 15. Exhibits, Financial Statement Schedules.
(a) 1. Financial Statements.The consolidated financial statements are listed under Item 8 of this Annual Report on Form 10−K.
2. Financial Statement Schedules.None. Financial statement schedules are either not required under the related instructions or are inapplicable and therefore have been omitted.
3. Exhibits.The Exhibits filed as part of this Annual Report on Form 10−K are listed on the Exhibit Index immediately preceding such Exhibits, whichExhibit Index is incorporated herein by reference.
(b) Exhibits—see Item 15(a)(3) above.(c) Financial Statement Schedules—see Item 15(a)(2) above.
62

Table of Contents
SIGNATURES
Pursuant to the requirements of Section 13 or 15(d) of the Securities Exchange Act of 1934, as amended, the registrant has duly caused thisAnnual Report on Form 10−K to be signed on its behalf by the undersigned, thereunto duly authorized on the 19th day of November 2010.
MAXIMUS, INC.By: /s/ RICHARD A. MONTONI
Richard A. MontoniChief Executive Officer
Pursuant to the requirements of the Securities Exchange Act of 1934, as amended, this Annual Report on Form 10−K has been signed below bythe following persons on behalf of the registrant and in the capacities and on the dates indicated.
Signature Title Date/s/ RICHARD A. MONTONI President, Chief Executive Officer and Director
(principal executive officer)November 19, 2010
Richard A. Montoni
/s/ DAVID N. WALKER Chief Financial Officer and Treasurer (principalfinancial and accounting officer)
November 19, 2010David N. Walker
/s/ PETER B. POND Chairman of the Board of Directors November 19, 2010Peter B. Pond
/s/ RUSSELL A. BELIVEAU Director November 19, 2010Russell A. Beliveau
/s/ JOHN J. HALEY Director November 19, 2010John J. Haley
/s/ PAUL R. LEDERER Director November 19, 2010Paul R. Lederer
/s/ RAYMOND B. RUDDY Director November 19, 2010Raymond B. Ruddy
/s/ MARILYN R. SEYMANN Director November 19, 2010Marilyn R. Seymann
/s/ JAMES R. THOMPSON, JR. Director November 19, 2010James R. Thompson, Jr.
/s/ WELLINGTON E. WEBB Director November 19, 2010Wellington E. Webb
63

Table of Contents
EXHIBIT INDEX
ExhibitNumber
3.1 Amended and Restated Articles of Incorporation of the Company, as amended.(1)3.2 Amended and Restated Bylaws of the Company.(2)4.1 Specimen Common Stock Certificate.(3)
10.1 1997 Equity Incentive Plan, as amended.(4)*10.2 First Amendment to the 1997 Equity Incentive Plan, as amended.(5)*10.3 1997 Director Stock Option Plan, as amended.(6)*10.4 1997 Employee Stock Purchase Plan, as amended.(7)*10.5 Executive Employment, Non−Compete and Confidentiality Agreement by and between the Company and Richard A. Montoni.(8)*10.6 First Amendment to the Executive Employment, Non−Compete and Confidentiality Agreement by and between the Company and Richard
A. Montoni.(5)*10.7 Executive Employment, Non−Compete and Confidentiality Agreement by and between the Company and Bruce Caswell.(5)*10.8 First Amendment to the Executive Employment, Non−Compete and Confidentiality Agreement by and between the Company and Bruce
Caswell.(5)*10.9 Form of Indemnification Agreement by and between the Company and each of the directors of the Company.(9)*
10.10 Amended and Restated Income Continuity Program.(5)*10.11 Deferred Compensation Plan, as amended.(5)*10.12 1997 Equity Incentive Plan—Restricted Stock Units—Terms and Conditions.(10)10.13 1997 Equity Incentive Plan—Non−Qualified Stock Option—Terms and Conditions.(10)10.14 Purchase Agreement between MAXIMUS, Inc. and UBS AG, London Branch, dated November 15, 2007.(11)10.15 Revolving Credit Agreement, dated January 25, 2008, by and among MAXIMUS, Inc., as borrower, SunTrust Bank as administrative agent,
issuing bank and swingline lender and the other lender parties thereto.(12)10.16 Security Agreement, dated January 25, 2008, among MAXIMUS, Inc. and certain subsidiaries of MAXIMUS, Inc., in favor of SunTrust
Bank.(12)10.17 Pledge Agreement, dated January 25, 2008, by and among MAXIMUS, Inc. and certain subsidiaries of MAXIMUS, Inc., in favor of
SunTrust Bank.(12)10.18 Extension of Employment Agreement of Richard A. Montoni, dated December 22, 2009 (13)*
21.1 Subsidiaries of the Company. Filed herewith.23.1 Consent of Independent Registered Public Accounting Firm. Filed herewith.31.1 Certification Pursuant to Section 302 of the Sarbanes−Oxley Act of 2002. Filed herewith.31.2 Certification Pursuant to Section 302 of the Sarbanes−Oxley Act of 2002. Filed herewith.32.1 Section 906 Principal Executive Officer Certification. Furnished herewith.32.2 Section 906 Principal Financial Officer Certification. Furnished herewith.99.1 Special Considerations and Risk Factors. Filed herewith.
* Denotes management contract or compensation plan.
(1) Filed as an exhibit to the Company’s Quarterly Report on Form 10−Q for the quarter ended June 30, 2000 (File No. 1−12997) on August 14, 2000and incorporated herein by reference.
(2) Filed as an exhibit to the Company’s Quarterly Report on Form 10−Q for the quarter ended December 31, 2007, (File No. 1−12997) on February 8,2008 and incorporated herein by reference.
(3) Filed as an exhibit to the Company’s Quarterly Report on Form 10−Q for the quarter ended June 30, 1997 (File No. 1−12997) on August 14, 1997and incorporated herein by reference.
(4) Filed as an exhibit to the Company’s Registration Statement on Form S−8 (File No. 333−136400) on August 8, 2006 and incorporated herein byreference.
(5) Filed as an exhibit to the Company’s Current Report on Form 8−K (File No. 1−12997) on November 27, 2007 and incorporated herein by reference.
(6) Filed as an exhibit to the Company’s Annual Report on Form 10−K for the year ended September 30, 1997 (File No. 1−12997) on December 22,1997 and incorporated herein by reference.
64

Table of Contents
(7) Filed as an exhibit to the Company’s Registration Statement on Form S−8 (File No. 333−122711) on February 10, 2005 and incorporated herein byreference.
(8) Filed as an exhibit to the Company’s Current Report on Form 8−K (File No. 1−12997) on April 26, 2006 and incorporated herein by reference.
(9) Filed as an exhibit to the Company’s Registration Statement on Form S−1 (File No. 333−21611) on February 12, 1997 and incorporated herein byreference.
(10) Filed as an exhibit to the Company’s Current Report on Form 8−K (File No. 1−12997) on June 23, 2006 and incorporated herein by reference.
(11) Filed as an exhibit to the Company’s Current Report on Form 8−K (File No. 1−12997) on November 20, 2007 and incorporated herein by reference.
(12) Filed as an exhibit to the Company’s Current Report on Form 8−K (File No. 1−12997) on January 29, 2008 and incorporated herein by reference.
(13) Filed as an exhibit to the Company’s Quarterly Report on Form 10−Q for the Quarter ended December 31, 2009 (File No. 1−12997) on February 4,2010 and incorporated herein by reference.
65

EXHIBIT 21.1
MAXIMUS, Inc.List of Subsidiaries
As of September 30, 2010
Name*Jurisdiction of
Incorporation/OrganizationMAXNetwork Pty Limited AustraliaACN 083 406 795 Pty Limited AustraliaMAXIMUS Canada, Inc. CanadaMAXIMUS Canada II, Inc. CanadaIsrael Workforce Solutions Ltd(1) IsraelMAXIMUS Properties LLC VirginiaMAXIMUS International, LLC VirginiaMAXIMUS Federal Services, Inc. VirginiaMAXIMUS Consulting Services, Inc. VirginiaMAXIMUS Health Services, Inc. IndianaMAXIMUS Human Services, Inc. VirginiaMAXIMUS ERP Solutions, LLC VirginiaMAXIMUS Education Services, LLC VirginiaAll subsidiaries are 100% owned by MAXIMUS, unless otherwise noted
(1)—Owned 55% by MAXIMUS
* This list identifies all subsidiaries that are directly owned by MAXIMUS at the “first tier” of its corporate structure. The names of all of thesubsidiaries of these “first tier” subsidiaries have been omitted from this list because, considered in the aggregate, they would not constitute a significantsubsidiary under Securities and Exchange Commission Regulation S−X, Rule 1−02(w).

EXHIBIT 23.1
CONSENT OF INDEPENDENT REGISTERED PUBLIC ACCOUNTING FIRM
We consent to the incorporation by reference in the following Registration Statements:
(1)Registration Statements (Form S−8, Nos. 333−88012, 333−41871, 333−62380, 333−75263 and 333−136400) pertaining to the 1997 Equity Incentive Planof MAXIMUS, Inc.
(2)Registration Statement (Form S−8, Nos. 333−41867 and 333−122711) pertaining to the 1997 Employee Stock Purchase Plan of MAXIMUS, Inc. and
(3)Registration Statement (Form S−8, No. 333−41869) pertaining to the 1997 Director Stock Option Plan of MAXIMUS, Inc.
of our report dated November 19, 2010 with respect to the consolidated financial statements of MAXIMUS, Inc., and our report dated November 19, 2010with respect to the effectiveness of internal control over financial reporting of MAXIMUS, Inc., included in the Annual Report (Form 10−K) for the yearended September 30, 2010.
/s/Ernst & Young LLP
McLean, VirginiaNovember 19, 2010

EXHIBIT 31.1
Certification Pursuant to Section 302 of the Sarbanes−Oxley Act of 2002
I, Richard A. Montoni, certify that:
1. I have reviewed this Annual Report on Form 10−K of MAXIMUS, Inc.;
2. Based on my knowledge, this report does not contain any untrue statement of a material fact or omit to state a material fact necessary to make thestatements made, in light of the circumstances under which such statements were made, not misleading with respect to the period covered by this report;
3. Based on my knowledge, the financial statements, and other financial information included in this report, fairly present in all material respects thefinancial condition, results of operations and cash flows of the registrant as of, and for, the periods presented in this report;
4. The registrant’s other certifying officer and I are responsible for establishing and maintaining disclosure controls and procedures (as defined inExchange Act Rules 13a−15(e) and 15d−15(e)) and internal control over financial reporting (as defined in Exchange Act Rules 13a−15(f) and 15d−15(f))for the registrant and have:
a) Designed such disclosure controls and procedures, or caused such disclosure controls and procedures to be designed under our supervision, to ensurethat material information relating to the registrant, including its consolidated subsidiaries, is made known to us by others within those entities, particularlyduring the period in which this report is being prepared;
b) Designed such internal control over financial reporting, or caused such internal control over financial reporting to be designed under our supervision,to provide reasonable assurance regarding the reliability of financial reporting and the preparation of financial statements for external purposes inaccordance with generally accepted accounting principles;
c) Evaluated the effectiveness of the registrant’s disclosure controls and procedures and presented in this report our conclusions about the effectivenessof the disclosure controls and procedures, as of the end of the period covered by this report based on such evaluation; and
d) Disclosed in this report any change in the registrant’s internal control over financial reporting that occurred during the registrant’s most recent fiscalquarter (the registrant’s fourth fiscal quarter in the case of an annual report) that has materially affected, or is reasonably likely to materially affect, theregistrant’s internal control over financial reporting.
5. The registrant’s other certifying officer and I have disclosed, based on our most recent evaluation of internal control over financial reporting, to theregistrant’s auditors and the audit committee of the registrant’s board of directors (or persons performing the equivalent functions):
a) All significant deficiencies and material weaknesses in the design or operation of internal control over financial reporting which are reasonablylikely to adversely affect the registrant’s ability to record, process, summarize and report financial information; and
b) Any fraud, whether or not material, that involves management or other employees who have a significant role in the registrant’s internal control overfinancial reporting.
Dated: November 19, 2010 /s/ RICHARD A. MONTONIRichard A. MontoniChief Executive Officer
EXHIBIT 31.2
Certification Pursuant to Section 302 of the Sarbanes−Oxley Act of 2002
I, David N. Walker, certify that:
1. I have reviewed this Annual Report on Form 10−K of MAXIMUS, Inc.;
2. Based on my knowledge, this report does not contain any untrue statement of a material fact or omit to state a material fact necessary to make thestatements made, in light of the circumstances under which such statements were made, not misleading with respect to the period covered by this report;
3. Based on my knowledge, the financial statements, and other financial information included in this report, fairly present in all material respects thefinancial condition, results of operations and cash flows of the registrant as of, and for, the periods presented in this report;
4. The registrant’s other certifying officer and I are responsible for establishing and maintaining disclosure controls and procedures (as defined inExchange Act Rules 13a−15(e) and 15d−15(e)) and internal control over financial reporting (as defined in Exchange Act Rules 13a−15(f) and 15d−15(f))for the registrant and have:
a) Designed such disclosure controls and procedures, or caused such disclosure controls and procedures to be designed under our supervision, to ensurethat material information relating to the registrant, including its consolidated subsidiaries, is made known to us by others within those entities, particularlyduring the period in which this report is being prepared;
b) Designed such internal control over financial reporting, or caused such internal control over financial reporting to be designed under our supervision,to provide reasonable assurance regarding the reliability of financial reporting and the preparation of financial statements for external purposes inaccordance with generally accepted accounting principles;
c) Evaluated the effectiveness of the registrant’s disclosure controls and procedures and presented in this report our conclusions about the effectivenessof the disclosure controls and procedures, as of the end of the period covered by this report based on such evaluation; and
d) Disclosed in this report any change in the registrant’s internal control over financial reporting that occurred during the registrant’s most recent fiscalquarter (the registrant’s fourth fiscal quarter in the case of an annual report) that has materially affected, or is reasonably likely to materially affect, theregistrant’s internal control over financial reporting.
5. The registrant’s other certifying officer and I have disclosed, based on our most recent evaluation of internal control over financial reporting, to theregistrant’s auditors and the audit committee of the registrant’s board of directors (or persons performing the equivalent functions):
a) All significant deficiencies and material weaknesses in the design or operation of internal control over financial reporting which are reasonablylikely to adversely affect the registrant’s ability to record, process, summarize and report financial information; and
b) Any fraud, whether or not material, that involves management or other employees who have a significant role in the registrant’s internal control overfinancial reporting.
Dated: November 19, 2010 /s/ DAVID N. WALKERDavid N. WalkerChief Financial Officer

EXHIBIT 32.1
Section 906 CEO Certification
I, Richard A. Montoni, Chief Executive Officer of MAXIMUS, Inc. (“the Company”), do hereby certify, under the standards set forth in andsolely for the purposes of 18 U.S.C. Section 1350, as adopted pursuant to Section 906 of the Sarbanes−Oxley Act of 2002, that, to my knowledge:
1. The Annual Report on Form 10−K of the Company for the fiscal year ended September 30, 2010 (the “Annual Report”) fully complies with therequirements of Section 13(a) or 15(d) of the Securities Exchange Act of 1934 (15 U.S.C. Section 78m or 78o(d)) and
2. The information contained in the Annual Report fairly presents, in all material respects, the financial condition and results of operations of theCompany.
Dated: November 19, 2010 /s/ RICHARD A. MONTONIRichard A. MontoniChief Executive Officer

EXHIBIT 32.2
Section 906 CFO Certification
I, David N. Walker, Chief Financial Officer of MAXIMUS, Inc. (“the Company”), do hereby certify, under the standards set forth in and solelyfor the purposes of 18 U.S.C. Section 1350, as adopted pursuant to Section 906 of the Sarbanes−Oxley Act of 2002, that, to my knowledge:
1. The Annual Report on Form 10−K of the Company for the fiscal year ended September 30, 2010 (the “Annual Report”) fully complies with therequirements of Section 13(a) or 15(d) of the Securities Exchange Act of 1934 (15 U.S.C. Section 78m or 78o(d)) and
2. The information contained in the Annual Report fairly presents, in all material respects, the financial condition and results of operations of theCompany.
Dated: November 19, 2010 /s/ DAVID N. WALKERDavid N. WalkerChief Financial Officer

EXHIBIT 99.1
Special Considerations and Risk Factors
From time to time, we may make forward−looking public statements, such as statements concerning our then−expected future revenue orearnings or concerning projected plans, performance or contract procurement, as well as other estimates relating to future operations. Forward−lookingstatements may be in reports filed under the Securities Exchange Act of 1934, as amended (the “Exchange Act”), in press releases or in informal statementsmade with the approval of an authorized executive officer. The words or phrases “will likely result,” “are expected to,” “will continue,” “is anticipated,”“estimate,” “project,” “believe,” “could,” “intend,” “may,” “opportunity,” “plan,” “potential” or similar terms and expressions are intended to identify“forward−looking statements” within the meaning of Section 21E of the Exchange Act and Section 27A of the Securities Act of 1933, as amended, asenacted by the Private Securities Litigation Reform Act of 1995.
We wish to caution you not to place undue reliance on these forward−looking statements that speak only as of the date on which they are made.In addition, we wish to advise you that the factors listed below, as well as other factors we have not currently identified, could affect our financial or otherperformance and could cause our actual results for future periods to differ materially from any opinions or statements expressed with respect to futureperiods or events in any current statement.
We will not undertake and we specifically decline any obligation to publicly release revisions to these forward−looking statements to reflecteither a circumstance after the date of the statements or the occurrence of events that may cause us to re−evaluate our forward−looking statements.
In connection with the “safe harbor” provisions of the Private Securities Litigation Reform Act, we are hereby filing the following cautionarystatements identifying important factors that could cause our actual results to differ materially from those projected in forward−looking statements made byus or on our behalf:
We may be subject to fines, penalties and other sanctions if we fail to comply with federal, state and local laws governing our business.
Our business lines operate within a variety of complex regulatory schemes, including but not limited to the Federal Acquisition Regulation(“FAR”), Cost Accounting Standards, the Truth in Negotiations Act, the Fair Debt Collection Practices Act (and analogous state laws), as well as theregulations governing Medicaid and Medicare. If a government audit uncovers improper or illegal activities by us or we otherwise determine that theseactivities have occurred, we may be subject to civil and criminal penalties and administrative sanctions, including termination of contracts, forfeitures ofprofits, suspension of payments, fines and suspension or disqualification from doing business with the government. Any adverse determination couldadversely impact our ability to bid in response to requests for proposals (“RFPs”) in one or more jurisdictions. Further, as a government contractor subjectto the types of regulatory schemes described above, we are subject to an increased risk of investigations, criminal prosecution, civil fraud, whistleblowerlawsuits and other legal actions and liabilities to which private sector companies are not, the result of which could have a material adverse effect on ouroperations.
If we fail to satisfy our contractual obligations or meet performance standards, our contracts may be terminated and we may incur significant costsor liabilities, including liquidated damages and penalties, which could adversely impact our operating results, financial condition and our ability tocompete for future contracts.
Our contracts may be terminated for our failure to satisfy our contractual obligations or to meet performance standards and often require us toindemnify customers. In addition, some of our contracts contain substantial liquidated damages provisions and financial penalties related to performancefailures. Although we have liability insurance, the policy coverage and limits may not be adequate to provide protection against all potential liabilities.Further, for certain contracts, we have posted significant performance bonds or issued letters of credit to secure our indemnification and other obligations. Ifa claim is made against a performance bond or letter of credit, we would be required to reimburse the issuer for the amount of the claim. Consequently, as aresult of the above matters, we may incur significant costs or liabilities, including penalties, which could adversely impact our operating results, financialcondition and our ability to compete for future contracts.
We are subject to review and audit by federal, state and local governments at their sole discretion and, if any improprieties are found, we may berequired to refund revenue we have received, or forego anticipated revenue, which could have a material adverse impact on our revenues and ourability to bid in response to RFPs.

As a provider of services to government agencies, we are subject to periodic audits and other reviews by Federal, state and local governments ofour costs and performance, accounting and general business practices relating to our contracts with those government agencies. As part of that process, thegovernment agency reviews our performance on the contract, our pricing practices, our cost structure and our compliance with applicable laws, regulationsand standards. Based on the results of these audits, government agencies may demand refunds or adjust our contract−related costs and fees, includinginternal costs and expense allocation. Although adjustments arising from government audits and reviews have not had a material adverse effect on ourresults of operations in the past, there can be no assurance that future audits and reviews would not have such effects.
We may face liabilities arising from divested or discontinued businesses.
During 2008 we divested our Security Solutions, Unison, Education Systems, Justice Solutions and Asset Solutions businesses. During fiscal2010, we divested our ERP Solutions business. The transaction documents for those divestitures contain a variety of representations, warranties andindemnification obligations. We could face indemnification claims and liabilities from alleged breaches of representations or warranties. In addition, themajority of our customer contracts require customer consent to assign those contracts to a third party. Although we are cooperating with the buyers of thosebusinesses to obtain all customer consents, a customer could refuse to consent to an assignment and seek to hold us liable for performance problems or othercontractual obligations.
During 2009 we exited the revenue maximization business. Although we no longer provide those services, former projects that we performed forstate clients remain subject to Federal audits. Our contracts for that business generally provide that the company will refund the portion of its fee associatedwith any Federal disallowance. Accordingly, we may be obligated to refund amounts paid for such revenue maximization services depending on theoutcome of future Federal audits.
If we fail to accurately estimate the factors upon which we base our contract pricing, we may generate less profit than expected or incur losses onthose contracts.
We derived approximately 21% of our fiscal 2010 revenue from fixed−price contracts and approximately 47% of our fiscal 2010 revenue fromperformance−based contracts. For fixed−price contracts, we receive our fee based on services provided. Those services might include operating a Medicaidenrollment center pursuant to specified standards, designing and implementing computer systems or applications, or delivering a planning document under aconsulting arrangement. For performance−based contracts, we receive our fee on a per−transaction basis. These contracts include, for example, childsupport enforcement contracts, in which we often receive a fee based on the amount of child support collected. To earn a profit on these contracts, we mustaccurately estimate costs involved and assess the probability of completing individual transactions within the contracted time period. If our estimates proveto be inaccurate, we may not achieve the level of profit we expected or we may incur a net loss on a contract. Although we believe that we have recordedadequate provisions in our financial statements for losses on our fixed−price and cost−plus contracts, as required under U.S. generally accepted accountingprinciples, we cannot assure you that our contract loss provisions will be adequate to cover all actual future losses.
Adverse judgments or settlements in legal disputes could harm our financial condition and operating results.
We are subject to a variety of lawsuits and other claims that arise from time to time in the ordinary course of our business. These may includelawsuits and claims related to contracts, subcontracts and employment claims and compliance with Medicaid and Medicare regulations as well as lawsgoverning debt collections and child support enforcement. Adverse judgments or settlements in some or all of these legal disputes may result in significantmonetary damages or injunctive relief against us. In addition, litigation and other legal claims are subject to inherent uncertainties and management’s viewof these matters may change in the future. Those uncertainties include, but are not limited to, costs of litigation, unpredictable court or jury decisions, andthe differing laws and attitudes regarding damage awards among the states and countries in which we operate.
We may incur significant costs before receiving related contract payments that could result in increasing the use of cash and accounts receivable.
When we are awarded a contract, we may incur significant expenses before we receive contract payments, if any. These expenses may includeleasing office space, purchasing office equipment and hiring personnel. In other situations, contract terms provide for billing upon achievement of specifiedproject milestones. As a result, in these situations, we are required to expend significant sums of money before receiving related contract payments. Inaddition, payments due to us from government agencies may be delayed due to billing cycles or as a result of failures to approve governmental budgets in atimely manner. These factors could impact us by increasing the use of cash and accounts receivable. Moreover, these impacts could be exacerbated if we failto either invoice the government agency or collect our fee in a timely manner.

We obtain most of our business through competitive bidding in response to government RFPs. We may not be awarded contracts through thisprocess on the same level in the future as in the past, and contracts we are awarded may not be profitable.
Substantially all of our customers are government agencies. To market our services to government customers, we are often required to respond togovernment RFPs which may result in contract awards on a competitive basis. To do so effectively, we must estimate accurately our cost structure forservicing a proposed contract, the time required to establish operations and likely terms of the proposals submitted by competitors. We must also assembleand submit a large volume of information within an RFP’s rigid timetable. Our ability to respond successfully to RFPs will greatly impact our business.There is no assurance that we will continue to obtain contracts in response to government RFPs and our proposals may not result in profitable contracts. Inaddition, competitors may protest contracts awarded to us through the RFP process which may cause the award to be delayed or overturned or may requirethe customer to reinitiate the RFP process.
Government entities have in the past and may in the future terminate their contracts with us earlier than we expect, which may result in revenueshortfalls.
Many of our government contracts contain base periods of one or more years, as well as option periods covering more than half of the contract’spotential duration. Government agencies do not have to exercise these option periods, and they may elect not to exercise them for budgetary, performance,or any other reason. Our contracts also typically contain provisions permitting a government customer to terminate the contract on short notice, with orwithout cause. Termination without cause provisions generally allow the government to terminate a contract at any time, and enable us to recover only ourcosts incurred or committed, and settlement expenses and profit, if any, on the work completed prior to termination. The unexpected termination ofsignificant contracts could result in significant revenue shortfalls. If revenue shortfalls occur and are not offset by corresponding reductions in expenses, ourbusiness could be adversely affected. We cannot anticipate if, when or to what extent a customer might terminate its contracts with us.
If we are unable to manage our growth, our profitability will be adversely affected.
Sustaining our growth places significant demands on our management as well as on our administrative, operational and financial resources. Forus to continue to manage our growth, we must continue to improve our operational, financial and management information systems and expand, motivateand manage our workforce. If our growth comes at the expense of providing quality service and generating reasonable profits, our ability to successfully bidfor contracts and our profitability will be adversely affected.
We rely on key contracts with state and local governments for a significant portion of our revenue. A substantial reduction in those contractswould materially adversely affect our operating results.
In fiscal 2010, approximately 59% of our total revenue was derived from contracts with state and local government agencies. Any significantdisruption or deterioration in our relationship with state and local governments and a corresponding reduction in these contracts would significantly reduceour revenues and could substantially harm our business.
Government unions may oppose outsourcing of government programs to outside vendors such as us, which could limit our market opportunitiesand could impact us adversely. In addition, our unionized workers could disrupt our operations.
Our success depends in part on our ability to win profitable contracts to administer and manage health and human services programs traditionallyadministered by government employees. Many government employees, however, belong to labor unions with considerable financial resources and lobbyingnetworks. Unions have in the past applied, and are likely to continue to apply, political pressure on legislators and other officials seeking to outsourcegovernment programs. Union opposition to these programs may result in fewer opportunities for us to service government agencies and/or longer and morecomplex procurements.
We do operate outsourcing programs using unionized employees in Canada. We have experienced opposition from the union which does notfavor the outsourcing of government programs. As a result, we have received negative press coverage as the union continues to oppose our programoperations. Such press coverage and union opposition may have an adverse affect on the willingness of government agencies to outsource such projects aswell as certain contracts that are operated within a unionized environment. Our unionized workers could also declare a strike which could adversely affectour performance and financial results.

We may be precluded from bidding and performing certain work due to other work we currently perform.
Various laws and regulations prohibit companies from performing work for government agencies that might be viewed as an actual or apparentconflict of interest. These laws may limit our ability to pursue and perform certain types of work. For example, some of our businesses assist governmentagencies in developing RFPs for various government programs. In those situations, the divisions involved in operating such programs would likely beprecluded from bidding on those RFPs. Similarly, regulations governing the independence of Medicaid enrollment brokers and Medicare appeal providerscould prevent us from providing services to other organizations such as health plans.
We may lose executive officers and senior managers on whom we rely to generate business and execute projects successfully.
The ability of our executive officers and our senior managers to generate business and execute projects successfully is important to our success.While we have employment agreements with some of our executive officers, those agreements do not prevent them from terminating their employment withus. The loss of an executive officer or senior manager could impair our ability to secure and manage engagements, which could harm our business,prospects, financial condition and results of operations.
Inaccurate, misleading or negative media coverage could adversely affect our reputation and our ability to bid for government contracts.
Because of the public nature of many of our business lines, the media frequently focus their attention on our contracts with government agencies.If the media coverage is negative, it could influence government officials to slow the pace of outsourcing government services, which could reduce thenumber of RFPs. The media also focus their attention on the activities of political consultants engaged by us, and we may be tainted by adverse mediacoverage about their activities, even when those activities are unrelated to our business. Moreover, inaccurate, misleading or negative media coverage aboutus could harm our reputation and, accordingly, our ability to bid for and win government contracts.
We may be unable to attract and retain sufficient qualified personnel to sustain our business.
Our delivery of services is labor−intensive. When we are awarded a government contract, we must quickly hire project leaders and casemanagement personnel. The additional staff also creates a concurrent demand for increased administrative personnel. Our success requires that we attract,develop, motivate and retain:
• experienced and innovative executive officers;
• senior managers who have successfully managed or designed government services programs; and
• information technology professionals who have designed or implemented complex information technology projects.
Innovative, experienced and technically proficient individuals are in great demand and are likely to remain a limited resource. There can be noassurance that we will be able to continue to attract and retain desirable executive officers and senior managers. Our inability to hire sufficient personnel ona timely basis or the loss of significant numbers of executive officers and senior managers could adversely affect our business.
If we fail to establish and maintain important relationships with government entities and agencies, our ability to successfully bid for RFPs may beadversely affected.
To facilitate our ability to prepare bids in response to RFPs, we rely in part on establishing and maintaining relationships with officials of variousgovernment entities and agencies. These relationships enable us to provide informal input and advice to the government entities and agencies prior to thedevelopment of an RFP. We also engage marketing consultants, including lobbyists, to establish and maintain relationships with elected officials andappointed members of government agencies. The effectiveness of these consultants may be reduced or eliminated if a significant political change occurs. Inthat circumstance, we may be unable to successfully manage our relationships with government entities and agencies and with elected officials andappointees. Any failure to maintain positive relationships with government entities and agencies may adversely affect our ability to bid successfully inresponse to RFPs.

The federal government may limit or prohibit the outsourcing of certain programs or may refuse to grant consents and/or waivers necessary topermit private entities, such as us, to perform certain elements of government programs.
The federal government could limit or prohibit private contractors like MAXIMUS from operating or performing elements of certain governmentprograms. State or local governments could be required to operate such programs with government employees as a condition of receiving federal funding.Moreover, under current law, in order to privatize certain functions of government programs, the federal government must grant a consent and/or waiver tothe petitioning state or local agency. If the federal government does not grant a necessary consent or waiver, the state or local agency will be unable tooutsource that function to a private entity, such as us. This situation could eliminate a contracting opportunity or reduce the value of an existing contract.
Our business could be adversely affected by future legislative or government budgetary and spending changes.
The market for our services depends largely on federal and state legislative programs and the budgetary capability to support programs, includingthe continuance of existing programs. These programs can be modified or amended at any time by acts of federal and state governments.
Moreover, part of our growth strategy includes aggressively pursuing new opportunities and continuing to serve existing programs scheduled forre−bid, which are or may be created by federal and state initiatives, principally in the area of health and human services.
State budgets have been adversely impacted by the recent financial and credit crisis and worldwide economic slowdown, resulting in state budgetdeficits. There are a number of alternatives to states in managing a possible budget deficit, including:
• Accessing previously set aside or “rainy day” funds;
• Increasing taxes;
• Elimination or reduction in services;
• Cost containment and savings;
• Pursuit of additional federal assistance; and
• Developing additional sources of revenue, such as the legalization of gaming.
While we believe that the demand for our services remains substantial, state budget deficits could adversely impact our existing and anticipatedbusiness as well as our future financial performance.
Also, changes in federal initiatives or in the level of federal spending due to budgetary or deficit considerations may have a significant impact onour future financial performance. For example, increased or changed spending on defense, security or anti−terrorism threats may impact the level of demandfor our services. Many state programs, such as Medicaid, are federally mandated and fully or partially funded by the federal government. Changes, such asprogram eligibility, benefits, or the level of federal funding may impact the demand for our services. Certain changes may present new opportunities to usand other changes may reduce the level of demand for services provided by us, which could materially adversely impact our future financial performance.
If we do not successfully integrate the businesses that we acquire, our results of operations could be adversely affected.
Business combinations involve a number of factors that affect operations, including:
• diversion of management’s attention;
• loss of key personnel;
• entry into unfamiliar markets;
• assumption of unanticipated legal or financial liabilities;
• becoming significantly leveraged as a result of incurring debt to finance an acquisition;

• unanticipated operating, accounting or management difficulties in connection with the acquired entities;
• impairment of acquired intangible assets, including goodwill; and
• dilution to our earnings per share.
Businesses we acquire may not achieve the revenue and earnings we anticipated. Customer dissatisfaction or performance problems with anacquired firm could materially and adversely affect our reputation as a whole. As a result, we may be unable to profitably manage businesses that we haveacquired or that we may acquire or we may fail to integrate them successfully without incurring substantial expenses, delays or other problems that couldmaterially negatively impact our business and results of operations.
We may rely on subcontractors and partners to provide clients with a single−source solution.
From time to time, we may engage subcontractors, teaming partners or other third parties to provide our customers with a single−source solution.While we believe that we perform appropriate due diligence on our subcontractors and teaming partners, we cannot guarantee that those parties will complywith the terms set forth in their agreements. We may have disputes with our subcontractors, teaming partners or other third parties arising from the qualityand timeliness of the subcontractor’s work, customer concerns about the subcontractor or other matters. Subcontractor performance deficiencies could resultin a customer terminating our contract for default. We may be exposed to liability, and we and our clients may be adversely affected if a subcontractor orteaming partner failed to meet its contractual obligations.
We face competition from a variety of organizations, many of which have substantially greater financial resources than we do; we may be unableto compete successfully with these organizations.
Our consulting businesses typically compete for consulting contracts with large global consulting firms, as well as smaller niche players.
Our BPO businesses compete for program management contracts with the following:
• government services divisions of large organizations such as Affiliated Computer Services, Inc. (acquired by Xerox Corporation), Electronic DataSystems Corporation (acquired by Hewlett−Packard Company), and International Business Machines Corporation;
• specialized service providers; and
• local non−profit organizations such as the United Way of America, Goodwill Industries and Catholic Charities, USA.
Many of these companies are national and international in scope, are larger than us and have greater financial resources, name recognition andlarger technical staffs. Substantial resources could enable certain competitors to initiate severe price cuts or take other measures in an effort to gain marketshare. In addition, we may be unable to compete for the limited number of large contracts because we may not be able to meet an RFP’s requirement toobtain and post a large cash performance bond. Also, in some geographic areas, we face competition from smaller consulting firms with establishedreputations and political relationships. There can be no assurance that we will be able to compete successfully against our existing or any new competitors.
A number of factors may cause our cash flows and results of operations to vary from quarter to quarter.
Factors which may cause our cash flows and results of operations to vary from quarter to quarter include:
• the terms and progress of contracts;
• Caseloads and other volume where revenue is derived on transactional volume on contracts;

• the levels of revenue earned and profitability of fixed−price and performance−based contracts;
• expenses related to certain contracts which may be incurred in periods prior to revenue being recognized;
• the commencement, completion or termination of contracts during any particular quarter;
• the schedules of government agencies for awarding contracts;
• the term of awarded contracts; and
• potential acquisitions.
Changes in the volume of activity and the number of contracts commenced, completed or terminated during any quarter may cause significantvariations in our cash flows and results of operations because a large amount of our expenses are fixed.
Our Articles of Incorporation and bylaws include provisions that may have anti−takeover effects.
Our Articles of Incorporation and bylaws include provisions that may delay, deter or prevent a takeover attempt that shareholders might considerdesirable. For example, our Articles of Incorporation provide that our directors are to be divided into three classes and elected to serve staggered three−yearterms. This structure could impede or discourage an attempt to obtain control of us by preventing stockholders from replacing the entire board in a singleproxy contest, making it more difficult for a third party to take control of us without the consent of our Board of Directors. Our Articles of Incorporationfurther provide that our shareholders may not take any action in writing without a meeting. This prohibition could impede or discourage an attempt to obtaincontrol of us by requiring that any corporate actions initiated by shareholders be adopted only at properly called shareholder meetings.