Embed Size (px)
Citation preview

Making the world more beautiful
ANNUAL REPORT 2017

Dear Shareholders,
I am pleased to write to you all as the newly appointed CEO of Avon Products, Inc., and
member of the Company’s Board of Directors.
Avon is an organization with a clear and compelling purpose that has a rich 130-year
history. Through our 6 million direct selling Representatives, we empower millions of
micro-entrepreneurs globally. We bene� t from uniquely powerful brand recognition,
extensive global reach and market-leading positions in direct selling and beauty. In a
world where trust in companies is becoming a scarce commodity, our Representative’s
relationship with her consumers has never been more relevant.
However, Avon is operating in a changing consumer and competitive environment, and
business as usual is not an option.
The Board has given me a clear mandate to conduct a thorough evaluation of all aspects of
our business, to identify how we modernize Avon for the needs of today’s Representatives
and consumers. I am spending time in our key markets, with the executive leaders,
talking and listening to our Representatives and teams, to better understand the reality
of their operating climate and competitive landscape as a basis to improve performance.
We look forward to engaging with all of our stakeholders, including our shareholders, to
gain an understanding of what Avon is doing well and not so well, and to learn where our
near and long-term opportunities lie. This will determine how to prioritize and address
our challenges.
While we will require time to complete our review, prioritize and sequence our changes,
I can assure you that we are working to accelerate the pace of change, drive pro� table
growth and restore Avon’s position as a market leader. We are excited for what the future
holds and are committed to positioning Avon for success for all stakeholders.
On behalf of the Board and the management team, we appreciate your support and
thank you for your continued investment in Avon.
Best,
Jan ZijderveldChief Executive Of� cerMarch, 2018
Jan ZijderveldChief Executive Of� cerMarch, 2018
8354_INSERT_C1.pdf 1


UNITED STATESSECURITIES AND EXCHANGE COMMISSION
Washington, D.C. 20549---------------------------------------------------------
FORM 10-KÈ Annual Report Pursuant to Section 13 or 15(d)
of the Securities Exchange Act of 1934For the fiscal year ended December 31, 2017
OR‘ Transition Report Pursuant to Section 13 or 15(d)
of the Securities Exchange Act of 1934For the transition period from to
Commission file number 1-4881---------------------------------------------------------------
AVON PRODUCTS, INC.(Exact name of registrant as specified in its charter)
New York 13-0544597(State or other jurisdiction ofincorporation or organization)
(I.R.S. EmployerIdentification No.)
Building 6, Chiswick Park, London W4 5HR(Address of principal executive offices)
+44-1604-232425(Registrant’s telephone number, including area code)
Securities registered pursuant to Section 12(b) of the Act:
Title of each className of each exchange on which
registeredCommon stock (par value $.25) New York Stock Exchange
Securities registered pursuant to Section 12(g) of the Act: None---------------------------------------------------------------
Indicate by check mark if the registrant is a well-known seasoned issuer, as defined in Rule 405 of the SecuritiesAct. Yes È No ‘
Indicate by check mark if the registrant is not required to file reports pursuant to Section 13 or Section 15(d) of theAct. Yes ‘ No È
Indicate by check mark whether the registrant (1) has filed all reports required to be filed by Section 13 or 15(d) of theSecurities Exchange Act of 1934 during the preceding 12 months (or for such shorter period that the registrant was required tofile such reports), and (2) has been subject to such filing requirements for the past 90 days. Yes È No ‘
Indicate by check mark whether the registrant has submitted electronically and posted on its corporate Website, if any, everyInteractive Data File required to be submitted and posted pursuant to Rule 405 of Regulation S-T (§232.405 of this chapter)during the preceding 12 months (or for such shorter period that the registrant was required to submit and post suchfiles). Yes È No ‘
Indicate by check mark if disclosure of delinquent filers pursuant to Item 405 of Regulation S-K is not contained herein, andwill not be contained, to the best of registrant’s knowledge, in definitive proxy or information statements incorporated byreference in Part III of this Form 10-K or any amendment to this Form 10-K. ‘
Indicate by check mark whether the registrant is a large accelerated filer, an accelerated filer, a non-accelerated filer, or asmaller reporting company. See the definitions of “large accelerated filer,” “accelerated filer” and “smaller reporting company”in Rule 12b-2 of the Exchange Act.
Large accelerated filer È Accelerated filer ‘
Non-accelerated filer ‘ (Do not check if a smaller reporting company) Smaller reporting company ‘
Emerging growth company ‘
If an emerging growth company, indicate by check mark if the registrant has elected not to use the extended transition period forcomplying with any new or revised financial accounting standards provided pursuant to Section 13(a) of the Exchange Act. ‘
Indicate by check mark whether the registrant is a shell company (as defined in Rule 12b-2 of the Act). Yes ‘ No È
The aggregate market value of voting and non-voting Common Stock (par value $.25) held by non-affiliates at June 30, 2017(the last business day of our most recently completed second quarter) was $1.7 billion.The number of shares of Common Stock (par value $.25) outstanding at January 31, 2018, was 440,373,865
---------------------------------------------------------------Documents Incorporated by Reference
Part III – Portions of the registrant’s Proxy Statement relating to the 2018 Annual Meeting of Shareholders.

Table of ContentsPart I3 – 7Item 1 Business
7 – 22Item 1A Risk Factors
22Item 1B Unresolved StaffComments
22Item 2 Properties
22Item 3 Legal Proceedings
22Item 4 Mine SafetyDisclosures
Part II23 – 24Item 5 Market for Registrant’sCommon Equity, RelatedStockholder Matters andIssuer Purchases of EquitySecurities
24 – 26Item 6 Selected Financial Data
27 – 57Item 7 Management’sDiscussion and Analysis ofFinancial Condition andResults of Operations
57 – 58Item 7A Quantitative andQualitative Disclosures AboutMarket Risk
58Item 8 Financial Statementsand Supplementary Data
58Item 9 Changes in andDisagreements withAccountants on Accountingand Financial Disclosure
58 – 59Item 9A Controls andProcedures
59Item 9B Other Information
Part III
60Item 10 Directors, ExecutiveOfficers and CorporateGovernance
60Item 11 ExecutiveCompensation
60Item 12 Security Ownershipof Certain Beneficial Ownersand Management andRelated Stockholder Matters
60Item 13 Certain Relationshipsand Related Transactions, andDirector Independence
60Item 14 Principal AccountantFees and Services
Part IV
61Item 15 Exhibits and FinancialStatement Schedule
6115 (a) 1 ConsolidatedFinancial Statements
6115 (a) 2 FinancialStatement Schedule
61 – 6615 (a) 3 Index to Exhibits
66Item 16 Form 10-K Summary
67 – 68Signatures

CAUTIONARY STATEMENT FOR PURPOSES OF THE “SAFE HARBOR”
STATEMENT UNDER THE PRIVATE SECURITIES LITIGATION REFORM
ACT OF 1995
Statements in this report (or in the documents it incorporates by reference) that are not historical facts or information may be forward-
looking statements within the meaning of the Private Securities Litigation Reform Act of 1995. Words such as “estimate,” “project,”
“forecast,” “plan,” “believe,” “may,” “expect,” “anticipate,” “intend,” “planned,” “potential,” “can,” “expectation,” “could,” “will,”
“would” and similar expressions, or the negative of those expressions, may identify forward-looking statements. They include, among other
things, statements regarding our anticipated or expected results, future financial performance, various strategies and initiatives (including
our Transformation Plan, stabilization strategies, cost savings initiatives, restructuring and other initiatives and related actions), costs and cost
savings, competitive advantages, impairments, the impact of foreign currency, including devaluations, and other laws and regulations,
government investigations, internal investigations and compliance reviews, results of litigation, contingencies, taxes and tax rates, potential
alliances or divestitures, liquidity, cash flow, uses of cash and financing, hedging and risk management strategies, pension, postretirement
and incentive compensation plans, supply chain and the legal status of the Representatives. Such forward-looking statements are based on
management’s reasonable current assumptions, expectations, plans and forecasts regarding the Company’s current or future results and
future business and economic conditions more generally. Such forward-looking statements involve risks, uncertainties and other factors,
which may cause the actual results, levels of activity, performance or achievement of Avon to be materially different from any future results
expressed or implied by such forward-looking statements, and there can be no assurance that actual results will not differ materially from
management’s expectations. Therefore, you should not rely on any of these forward-looking statements as predictors of future events.
Important factors that could cause our actual results and financial condition to differ materially from those indicated in the forward-looking
statements include, among others, the following:
• our ability to improve our financial and operational performance and execute fully our global business strategy, including our ability to
implement the key initiatives of, and/or realize the projected benefits (in the amounts and time schedules we expect) from, our
transformation plan, stabilization strategies, cost savings initiatives, restructuring and other initiatives, product mix and pricing strategies,
enterprise resource planning, customer service initiatives, sales and operation planning process, outsourcing strategies, Internet platform
and technology strategies including e-commerce, marketing and advertising strategies, information technology and related system
enhancements and cash management, tax, foreign currency hedging and risk management strategies, and any plans to invest these
projected benefits ahead of future growth;
• our ability to achieve the anticipated benefits of our strategic partnership with Cerberus Capital Management, L.P.;
• our broad-based geographic portfolio, which is heavily weighted towards emerging markets, a general economic downturn, a recession
globally or in one or more of our geographic regions or markets, such as Brazil, Mexico or Russia, or sudden disruption in business
conditions, and the ability to withstand an economic downturn, recession, cost inflation, commodity cost pressures, economic or political
instability (including fluctuations in foreign exchange rates), competitive or other market pressures or conditions;
• the effect of economic factors, including inflation and fluctuations in interest rates and foreign currency exchange rates;
• the possibility of business disruption in connection with our transformation plan, stabilization strategies, cost savings initiatives, or
restructuring and other initiatives;
• our ability to reverse declining revenue, to improve margins and net income, or to achieve profitable growth, particularly in our largest
markets and developing and emerging markets, such as Brazil, Mexico and Russia;
• our ability to improve working capital and effectively manage doubtful accounts and inventory and implement initiatives to reduce
inventory levels, including the potential impact on cash flows and obsolescence;
• our ability to reverse declines in Active Representatives, to enhance our sales leadership programs, to generate Representative activity, to
increase the number of consumers served per Representative and their engagement online, to enhance branding and the Representative
and consumer experience and increase Representative productivity through field activation and segmentation programs and technology
tools and enablers, to invest in the direct-selling channel, to offer a more social selling experience, and to compete with other direct-
selling organizations to recruit, retain and service Representatives and to continue to innovate the direct-selling model;
• general economic and business conditions in our markets, including social, economic and political uncertainties, such as in Russia and
Ukraine, and any potential sanctions, restrictions or responses to such conditions imposed by other markets in which we operate;
• developments in or consequences of any investigations and compliance reviews, and any litigation related thereto, including the
investigations and compliance reviews of Foreign Corrupt Practices Act and related United States (“U.S.”) and foreign law matters, as well
as any disruption or adverse consequences resulting from such investigations, reviews, related actions or litigation;
• the effect of political, legal, tax, including changes in tax rates, and other regulatory risks imposed on us abroad and in the U.S., our
operations or the Representatives, including foreign exchange, pricing, data privacy or other restrictions, the adoption, interpretation and
enforcement of foreign laws, including in jurisdictions such as Brazil and Russia, and any changes thereto, as well as reviews and
investigations by government regulators that have occurred or may occur from time to time, including, for example, local regulatory
scrutiny;
A V O N 2017 1

• competitive uncertainties in our markets, including competition from companies in the consumer packaged goods industry, some of which
are larger than we are and have greater resources;
• the impact of the adverse effect of volatile energy, commodity and raw material prices, changes in market trends, purchasing habits of our
consumers and changes in consumer preferences, particularly given the global nature of our business and the conduct of our business in
primarily one channel;
• our ability to attract and retain key personnel;
• other sudden disruption in business operations beyond our control as a result of events such as acts of terrorism or war, natural disasters,
pandemic situations, large-scale power outages and similar events;
• key information technology systems, process or site outages and disruptions, and any cyber security breaches, including any security
breach of our systems or those of a third-party provider that results in the theft, transfer or unauthorized disclosure of Representative,
customer, employee or Company information or compliance with information security and privacy laws and regulations in the event of
such an incident which could disrupt business operations, result in the loss of critical and confidential information, and adversely impact
our reputation and results of operations, and related costs to address such malicious intentional acts and to implement adequate
preventative measures against cyber security breaches;
• the risk of product or ingredient shortages resulting from our concentration of sourcing in fewer suppliers;
• any changes to our credit ratings and the impact of such changes on our financing costs, rates, terms, debt service obligations, access to
lending sources and working capital needs;
• the impact of our indebtedness, our access to cash and financing, and our ability to secure financing or financing at attractive rates and
terms and conditions;
• the impact of our business results (including the impact of any adverse foreign exchange movements and significant restructuring
charges), on our ability to comply with certain covenants in our revolving credit facility;
• our ability to successfully identify new business opportunities, strategic alliances and strategic alternatives and identify and analyze alliance
candidates, secure financing on favorable terms and negotiate and consummate alliances;
• disruption in our supply chain or manufacturing and distribution operations;
• the quality, safety and efficacy of our products;
• the success of our research and development activities;
• our ability to protect our intellectual property rights, including in connection with the separation of the North America business;
• our ability to repurchase the series C preferred stock in connection with a change of control; and
• the risk of an adverse outcome in any material pending and future litigation or with respect to the legal status of Representatives.
Additional information identifying such factors is contained in Item 1A of our Form 10-K for the year ended December 31, 2017, and other
reports and documents we file with the SEC. We undertake no obligation to update any such forward-looking statements.

PART I
ITEM 1. BUSINESS(U.S. dollars in millions, except per share data)
When used in this report, the terms “Avon,” “Company,” “we,” “our” or “us” mean, unless the context otherwise indicates, Avon
Products, Inc. and its majority and wholly owned subsidiaries.
GeneralWe are a global manufacturer and marketer of beauty and related products. We commenced operations in 1886 and were incorporated in
the State of New York on January 27, 1916. We conduct our business in the highly competitive beauty industry and compete against other
consumer packaged goods (“CPG”) and direct-selling companies to create, manufacture and market beauty and non-beauty-related
products. Our product categories are Beauty and Fashion & Home. Beauty consists of skincare, fragrance and color (cosmetics). Fashion &
Home consists of fashion jewelry, watches, apparel, footwear, accessories, gift and decorative products, housewares, entertainment and
leisure products, children’s products and nutritional products.
Our business is conducted primarily in one channel, direct selling. Our reportable segments are based on geographic operations in four
regions: Europe, Middle East & Africa; South Latin America; North Latin America; and Asia Pacific. Financial information relating to our
reportable segments is included in “Segment Review” within Management’s Discussion and Analysis of Financial Condition and Results of
Operations, which we refer to in this report as “MD&A,” on pages 27 through 57 of this Annual Report on Form 10-K for the year ended
December 31, 2017, which we refer to in this report as our “2017 Annual Report,” and in Note 14, Segment Information, to the
Consolidated Financial Statements on pages F-43 through F-46 of our 2017 Annual Report. We refer to each of the Notes to the
Consolidated Financial Statements in this 2017 Annual Report as a “Note.” Information about geographic areas is included in Note 14,
Segment Information on pages F-43 through F-46 of our 2017 Annual Report. All of our consolidated revenue is derived from operations of
subsidiaries outside of the United States (“U.S.”).
In December 2015, we entered into definitive agreements with affiliates of Cerberus Capital Management L.P. (“Cerberus”), which included
a $435 investment in Avon by an affiliate of Cerberus through the purchase of our convertible preferred stock and the separation of the
North America business (including approximately $100 of cash, subject to certain adjustments) from Avon into New Avon LLC (“New
Avon”), a privately-held company that is majority-owned and managed by an affiliate of Cerberus. These transactions closed in March 2016
and Avon retained approximately 20% ownership in New Avon. Our North America business had consisted of the Company’s operations in
the U.S., Canada and Puerto Rico; this business was previously its own reportable segment, and has been presented as discontinued
operations for all periods presented. Refer to Note 3, Discontinued Operations and Divestitures on pages F-17 through F-18 of our 2017
Annual Report and Note 4, Investment in New Avon on pages F-18 through F-19 of our 2017 Annual Report for additional information
regarding the investment by an affiliate of Cerberus and the separation of the North America business.
DistributionDuring 2017, we had sales operations in 56 countries and territories, and distributed our products in 18 other countries and territories.
Unlike most of our CPG competitors, which sell their products through third-party retail establishments (e.g., drug stores and department
stores), we primarily sell our products to the ultimate consumer through the direct-selling channel. In our case, sales of our products are
made to the ultimate consumer principally through direct selling by Representatives, who are independent contractors and not our
employees. As of December 31, 2017, we had approximately 6 million active Representatives which represents the number of
Representatives submitting an order in a sales campaign, totaled for all campaigns during the year and then divided by the number of
campaigns. Representatives earn by purchasing products directly from us at a discount from a published brochure price and selling them to
their customers, the ultimate consumer of our products. Representatives can start their Avon businesses for a nominal fee, or in some
markets, for no fee at all. We generally have no arrangements with end users of our products beyond the Representative, except as
described below. No single Representative accounts for more than 10% of our net sales globally.
A Representative contacts their customers directly, selling primarily through our brochure, which highlights new products and special
promotions for each sales campaign. In this sense, the Representative, together with the brochure, are the “store” through which our
products are sold. A brochure introducing a new sales campaign is typically generated every three to four weeks. Generally, the
Representative forwards an order for a campaign to us using the Internet, paper, telephone, or fax. This order is processed and the products
are assembled at a distribution center and delivered to the Representative usually through a combination of local and national delivery
A V O N 2017 3

PART I
companies. Generally, the Representative then delivers the merchandise and collects payment from the customer for her or his own account.
A Representative generally receives a refund of the price the Representative paid for a product if the Representative chooses to return it.
We employ certain web-enabled systems to increase Representative support, which allow a Representative to run her or his business more
efficiently and also allow us to improve our order-processing accuracy. For example, in many countries, Representatives can utilize the
Internet to manage their business electronically, including order submission, order tracking, payment and communications with us. In
addition, in many markets, Representatives can further build their own business through personalized web pages provided by us, enabling
them to sell a complete line of our products online. Self-paced online training also is available in certain markets.
In some markets, we use decentralized branches, satellite stores and independent retail operations (e.g., beauty boutiques) to serve
Representatives and other customers. Representatives come to a branch to place and pick up product orders for their customers. The
branches also create visibility of the Avon brand and channel with consumers and help reinforce our beauty image. In certain markets, we
provide opportunities to license our beauty centers and other retail-oriented and direct-to-consumer opportunities to reach new customers
in complementary ways to direct selling. In the United Kingdom and certain other markets, we also utilize e-commerce and market our
products through consumer websites.
The recruiting or appointing and training of Representatives are the primary responsibilities of district sales managers, zone managers and
independent leaders. Depending on the market and the responsibilities of the role, some of these individuals are our employees and some
are independent contractors. Those who are employees are paid a salary and an incentive based primarily on the achievement of a sales
objective in their district. Those who are independent contractors are rewarded primarily based on total sales achieved in their zones or
downline team of recruited, trained and managed Representatives. Personal contacts, including recommendations from current
Representatives (including the sales leadership program), and local market advertising constitute the primary means of obtaining new
Representatives. The sales leadership program is a multi-level compensation program which gives Representatives, known as independent
leaders, the opportunity to earn discounts on their own sales of our products, as well as commissions based on the net sales made by
Representatives they have recruited and trained. This program generally limits the number of levels on which commissions can be earned to
three. The primary responsibilities of independent leaders are the prospecting, appointing, training and development of their downline
Representatives while maintaining a certain level of their own sales. As described above, the Representative is the “store” through which we
primarily sell our products and, given the high rate of turnover among Representatives, which is a common characteristic of direct selling, it
is critical that we recruit, retain and service Representatives on a continuing basis in order to maintain and grow our business.
From time to time, local governments and others question the legal status of Representatives or impose burdens inconsistent with their
status as independent contractors, often in regard to possible coverage under social benefit laws that would require us (and, in most
instances, the Representatives) to make regular contributions to government social benefit funds. Although we have generally been able to
address these questions in a satisfactory manner, these questions can be raised again following regulatory changes in a jurisdiction or can be
raised in other jurisdictions. If there should be a final determination adverse to us in a country, the cost for future, and possibly past,
contributions could be so substantial in the context of the volume and profitability of our business in that country that we would consider
discontinuing operations in that country.
Promotion and MarketingSales promotion and sales development activities are directed at assisting Representatives, through sales aids such as brochures, product
samples and demonstration products. In order to support the efforts of Representatives to reach new customers, specially designed sales
aids, promotional pieces, customer flyers, television advertising and print advertising may be used. In addition, we seek to motivate the
Representatives through the use of special incentive programs that reward superior sales performance. Periodic sales meetings with
Representatives are conducted by the district sales or zone managers. The meetings are designed to keep Representatives abreast of product
line changes, explain sales techniques and provide recognition for sales performance.
We use a number of merchandising techniques, including promotional pricing for new products, combination offers, trial sizes and samples,
and the promotion of products packaged as gift items. In most markets, for each sales campaign, we publish a distinctive brochure, in which
we introduce new products and special promotions on selected items, or give particular prominence to a particular category. A key priority
for our merchandising is to continue the use of analytical tools to enable a deeper, fact-based understanding of the role and impact of
pricing within our product portfolio.

From time to time, various regulations or laws have been proposed or adopted that would, in general, restrict the frequency, duration or
volume of sales resulting from new product introductions, special promotions or other special price offers. We expect our broad product
lines and pricing flexibility to mitigate the effect of these regulations.
Competitive ConditionsWe face competition from various products and product lines. The beauty and beauty-related products industry is highly competitive and the
number of competitors and degree of competition that we face in this industry varies widely from country to country. We compete against
products sold to consumers in a number of distribution methods, including direct selling, through the Internet, and through the mass market
retail and prestige retail channels.
Specifically, due to the nature of the direct-selling channel, we often compete on country-by-country basis, with our direct-selling
competitors. Unlike a typical CPG company which operates within a broad-based consumer pool, direct sellers compete for representative or
entrepreneurial talent by providing a more competitive earnings opportunity or “better deal” than that offered by the competition as well as
significant competition from other non-direct selling earnings opportunities for which the existing Representatives or potential
Representatives could avail themselves. Providing a compelling earnings opportunity for the Representatives is as critical as developing and
marketing new and innovative products. As a result, in contrast to a typical CPG company, we must first compete for a limited pool of
Representatives before we reach the ultimate consumer.
Within the broader CPG industry, we principally compete against large and well-known cosmetics (color), fragrance and skincare companies
that manufacture and sell broad product lines through various types of retail establishments and other channels, including through the
Internet. In addition, we compete against many other companies that manufacture and sell more narrow beauty product lines sold through
retail establishments and other channels, including through the Internet.
We also have many global branded and private label competitors in the accessories, apparel, housewares, and gift and decorative products
industries, including retail establishments, principally department stores, mass merchandisers, gift shops and specialty retailers. Our principal
competition in the fashion jewelry industry consists of a few large companies and many small companies that sell fashion jewelry through
department stores, mass merchandisers, specialty retailers and e-commerce.
We believe that the personalized customer service offered by the Representatives; the Representatives’ earnings opportunity as well as the
amount and type of field incentives we offer the Representatives on a market-by-market basis; the high quality, attractive designs and prices
of our products; the high level of new and innovative products; our easily recognized brand name and our guarantee of product satisfaction
are significant factors in helping to establish and maintain our competitive position.
International OperationsDuring 2017, our international operations, outside of the U.S., were conducted primarily through subsidiaries in 56 countries and territories.
Outside of the U.S., our products were also distributed in 17 other countries and territories. In March 2016, we separated from our North
America business, which had consisted of the Company’s operations in the U.S., Canada and Puerto Rico; this business has been presented
as discontinued operations for all periods presented. As a result, all of our consolidated revenue is derived from operations of subsidiaries
outside of the U.S. During 2017, approximately 39% of our consolidated revenue was derived from South Latin America, approximately
38% was derived from Europe, Middle East & Africa, approximately 14% was derived from North Latin America and approximately 9% was
derived from Asia Pacific. Further, approximately 22% of our consolidated revenue during 2017 was derived from Brazil, which is our largest
market and is included within the South Latin America reportable segment.
Our international operations are subject to risks inherent in conducting business abroad, including, but not limited to, the risk of adverse
foreign currency fluctuations, foreign currency remittance restrictions, the ability to procure products and unfavorable social, economic and
political conditions.
See the sections “Risk Factors – Our ability to conduct business in our international markets may be affected by political, legal, tax and
regulatory risks” and “Risk Factors – We are subject to financial risks as a result of our international operations, including exposure to
foreign currency fluctuations and the impact of foreign currency restrictions” in Item 1A on pages 7 through 22 of our 2017 Annual Report
for more information.
A V O N 2017 5
PART I
Manufacturing and SourcingWe manufacture and package the majority of our Beauty products, which are formulated and designed by our staff of chemists, designers
and artists. Raw materials, consisting chiefly of essential oils, chemicals, containers and packaging components required for our Beauty
products are purchased from a range of third-party suppliers. The remainder of our Beauty products and all of our Fashion & Home products
are purchased from various third-party manufacturers.
Our products are affected by the cost and availability of materials such as glass, plastics, chemicals and fabrics. For the vast majority of items
we have more than one source of supply available. We believe that we can continue to obtain sufficient raw materials and supplies to
manufacture and produce our Beauty products for the foreseeable future.
Additionally, we design the brochures that are used by the Representatives to sell our products. The brochures are then produced on our
behalf by a range of printing suppliers.
The loss of any one supplier would not have a material impact on our ability to source raw materials for the majority of our Beauty products
or source products for the remainder of our Beauty products and all of our Fashion & Home products or paper for the brochures.
See Item 2, Properties, on page 22 of our 2017 Annual Report for additional information regarding the location of our principal
manufacturing facilities.
Product CategoriesBoth of our product categories individually account for 10% or more of consolidated net sales in 2017. The following is the percentage of
net sales by product category for the years ended December 31:
2017 2016 2015
Beauty 75% 74% 74%
Fashion & Home 25% 26% 26%
Trademarks and PatentsOur business is not materially dependent on the existence of third-party patent, trademark or other third-party intellectual property rights,
and we are not a party to any ongoing material licenses, franchises or concessions. We do seek to protect our key proprietary technologies
by aggressively pursuing comprehensive patent coverage in major markets. We protect our Avon name and other major proprietary
trademarks through registration of these trademarks in the relevant markets, monitoring the markets for infringement of such trademarks by
others, and by taking appropriate steps to stop any infringing activities.
Seasonal Nature of BusinessOur sales and earnings are typically affected by seasonal variations, a characteristic of many companies selling beauty, gift and decorative
products, apparel and fashion jewelry. For instance, our sales are generally highest during the fourth quarter due to seasonal and holiday-
related patterns. However, the sales volume of holiday gift items is, by its nature, difficult to forecast, and taken as a whole, seasonality does
not have a material impact on our financial results.
Research and Product Development ActivitiesNew products are essential to growth in the highly competitive cosmetics industry. Our research and development (“R&D”) department’s
efforts are important to developing new products, including formulating effective beauty treatments relevant to women’s needs, and
redesigning or reformulating existing products. To increase our brand competitiveness, we have sustained our focus on new technology and
product innovation to deliver first-to-market products that provide visible consumer benefits.
Our global R&D facility is located in Suffern, NY. A team of researchers and technicians apply the disciplines of science to the practical
aspects of bringing products to market around the world. Relationships with dermatologists and other specialists enhance our ability to
deliver new formulas and ingredients to market. Additionally, we have R&D facilities located in Argentina, Brazil, China, Mexico, the
Philippines, Poland, South Africa and the United Kingdom.

In 2017, our most significant product launches included: Anew Reversalist Infinite Effects Night Treatment Cream, Avon True Nutra Effects
collection, Avon True Color Flawless Foundation, Mark Big & Style Mascara, Mark Liquid Lip Lacquer, Avon Care Oatmeal collection, Eve
Duet, Luminata, Encanto Body Cream and Advanced Techniques Miracle Densifier.
The amounts incurred on research activities relating to the development of new products and the improvement of existing products were
$52.9 in 2017, $52.1 in 2016 and $61.9 in 2015. This research included the activities of product research and development and package
design and development. Most of these activities were related to the design and development of Beauty products.
Environmental MattersCompliance with environmental laws and regulations impacting our global operations has not had, and currently is not anticipated to have,
a material adverse effect on our financial position, capital expenditures or competitive position.
EmployeesAt December 31, 2017, we employed approximately 25,000 employees. Of these, approximately 500 were employed in the U.S. and
approximately 24,500 were employed in other countries.
Transformation PlanIn January 2016, we announced a transformation plan (the “Transformation Plan”). See “Overview” within MD&A on pages 27 through 28
for more information on these items.
Acquisitions and DispositionsIn December 2015, we entered into definitive agreements with affiliates of Cerberus, which included the separation of the North America
business from Avon into New Avon, a privately-held company that is majority-owned and managed by an affiliate of Cerberus. Avon
retained approximately 20% ownership in New Avon. These transactions closed in March 2016. In July 2015, we completed the sale of Liz
Earle. Refer to Note 3, Discontinued Operations and Divestitures on pages F-17 through F-19 of our 2017 Annual Report, for additional
information regarding the sales of the North America business and Liz Earle.
Website Access to ReportsOur annual report on Form 10-K, quarterly reports on Form 10-Q, current reports on Form 8-K, and amendments to those reports, are, and
have been throughout 2017, available without charge on our investor website (www.avoninvestor.com) as soon as reasonably practicable
after they are filed with or furnished to the U.S. Securities and Exchange Commission (the “SEC”). We also make available on our website
the charters of our Board Committees, our Corporate Governance Guidelines and our Code of Conduct. Copies of these SEC reports and
other documents are also available, without charge, by sending a letter to Investor Relations, Avon Products, Inc., 601 Midland Avenue, Rye,
N.Y. 10580, by sending an email to [email protected] or by calling (203) 682-8200. Information on our website does not
constitute part of this report. Additionally, our filings with the SEC may be read and copied at the SEC Public Reference Room at
100 F Street, NE, Washington, DC 20549. Information on the operation of the Public Reference Room may be obtained by calling
1-800-SEC-0330. These filings, including reports, proxy and information statements, and other information regarding the Company are also
available on the SEC’s website at www.sec.gov free of charge as soon as reasonably practicable after we have filed or furnished the above-
referenced reports.
ITEM 1A. RISK FACTORS
You should carefully consider each of the following risks associated with an investment in our publicly-traded securities and all of the other
information in our 2017 Annual Report. Our business may also be adversely affected by risks and uncertainties not presently known to us or
that we currently believe to be immaterial. If any of the events contemplated by the following discussion of risks should occur, our business,
prospects, financial condition, liquidity, results of operations and cash flows may be materially adversely affected.
A V O N 2017 7

PART I
Risks Related to Us and Our Business
Our success depends on our ability to improve our financial and operational performance andexecute fully our global business strategy.Our ability to improve our financial and operational performance and implement the key initiatives of our global business strategy is
dependent upon a number of factors, including our ability to:
• implement our Transformation Plan, stabilization strategies, cost savings initiatives, restructuring and other initiatives, and achieve
anticipated savings and benefits from such programs and initiatives;
• reverse declines in our market share and strengthen our brand image;
• implement appropriate pricing strategies and product mix that are more aligned with the preferences of local markets and achieve
anticipated benefits from these strategies;
• reduce costs and effectively manage our cost structure, particularly selling, general and administrative (“SG&A”) expenses;
• improve our business in the markets where we operate, including through improving field health;
• execute investments in information technology (“IT”) infrastructure and realize efficiencies across our supply chain, marketing processes,
sales model and organizational structure;
• implement and continue to innovate our Internet platform, technology strategies and customer service initiatives, including our ability to
offer a more compelling social selling experience and the roll-out of e-commerce in certain markets;
• effectively manage our outsourcing activities;
• improve our marketing and advertising, including our brochures and our social media presence;
• improve working capital, effectively manage inventory and implement initiatives to reduce inventory levels, including the potential impact
on cash flows and obsolescence;
• secure financing at attractive rates, maintain appropriate capital investment, capital structure and cash flow levels and implement cash
management, tax, foreign currency hedging and risk management strategies;
• reverse declines in Active Representatives and Representative satisfaction by successfully reducing campaign complexity and enhancing our
sales leadership program, the Representative experience and earnings potential, along with improving our brand image;
• increase the productivity of Representatives through successful implementation of segmentation, field activation programs and technology
tools and enablers and other investments in the direct-selling channel;
• improve management of our businesses in developing markets, including improving local IT resources and management of local supply
chains;
• increase the number of consumers served per Representative and their engagement online, as well as to reach new consumers through a
combination of new brands, new businesses, new channels and pursuit of strategic opportunities such as joint ventures and alliances with
other companies;
• comply with certain covenants in our revolving credit facility, which depends on our business results (including the impact of any adverse
foreign exchange movements and significant restructuring charges), or undertake other alternatives to avoid noncompliance, such as
obtaining additional amendments to our revolving credit facility or repurchasing certain debt, and address the impact any non-compliance
with such covenants may have on our ability to secure financing with favorable terms; and
• estimate and achieve any financial projections concerning, for example, customer demand, future revenue, profit, cash flow, and
operating margin increases and maintain an effective internal control environment as a result of any challenges associated with the
implementation of our various plans, strategies and initiatives.
There can be no assurance if and when any of these initiatives will be successfully and fully executed or completed.
We may experience financial and strategic difficulties and delays or unexpected costs incompleting our Transformation Plan and any other restructuring and cost-savings initiatives,including achieving any anticipated savings and benefits of these initiatives.In January 2016, we initiated a Transformation Plan (the “Transformation Plan”), which included cost reduction efforts to continue to
improve our cost structure and to enable us to reinvest in growth. Under this plan, we had targeted pre-tax annualized cost savings of
approximately $350 million after three years, with an estimated $200 million from supply chain reductions and an estimated $150 million
from other cost reductions, which were expected to be achieved through restructuring actions, as well as other cost-savings strategies that
will not result in restructuring charges. We have reinvested and continue to plan to reinvest a portion of these cost savings in growth

initiatives, including media, social selling and information technology systems that will help us modernize our business. We had initiated the
Transformation Plan in an attempt to enable us to achieve our long-term goals of mid-single-digit constant-dollar revenue growth and low
double-digit operating margin.
As we work to right-size our cost structure, we may not realize anticipated savings or benefits from one or more of the various restructuring
and cost-savings initiatives we may undertake as part of these efforts in full or in part or within the time periods we expect. Other events
and circumstances, such as financial and strategic difficulties and delays or unexpected costs, including the impact of foreign currency and
inflationary pressures, may occur which could result in our not realizing our targets or in offsetting the financial benefits of reaching those
targets. If we are unable to realize these savings or benefits, or otherwise fail to invest in the growth initiatives, our business may be
adversely affected. In addition, any plans to invest these savings and benefits ahead of future growth means that such costs will be incurred
whether or not we realize these savings and benefits. We are also subject to the risks of labor unrest, negative publicity and business
disruption in connection with these initiatives, and the failure to realize anticipated savings or benefits from such initiatives could have a
material adverse effect on our business, prospects, financial condition, liquidity, results of operations and cash flows.
There can be no assurance that we will be able to improve revenue, margins and net incomeor to achieve profitable growth.There can be no assurance that we will be able to improve revenue, margins and net income, or to achieve profitable growth in the future,
particularly in our largest markets and developing and emerging markets, such as Brazil, Mexico and Russia. Our revenue in 2017 was
$5,715.6 million, compared with $5,717.7 million in 2016 and $6,160.5 million in 2015. Improving revenue, margins and net income and
achieving profitable growth will depend on our ability to improve financial and operational performance and execute our global business
strategy, and there can be no assurance that we will be able to achieve these goals. Our ability to improve could be hindered by competing
business priorities and projects.
To improve revenue, margins and net income and to achieve profitable growth, we also need to successfully implement certain initiatives,
including our Transformation Plan, and there can no assurance that we will be able to do so. Our achievement of profitable growth is also
subject to the strengths and weaknesses of our individual international markets, which are or may be impacted by global economic
conditions. We cannot assure that our broad-based geographic portfolio will be able to withstand an economic downturn, recession, cost or
wage inflation, commodity cost pressures, economic or political instability (including fluctuations in foreign exchange rates), competitive
pressures or other market pressures in one or more particular regions.
Failure to improve revenue, margins and net income and to achieve profitable growth could have a material adverse effect on our business,
prospects, financial condition, liquidity, results of operations and cash flows.
Our business is conducted primarily in one channel, direct selling.Our business is conducted primarily in the direct-selling channel. Sales are made to the ultimate consumer principally through direct selling
by Representatives, who are independent contractors and not our employees. As of December 31, 2017, we had approximately 6 million
active Representatives. There is a high rate of turnover among Representatives, which is a common characteristic of the direct-selling
business. In order to reverse losses of Representatives and grow our business in the future, we need to recruit, retain and service
Representatives on a continuing basis. Among other things, we need to create attractive Representative earning opportunities and transform
the value chain, restore field health and sales force effectiveness, successfully implement other initiatives in the direct-selling channel,
successfully execute our digital strategy, including e-commerce, improve our brochure and product offerings and improve our marketing and
advertising. There can be no assurance that we will be able to achieve these objectives. Our direct-selling model contains an inherent risk of
bad debt associated with providing Representatives with credit, which is exacerbated if the financial condition of the Representatives
deteriorates. Additionally, consumer purchasing habits, including reducing purchases of beauty and related products generally, or reducing
purchases from Representatives through direct selling by buying beauty and related products in other channels such as retail, could reduce
our sales, impact our ability to execute our global business strategy or have a material adverse effect on our business, prospects, financial
condition, liquidity, results of operations and cash flows. Additionally, if we lose market share in the direct-selling channel, our business,
prospects, financial condition, liquidity, results of operations and cash flows may be adversely affected. Furthermore, if any government or
regulatory body such as Brazil or the European Union, bans or severely restricts our business methods or operational/commercial model of
direct selling, our business, prospects, financial condition, liquidity, results of operations and cash flows may be materially adversely affected.
A V O N 2017 9

PART I
We are subject to financial risks as a result of our international operations, including exposureto foreign currency fluctuations and the impact of foreign currency restrictions.We operate globally, through operations in various locations around the world, and derive all of our consolidated revenue from operations
outside of the United States (“U.S.”).
One risk associated with our international operations is that the functional currency for most of our international operations is their local
currency. The primary foreign currencies for which we have significant exposures include the Argentine peso, Brazilian real, British pound,
Chilean peso, Colombian peso, the euro, Mexican peso, Peruvian new sol, Philippine peso, Polish zloty, Romanian leu, Russian ruble,
South African rand, Turkish lira and Ukrainian hryvnia. As the U.S. dollar strengthens relative to our foreign currencies, our revenues and
profits are reduced when translated into U.S. dollars and our margins may be negatively impacted by country mix if our higher margin
markets experience significant devaluation. In addition, our costs are more weighted to U.S. dollars while our sales are denominated in local
currencies. Although we typically work to mitigate this negative foreign currency transaction impact through price increases and further
actions to reduce costs, and by shifting costs to markets in which we generate revenue, we may not be able to fully offset the impact, if at
all. Our success depends, in part, on our ability to manage these various foreign currency impacts and there can be no assurance that foreign
currency fluctuations will not have a material adverse effect on our business, assets, financial condition, liquidity, results of operations or
cash flows.
Another risk associated with our international operations is the possibility that a foreign government may tax or impose foreign currency
remittance restrictions. Due to the possibility of government restrictions on transfers of cash out of the country and control of exchange
rates, we may not be able to immediately repatriate cash. If this should occur, or if the exchange rates devalue, it may have a material
adverse effect on our business, assets, financial condition, liquidity, results of operations or cash flows.
Inflation is another risk associated with our international operations. Gains and losses resulting from the remeasurement of the financial
statements of subsidiaries operating in highly inflationary economies are recorded in earnings. High rates of inflation or the related
devaluation of foreign currency may have a material adverse effect on our business, assets, financial condition, liquidity and results of
operations or cash flows. There can be no assurance that countries in which we operate, such as Argentina, will not become highly
inflationary and that our revenue, operating profit and net income will not be adversely impacted as a result.
Our ability to improve our financial performance depends on our ability to anticipate andrespond to market trends and changes in consumer preferences.Our ability to improve our financial performance depends on our ability to anticipate, gauge and react in a timely and effective manner to
changes in consumer spending patterns and preferences for beauty and related products. We must continually work to develop, produce
and market new products, maintain and enhance the recognition of our brands, achieve a favorable mix of products, and refine our
approach as to how and where we market and sell our products. Consumer spending patterns and preferences cannot be predicted with
certainty and can change rapidly. In addition, certain market trends may be short-lived. There can be no assurance that we will be able to
anticipate and respond to trends timely and effectively in the market for beauty and related products and changing consumer demands and
improve our financial results.
Furthermore, material shifts or decreases in market demand for our products, including as a result of changes in consumer spending patterns
and preferences or incorrect forecasting of market demand, could result in us carrying inventory that cannot be sold at anticipated prices or
increased product returns by the Representatives. Failure to maintain proper inventory levels or increased product returns by the
Representatives could result in a material adverse effect on our business, prospects, financial condition, liquidity, results of operations and
cash flows.
Our success depends, in part, on our key personnel.Our success depends, in part, on our ability to retain our key personnel. The unexpected loss of or failure to retain one or more of our key
employees could adversely affect our business. Our success also depends, in part, on our continuing ability to identify, hire, attract, train,
develop and retain other highly qualified personnel. Competition for these employees can be intense and our ability to hire, attract and
retain them depends on our ability to provide competitive compensation. We may not be able to attract, assimilate, develop or retain
qualified personnel in the future, and our failure to do so could adversely affect our business, including the execution of our global business
strategy. For example, there have been many changes to the Company’s senior management, including a new chief executive officer in

2018, a new chief financial officer in 2015 and 2017 and other significant changes to senior management during 2017. Such turnover
creates a risk of business processes not being sustained if the turnover occurs with inadequate knowledge transfer. Any failure by our
management team to perform as expected may have a material adverse effect on our business, prospects, financial condition, results of
operations and cash flows. This risk may be exacerbated by the uncertainties associated with the implementation of our Transformation Plan
and any other stabilization strategies and restructuring and cost-savings initiatives we undertake from time to time.
A general economic downturn, a recession globally or in one or more of our geographicregions or markets or sudden disruption in business conditions or other challenges mayadversely affect our business, our access to liquidity and capital, and our credit ratings.Current global macro-economic instability or a further downturn in the economies in which we sell our products, including any recession in
one or more of our geographic regions or markets could adversely affect our business, our access to liquidity and capital, and our credit
ratings. Economic events, including high unemployment levels and recession, as well as the tightening of credit markets, have resulted in
challenges to our business and a heightened concern regarding further deterioration globally. In addition, as mentioned above, our business
is conducted primarily in the direct-selling channel. We could experience declines in revenues, profitability and cash flow due to reduced
orders, payment delays, supply chain disruptions or other factors caused by such economic, operational or business challenges. Any or all of
these factors could potentially have a material adverse effect on our liquidity and capital resources and credit ratings, including our ability to
access short-term financing, raise additional capital, reduce flexibility with respect to working capital, and maintain credit lines and offshore
cash balances.
Consumer spending is also generally affected by a number of factors, including general economic conditions, inflation, interest rates, energy
costs, gasoline prices and consumer confidence generally, all of which are beyond our control. Consumer purchases of discretionary items,
such as beauty and related products, tend to decline during recessionary periods, when disposable income is lower, and may impact sales of
our products. We may face continued economic challenges in 2018 because customers may continue to have less money for discretionary
purchases as a result of job losses, bankruptcies, and reduced access to credit, among other things.
In addition, sudden disruptions in business conditions and consumer spending may result from acts of terror, natural disasters, adverse
weather conditions, and pandemic situations or large-scale power outages, none of which are under our control.
Our credit ratings were downgraded during the past several years, which could limit ouraccess to financing, affect the market price of our financing and increase financing costs. Afurther downgrade in our credit ratings may adversely affect our access to liquidity.Nationally recognized credit rating organizations have issued credit ratings relating to our long-term debt. Our credit ratings have been
downgraded at various points during the past several years, including in 2017. Our long-term credit ratings are: Moody’s ratings of Stable
Outlook with B1 for corporate family debt, B3 for senior unsecured debt, and Ba1 for our Senior Secured Notes; S&P ratings of Stable
Outlook with B for corporate family debt and senior unsecured debt and BB- for our Senior Secured Notes; and Fitch rating of Negative
Outlook with B+, each of which are below investment grade. We do not believe these long-term credit ratings will have a material impact on
our near-term liquidity. However, any rating agency reviews could result in a change in outlook or downgrade, which could further limit our
access to new financing, particularly short-term financing, reduce our flexibility with respect to working capital needs, affect the market
price of some or all of our outstanding debt securities, and likely result in an increase in financing costs, and less favorable covenants and
financial terms under our financing arrangements. A further change in outlook or downgrade of our credit ratings may increase some of
these risks and limit our access to such short-term financing in the future on favorable terms, if at all. See Note 7, Debt and Other Financing
on pages F-20 through F-23 of our 2017 Annual Report for details about the terms of our existing debt and other financing arrangements.
Our indebtedness and any future inability to meet any of our obligations under ourindebtedness, could adversely affect us by reducing our flexibility to respond to changingbusiness and economic conditions.As of December 31, 2017, we had approximately $1.9 billion of indebtedness outstanding. We may also incur additional long-term
indebtedness and working capital lines of credit to meet future financing needs, subject to certain restrictions under our indebtedness,
including our revolving credit facility and our Senior Secured Notes (each, as described below), which would increase our total indebtedness.
We may be unable to generate sufficient cash flow from operations and future borrowings and other financing may be unavailable in an
A V O N 2017 11

PART I
amount sufficient to enable us to fund our current and future financial obligations or our other liquidity needs, which would have a material
adverse effect on our business, prospects, financial condition, liquidity, results of operations and cash flows. Our indebtedness could have
material negative consequences on our business, prospects, financial condition, liquidity, results of operations and cash flows, including the
following:
• limitations on our ability to obtain additional debt or equity financing sufficient to fund growth, such as working capital and capital
expenditures requirements or to meet other cash requirements, in particular during periods in which credit markets are weak;
• a further downgrade in our credit ratings, as discussed above;
• a limitation on our flexibility to plan for, or react to, competitive challenges in our business and the beauty industry;
• the possibility that we are put at a competitive disadvantage relative to competitors with less debt or debt with more favorable terms than
us, and competitors that may be in a more favorable position to access additional capital resources and withstand economic downturns;
• limitations on our ability to execute business development activities to support our strategies or ability to execute restructuring as
necessary; and
• limitations on our ability to invest in recruiting, retaining and servicing the Representatives.
Our revolving credit facility and our Senior Secured Notes are secured by first-priority liens on and security interests in substantially all of the
assets of Avon International Operations, Inc. (“AIO,” a wholly-owned domestic subsidiary) and the subsidiary guarantors and by certain
assets of the Company, in each case, subject to certain exceptions and permitted liens. Both our revolving credit facility and our Senior
Secured Notes contain customary covenants, including, among other things, limits on the ability of the Company, AIO or any restricted
subsidiary to, subject to certain exceptions, incur liens, incur debt, make restricted payments, make investments or, with respect to certain
entities, merge, consolidate or dispose of all or substantially all of its assets. Our revolving credit facility also contains a minimum interest
coverage ratio and a maximum total leverage ratio. If we are unable to comply with these ratios as a result of our business results (including
the impact of any adverse foreign exchange movements and significant restructuring charges), we would be limited in our ability to borrow
under our revolving credit facility which could, as a result, restrict our operational flexibility. In addition, we could have difficulty undertaking
other alternatives to avoid noncompliance, such as obtaining necessary waivers from compliance with, or necessary amendments to, the
covenants contained in our revolving credit facility and our Senior Secured Notes or repurchasing certain debt, and we could have difficulty
addressing the impact any non-compliance with these covenants may have on our ability to secure financing with favorable terms.
Our ability to conduct business in our international markets may be affected by political,legal, tax and regulatory risks.Our ability to achieve growth in our international markets, and to improve operations in our existing international markets, is exposed to
various risks, including:
• the possibility that a foreign government might ban, halt or severely restrict our business, including our primary method of direct selling;
• the possibility that local civil unrest, economic or political instability, bureaucratic delays, changes in macro-economic conditions, changes
in diplomatic or trade relationships (including any sanctions, restrictions and other responses such as those related to Russia and Ukraine)
or other uncertainties might disrupt our operations in an international market;
• the lack of well-established or reliable legal systems in certain areas where we operate;
• the adoption of new U.S. or foreign tax legislation including the newly enacted U.S. federal income tax law discussed in detail below or
exposure to additional tax liabilities, including exposure to tax assessments without prior notice or the opportunity to review the basis for
any such assessments in certain jurisdictions;
• the possibility that a government authority might impose legal, tax or other financial burdens on the Representatives, as direct sellers, or
on Avon, due, for example, to the structure of our operations in various markets, or additional taxes on our products, including in Brazil;
• the possibility that a government authority might challenge the status of the Representatives as independent contractors or impose
employment or social taxes on the Representatives; and
• those associated with data privacy regulation and the international transfer of personal data.
We are also subject to the adoption, interpretation and enforcement by governmental agencies abroad and in the U.S. (including on federal,
state and local levels) of other laws, rules, regulations or policies, including any changes thereto, such as restrictions on trade, competition,
manufacturing, license and permit requirements, import and export license requirements, privacy and data protection laws, anti-corruption
laws, environmental laws, records and information management, tariffs and taxes, laws relating to the sourcing of “conflict minerals,”

health care reform requirements such as those required by the Patient Protection and Affordable Healthcare Act, and regulation of our
brochures, product claims or ingredients, which may require us to adjust our operations and systems in certain markets where we do
business.
For example, from time to time, local governments and others question the legal status of Representatives or impose burdens inconsistent
with the Representative’s status as independent contractors, often in regard to possible coverage under social benefit laws that would
require us (and, in most instances, the Representatives) to make regular contributions to government social benefit funds.
If we are unable to address these matters in a satisfactory manner, or adhere to or successfully implement processes in response to changing
regulatory requirements, our business, costs and/or reputation may be adversely affected. We cannot predict with certainty the outcome or
the impact that pending or future legislative and regulatory changes may have on our business in the future.
Our business is subject to a number of foreign laws and regulations in various jurisdictionsgoverning data privacy and security.We collect, use and store personal data of our employees, Representatives, customers and other third parties in the ordinary course of
business, and we are required to comply with increasingly complex and changing data privacy and security laws and regulations, including
with respect to the collection, storage, use, transmission and protection of personal information and other consumer data, including
particularly the transfer of personal data between or among countries. In particular, the European Union (“EU”) has adopted strict data
privacy regulations. Following recent developments such as the European Court of Justice’s 2015 ruling that the transfer of personal data
from the EU to the U.S. under the EU/U.S. Safe Harbor was an invalid mechanism of personal data transfer, the adoption of the EU-U.S.
Privacy Shield as a replacement for the Safe Harbor, and the upcoming effectiveness of the EU’s General Data Protection Regulation
(“GDPR”) in May 2018, along with the proposed Regulation on Privacy and Electronic Communications (the “ePrivacy Regulation”), also on
the horizon, data privacy and security compliance in the EU are increasingly complex and challenging. The GDPR in particular has broad
extraterritorial effect and imposes a strict data protection compliance regime with significant penalties for non-compliance. In general, the
GDPR and ePrivacy Regulation, and other local privacy laws, could also require adaptation of our technologies or practices to satisfy local
privacy requirements and standards. We may also face audits or investigations by one or more domestic or foreign government agencies
relating to our compliance with these regulations. An adverse outcome under any such investigation or audit could subject us to fines,
penalties or orders to cease, delay or modify collection, use or transfers of personal data. That or other circumstances related to our
collection, use and transfer of personal data could cause a loss of reputation in the market or adversely affect our business.
The scope of data privacy and security regulations continues to evolve, and we believe that the adoption of increasingly restrictive
regulations in this area may be likely within the jurisdictions in which we operate. Compliance with data privacy and security restrictions
could increase the cost of our operations and failure to comply with such restrictions could subject us to criminal and civil sanctions as well
as other penalties.
A failure, disruption, cyberattack or other breach in the security of an IT system orinfrastructure that we utilize could adversely affect our business and reputation and increaseour costs.We employ IT systems to support our business, including systems to support financial reporting, web-based tools, an enterprise resource
planning (“ERP”) system, and internal communication and data transfer networks. We also employ IT systems to support Representatives in
our markets, including electronic order collection, invoicing systems, shipping and box packing, social media tools, mobile applications and
on-line training. We have e-commerce and Internet sites, including business-to-business websites to support Representatives. We use third-
party service providers in many instances to provide or support these IT systems. Over the last several years, we have undertaken initiatives to
increase our reliance on IT systems which has resulted in the outsourcing of certain services and functions, such as global human resources IT
systems, call center support, Representative support services and other IT processes. Our IT systems and infrastructure, as well as the systems,
infrastructure and services of those of third parties, are integral to our performance.
Any of our IT systems and infrastructure, or those of our third-party service providers, may be susceptible to outages, disruptions, destruction
or corruption due to the complex landscape of localized applications and architectures as well as incidents related to legacy or unintegrated
systems. These IT systems and infrastructure also may be susceptible to cybersecurity breaches, attacks, break-ins, including ransomware and
phishing attacks, data corruption, fire, floods, power loss, telecommunications failures, terrorist attacks and similar events beyond our
A V O N 2017 13

PART I
control. We rely on our employees, Representatives and third parties in our day-to-day and ongoing operations, who may, as a result of
human error or malfeasance or failure, disruption, cyberattack or other security breach of third-party systems or infrastructure, expose us to
risk. Furthermore, our ability to protect and monitor the practices of our third-party service providers is more limited than our ability to
protect and monitor our own IT systems and infrastructure.
Our IT systems, or those of our third-party service providers may be accessed by unauthorized users such as cyber criminals as a result of a
failure, disruption, cyberattack or other security breach, exposing us to risk. As techniques used by cyber criminals change frequently, a
failure, disruption, cyberattack or other security breach may go undetected for a long period of time. A failure, disruption, cyberattack or
other security breach of our IT systems or infrastructure, or those of our third-party service providers, could result in the theft, transfer,
unauthorized access to, disclosure, modification, misuse, loss, or destruction of Company, employee, Representative, customer, vendor, or
other third-party data, including sensitive or confidential data, personal information and intellectual property. For example, the Company
uses a newswire service that has been subject to the hacking of not-yet-issued press releases by hackers in order to trade on securities using
the information contained in such press releases.
We are investing in industry-standard solutions and protections and monitoring practices of our data and IT systems and infrastructure to
reduce these risks and we continue to monitor our IT systems and infrastructure on an ongoing basis for any current or potential threats. We
have also deployed additional employee security training and updated security policies for the Company and its third-party service providers.
Such efforts and investments are costly, and as cyber threats continue to evolve, we may be required to expend significant additional
resources to continue to modify or enhance our protective measures or to investigate and remediate any information security vulnerabilities.
As a company that operates globally, we could also be impacted by commercial agreements between us and processing organizations,
existing and proposed laws and regulations, and government policies and practices related to cybersecurity, privacy and data protection.
Despite our efforts, our and our third-party service providers’ data, IT systems and infrastructure may be vulnerable. There can be no assurance
that our efforts will prevent a failure, disruption, cyberattack or other security breach of our or our third-party service providers’ IT systems or
infrastructure, or that we will detect and appropriately respond if there is such a failure, disruption, cyberattack or other security breach. Our IT
databases and systems have been, and will likely continue to be, subject to ransomware, denial of service and phishing attacks, none of which
has been material to the Company to date. Any such failure, disruption, cyberattack or other security breach could adversely affect our
business including our ability to expand our business, cause damage to our reputation, result in increased costs to address internal data,
security, and personnel issues, and result in violations of applicable privacy laws and other laws and external financial obligations such as
governmental fines, penalties, or regulatory proceedings, remediation efforts such as breach notification and identity theft monitoring, and
third-party private litigation with potentially significant costs. In addition, it could result in deterioration in our employees’, Representatives’,
customers’, or vendors’ confidence in us, which could cause them to discontinue doing business with us or result in other competitive
disadvantages. In addition, there may be other challenges and risks as we upgrade, modernize, and standardize our IT systems globally.
We face intense competition and can make no assurances about our ability to overcome ourcompetitive challenges.We face intense competition from competing products in each of our lines of business in the markets we operate. We compete against
products sold to consumers in a number of distribution methods, including direct selling, through the Internet, and through mass market
retail and prestige retail channels. We also face increasing direct-selling and retail competition in our developing and emerging markets,
particularly Brazil and Russia.
Within the direct-selling channel, we often compete on country-by-country basis with our direct-selling competitors. There are a number of
direct-selling companies that sell product lines similar to ours, some of which have worldwide operations and compete with us globally.
Unlike a typical consumer packaged goods (“CPG”) company which operates within a broad-based consumer pool, direct sellers compete
for representative or entrepreneurial talent by providing a more competitive earnings opportunity or “better deal” than that offered by the
competition. Providing a compelling earnings opportunity for the Representatives is as critical as developing and marketing new and
innovative products. Therefore, in contrast to typical CPG companies, we must first compete for a limited pool of Representatives before we
reach the ultimate consumer.
Representatives are attracted to a direct seller by competitive earnings opportunities, often through what are commonly known as “field
incentives” in the direct-selling industry. Competitors devote substantial effort to finding out the effectiveness of such incentives so that they

can invest in incentives that are the most cost-effective or produce the better payback. As one of the largest and oldest beauty direct sellers
globally, Avon’s business model and strategies are often highly sought after, particularly by smaller and more nimble competitors who seek
to capitalize on our investment and experience. As a result, we are subject to significant competition for the recruitment of Representatives
from other direct-selling or network marketing organizations as well as significant competition from other non-direct selling earnings
opportunities for which our existing Representatives or potential Representatives could avail themselves. It is therefore continually necessary
to innovate and enhance our direct-selling and service model as well as to recruit and retain new Representatives. If we are unable to do so,
our business will be adversely affected.
Within the broader CPG industry, we principally compete against large and well-known cosmetics (color), fragrance and skincare companies
that manufacture and sell broad product lines through various types of retail establishments and other channels, including through the
Internet. In addition, we compete against many other companies that manufacture and sell more narrow beauty product lines sold through
retail establishments and other channels, including through the Internet. This industry is highly competitive, and some of our principal
competitors in the CPG industry are larger than we are and have greater resources than we do. Competitive activities on their part could
cause our sales to suffer. We also have many highly competitive global branded and private label competitors in the accessories, apparel,
housewares, and gift and decorative products industries, including retail establishments, principally department stores, mass merchandisers,
gift shops and specialty retailers. Our principal competition in the highly competitive fashion jewelry industry consists of a few large
companies and many small companies that sell fashion jewelry through department stores, mass merchandisers, specialty retailers and
e-commerce.
The number of competitors and degree of competition that we face in the beauty and related products industry varies widely from country
to country. If our advertising, promotional, merchandising or other marketing strategies are not successful, if we are unable to improve our
product mix and offer new products that represent technological breakthroughs and are aligned with local preferences, if we do not
successfully manage the timing of new product introductions or the profitability of these efforts, if we are unable to improve the
Representative experience, or if for other reasons the Representatives or end customers perceive competitors’ products as having greater
appeal, then our sales, results of operations and cash flows will be adversely affected.
Third-party suppliers provide, among other things, the raw materials required for our Beautyproducts, and the loss of these suppliers, a supplier’s inability to supply a raw material or afinished product or a disruption or interruption in the supply chain may adversely affect ourbusiness.We manufacture and package the majority of our Beauty products, which are formulated and designed by our staff of chemists, designers
and artists. Raw materials, consisting chiefly of essential oils, chemicals, containers and packaging components required for our Beauty
products are purchased from a range of third-party suppliers. The remainder of our Beauty products and all of our Fashion & Home products
are purchased from various third-party manufacturers. Our products are affected by the cost and availability of materials such as glass,
plastics, chemicals and fabrics. For the vast majority of items we have more than one source of supply available. We believe that we can
continue to obtain sufficient raw materials and supplies to manufacture and produce our Beauty products for the foreseeable future.
Additionally, we design the brochures that are used by the Representatives to sell our products. The brochures are then produced on our
behalf by a range of printing suppliers.
The loss of any one supplier would not have a material impact on our ability to source raw materials for the majority of our Beauty products
or source products for the remainder of our Beauty products and all of our Fashion & Home products or paper for the brochures. This risk
may be exacerbated by our globally-coordinated purchasing strategy, which leverages volumes. Regulatory action, such as restrictions on
importation, may also disrupt or interrupt our supply chain. Furthermore, increases in the costs of raw materials or other commodities may
adversely affect our profit margins if we are unable to pass along any higher costs in the form of price increases or otherwise achieve cost
efficiencies in manufacturing and distribution. In addition, if our suppliers fail to use ethical business practices and comply with applicable
laws and regulations, such as any child labor laws, our reputation could be harmed due to negative publicity.
The recently enacted comprehensive U.S. tax reform legislation could adversely affect ourbusiness and financial condition.On December 22, 2017, the Tax Cuts and Jobs Act was enacted that significantly revises the Internal Revenue Code of 1986, as amended.
The newly enacted federal income tax law contains significant changes to corporate taxation, including but not limited to, a reduction of the
A V O N 2017 15

PART I
corporate tax rate from a top marginal rate of 35% to a flat rate of 21%, a limitation of the tax deduction for interest expense to 30% of
adjusted earnings (except for certain small businesses), a one-time tax on offshore earnings at reduced rates regardless of whether the funds
are physically repatriated, elimination of U.S. tax on foreign earnings (subject to certain important exceptions), immediate deductions for
certain new investments instead of deductions for depreciation expense over time, and modifying or repealing many business deductions
and credits. Notwithstanding the reduction in the corporate income tax rate, it is unclear how certain provisions of the new federal tax law
(including provisions aimed at taxing foreign earnings at a minimum level) will be applied absent further legislative clarification and
guidance. In addition, it is uncertain if and to what extent various states will conform to the newly-enacted federal tax law. These
uncertainties and the ultimate interpretation of the federal provisions may adversely affect our business and financial condition.
Our ability to utilize our foreign tax and other U.S. credits to offset our future taxable incomemay be limited under Sections 382 and 383 of the Internal Revenue Code.As of December 31, 2017, we had approximately $968 million of foreign tax and other credits available to offset future income for
U.S. federal tax purposes. Our ability to utilize such credits to offset future income could be limited, however, if the Company undergoes an
“ownership change” within the meaning of Section 382 of the Internal Revenue Code of 1986, as amended (the “Code”). In general, an
ownership change will occur if there is a cumulative increase in ownership of our stock by 5% shareholders (as defined in the Code) that
exceeds 50 percentage points over a rolling three-year period. If the 50 percentage points are exceeded, Section 382 establishes an annual
limitation on the amount of deferred tax assets attributable to previously incurred credits that may be used to offset taxable income in future
years. A number of complex rules apply in calculating this limitation, and any such limitation would depend in part on the market value of
the Company at the time of the ownership change and prevailing interest rates at the time of calculation. As a result, the magnitude of any
potential limitation on the use of our deferred tax assets and the effect of such limitation on the Company if an ownership change were to
occur is difficult to assess. However, if all or a portion of our deferred tax assets were to become subject to this limitation, our tax liability
could increase significantly and our future results of operations and cash flows could be adversely impacted.
We currently believe an ownership change has not occurred. However, in recent periods, we have experienced fluctuations in the market
price of our stock and changes in ownership by our 5% shareholders. In addition, the issuance and sale of perpetual convertible preferred
stock to Cerberus Investor (as defined below) resulted in an increase in our cumulative ownership change by our 5% shareholders.
Significant changes in pension fund investment performance, assumptions relating to pensioncosts or required legal changes in pension funding rules may have a material effect on thevaluation of pension obligations, the funded status of pension plans and our pension cost.Our funding policy for pension plans is to meet the minimum required contributions under applicable law and accumulate plan assets that,
over the long run, are expected to approximate the present value of projected benefit obligations. Our pension cost is materially affected by
the discount rate used to measure pension obligations, the level of plan assets available to fund those obligations at the measurement date
and the expected long-term rate of return on plan assets. Significant changes in investment performance or a change in the portfolio mix of
invested assets can result in corresponding increases and decreases in the valuation of plan assets, including equity and debt securities and
derivative instruments, or in a change of the expected rate of return on plan assets. A change in the discount rate could result in a significant
increase or decrease in the valuation of pension obligations, affecting the reported funded status of our pension plans as well as the net
periodic pension cost in the following fiscal years. Similarly, changes in the expected rate of return on plan assets can result in significant
changes in the net periodic pension cost. Please see “Critical Accounting Estimates – Pension and Postretirement Expense” within MD&A on
pages 32 through 34 and Note 13, Employee Benefit Plans on pages F-34 through F-43 of our 2017 Annual Report, for additional
information regarding the impact of these factors on our pension plan obligations.
Any strategic alliances or divestitures may expose us to additional risks.We evaluate potential strategic alliances that would complement our current product offerings, increase the size and geographic scope of
our operations or otherwise offer growth and/or operating efficiency opportunities. Strategic alliances may entail numerous risks, including:
• substantial costs, delays or other operational or financial difficulties, including difficulties in leveraging synergies among the businesses to
increase sales and obtain cost savings or achieve expected results;
• difficulties in assimilating acquired operations or products, including the loss of key employees from any acquired businesses and
disruption to our direct-selling channel;
• diversion of management’s attention from our core business;

• adverse effects on existing business relationships with suppliers and customers;
• risks of entering markets in which we have limited or no prior experience; and
• reputational and other risks regarding our ability to successfully implement such strategic alliances, including obtaining financing which
could dilute the interests of our shareholders, result in an increase in our indebtedness or both.
Our failure to successfully complete the integration of any new or acquired businesses could have a material adverse effect on our business,
prospects, financial condition, liquidity, results of operations and cash flows. In addition, there can be no assurance that we will be able to
identify suitable candidates or consummate such transactions on favorable terms.
For divestitures, success is also dependent on effectively and efficiently separating the divested unit or business from the Company and
reducing or eliminating associated overhead costs. In cases where a divestiture is not successfully implemented or completed, the Company’s
business, prospects, financial condition, liquidity, results of operations and cash flows could be adversely affected. Please see “Risks Related
to the Separation of North America and the Preferred Stock Investment in the Company” below for additional information regarding the
risks associated with the separation of North America.
The loss of, or a disruption in, our manufacturing and distribution operations could adverselyaffect our business.Our principal properties consist of worldwide manufacturing facilities for the production of Beauty products, distribution centers where
offices are located and where finished merchandise is packed and shipped to Representatives in fulfillment of their orders, and one principal
research and development facility. Additionally, we use third-party manufacturers to manufacture certain of our products. Therefore, as a
company engaged in manufacturing, distribution and research and development on a global scale, we are subject to the risks inherent in
such activities, including industrial accidents, environmental events, fires, strikes and other labor or industrial disputes, disruptions in logistics
or information systems (such as our ERP system), loss or impairment of key manufacturing or distribution sites, product quality control issues,
safety concerns, licensing requirements and other regulatory or government issues, as well as natural disasters, pandemics, border disputes,
acts of terrorism and other external factors over which we have no control. These risks may be exacerbated by our efforts to increase facility
consolidation covering our manufacturing, distribution and supply footprints, particularly if we are unable to successfully increase our
resiliency to potential operational disruptions or enhance our disaster recovery planning. The loss of, or damage to, any of our facilities or
centers, or those of our third-party manufacturers, could have a material adverse effect on our business, prospects, financial condition,
liquidity, results of operations and cash flows.
Our success depends, in part, on the quality, safety and efficacy of our products.Our success depends, in part, on the quality, safety and efficacy of our products. If our products are found to be, or perceived to be,
defective or unsafe, or if they otherwise fail to meet the Representatives’ or end customers’ standards, then our relationship with the
Representatives or end customers could suffer, we may need to recall some of our products and/or become subject to regulatory action, our
reputation or the appeal of our brand could be diminished, we could lose market share, and we could become subject to liability claims, any
of which could result in a material adverse effect on our business, prospects, financial condition, liquidity, results of operations and cash
flows.
If we are unable to protect our intellectual property rights, specifically patents andtrademarks, our ability to compete could be adversely affected.The market for our products depends to a significant extent upon the value associated with our product innovations and our brand equity.
We own the material patents and trademarks used in connection with the marketing and distribution of our major products where such
products are principally sold. Although most of our material intellectual property is registered in certain countries in which we operate, there
can be no assurance with respect to the rights associated with such intellectual property in those countries. In addition, the laws of certain
foreign countries, including many emerging markets, may not completely protect our intellectual property rights. The costs required to
protect our patents and trademarks, especially in emerging markets, may be substantial. Please see “The licensing of our North America
intellectual property rights, including trademarks that are fundamental to our brand, in connection with the Separation could adversely
impact our reputation, our business generally, and our ability to enforce intellectual property rights used in both North America and
international jurisdictions” below for additional information regarding the risks on our intellectual property rights associated with the
separation of North America.
A V O N 2017 17

PART I
We are involved, and may become involved in the future, in legal proceedings that, ifadversely adjudicated or settled, could adversely affect our financial results.We are and may, in the future, become party to litigation, including, for example, claims alleging violation of the federal securities laws or
claims relating to employee or employment matters, our products or advertising. In general, litigation claims can be expensive and time-
consuming to bring or defend against and could result in settlements or damages that could significantly affect our financial results and the
conduct of our business. We are currently vigorously contesting certain of these litigation claims. However, it is not possible to predict the
final resolution of the litigation to which we currently are or may in the future become party, or to predict the impact of certain of these
matters on our business, prospects, financial condition, liquidity, results of operations and cash flows. See Note 18, Contingencies on pages
F-51 through F-53 of our 2017 Annual Report for a detailed discussion regarding certain legal proceedings in which we are a party.
Government reviews, inquiries, investigations, and actions could harm our business orreputation. In addition, from time to time we may conduct other investigations and reviews,the consequences of which could negatively impact our business or reputation.As we operate in various locations around the world, our operations in certain countries are subject to significant governmental scrutiny and
may be harmed by the results of such scrutiny. The regulatory environment with regard to direct selling in emerging and developing markets
where we do business is evolving, and government officials in such locations often exercise broad discretion in deciding how to interpret and
apply relevant regulations. From time to time, we may receive formal and informal inquiries from various government regulatory authorities
about our business and compliance with local laws and regulations. In addition, from time to time, we may conduct investigations and
reviews. The consequences of such government reviews, inquiries, investigations, and actions or such investigations and reviews may
adversely impact our business, prospects, reputation, financial condition, liquidity, results of operations or cash flows.
Additionally, any determination that our operations or activities, or, where local law mandates, the activities of the Representatives, including
our licenses or permits, importing or exporting, or product testing or approvals are not, or were not, in compliance with existing laws or
regulations could result in the imposition of substantial fines, civil and criminal penalties, interruptions of business, loss of supplier, vendor or
other third-party relationship, termination of necessary licenses and permits, modification of business practices and compliance programs,
equitable remedies, including disgorgement, injunctive relief and other sanctions that we may take against our personnel or that may be
taken against us or our personnel. Other legal or regulatory proceedings, as well as government investigations, which often involve complex
legal issues and are subject to uncertainties, may also follow as a consequence. Further, other countries in which we do business may initiate
their own investigations and impose similar sanctions. These proceedings or investigations could be costly and burdensome to our
management, and could adversely impact our business, prospects, reputation, financial condition, liquidity, results of operations or cash
flows. Even if an inquiry or investigation does not result in any adverse determinations, it potentially could create negative publicity and give
rise to third-party litigation or action.
We were subject to a deferred prosecution agreement with the U.S. Department of Justice(the “DOJ”) and are subject to a consent to settlement with the U.S. Securities and ExchangeCommission (the “SEC”). Pursuant to the consent to settlement, the Company mustundertake self-reporting obligations until July 2018. Compliance with these obligations coulddivert members of management’s time from the operation of our business. Ongoing costsand burdens could be significant.In December 2014, the U.S. District Court for the Southern District of New York (the “USDC”) approved a deferred prosecution agreement
between the Company and the DOJ (the “DPA”) and in January 2015, the USDC approved a consent to settlement with the SEC (the
“Consent”) in connection with the previously disclosed Foreign Corrupt Practices Act (the “FCPA”) investigations. The DPA has expired, and
the charges against the Company were dismissed with prejudice on February 5, 2018.
Under the DPA and the Consent, among other things, the Company agreed to have a compliance monitor (the “monitor”). During July
2015, the Company engaged a monitor, who had been approved by the DOJ and the SEC. The monitor recommended some changes to our
policies and procedures that we have adopted and in August 2017, the monitor certified that the Company’s compliance program was
reasonably designed and implemented to detect and prevent violations of the anti-corruption laws and was functioning effectively,
consistent with the requirements of the DPA and the Consent. The monitor has been replaced by the Company, which has undertaken self-
reporting obligations for the remainder of the monitoring period. The Company submitted its first self-report to the DOJ and the SEC in

January 2018. The Company will continue self-reporting to the SEC until the monitoring period expires, which is scheduled under the
Consent to occur in July 2018.
The third-party costs incurred in connection with ongoing compliance with self-reporting and the Consent have not been material to date.
While we do not anticipate material costs going forward, the Company’s self-reporting obligations may be costly and/or time-consuming.
The affirmative vote in the UK to withdraw from the EU may adversely affect our business.On June 23, 2016, the UK held a referendum in which voters approved an exit from the EU, commonly referred to as “Brexit.” As a result of
the referendum, the UK parliament voted in March 2017 to trigger Article 50 of the Treaty on European Union, commencing the UK’s
official withdrawal process from the EU. In June 2017, the UK and EU initiated negotiations, which are currently ongoing, to determine the
future terms of the parties’ relationship, including the terms of trade between the UK and the EU and other nations. The UK is due to leave
the EU on March 29, 2019 unless the negotiations are extended by unanimous consent of the European Council. Uncertainty regarding the
final terms of the negotiations and related regulatory changes could adversely affect business activity, political stability and economic
conditions in the UK, the Eurozone, the EU and elsewhere. Any of these developments could have a material adverse effect on business
activity in the UK, the Eurozone, or the EU. Given that we conduct a substantial portion of our business in the EU and the UK, and our
corporate headquarters has been relocated to the UK, any of these developments could have a material adverse effect on our business,
financial position, liquidity and results of operations or cash flows.
The uncertainty concerning the timing and terms of the exit could also have a negative impact on the growth of the UK and/or EU
economies and cause greater volatility in the pound sterling, euro and/or other currencies. Changes in foreign currency exchange rates may
have a material effect on our net sales, financial condition, profitability and/or cash flows and may reduce the reported value of our
operating results.
Changes to UK border and immigration policy could likewise occur as a result of Brexit, affecting our ability to recruit and retain employees
from outside the UK. While the full scope of implementation of the referendum decision is still unclear, companies exposed to or with
operations in the UK, such as ours, may face significant regulatory changes as a result of Brexit implementation, and complying with such
new regulatory mandates may prove challenging and costly.
The market price of our common stock could be subject to fluctuations as a result of manyfactors.Factors that could affect the trading price of our common stock include the following:
• variations in operating results;
• developments in connection with any investigations or litigations;
• a change in our credit ratings;
• economic conditions and volatility in the financial markets;
• announcements or significant developments in connection with our business and with respect to beauty and related products or the
beauty industry in general;
• actual or anticipated variations in our quarterly or annual financial results;
• unsolicited takeover proposals, proxy contests or other shareholder activism;
• governmental policies and regulations;
• estimates of our future performance or that of our competitors or our industries;
• general economic, political, and market conditions;
• market rumors; and
• factors relating to competitors.
The trading price of our common stock has been, and could in the future continue to be, subject to significant fluctuations.
A V O N 2017 19

PART I
Risks Related to the Separation of North America and the Preferred StockInvestment in the Company
We may be exposed to claims and liabilities as a result of the separation of our North Americabusiness.On March 1, 2016, Cleveland Apple Investor L.P. (“Cerberus Investor”) (an affiliate of Cerberus Capital Management L.P. (“Cerberus”)
contributed $170 million of cash into New Avon LLC (“New Avon”) in exchange for 80.1% of its membership interests, and we contributed
(i) assets primarily related to our North America business (including approximately $100 million of cash, subject to certain adjustments),
(ii) certain assumed liabilities (primarily pension and postretirement liabilities) of our North America business and (iii) the employees of our
North America business into New Avon in exchange for a 19.9% ownership interest of New Avon (collectively, the “Separation”). In
connection with the Separation, we entered into a Separation Agreement and various other agreements with New Avon to govern the
separation and the relationship of the two companies going forward. These agreements provide for specific indemnity and liability
obligations and could lead to disputes between us. The indemnity rights we have against New Avon under the agreements may not be
sufficient to protect us. In addition, our indemnity obligations to New Avon may be significant and these risks could negatively affect our
financial condition.
We or New Avon may fail to perform under the post-closing arrangements executed inconnection with the Separation.In connection with the Separation, we and New Avon entered into several agreements, including among others a Transition Services
Agreement, an Intellectual Property License Agreement, a Technical Support and Innovation Agreement and a Manufacturing and Supply
Agreement. Although most of the services provided under the Transition Services Agreement have terminated, we are still required to
perform certain information technology-related services, for the benefit of New Avon in 2018. The Intellectual Property License Agreement
provides New Avon with rights to use certain intellectual property rights that we used in the conduct of the North America business prior to
the Separation. The Technical Support and Innovation Agreement provides that we will perform certain beauty product development services
for New Avon through December 31, 2018. The Manufacturing and Supply Agreement provides that we and New Avon will manufacture
and supply certain products to each other for an initial term through December 31, 2018. These agreements establish a bilateral relationship
between New Avon and us. We will rely on New Avon to satisfy its performance and payment obligations under these agreements. If New
Avon is unable to satisfy its obligations under these agreements, we could incur operational difficulties or losses that could have a material
and adverse effect on our business, financial condition and results of operations.
The licensing of our North America intellectual property rights, including trademarks that arefundamental to our brand, in connection with the Separation could adversely impact ourreputation, our business generally, and our ability to enforce intellectual property rights usedin both North America and international jurisdictions.In connection with the Separation, we granted New Avon a perpetual, irrevocable, royalty-free license, with the ability to sublicense, to
certain intellectual property rights that we used in the conduct of our North America business prior to the Separation. The Intellectual
Property License Agreement includes quality control provisions obligating New Avon and its sublicensees to remain in compliance with
applicable law or, for certain of our brands, quality standards that we have provided to New Avon, when selling products under certain
trademarks that we have licensed to New Avon. However, there is a risk that failure by New Avon or its sublicensees to comply with such
quality control provisions or other conduct by New Avon or its sublicensees associated with the trademarks licensed to New Avon, could
adversely affect our reputation and our business globally. We have also granted New Avon enforcement rights to intellectual property
licensed to New Avon in certain circumstances, which could adversely affect our position and options globally relating to enforcement of our
intellectual property.
The issuance of 435,000 shares of our series C preferred stock to Cerberus Investor dilutesthe ownership of holders of our common stock and may adversely affect the market price ofour common stock.On March 1, 2016, we issued and sold to Cerberus Investor 435,000 shares of newly issued series C preferred stock for an aggregate
purchase price of $435 million pursuant to an Investment Agreement between us and Cerberus Investor. Conversion of the series C
preferred stock would dilute the ownership interest of existing holders of our common stock, and any sales in the public market of the

common stock issuable upon conversion of the series C preferred stock could adversely affect the market price of our common stock. We
have granted Cerberus Investor registration rights with respect to the shares of series C preferred stock and shares of common stock issued
upon conversion of the series C preferred stock, which would facilitate the resale of such securities into the public market. On October 11,
2016, the Company filed a registration statement on Form S-3ASR with the SEC registering for sale by Cerberus Investor 435,000 shares of
series C preferred stock, 142,800 shares of series D preferred stock and 113,311,940 shares (plus an additional unspecified number) of
common stock. As of the date of this filing, Cerberus Investor had not made any sales in reliance on such Form S-3ASR. Sales by Cerberus
Investor of a substantial number of shares of our common stock in the public market, or the perception that such sales might occur, could
have a material adverse effect on the price of our common stock.
The series C preferred stock issued to Cerberus Investor has rights, preferences and privilegesthat are not held by, and are preferential to, the rights of holders of our common stock. Suchpreferential rights could adversely affect our liquidity, cash flows and financial condition, andmay result in the interests of Cerberus Investor differing from those of our commonshareholders.The series C preferred stock ranks senior to the shares of our common stock with respect to dividend rights and rights on the distribution of
assets on any liquidation, dissolution or winding up of our affairs. The series C preferred stock has a liquidation preference of $1,000 per
share, representing an aggregate liquidation preference of $435 million upon issuance. Holders of series C preferred stock are entitled to
participate on an as-converted basis in any dividends paid to the holders of shares of our common stock. In addition, cumulative preferred
dividends accrue daily on the series C preferred stock and are payable at the rate of 1.25% per quarter (net of any dividends on our
common stock and subject to a maximum rate of 5.00% per quarter if we breach certain obligations). Except to the extent not otherwise
previously paid by us, preferred dividends are payable on the seventh anniversary of the issuance date of the series C preferred stock as and
when declared by the Board of Directors and at the end of each quarter thereafter. Accrued and unpaid preferred dividends may be paid, at
our option, (i) in cash, (ii) subject to certain conditions, in shares of our common stock or (iii) upon conversion of shares of series C preferred
stock, in shares of our non-voting, non-convertible series D preferred stock, par value $1.00 per share. Any such shares of the series D
preferred stock issued would have similar preferential rights.
Upon certain change of control events involving us, holders of series C preferred stock can require us to repurchase the series C preferred
stock for an amount equal to the greater of (i) an amount in cash equal to 100% of the liquidation preference thereof plus all accrued but
unpaid dividends or (ii) the consideration the holders would have received if they had converted their shares of series C preferred stock into
common stock immediately prior to the change of control event.
Our obligations to pay dividends to the holders of series C preferred stock, and to repurchase the outstanding shares of series C preferred
stock under certain circumstances, could impact our liquidity and reduce the amount of cash flows. Our obligations to the holders of series C
preferred stock could also limit our ability to obtain additional financing or increase our borrowing costs, which could have an adverse effect
on our financial condition. The preferential rights of holders of our series C preferred stock could also result in divergent interests between
Cerberus Investor and those of our common shareholders.
Cerberus Investor is able to exercise significant influence over us, including through its abilityto elect up to three members of our Board of Directors, including the Chairman.Holders of series C preferred stock are entitled to vote generally with holders of our common stock on an as-converted basis (subject to an
agreement to vote in favor of the slate of directors nominated by the Board of Directors, so long as the 25% Ownership Requirement (as
defined below) is met and subject to certain exceptions). Therefore, the series C preferred stock issued to Cerberus Investor effectively
reduces the relative voting power of the holders of our common stock. The shares of series C preferred stock owned by Cerberus Investor
represents approximately 16.6% of the voting rights of our common stock on an as-converted basis. As a result, Cerberus Investor has the
ability to significantly influence the outcome of any matter submitted for the vote of our shareholders. In addition, provided Cerberus
Investor maintains certain levels of beneficial ownership of series C preferred stock and/or common stock, Cerberus Investor has consent
rights over certain actions taken by us, including increasing the size of the Board of Directors, reinstating our quarterly common stock
dividend and incurring indebtedness in excess of certain thresholds.
In addition, Cerberus Investor has certain rights to designate directors to serve on our Board of Directors (one of whom will continue to act
as the Chairman so long as the 50% Ownership Requirement (as defined below) continues to be met). Cerberus Investor will continue to be
A V O N 2017 21

PART I
entitled to elect: (i) three directors to the Board of Directors, so long as Cerberus Investor continues to beneficially own shares of series C
preferred stock and/or shares of common stock that represent, on an as-converted basis, at least 75% of Cerberus Investor’s initial shares of
series C preferred stock on an as-converted basis, (ii) two directors to the Board of Directors, so long as Cerberus Investor continues to
beneficially own shares of series C preferred stock and/or common stock that represent, on an as-converted basis, at least 50% but less than
75% of Cerberus Investor’s initial shares of series C preferred stock on an as-converted basis (the “50% Ownership Requirement”) and
(iii) one director to the Board of Directors, so long as Cerberus Investor continues to beneficially own shares of series C preferred stock and/
or common stock that represent, on an as-converted basis, at least 25% but less than 50% of Cerberus Investor’s initial shares of series C
preferred stock on an as-converted basis (the “25% Ownership Requirement”). Until Cerberus Investor no longer meets the 25% Ownership
Requirement, subject to certain exceptions and to satisfaction by such director designees of independence and other customary
qualifications, Cerberus Investor has the right to have one of its director designees serve on each committee of the Board of Directors.
Notwithstanding the fact that all directors are subject to fiduciary duties and applicable law, the interests of the directors appointed by
Cerberus Investor may differ from the interests of holders of our common stock as a whole or of our other directors.
ITEM 1B. UNRESOLVED STAFF COMMENTS
Not applicable.
ITEM 2. PROPERTIES
Our principal properties worldwide consist of manufacturing facilities for the production of Beauty products, distribution centers where
administrative offices are located and where finished merchandise is packed and shipped to Representatives in fulfillment of their orders, and
one principal research and development facility located in Suffern, NY.
We own property in Rye, NY that is used for an executive and administrative office, as well as for Global IT. In October 2016, an office space
at Chiswick Park in London, UK was leased, and beginning in January 2017, is used for our principal executive office and an administrative
office. Our previous principal executive office location at 777 Third Avenue, New York, NY has been vacated, with certain floors currently
being subleased and certain floors currently in the process of being subleased. We moved our principal executive office to London to be in
closer proximity to many of our commercial markets. In addition, in December 2016, we sold a distribution center in the U.S. which was
inactive.
In addition to the facilities noted above, other principal properties measuring 50,000 square feet or more include the following:
• two manufacturing facilities in Europe, primarily servicing Europe, Middle East & Africa;
• thirteen distribution centers and four administrative offices in Europe, Middle East & Africa;
• two manufacturing facilities, eight distribution centers and one administrative office in South Latin America;
• one manufacturing facility, two distribution centers and one administrative office in North Latin America; and
• four manufacturing facilities and five distribution centers in Asia Pacific, of which one manufacturing facility is inactive.
We consider all of these properties to be in good repair, to adequately meet our needs and to operate at reasonable levels of productive
capacity.
Of all the properties listed above, 26 are owned and the remaining 21 are leased. Many of our properties are used for a combination of
manufacturing, distribution and administration. These properties are included in the above listing based on primary usage.
ITEM 3. LEGAL PROCEEDINGS
Reference is made to Note 18, Contingencies on pages F-51 through F-53 of our 2017 Annual Report.
ITEM 4. MINE SAFETY DISCLOSURES
Not applicable.

PART II
ITEM 5. MARKET FOR REGISTRANT’S COMMON EQUITY, RELATED STOCKHOLDERMATTERS AND ISSUER PURCHASES OF EQUITY SECURITIES
Market for Avon’s Common StockOur common stock is listed on The New York Stock Exchange and trades under the AVP ticker symbol. At December 31, 2017, there were
12,328 holders of record of our common stock. We believe that there are many additional shareholders who are not “shareholders of
record” but who beneficially own and vote shares through nominee holders such as brokers and benefit plan trustees. High and low market
prices and dividends per share of our common stock, in dollars, for 2017 and 2016 are listed below. We suspended the dividend on our
common stock effective in the first quarter of 2016.
2017 2016
Quarter High Low
DividendsDeclaredand Paid High Low
DividendsDeclaredand Paid
First $5.93 $4.21 $– $4.81 $2.38 $–
Second 4.85 3.35 – 5.01 3.53 –
Third 3.75 2.33 – 5.92 3.73 –
Fourth 2.40 1.87 – 6.89 5.04 –
COMPARISON OF 5 YEAR CUMULATIVE TOTAL RETURN(1)
Among Avon Products, Inc., The S&P 500 Index and2017 Peer Group(2)(3)
0
50
100
150
200
250
2012 2013 2014 2015 2016
$ V
alu
e
2017
Avon Products, Inc.
S&P 500
New Peer Group
Old Peer Group
The Stock Performance Graph above assumes a $100 investment on December 31, 2012, in Avon’s common stock, the S&P 500 Index and
the Peer Group. The dollar amounts indicated in the graph above and in the chart below are as of December 31 or the last trading day in the
year indicated.
2012 2013 2014 2015 2016 2017
Avon 100.0 121.3 67.4 30.5 37.9 16.2S&P 500 100.0 132.4 150.5 152.6 170.8 208.1Old Peer Group(2) 100.0 127.1 142.4 137.8 142.9 166.7New Peer Group(3) 100.0 132.6 142.0 154.1 146.8 179.0
(1) Total return assumes reinvestment of dividends at the closing price at the end of each quarter.
A V O N 2017 23
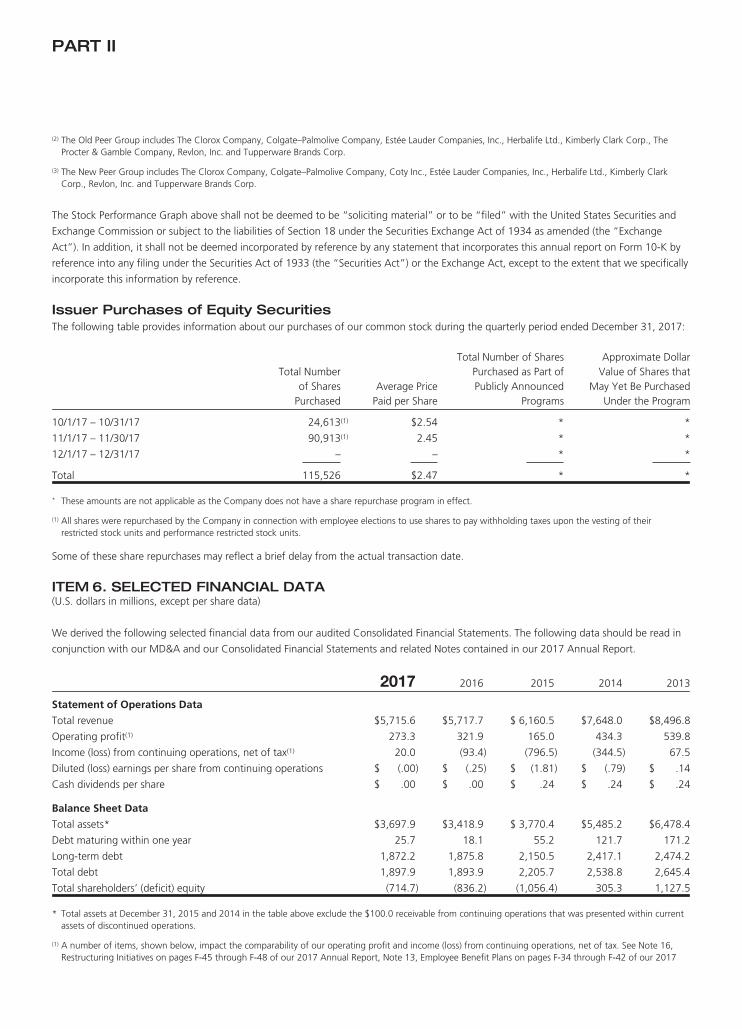
PART II
(2) The Old Peer Group includes The Clorox Company, Colgate–Palmolive Company, Estée Lauder Companies, Inc., Herbalife Ltd., Kimberly Clark Corp., TheProcter & Gamble Company, Revlon, Inc. and Tupperware Brands Corp.
(3) The New Peer Group includes The Clorox Company, Colgate–Palmolive Company, Coty Inc., Estée Lauder Companies, Inc., Herbalife Ltd., Kimberly ClarkCorp., Revlon, Inc. and Tupperware Brands Corp.
The Stock Performance Graph above shall not be deemed to be “soliciting material” or to be “filed” with the United States Securities and
Exchange Commission or subject to the liabilities of Section 18 under the Securities Exchange Act of 1934 as amended (the “Exchange
Act”). In addition, it shall not be deemed incorporated by reference by any statement that incorporates this annual report on Form 10-K by
reference into any filing under the Securities Act of 1933 (the “Securities Act”) or the Exchange Act, except to the extent that we specifically
incorporate this information by reference.
Issuer Purchases of Equity SecuritiesThe following table provides information about our purchases of our common stock during the quarterly period ended December 31, 2017:
Total Numberof Shares
PurchasedAverage Price
Paid per Share
Total Number of SharesPurchased as Part ofPublicly Announced
Programs
Approximate DollarValue of Shares that
May Yet Be PurchasedUnder the Program
10/1/17 – 10/31/17 24,613(1) $2.54 * *
11/1/17 – 11/30/17 90,913(1) 2.45 * *
12/1/17 – 12/31/17 – – * *
Total 115,526 $2.47 * *
* These amounts are not applicable as the Company does not have a share repurchase program in effect.
(1) All shares were repurchased by the Company in connection with employee elections to use shares to pay withholding taxes upon the vesting of theirrestricted stock units and performance restricted stock units.
Some of these share repurchases may reflect a brief delay from the actual transaction date.
ITEM 6. SELECTED FINANCIAL DATA(U.S. dollars in millions, except per share data)
We derived the following selected financial data from our audited Consolidated Financial Statements. The following data should be read in
conjunction with our MD&A and our Consolidated Financial Statements and related Notes contained in our 2017 Annual Report.
2017 2016 2015 2014 2013
Statement of Operations Data
Total revenue $5,715.6 $5,717.7 $ 6,160.5 $7,648.0 $8,496.8
Operating profit(1) 273.3 321.9 165.0 434.3 539.8
Income (loss) from continuing operations, net of tax(1) 20.0 (93.4) (796.5) (344.5) 67.5
Diluted (loss) earnings per share from continuing operations $ (.00) $ (.25) $ (1.81) $ (.79) $ .14
Cash dividends per share $ .00 $ .00 $ .24 $ .24 $ .24
Balance Sheet Data
Total assets* $3,697.9 $3,418.9 $ 3,770.4 $5,485.2 $6,478.4
Debt maturing within one year 25.7 18.1 55.2 121.7 171.2
Long-term debt 1,872.2 1,875.8 2,150.5 2,417.1 2,474.2
Total debt 1,897.9 1,893.9 2,205.7 2,538.8 2,645.4
Total shareholders’ (deficit) equity (714.7) (836.2) (1,056.4) 305.3 1,127.5
* Total assets at December 31, 2015 and 2014 in the table above exclude the $100.0 receivable from continuing operations that was presented within currentassets of discontinued operations.
(1) A number of items, shown below, impact the comparability of our operating profit and income (loss) from continuing operations, net of tax. See Note 16,Restructuring Initiatives on pages F-45 through F-48 of our 2017 Annual Report, Note 13, Employee Benefit Plans on pages F-34 through F-42 of our 2017
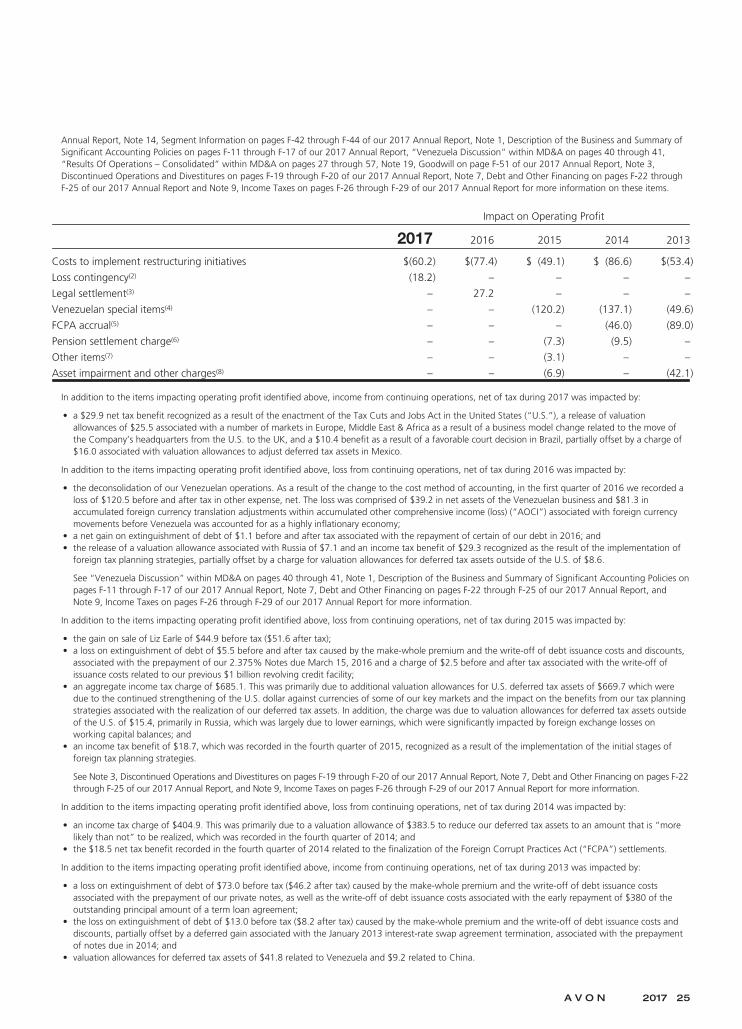
Annual Report, Note 14, Segment Information on pages F-42 through F-44 of our 2017 Annual Report, Note 1, Description of the Business and Summary ofSignificant Accounting Policies on pages F-11 through F-17 of our 2017 Annual Report, “Venezuela Discussion” within MD&A on pages 40 through 41,“Results Of Operations – Consolidated” within MD&A on pages 27 through 57, Note 19, Goodwill on page F-51 of our 2017 Annual Report, Note 3,Discontinued Operations and Divestitures on pages F-19 through F-20 of our 2017 Annual Report, Note 7, Debt and Other Financing on pages F-22 throughF-25 of our 2017 Annual Report and Note 9, Income Taxes on pages F-26 through F-29 of our 2017 Annual Report for more information on these items.
Impact on Operating Profit
2017 2016 2015 2014 2013
Costs to implement restructuring initiatives $(60.2) $(77.4) $ (49.1) $ (86.6) $(53.4)
Loss contingency(2) (18.2) – – – –
Legal settlement(3) – 27.2 – – –
Venezuelan special items(4) – – (120.2) (137.1) (49.6)
FCPA accrual(5) – – – (46.0) (89.0)
Pension settlement charge(6) – – (7.3) (9.5) –
Other items(7) – – (3.1) – –
Asset impairment and other charges(8) – – (6.9) – (42.1)
In addition to the items impacting operating profit identified above, income from continuing operations, net of tax during 2017 was impacted by:
• a $29.9 net tax benefit recognized as a result of the enactment of the Tax Cuts and Jobs Act in the United States (“U.S.”), a release of valuationallowances of $25.5 associated with a number of markets in Europe, Middle East & Africa as a result of a business model change related to the move ofthe Company’s headquarters from the U.S. to the UK, and a $10.4 benefit as a result of a favorable court decision in Brazil, partially offset by a charge of$16.0 associated with valuation allowances to adjust deferred tax assets in Mexico.
In addition to the items impacting operating profit identified above, loss from continuing operations, net of tax during 2016 was impacted by:
• the deconsolidation of our Venezuelan operations. As a result of the change to the cost method of accounting, in the first quarter of 2016 we recorded aloss of $120.5 before and after tax in other expense, net. The loss was comprised of $39.2 in net assets of the Venezuelan business and $81.3 inaccumulated foreign currency translation adjustments within accumulated other comprehensive income (loss) (“AOCI”) associated with foreign currencymovements before Venezuela was accounted for as a highly inflationary economy;
• a net gain on extinguishment of debt of $1.1 before and after tax associated with the repayment of certain of our debt in 2016; and• the release of a valuation allowance associated with Russia of $7.1 and an income tax benefit of $29.3 recognized as the result of the implementation of
foreign tax planning strategies, partially offset by a charge for valuation allowances for deferred tax assets outside of the U.S. of $8.6.
See “Venezuela Discussion” within MD&A on pages 40 through 41, Note 1, Description of the Business and Summary of Significant Accounting Policies onpages F-11 through F-17 of our 2017 Annual Report, Note 7, Debt and Other Financing on pages F-22 through F-25 of our 2017 Annual Report, andNote 9, Income Taxes on pages F-26 through F-29 of our 2017 Annual Report for more information.
In addition to the items impacting operating profit identified above, loss from continuing operations, net of tax during 2015 was impacted by:
• the gain on sale of Liz Earle of $44.9 before tax ($51.6 after tax);• a loss on extinguishment of debt of $5.5 before and after tax caused by the make-whole premium and the write-off of debt issuance costs and discounts,
associated with the prepayment of our 2.375% Notes due March 15, 2016 and a charge of $2.5 before and after tax associated with the write-off ofissuance costs related to our previous $1 billion revolving credit facility;
• an aggregate income tax charge of $685.1. This was primarily due to additional valuation allowances for U.S. deferred tax assets of $669.7 which weredue to the continued strengthening of the U.S. dollar against currencies of some of our key markets and the impact on the benefits from our tax planningstrategies associated with the realization of our deferred tax assets. In addition, the charge was due to valuation allowances for deferred tax assets outsideof the U.S. of $15.4, primarily in Russia, which was largely due to lower earnings, which were significantly impacted by foreign exchange losses onworking capital balances; and
• an income tax benefit of $18.7, which was recorded in the fourth quarter of 2015, recognized as a result of the implementation of the initial stages offoreign tax planning strategies.
See Note 3, Discontinued Operations and Divestitures on pages F-19 through F-20 of our 2017 Annual Report, Note 7, Debt and Other Financing on pages F-22through F-25 of our 2017 Annual Report, and Note 9, Income Taxes on pages F-26 through F-29 of our 2017 Annual Report for more information.
In addition to the items impacting operating profit identified above, loss from continuing operations, net of tax during 2014 was impacted by:
• an income tax charge of $404.9. This was primarily due to a valuation allowance of $383.5 to reduce our deferred tax assets to an amount that is “morelikely than not” to be realized, which was recorded in the fourth quarter of 2014; and
• the $18.5 net tax benefit recorded in the fourth quarter of 2014 related to the finalization of the Foreign Corrupt Practices Act (“FCPA”) settlements.
In addition to the items impacting operating profit identified above, income from continuing operations, net of tax during 2013 was impacted by:
• a loss on extinguishment of debt of $73.0 before tax ($46.2 after tax) caused by the make-whole premium and the write-off of debt issuance costsassociated with the prepayment of our private notes, as well as the write-off of debt issuance costs associated with the early repayment of $380 of theoutstanding principal amount of a term loan agreement;
• the loss on extinguishment of debt of $13.0 before tax ($8.2 after tax) caused by the make-whole premium and the write-off of debt issuance costs anddiscounts, partially offset by a deferred gain associated with the January 2013 interest-rate swap agreement termination, associated with the prepaymentof notes due in 2014; and
• valuation allowances for deferred tax assets of $41.8 related to Venezuela and $9.2 related to China.
A V O N 2017 25
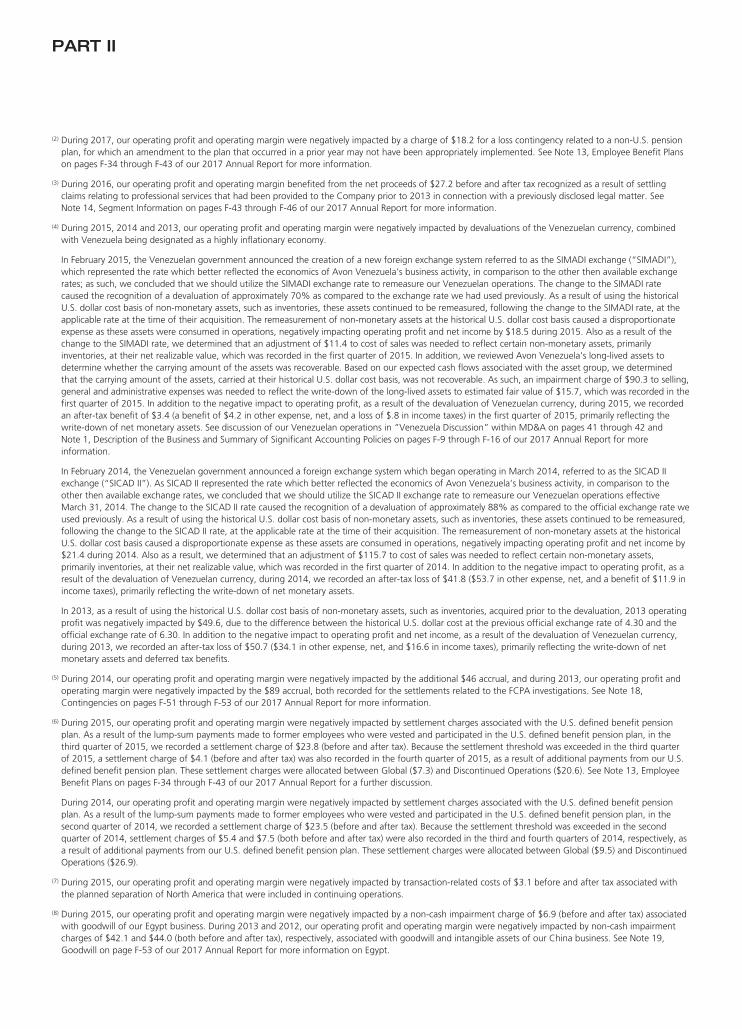
PART II
(2) During 2017, our operating profit and operating margin were negatively impacted by a charge of $18.2 for a loss contingency related to a non-U.S. pensionplan, for which an amendment to the plan that occurred in a prior year may not have been appropriately implemented. See Note 13, Employee Benefit Planson pages F-34 through F-43 of our 2017 Annual Report for more information.
(3) During 2016, our operating profit and operating margin benefited from the net proceeds of $27.2 before and after tax recognized as a result of settlingclaims relating to professional services that had been provided to the Company prior to 2013 in connection with a previously disclosed legal matter. SeeNote 14, Segment Information on pages F-43 through F-46 of our 2017 Annual Report for more information.
(4) During 2015, 2014 and 2013, our operating profit and operating margin were negatively impacted by devaluations of the Venezuelan currency, combinedwith Venezuela being designated as a highly inflationary economy.
In February 2015, the Venezuelan government announced the creation of a new foreign exchange system referred to as the SIMADI exchange (“SIMADI”),which represented the rate which better reflected the economics of Avon Venezuela’s business activity, in comparison to the other then available exchangerates; as such, we concluded that we should utilize the SIMADI exchange rate to remeasure our Venezuelan operations. The change to the SIMADI ratecaused the recognition of a devaluation of approximately 70% as compared to the exchange rate we had used previously. As a result of using the historicalU.S. dollar cost basis of non-monetary assets, such as inventories, these assets continued to be remeasured, following the change to the SIMADI rate, at theapplicable rate at the time of their acquisition. The remeasurement of non-monetary assets at the historical U.S. dollar cost basis caused a disproportionateexpense as these assets were consumed in operations, negatively impacting operating profit and net income by $18.5 during 2015. Also as a result of thechange to the SIMADI rate, we determined that an adjustment of $11.4 to cost of sales was needed to reflect certain non-monetary assets, primarilyinventories, at their net realizable value, which was recorded in the first quarter of 2015. In addition, we reviewed Avon Venezuela’s long-lived assets todetermine whether the carrying amount of the assets was recoverable. Based on our expected cash flows associated with the asset group, we determinedthat the carrying amount of the assets, carried at their historical U.S. dollar cost basis, was not recoverable. As such, an impairment charge of $90.3 to selling,general and administrative expenses was needed to reflect the write-down of the long-lived assets to estimated fair value of $15.7, which was recorded in thefirst quarter of 2015. In addition to the negative impact to operating profit, as a result of the devaluation of Venezuelan currency, during 2015, we recordedan after-tax benefit of $3.4 (a benefit of $4.2 in other expense, net, and a loss of $.8 in income taxes) in the first quarter of 2015, primarily reflecting thewrite-down of net monetary assets. See discussion of our Venezuelan operations in “Venezuela Discussion” within MD&A on pages 41 through 42 andNote 1, Description of the Business and Summary of Significant Accounting Policies on pages F-9 through F-16 of our 2017 Annual Report for moreinformation.
In February 2014, the Venezuelan government announced a foreign exchange system which began operating in March 2014, referred to as the SICAD IIexchange (“SICAD II”). As SICAD II represented the rate which better reflected the economics of Avon Venezuela’s business activity, in comparison to theother then available exchange rates, we concluded that we should utilize the SICAD II exchange rate to remeasure our Venezuelan operations effectiveMarch 31, 2014. The change to the SICAD II rate caused the recognition of a devaluation of approximately 88% as compared to the official exchange rate weused previously. As a result of using the historical U.S. dollar cost basis of non-monetary assets, such as inventories, these assets continued to be remeasured,following the change to the SICAD II rate, at the applicable rate at the time of their acquisition. The remeasurement of non-monetary assets at the historicalU.S. dollar cost basis caused a disproportionate expense as these assets are consumed in operations, negatively impacting operating profit and net income by$21.4 during 2014. Also as a result, we determined that an adjustment of $115.7 to cost of sales was needed to reflect certain non-monetary assets,primarily inventories, at their net realizable value, which was recorded in the first quarter of 2014. In addition to the negative impact to operating profit, as aresult of the devaluation of Venezuelan currency, during 2014, we recorded an after-tax loss of $41.8 ($53.7 in other expense, net, and a benefit of $11.9 inincome taxes), primarily reflecting the write-down of net monetary assets.
In 2013, as a result of using the historical U.S. dollar cost basis of non-monetary assets, such as inventories, acquired prior to the devaluation, 2013 operatingprofit was negatively impacted by $49.6, due to the difference between the historical U.S. dollar cost at the previous official exchange rate of 4.30 and theofficial exchange rate of 6.30. In addition to the negative impact to operating profit and net income, as a result of the devaluation of Venezuelan currency,during 2013, we recorded an after-tax loss of $50.7 ($34.1 in other expense, net, and $16.6 in income taxes), primarily reflecting the write-down of netmonetary assets and deferred tax benefits.
(5) During 2014, our operating profit and operating margin were negatively impacted by the additional $46 accrual, and during 2013, our operating profit andoperating margin were negatively impacted by the $89 accrual, both recorded for the settlements related to the FCPA investigations. See Note 18,Contingencies on pages F-51 through F-53 of our 2017 Annual Report for more information.
(6) During 2015, our operating profit and operating margin were negatively impacted by settlement charges associated with the U.S. defined benefit pensionplan. As a result of the lump-sum payments made to former employees who were vested and participated in the U.S. defined benefit pension plan, in thethird quarter of 2015, we recorded a settlement charge of $23.8 (before and after tax). Because the settlement threshold was exceeded in the third quarterof 2015, a settlement charge of $4.1 (before and after tax) was also recorded in the fourth quarter of 2015, as a result of additional payments from our U.S.defined benefit pension plan. These settlement charges were allocated between Global ($7.3) and Discontinued Operations ($20.6). See Note 13, EmployeeBenefit Plans on pages F-34 through F-43 of our 2017 Annual Report for a further discussion.
During 2014, our operating profit and operating margin were negatively impacted by settlement charges associated with the U.S. defined benefit pensionplan. As a result of the lump-sum payments made to former employees who were vested and participated in the U.S. defined benefit pension plan, in thesecond quarter of 2014, we recorded a settlement charge of $23.5 (before and after tax). Because the settlement threshold was exceeded in the secondquarter of 2014, settlement charges of $5.4 and $7.5 (both before and after tax) were also recorded in the third and fourth quarters of 2014, respectively, asa result of additional payments from our U.S. defined benefit pension plan. These settlement charges were allocated between Global ($9.5) and DiscontinuedOperations ($26.9).
(7) During 2015, our operating profit and operating margin were negatively impacted by transaction-related costs of $3.1 before and after tax associated withthe planned separation of North America that were included in continuing operations.
(8) During 2015, our operating profit and operating margin were negatively impacted by a non-cash impairment charge of $6.9 (before and after tax) associatedwith goodwill of our Egypt business. During 2013 and 2012, our operating profit and operating margin were negatively impacted by non-cash impairmentcharges of $42.1 and $44.0 (both before and after tax), respectively, associated with goodwill and intangible assets of our China business. See Note 19,Goodwill on page F-53 of our 2017 Annual Report for more information on Egypt.

ITEM 7. MANAGEMENT’S DISCUSSION AND ANALYSIS OF FINANCIAL CONDITIONAND RESULTS OF OPERATIONS (“MD&A”)(U.S. dollars in millions, except per share and share data)
You should read the following discussion of the results of operations and financial condition of Avon Products, Inc. and its majority and
wholly owned subsidiaries in conjunction with the information contained in the Consolidated Financial Statements and related Notes
contained in our 2017 Annual Report. When used in this discussion, the terms “Avon,” “Company,” “we,” “our” or “us” mean, unless the
context otherwise indicates, Avon Products, Inc. and its majority and wholly owned subsidiaries.
See “Non-GAAP Financial Measures” on pages 29 through 31 of this management’s discussion and analysis of financial condition and
results of operations (“MD&A”) for a description of how constant dollar (“Constant $”) growth rates (a Non-GAAP financial measure) are
determined and see “Performance Metrics” on page 29 of this MD&A for definitions of our performance metrics (Change in Active
Representatives, Change in units sold, Change in Ending Representatives and Change in Average Order).
OverviewWe are a global manufacturer and marketer of beauty and related products. Our business is conducted primarily in the direct-selling
channel. During 2017, we had sales operations in 56 countries and territories, and distributed products in 18 more. All of our consolidated
revenue is derived from operations of subsidiaries outside of the United States (“U.S.”). Our reportable segments are based on geographic
operations in four regions: Europe, Middle East & Africa; South Latin America; North Latin America; and Asia Pacific. Our product categories
are Beauty and Fashion & Home. Beauty consists of skincare, fragrance and color (cosmetics). Fashion & Home consists of fashion jewelry,
watches, apparel, footwear, accessories, gift and decorative products, housewares, entertainment and leisure products, children’s products
and nutritional products. Sales are made to the ultimate consumer principally through direct selling by Representatives, who are
independent contractors and not our employees.
As of December 31, 2017, we had approximately 6 million active Representatives which represents the number of Representatives
submitting an order in a sales campaign, totaled for all campaigns during the year and then divided by the number of campaigns. The
success of our business is highly dependent on recruiting, retaining and servicing the Representatives.
During 2017, revenue was relatively unchanged compared to the prior-year period, partially benefiting from foreign exchange, while
Constant $ revenue decreased 2%. Our Constant $ revenue decline was primarily driven by declines in Brazil, Russia and the
United Kingdom, partially offset by growth in Argentina and South Africa. The decline in revenue and Constant $ revenue was primarily due
to a 3% decrease in Active Representatives, which was partially offset by higher average order. The decrease in Active Representatives was
impacted by declines in all reportable segments, most significantly in South Latin America (driven by Brazil) and Europe, Middle East & Africa.
The net impact of price and mix increased 2%, primarily due to the inflationary impact on pricing in Argentina, Russia and Mexico. Units
sold decreased 4%, primarily due to declines in Russia, Brazil, Mexico and the United Kingdom. The revenue performance was negatively
impacted most significantly by a decline in Color sales, as we experienced issues in some markets while we segmented our Color category
into three distinct brands. The timing of innovation also impacted the decline in Color sales.
Ending Representatives were relatively unchanged. Ending Representatives at December 31, 2017 as compared to the prior-year period
benefited from growth in Russia, which was offset by a decline in Brazil.
See “Segment Review” in this MD&A for additional information related to changes in revenue by segment.
Transformation PlanIn January 2016, we initiated a transformation plan (the “Transformation Plan”) in order to enable us to achieve our long-term goals of
mid-single-digit Constant $ revenue growth and low double-digit operating margin. The Transformation Plan included three pillars: invest in
growth, reduce costs in an effort to continue to improve our cost structure and improve our financial resilience.
The Transformation Plan was designed to focus on cost savings and financial resilience in the first year, in order to support future investment in
growth. In 2016 we estimate that we achieved cost savings of $120 before taxes, and we significantly strengthened the balance sheet. In 2017 we
estimate that we achieved cost savings of $255 before taxes when comparing to our costs in 2015. These savings include both run-rate savings
from 2016, along with in-year savings from current year initiatives. These savings have mostly been offset by the impact of inflation.
A V O N 2017 27
PART II
In connection with the actions and associated savings discussed above, we have incurred costs to implement (“CTI”) restructuring initiatives
of approximately $167 before taxes associated with the Transformation Plan to-date. In connection with the restructuring actions approved
to-date associated with the Transformation Plan, we expect to realize annualized cost savings of an estimated $110 to $120 before taxes.
During 2017, we realized an estimated $55 before taxes of cost savings associated with the restructuring actions and achieved the majority
of the annualized savings. In addition, we have realized savings from other cost-savings strategies that did not result in restructuring charges.
For the market closures, the expected annualized savings represented the operating loss no longer included within Avon’s operating results
as a result of no longer operating in the respective market. For actions that did not result in the closure of a market, the annualized savings
represent the net reduction of expenses that will no longer be incurred by Avon.
For additional details on restructuring initiatives, see Note 16, Restructuring Initiatives on pages F-46 through F-50 of our 2017 Annual
Report. For additional details on strengthening the balance sheet, see Note 7, Debt and Other Financing on pages F-20 through F-23 of our
2017 Annual Report.
Foundational InitiativesThe Company continues to make progress in a number of key areas. Transformation will require the Company to continue to execute in a
coordinated way against each of these foundational initiatives:
• Deliver a Seamless, Competitive Representative Experience – prioritize investments to upgrade systems;
• Insightful Data & Analytics – improve the Company’s ability to support the Representative and help her run her business more effectively
through deeper insight and analytics into Representative behavior and needs;
• Rigorous Performance Management – the new executive team is a key enabler to driving a performance-based culture for ownership of
results and is working well together, taking action to enforce accountability and beginning to identify ways to drive the right behavior;
and
• Relentless Focus on Execution Capabilities – focus on developing a service mindset and using pilot programs that cover service from end to
end to enable the implementation of changes, with minimal disruption.
The Company believes it has the capacity to achieve its long-term goals of mid single-digit constant-dollar revenue growth and low double-
digit operating margin. However, the Company recognizes it will take time to achieve its long-term goals.
New Accounting StandardsInformation relating to new accounting standards is included in Note 2, New Accounting Standards on pages F-16 through F-17 of our 2017
Annual Report.

Performance MetricsWithin this MD&A, in addition to our key financial metrics of revenue, operating profit and operating margin, we utilize the performance
metrics defined below to assist in the evaluation of our business.
Performance Metrics DefinitionChange in Active Representatives This metric is a measure of Representative activity based on the number of unique
Representatives submitting at least one order in a sales campaign, totaled for all campaigns in
the related period. To determine the change in Active Representatives, this calculation is
compared to the same calculation in the corresponding period of the prior year. Orders in
China are excluded from this metric as our business in China is predominantly retail. Liz Earle
was also excluded from this calculation as it did not distribute through the direct-selling
channel.
Change in units sold This metric is based on the gross number of pieces of merchandise sold during a period, as
compared to the same number in the same period of the prior year. Units sold include
samples sold and products contingent upon the purchase of another product (for example,
gift with purchase or discount purchase with purchase), but exclude free samples.
Change in Ending Representatives This metric is based on the total number of Representatives who were eligible to place an
order in the last sales campaign in the related period as a result of being on an active roster.
To determine the Change in Ending Representatives, this calculation is compared to the same
calculation in the corresponding period of the prior year. Change in Ending Representatives
may be impacted by a combination of factors such as our requirements to become and/or
remain a Representative, our practices regarding minimum order requirements and our
practices regarding reinstatement of Representatives. We believe this may be an indicator of
future revenue performance.
Change in Average Order This metric is a measure of Representative productivity. The calculation is the difference of the
year-over-year change in revenue on a Constant $ basis and the Change in Active
Representatives. Change in Average Order may be impacted by a combination of factors such
as inflation, units, product mix, and/or pricing.
Non-GAAP Financial MeasuresTo supplement our financial results presented in accordance with generally accepted accounting principles in the U.S. (“GAAP”), we disclose
operating results that have been adjusted to exclude the impact of changes due to the translation of foreign currencies into U.S. dollars,
including changes in: revenue, operating profit, Adjusted operating profit, operating margin and Adjusted operating margin. We also refer
to these adjusted financial measures as Constant $ items, which are Non-GAAP financial measures. We believe these measures provide
investors an additional perspective on trends and underlying business results. To exclude the impact of changes due to the translation of
foreign currencies into U.S. dollars, we calculate current-year results and prior-year results at constant exchange rates, which are updated on
an annual basis as part of our budgeting process. Foreign currency impact is determined as the difference between actual growth rates and
Constant $ growth rates.
We also present gross margin, selling, general and administrative expenses as a percentage of revenue, operating profit, operating margin
and effective tax rate on a Non-GAAP basis. We refer to these Non-GAAP financial measures as “Adjusted.” We have provided a
quantitative reconciliation of the Non-GAAP financial measures to the most directly comparable financial measures calculated and reported
in accordance with GAAP. See “Reconciliation of Non-GAAP Financial Measures” within “Results of Operations – Consolidated” on page 37
in this MD&A for this quantitative reconciliation.
The Company uses Non-GAAP financial measures to evaluate its operating performance. These Non-GAAP measures should not be
considered in isolation, or as a substitute for, or superior to, financial measures calculated in accordance with GAAP. The Company believes
investors find the Non-GAAP information helpful in understanding the ongoing performance of operations separate from items that may
A V O N 2017 29

PART II
have a disproportionate positive or negative impact on the Company’s financial results in any particular period. The Company believes that it
is meaningful for investors to be made aware of the impacts of 1) CTI restructuring initiatives; 2) a charge for a loss contingency related to a
non-U.S. pension plan (“Loss contingency”); 3) the net proceeds recognized as a result of settling claims relating to professional services
(“Legal settlement”); 4) charges related to the deconsolidation of our Venezuelan operations as of March 31, 2016 and the devaluation of
Venezuelan currency in February 2015, combined with Venezuela being designated as a highly inflationary economy (“Venezuelan special
items”); 5) the settlement charges associated with the U.S. pension plan (“Pension settlement charge”); 6) a goodwill impairment charge
related to the Egypt business (“Asset impairment charge”); 7) various other items associated with the sale of Liz Earle, the separation of the
North America business and debt-related charges (“Other items”); and, as it relates to our effective tax rate discussion, 8) the net income tax
benefit as a result of the enactment of the Tax Cuts and Jobs Act in the U.S., a release of valuation allowances associated with a number of
markets in Europe, Middle East & Africa, and a benefit as a result of a favorable court decision in Brazil, partially offset by a charge
associated with valuation allowances to adjust deferred tax assets in Mexico, which were recognized in 2017, income tax benefits realized in
2016 and 2015 as a result of tax planning strategies, an income tax benefit in the second quarter of 2016 primarily due to the release of a
valuation allowance associated with Russia and the adjustments associated with our deferred tax assets recorded in 2016 and 2015 (“Special
tax items”).
The Loss contingency includes the impact on our Consolidated Statements of Operations during the second quarter of 2017 caused by a
charge of approximately $18 for a loss contingency related to a non-U.S. pension plan, for which an amendment to the plan that occurred
in a prior year may not have been appropriately implemented.
The Legal settlement includes the impact on our Consolidated Statements of Operations during the third quarter of 2016 associated with
the net proceeds of approximately $27 recognized as a result of settling claims relating to professional services that had been provided to
the Company prior to 2013 in connection with a previously disclosed legal matter.
The Venezuelan special items include the impact on our Consolidated Statements of Operations during the first quarter of 2016 caused by
the deconsolidation of our Venezuelan operations for which we recorded a loss of approximately $120 in other expense, net. The loss was
comprised of approximately $39 in net assets of the Venezuelan business and approximately $81 in accumulated foreign currency
translation adjustments within accumulated other comprehensive loss (“AOCI”) associated with foreign currency changes before Venezuela
was accounted for as a highly inflationary economy. The Venezuelan special items also include the impact on our Consolidated Statements
of Operations in 2015 caused by the devaluations of Venezuelan currency on monetary assets and liabilities, such as cash, receivables and
payables; deferred tax assets and liabilities; and non-monetary assets, such as inventories. For non-monetary assets, the Venezuelan special
items include the earnings impact caused by the difference between the historical U.S. dollar cost of the assets at the previous exchange rate
and the revised exchange rate. In 2015, the Venezuelan special items also include an adjustment of approximately $11 to reflect certain
non-monetary assets at their net realizable value and an impairment charge of approximately $90 to reflect the write-down of the long-lived
assets to their estimated fair value.
The Pension settlement charge includes the impact on our Consolidated Statements of Operations during the third and fourth quarters of
2015 associated with the payments made to former employees who were vested and participated in the U.S. defined benefit pension plan.
Such payments fully settled our pension plan obligation to those participants who elected to receive such payment.
The Asset impairment charge includes the impact on our Consolidated Statements of Operations during the fourth quarter of 2015 caused
by the goodwill impairment charge related to the Egypt business.
The Other items include the impact on our Consolidated Statements of Operations during the third quarter of 2016 due to a net gain on
extinguishment of debt associated with the cash tender offers in August 2016, the debt repurchases in October and December 2016, and
the prepayment of the remaining principal amount of our 4.20% Notes due July 15, 2018 and our 5.75% Notes due March 1, 2018 in
November 2016. The Other items also include the impact during 2015 on our Consolidated Statements of Operations due to the gain on the
sale of Liz Earle. In addition, the Other items include the impact on our Consolidated Statements of Operations in the fourth quarter of 2015
caused by transaction-related costs of $3.1 associated with the planned separation of the North America business that were included in
continuing operations. In addition, Other items in 2015 include the impact on our Consolidated Statements of Operations of the loss on
extinguishment of debt caused by the make-whole premium and the write-off of debt issuance costs and discounts associated with the
prepayment of our 2.375% Notes due March 15, 2016. Other items, in 2015, also include the impact on other expense, net in our
Consolidated Statements of Operations of $2.5 associated with the write-off of issuance costs related to our previous $1 billion revolving
credit facility.

In addition, the effective tax rate discussion includes Special tax items, including the impact on the provision for income taxes in our
Consolidated Statements of Operations during 2017 due to an approximate $30 net benefit recognized as a result of the enactment of the
Tax Cuts and Jobs Act in the U.S., a release of valuation allowances of approximately $26 associated with a number of markets in Europe,
Middle East & Africa, and an approximate $10 benefit as a result of a favorable court decision in Brazil, partially offset by a charge of
approximately $16 associated with valuation allowances to adjust deferred tax assets in Mexico. Special tax items also include the impact on
the provision for income taxes in our Consolidated Statements of Operations during the fourth quarter of 2016 due to the charge of
approximately $9 associated with valuation allowances to adjust certain non-U.S. deferred tax assets to an amount that is “more likely than
not” to be realized. Special tax items also include the impact on the provision for income taxes in our Consolidated Statements of
Operations during the second quarter of 2016 primarily due to the release of a valuation allowance associated with Russia of approximately
$7. Special tax items also include the impact on the provision for income taxes in our Consolidated Statements of Operations during the first
quarter of 2016 and the fourth quarter of 2015 due to income tax benefits of approximately $29 and approximately $19, respectively,
recognized as the result of the implementation of foreign tax planning strategies. Special tax items also include the impact on the provision
for income taxes in our Consolidated Statements of Operations during the first and second quarters of 2015 due to a charge of
approximately $31 and a benefit of approximately $3, respectively, associated with valuation allowances to adjust our U.S. deferred tax
assets to an amount that was “more likely than not” to be realized. The additional valuation allowance was due to the strengthening of the
U.S. dollar against currencies of some of our key markets and its associated effect on our tax planning strategies, and the partial release of
the valuation allowance was due to the weakening of the U.S. dollar against currencies of some of our key markets. Special tax items also
include the impact on the provision for income taxes in our Consolidated Statements of Operations during the third quarter of 2015 due to
a charge of approximately $642 as a result of establishing a valuation allowance for the full amount of our U.S. deferred tax assets due to
the impact of the continued strengthening of the U.S. dollar against currencies of some of our key markets and its associated effect on our
tax planning strategies. Additionally, Special tax items include the impact on the provision for income taxes in our Consolidated Statements
of Operations during the third quarter of 2015 due to a charge of approximately $15 associated with valuation allowances to adjust certain
non-U.S. deferred tax assets to an amount that is “more likely than not” to be realized. The non-U.S. valuation allowance included an
adjustment associated with Russia, which was primarily the result of lower earnings, which were significantly impacted by foreign exchange
losses on working capital balances.
See Note 16, Restructuring Initiatives on pages F-46 through F-50 of our 2017 Annual Report, Note 13, Employee Benefit Plans on
pages F-34 through F-43 of our 2017 Annual Report, Note 14, Segment Information on pages F-43 through F-46 of our 2017 Annual
Report, “Results Of Operations – Consolidated” below, Note 1, Description of the Business and Summary of Significant Accounting Policies
on pages F-9 through F-16 of our 2017 Annual Report, “Venezuela Discussion” below, Note 19, Goodwill on page F-53 of our 2017 Annual
Report, Note 7, Debt and Other Financing on pages F-20 through F-23 of our 2017 Annual Report, and Note 9, Income Taxes on pages F-24
through F-28 of our 2017 Annual Report for more information on these items.
Critical Accounting EstimatesWe believe the accounting policies described below represent our critical accounting policies due to the estimation processes involved in
each. See Note 1, Description of the Business and Summary of Significant Accounting Policies on pages F-9 through F-16 of our 2017
Annual Report for a detailed discussion of the application of these and other accounting policies.
Allowances for Doubtful Accounts ReceivableRepresentatives contact their customers, selling primarily through the use of brochures for each sales campaign, generally on credit if the
Representatives meet certain criteria. Sales campaigns are generally for a three- to four-week duration. The Representative purchases
products directly from us and may or may not sell them to an end user. In general, the Representative, an independent contractor, remits a
payment to us during each sales campaign, which relates to the prior campaign cycle. The Representative is generally precluded from
submitting an order for the current sales campaign until the accounts receivable balance past due for prior campaigns is paid; however,
there are circumstances where the Representative fails to make the required payment. We record an estimate of an allowance for doubtful
accounts on receivable balances based on an analysis of historical data and current circumstances, including seasonality and changing
trends. Over the past three years, annual bad debt expense was $222 in 2017, $191 in 2016 and $144 in 2015, or approximately 4% of
total revenue in 2017, approximately 3% of total revenue in 2016, and approximately 2% of total revenue 2015. The allowance for
doubtful accounts is reviewed for adequacy, at a minimum, on a quarterly basis. We generally have no detailed information concerning, or
any communication with, any end user of our products beyond the Representative. We have no legal recourse against the end user for the
collection of any accounts receivable balances due from the Representative to us. If the financial condition of the Representatives were to
deteriorate, resulting in their inability to make payments, additional allowances may be required.
A V O N 2017 31

PART II
Allowances for Sales ReturnsPolicies and practices for product returns vary by jurisdiction. We record a provision for estimated sales returns based on historical experience
with product returns. Over the past three years, annual sales returns were $198 for 2017, $187 for 2016 and $191 for 2015, or
approximately 3% of total revenue in each year, which has been generally in line with our expectations. If the historical data we use to
calculate these estimates does not approximate future returns, due to changes in marketing or promotional strategies, or for other reasons,
additional allowances may be required.
Provisions for Inventory ObsolescenceWe record an allowance for estimated obsolescence, when applicable, equal to the difference between the cost of inventory and the net
realizable value. In determining the allowance for estimated obsolescence, we classify inventory into various categories based upon its stage
in the product life cycle, future marketing sales plans and the disposition process. We assign a degree of obsolescence risk to products based
on this classification to estimate the level of obsolescence provision. If actual sales are less favorable than those projected, additional
inventory allowances may need to be recorded for such additional obsolescence. Annual obsolescence expense was $37 in 2017, $37 in
2016 and $45 in 2015, or less than 1% of total revenue in each year.
Pension and Postretirement ExpenseWe maintain defined benefit pension plans, the most significant of which are in the United Kingdom (“UK”), Germany and the U.S.
However, our U.S. defined benefit pension plan is closed to employees hired on or after January 1, 2015 and the UK defined benefit pension
plan is closed to employees hired on or after April 1, 2013. Additionally, we have unfunded supplemental pension benefit plans for some
current and retired executives and provide retiree health care benefits subject to certain limitations to certain retired employees in the U.S.
and certain foreign countries. See Note 13, Employee Benefit Plans on pages F-34 through F-43 of our 2017 Annual Report for more
information on our benefit plans.
Pension and postretirement expense and the requirements for funding our major pension plans are determined based on a number of
actuarial assumptions, which are generally reviewed and determined on an annual basis. These assumptions include the discount rate
applied to plan obligations, the expected rate of return on plan assets, the rate of compensation increase of plan participants, price inflation,
cost-of-living adjustments, mortality rates and certain other demographic assumptions, and other factors. We use a December 31
measurement date for all of our employee benefit plans.
For 2017, the weighted average assumed rate of return on all pension plan assets was 5.12%, as compared with 6.65% for 2016. In
determining the long-term rates of return, we consider the nature of the plans’ investments, an expectation for the plans’ investment
strategies, historical rates of return and current economic forecasts. We generally evaluate the expected long-term rates of return annually
and adjust as necessary.
In some of our defined benefit pension plans, we have adopted investment strategies which are designed to match the movements in the
pension liability through an increased allocation towards debt securities. In addition, we also utilize derivative instruments in our UK defined
benefit pension plans to achieve the desired market exposures or to hedge certain risks. Derivative instruments may include, but are not
limited to, futures, options, swaps or swaptions. Investment types, including the use of derivatives are based on written guidelines
established for each investment manager and monitored by the plan’s investment committee.
A significant portion of our pension plan assets relate to the UK defined benefit pension plan. The assumed rate of return for determining
2017 net periodic benefit cost for the UK defined benefit pension plan was 5.15%. In addition, the 2018 rate of return assumption for the
UK defined benefit pension plan was based on an asset allocation of approximately 80% in corporate and government bonds and
mortgage-backed securities (which are expected to earn approximately 2% to 4% in the long-term) and approximately 20% in equity
securities, emerging market debt and high yield securities (which are expected to earn approximately 5% to 9% in the long-term). In
addition to the physical assets, the asset portfolio for the UK defined benefit pension plan has derivative instruments which increase our
exposure to fixed income (in order to better match liabilities) and, to a lesser extent, impact our equity exposure. The rate of return on the
plan assets in the UK was approximately 9% in 2017 and approximately 36% in 2016.
Historically, the pension plan with the most significant pension plan assets was the U.S. defined benefit pension plan. As part of the
separation of the North America business, in 2016 we transferred $499.6 of pension liabilities under the U.S. defined benefit pension plan

associated with current and former employees of the North America business and certain other former Avon employees, along with
$355.9 of assets held by the U.S. defined benefit pension plan, to a defined benefit pension plan sponsored by New Avon. We also
transferred $60.4 of other postretirement liabilities (namely, retiree medical and supplemental pension liabilities) in respect of such
employees and former employees. See Note 3, Discontinued Operations and Divestitures on pages F-17 through F-18 of our 2017 Annual
Report. We continue to retain certain U.S. pension and other postretirement liabilities primarily associated with employees who are actively
employed by Avon in the U.S. providing services other than with respect to the North America business. Prior to this separation, our net
periodic benefit costs for the U.S. pension and postretirement benefit plans were allocated between Discontinued Operations and Global as
the plan included both North America and U.S. Corporate Avon associates, and as such, our ongoing net periodic benefit costs within
Global were not materially impacted by the separation of the North America business.
The assumed rate of return for determining 2017 net periodic benefit cost for the U.S. defined benefit pension plan was 5.50%, which was
based on an asset allocation of approximately 70% in corporate and government bonds (which are expected to earn approximately 3% to
5% in the long-term) and approximately 30% in equity securities (which are expected to earn approximately 6% to 8% in the long-term).
The rate of return on the plan assets in the U.S. was approximately 15% in 2017 and approximately 6% in 2016.
The discount rate used for determining the present value of future pension obligations for each individual plan is based on a review of bonds
that receive a high-quality rating from a recognized rating agency. The discount rates for calculating the balance sheet obligations of our
more significant plans, including our UK defined benefit pension plan and our U.S. defined benefit pension plan, were based on the internal
rates of return for a portfolio of high-quality bonds with maturities that are consistent with the projected future benefit payment obligations
of each plan. The weighted-average discount rate for U.S. and non-U.S. defined benefit pension plans determined on this basis was 2.66%
at December 31, 2017, and 2.81% at December 31, 2016. For the determination of the expected rates of return on assets and the discount
rates, we take external actuarial and investment advice into consideration.
Effective as of January 1, 2018, we are changing the method we use to estimate the service and interest cost components of net periodic
benefit cost for the U.S. defined benefit pension plan and the majority of our significant non-U.S. pension plans, including the UK defined
benefit pension plan. Historically, including in 2017, we estimated the service and interest cost components using a single weighted-average
discount rate derived from the yield curve used to measure the benefit obligation at the beginning of the period. Beginning in 2018, we
have now elected to use a full yield curve approach in the estimation of these components of net periodic benefit cost by applying the
specific spot rates along the yield curve used in the determination of the benefit obligation to the relevant projected cash flows. We have
made this change to improve the correlation between projected benefit cash flows and the corresponding yield curve spot rates, which we
believe will result in a more precise measurement of service and interest costs. This change does not affect the measurement of our benefit
obligation and does not impact our 2017 net periodic benefit cost. We will account for this change in estimate on a prospective basis
beginning in 2018. We do not expect this change to result in a material reduction of our future net periodic benefit costs.
Our funding requirements may be impacted by standards and regulations or interpretations thereof. Our calculations of pension and
postretirement costs are dependent on the use of assumptions, including discount rates, hybrid plan maximum interest crediting rates and
expected return on plan assets discussed above, rate of compensation increase of plan participants, interest cost, benefits earned, mortality
rates, the number of participants and certain demographics and other factors. Actual results that differ from assumptions are accumulated
and amortized to expense over future periods and, therefore, generally affect recognized expense in future periods. At December 31, 2017,
we had pretax actuarial losses and prior service credits totaling approximately $41 for the U.S. defined benefit pension and postretirement
plans and approximately $176 for the non-U.S. defined benefit pension and postretirement plans that have not yet been charged to
expense. These actuarial losses have been charged to AOCI within shareholders’ equity. While we believe that the assumptions used are
reasonable, differences in actual experience or changes in assumptions may materially affect our pension and postretirement obligations and
future expense. For 2018, our assumption for the expected rate of return on assets is 5.50% for our U.S. defined benefit pension plan and
5.20% for our non-U.S. defined benefit pension plans (which includes 5.20% for our UK defined benefit pension plan). Our assumptions are
generally reviewed and determined on an annual basis.
A V O N 2017 33
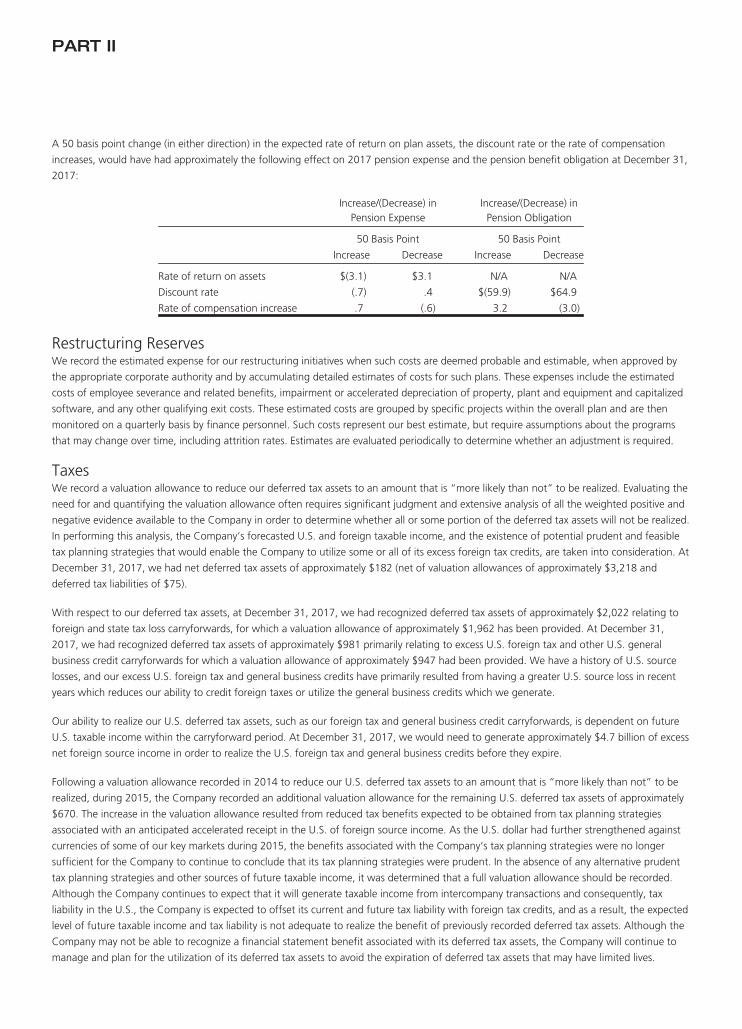
PART II
A 50 basis point change (in either direction) in the expected rate of return on plan assets, the discount rate or the rate of compensation
increases, would have had approximately the following effect on 2017 pension expense and the pension benefit obligation at December 31,
2017:
Increase/(Decrease) inPension Expense
Increase/(Decrease) inPension Obligation
50 Basis Point 50 Basis Point
Increase Decrease Increase Decrease
Rate of return on assets $(3.1) $3.1 N/A N/A
Discount rate (.7) .4 $(59.9) $64.9
Rate of compensation increase .7 (.6) 3.2 (3.0)
Restructuring ReservesWe record the estimated expense for our restructuring initiatives when such costs are deemed probable and estimable, when approved by
the appropriate corporate authority and by accumulating detailed estimates of costs for such plans. These expenses include the estimated
costs of employee severance and related benefits, impairment or accelerated depreciation of property, plant and equipment and capitalized
software, and any other qualifying exit costs. These estimated costs are grouped by specific projects within the overall plan and are then
monitored on a quarterly basis by finance personnel. Such costs represent our best estimate, but require assumptions about the programs
that may change over time, including attrition rates. Estimates are evaluated periodically to determine whether an adjustment is required.
TaxesWe record a valuation allowance to reduce our deferred tax assets to an amount that is “more likely than not” to be realized. Evaluating the
need for and quantifying the valuation allowance often requires significant judgment and extensive analysis of all the weighted positive and
negative evidence available to the Company in order to determine whether all or some portion of the deferred tax assets will not be realized.
In performing this analysis, the Company’s forecasted U.S. and foreign taxable income, and the existence of potential prudent and feasible
tax planning strategies that would enable the Company to utilize some or all of its excess foreign tax credits, are taken into consideration. At
December 31, 2017, we had net deferred tax assets of approximately $182 (net of valuation allowances of approximately $3,218 and
deferred tax liabilities of $75).
With respect to our deferred tax assets, at December 31, 2017, we had recognized deferred tax assets of approximately $2,022 relating to
foreign and state tax loss carryforwards, for which a valuation allowance of approximately $1,962 has been provided. At December 31,
2017, we had recognized deferred tax assets of approximately $981 primarily relating to excess U.S. foreign tax and other U.S. general
business credit carryforwards for which a valuation allowance of approximately $947 had been provided. We have a history of U.S. source
losses, and our excess U.S. foreign tax and general business credits have primarily resulted from having a greater U.S. source loss in recent
years which reduces our ability to credit foreign taxes or utilize the general business credits which we generate.
Our ability to realize our U.S. deferred tax assets, such as our foreign tax and general business credit carryforwards, is dependent on future
U.S. taxable income within the carryforward period. At December 31, 2017, we would need to generate approximately $4.7 billion of excess
net foreign source income in order to realize the U.S. foreign tax and general business credits before they expire.
Following a valuation allowance recorded in 2014 to reduce our U.S. deferred tax assets to an amount that is “more likely than not” to be
realized, during 2015, the Company recorded an additional valuation allowance for the remaining U.S. deferred tax assets of approximately
$670. The increase in the valuation allowance resulted from reduced tax benefits expected to be obtained from tax planning strategies
associated with an anticipated accelerated receipt in the U.S. of foreign source income. As the U.S. dollar had further strengthened against
currencies of some of our key markets during 2015, the benefits associated with the Company’s tax planning strategies were no longer
sufficient for the Company to continue to conclude that its tax planning strategies were prudent. In the absence of any alternative prudent
tax planning strategies and other sources of future taxable income, it was determined that a full valuation allowance should be recorded.
Although the Company continues to expect that it will generate taxable income from intercompany transactions and consequently, tax
liability in the U.S., the Company is expected to offset its current and future tax liability with foreign tax credits, and as a result, the expected
level of future taxable income and tax liability is not adequate to realize the benefit of previously recorded deferred tax assets. Although the
Company may not be able to recognize a financial statement benefit associated with its deferred tax assets, the Company will continue to
manage and plan for the utilization of its deferred tax assets to avoid the expiration of deferred tax assets that may have limited lives.

In addition, in the fourth quarter of 2015, we recognized a benefit of approximately $19 associated with the implementation of the initial
stages of foreign tax planning strategies. We completed the implementation of these tax planning strategies and recognized an additional
benefit of approximately $29 in the first quarter of 2016.
At December 31, 2017, as a result of our U.S. liquidity profile, we continue to assert that our foreign earnings are not indefinitely reinvested.
Accordingly, we adjusted our deferred tax liability each period to account for our undistributed earnings of foreign subsidiaries and for the
tax effect of earnings that were actually repatriated to the U.S. during the year. The net impact on the deferred tax liability associated with
the Company’s undistributed earnings is a decrease of approximately $64, resulting in a deferred tax liability balance of approximately $23
related to the incremental tax cost on approximately $1.5 billion of undistributed foreign earnings at December 31, 2017. The approximate
$64 decrease was primarily a result of the enactment of the Tax Cuts and Jobs Act in the U.S.
With respect to our uncertain tax positions, we recognize the benefit of a tax position, if that position is more likely than not of being
sustained on examination by the taxing authorities, based on the technical merits of the position. We believe that our assessment of more
likely than not is reasonable, but because of the subjectivity involved and the unpredictable nature of the subject matter at issue, our
assessment may prove ultimately to be incorrect, which could materially impact our Consolidated Financial Statements.
We file income tax returns in the U.S. federal jurisdiction, and various state and foreign jurisdictions. In 2018, a number of open tax years are
scheduled to close due to the expiration of the statute of limitations and it is possible that a number of tax examinations may be completed.
If our tax positions are ultimately upheld or denied, it is possible that the 2018 provision for income taxes, as well as tax related cash receipts
or payments, may be impacted.
Loss ContingenciesWe determine whether to disclose and/or accrue for loss contingencies based on an assessment of whether the risk of loss is remote,
reasonably possible or probable. We record loss contingencies when it is probable that a liability has been incurred and the amount of loss is
reasonably estimable. Our assessment is developed in consultation with our outside counsel and other advisors and is based on an analysis
of possible outcomes under various strategies. Loss contingency assumptions involve judgments that are inherently subjective and can
involve matters that are in litigation, which, by its nature is unpredictable. We believe that our assessment of the probability of loss
contingencies is reasonable, but because of the subjectivity involved and the unpredictable nature of the subject matter at issue, our
assessment may prove ultimately to be incorrect, which could materially impact our Consolidated Financial Statements.
Impairment of Assets
Plant, Property and Equipment and Capitalized SoftwareWe evaluate our plant, property and equipment and capitalized software for impairment whenever events or changes in circumstances
indicate that the carrying amount of an asset group may not be recoverable. Recoverability of assets to be held and used is measured by a
comparison of the carrying amount of an asset to estimated pre-tax undiscounted future cash flows expected to be generated by the asset.
If the carrying amount of an asset exceeds its estimated future cash flows, an impairment charge is recognized for the amount by which the
carrying amount of the asset exceeds the fair value of the asset. The fair value of the asset is determined using revenue and cash flow
projections, and royalty and discount rates, as appropriate.
In February 2015, we reviewed Avon Venezuela’s long-lived assets to determine whether the carrying amount of the assets was recoverable.
Based on our expected cash flows associated with the asset group, we determined that the carrying amount of the assets, carried at their
historical U.S. dollar cost basis, was not recoverable. As such, an impairment charge of approximately $90 to selling, general and
administrative expenses was recorded to reflect the write-down of the long-lived assets to their estimated fair value of approximately
$16, which was recorded in the first quarter of 2015. The fair value of Avon Venezuela’s long-lived assets was determined using both
market and cost valuation approaches. The valuation analysis performed required several estimates, including market conditions and
inflation rates. As discussed in Note 1, Description of the Business and Summary of Significant Accounting Policies, we concluded that,
effective March 31, 2016, we deconsolidated our Venezuelan operations. Our Consolidated Balance Sheets no longer includes the assets
and liabilities of our Venezuelan operations, and we no longer include the results of our Venezuelan operations in our Consolidated Financial
Statements. See Note 1, Description of the Business and Summary of Significant Accounting Policies on pages F-9 through F-16 of our 2017
Annual Report for more information on Avon Venezuela.
A V O N 2017 35

PART II
GoodwillWe test goodwill for impairment annually, and more frequently if circumstances warrant, using various fair value methods. We completed
our annual goodwill impairment assessment for 2017 and determined that the estimated fair values were considered substantially in excess
of the carrying values of each of our reporting units.
The impairment analyses performed for goodwill require several estimates in computing the estimated fair value of a reporting unit. As part
of our goodwill impairment analysis, we typically use a discounted cash flow (“DCF”) approach to estimate the fair value of a reporting unit,
which we believe is the most reliable indicator of fair value of a business, and is most consistent with the approach that we would generally
expect a market participant would use. In estimating the fair value of our reporting units utilizing a DCF approach, we typically forecast
revenue and the resulting cash flows for periods of five to ten years and include an estimated terminal value at the end of the forecasted
period. When determining the appropriate forecast period for the DCF approach, we consider the amount of time required before the
reporting unit achieves what we consider a normalized, sustainable level of cash flows. The estimation of fair value utilizing a DCF approach
includes numerous uncertainties which require significant judgment when making assumptions of expected growth rates and the selection
of discount rates, as well as assumptions regarding general economic and business conditions, and the structure that would yield the highest
economic value, among other factors.
During the 2015 year-end close process, our analysis of the Egypt business indicated an impairment as the carrying value of the business
exceeded the estimated fair value. This was primarily the result of reducing our long-term projections of the business. During 2015, Egypt
performed generally in line with our revenue and earnings projections, which assumed growth as compared to 2014. However, as a result of
currency restrictions for the payment of goods in Egypt, we lowered our long-term revenue and earnings projections for the business.
Accordingly, a non-cash impairment charge of approximately $7 was recorded to reduce the carrying amount of goodwill. There is no
amount remaining associated with goodwill for our Egypt reporting unit as a result of this impairment charge.
Key assumptions used in measuring the fair value of Egypt during this impairment assessment included projections of revenue and the
resulting cash flows, as well as the discount rate (based on the estimated weighted-average cost of capital). To estimate the fair value of
Egypt, we forecasted revenue and the resulting cash flows over five years using a DCF model which included a terminal value at the end of
the projection period. We believed that a five-year period was a reasonable amount of time in order to return cash flows of Egypt to
normalized, sustainable levels.
See Note 19, Goodwill on page F-53 of our 2017 Annual Report for more information regarding Egypt.

Results Of Operations – Consolidated
Years ended December 31 %/Point Change
2017 2016 20152017 vs.
20162016 vs.
2015
Select Consolidated Financial InformationTotal revenue $5,715.6 $5,717.7 $ 6,160.5 –% (7)%Cost of sales 2,203.3 2,257.0 2,445.4 (2)% (8)%Selling, general and administrative expenses 3,239.0 3,138.8 3,543.2 3% (11)%Impairment of goodwill – – 6.9 * *
Operating profit 273.3 321.9 165.0 (15)% 95%Interest expense 140.8 136.6 120.5 3% 13%(Gain) loss on extinguishment of debt – (1.1) 5.5 * *Interest income (14.8) (15.8) (12.5) (6)% 26%Other expense, net 26.6 171.0 73.7 * *Gain on sale of business – – (44.9) * *Income from continuing operations, before taxes 120.7 31.2 22.7 * 37%Income (loss) from continuing operations, net of tax 20.0 (93.4) (796.5) * *Net income (loss) attributable to Avon $ 22.0 $ (107.6) $(1,148.9) * *Diluted loss per share from continuing operations $ (.00) $ (.25) $ (1.81) * *Diluted loss per share attributable to Avon $ (.00) $ (.29) $ (2.60) * *Advertising expenses(1) $ 118.4 $ 108.9 $ 128.0 9% (15)%
Reconciliation of Non-GAAP Financial MeasuresGross margin 61.5% 60.5% 60.3% 1.0 .2
CTI restructuring – – – – –Venezuelan special items – – .5 – (.5)
Adjusted gross margin 61.5% 60.5% 60.8% 1.0 (.3)
Selling, general and administrative expenses as a % oftotal revenue 56.7% 54.9% 57.5% 1.8 (2.6)CTI restructuring (1.0) (1.3) (.8) .3 (.5)Loss contingency (.3) – – (.3) –Legal settlement – .5 – (.5) .5Venezuelan special items – – (1.5) – 1.5Pension settlement charge – – (.1) – .1Other items – – (.1) – .1
Adjusted selling, general and administrative expenses as a% of total revenue 55.3% 54.0% 55.1% 1.3 (1.1)
Operating profit $ 273.3 $ 321.9 $ 165.0 (15)% 95%CTI restructuring 60.2 77.4 49.1Loss contingency 18.2 – –Legal settlement – (27.2) –Venezuelan special items – – 120.2Pension settlement charge – – 7.3Other items – – 3.1Asset impairment charge – – 6.9
Adjusted operating profit $ 351.7 $ 372.1 $ 351.6 (5)% 6%
Operating margin 4.8% 5.6% 2.7% (.8) 2.9CTI restructuring 1.1 1.4 .8 (.3) .6Loss contingency .3 – – .3 –Legal settlement – (.5) – .5 (.5)Venezuelan special items – – 2.0 – (2.0)Pension settlement charge – – .1 – (.1)Other items – – .1 – (.1)Asset impairment charge – – .1 – (.1)
Adjusted operating margin 6.2% 6.5% 5.7% (.3) .8Change in Constant $ Adjusted operating margin(2) (.3) 1.7
Performance MetricsChange in Active Representatives (3)% (2)%Change in units sold (4)% (4)%Change in Ending Representatives –% (2)%
Amounts in the table above may not necessarily sum due to rounding.
* Calculation not meaningful
(1) Advertising expenses are recorded in selling, general and administrative expenses.
(2) Change in Constant $ Adjusted operating margin for all years presented is calculated using the current-year Constant $ rates.
A V O N 2017 37

PART II
2017 Compared to 2016
RevenueDuring 2017, revenue was relatively unchanged compared to the prior-year period, partially benefiting from foreign exchange, while
Constant $ revenue decreased 2%. Our Constant $ revenue decline was primarily driven by declines in Brazil, Russia and the United
Kingdom, partially offset by growth in Argentina and South Africa. The decline in revenue and Constant $ revenue was primarily due to a
3% decrease in Active Representatives, which was partially offset by higher average order. The decrease in Active Representatives was
impacted by declines in all reportable segments, most significantly in South Latin America (driven by Brazil) and Europe, Middle East & Africa.
The net impact of price and mix increased 2%, primarily due to the inflationary impact on pricing in Argentina, Russia and Mexico. Units
sold decreased 4%, primarily due to declines in Russia, Brazil, Mexico and the United Kingdom. The revenue performance was negatively
impacted most significantly by a decline in Color sales, as we experienced issues in some markets while we segmented our Color category
into three distinct brands. The timing of innovation also impacted the decline in Color sales.
Ending Representatives were relatively unchanged. Ending Representatives at December 31, 2017 as compared to the prior-year period
benefited from growth in Russia, which was offset by a decline in Brazil.
On a category basis, our net sales from reportable segments and associated growth rates were as follows:
Years ended December 31 %/Point Change
2017 2016 US$ Constant $
Beauty:
Skincare $1,620.3 $1,605.3 1% (2)%
Fragrance 1,554.0 1,512.8 3 1
Color 977.6 996.3 (2) (4)
Total Beauty 4,151.9 4,114.4 1 (1)
Fashion & Home:
Fashion 821.2 849.2 (3) (5)
Home 591.9 595.4 (1) (2)
Total Fashion & Home 1,413.1 1,444.6 (2) (3)
Net sales from reportable segments 5,565.0 5,559.0 – (2)
Net sales from Other operating segments and
business activities .1 19.8 * *
Net sales $5,565.1 $5,578.8 – (2)
See “Segment Review” in this MD&A for additional information related to changes in revenue by segment.
Operating MarginOperating margin and Adjusted operating margin decreased 80 basis points and 30 basis points, respectively, compared to 2016. The
decreases in operating margin and Adjusted operating margin include the benefits associated with the Transformation Plan, primarily
reductions in headcount, as well as other cost reductions. These savings were largely offset by the inflationary impact on costs outpacing
revenue growth. The decreases in operating margin and Adjusted operating margin are discussed further below in “Gross Margin” and
“Selling, General and Administrative Expenses.”
Gross MarginGross margin and Adjusted gross margin both increased 100 basis points compared to 2016, in each case primarily due to an increase of
120 basis points from the favorable net impact of mix and pricing, driven by inflationary pricing in South Latin America.
Selling, General and Administrative ExpensesSelling, general and administrative expenses for 2017 increased approximately $100 compared to 2016. This increase is primarily due to the
unfavorable impact of foreign currency translation, as the weakening of the U.S. dollar against many of our foreign currencies resulted in

higher reported selling, general and administrative expenses. The increase in selling, general and administrative expenses is also due to the
approximate $27 of net proceeds recognized as a result of a legal settlement in 2016, higher bad debt expense, higher transportation costs,
the loss contingency related to a non-U.S. pension plan and higher Representative, sales leader and field expense. Partially offsetting the
increase in selling, general and administrative expenses was lower expenses associated with employee incentive compensation plans and
lower CTI restructuring.
Selling, general and administrative expenses as a percentage of revenue and Adjusted selling, general, and administrative expenses as a
percentage of revenue increased 180 basis points and 130 basis points, respectively, compared to 2016. The selling, general and
administrative expenses as a percentage of revenue comparison was negatively impacted by:
• approximately 50 basis points for the approximate $27 of net proceeds recognized as a result of a legal settlement in the 2016; and
• approximately 30 basis points for a loss contingency related to a non-U.S. pension plan.
These items were partially offset by:
• approximately 30 basis points for lower CTI restructuring.
The remaining increase in selling, general and administrative expenses as a percentage of revenue and the increase of 130 basis points in
Adjusted selling, general and administrative expenses as a percentage of revenue were, in each case, primarily due to the following:
• an increase of 50 basis points from higher bad debt expense, driven by Brazil due to the lower than anticipated collection of receivables,
primarily impacted by the macroeconomic environment, as well as resulting from an adjustment to credit terms available to new
Representatives during 2016;
• an increase of 50 basis points primarily due to higher Representative, sales leader and field expense, most significantly in Brazil to support
efforts to activate the field and improve Representative recruitment, as well as in the Philippines;
• an increase of 40 basis points from higher transportation costs, most significantly in Russia which was driven by new delivery rates; and
• an increase of 20 basis points primarily due to the impact of the Constant $ revenue decline causing deleverage of our fixed expenses,
partially offset by lower fixed expenses. Fixed expenses include the benefits associated with the Transformation Plan, primarily reductions
in headcount, as well as other cost reductions. These savings were largely offset by the inflationary impact on costs outpacing revenue
growth.
These items were partially offset by the following:
• a decrease of 30 basis points due to lower expenses associated with employee incentive compensation plans; and
• a decrease of approximately 20 basis points due to the favorable impact of foreign currency translation and foreign currency transaction
losses.
See Note 14, Segment Information on pages F-43 through F-46 of our 2017 Annual Report for more information on the legal settlement,
Note 13, Employee Benefit Plans on pages F-34 through F-43 of our 2017 Annual Report for more information on the loss contingency
related to a non-U.S. pension plan and Note 16, Restructuring Initiatives on pages F-46 through F-50 of our 2017 Annual Report for more
information on CTI restructuring.
Other ExpensesInterest expense increased by approximately $4 compared to the prior-year period, primarily due to the interest associated with
$500 principal amount of 7.875% Senior Secured Notes issued in August 2016 and lower amortization of gains associated with the
termination of interest rate swaps. These items were partially offset by the interest savings associated with the repayment of certain of our
debt in 2016 and lower interest due to a reduction of the international debt balances. Refer to Note 7, Debt and Other Financing on pages
F-20 through F-23 of our 2017 Annual Report and Note 10, Financial Instruments and Risk Management on pages F-28 through F-30 of our
2017 Annual Report for additional information.
Gain on extinguishment of debt in 2016 of approximately $1 was comprised of a gain of approximately $4 associated with the cash tender
offers in August 2016 and a gain of approximately $1 associated with the debt repurchases in December 2016, partially offset by a loss of
A V O N 2017 39
PART II
approximately $3 associated with the prepayment of the remaining principal amount of our 4.20% Notes and 5.75% Notes in November
2016 and a loss of approximately $1 associated with the debt repurchases in October 2016. Refer to Note 7, Debt and Other Financing on
pages F-20 through F-23 of our 2017 Annual Report for additional information.
Interest income decreased by approximately $1 compared to the prior-year period.
Other expense, net, decreased by approximately $144 compared to the prior-year period, primarily due to the deconsolidation of our
Venezuelan operations, as we recorded a loss of approximately $120 in the first quarter of 2016. In addition, other expense, net was
positively impacted by foreign exchange net gains in the current year as compared to net losses in the prior year, resulting in a year-over-year
benefit of approximately $28. The amounts recorded for our proportionate share of New Avon’s losses was approximately $12 in both 2017
and 2016. As the recorded investment balance in New Avon was zero at the end of the third quarter of 2017, we have not recorded any
additional losses associated with New Avon since the third quarter of 2017. See “Venezuela Discussion” in this MD&A and Note 1,
Description of the Business and Summary of Significant Accounting Policies on pages F-9 through F-16 of our 2017 Annual Report for
further discussion of our Venezuelan operations. See Note 4, Investment in New Avon on pages F-18 through F-19 of our 2017 Annual
Report for more information on New Avon.
Effective Tax RateThe effective tax rates in 2017 and 2016 continue to be impacted by our inability to recognize additional deferred tax assets in various
jurisdictions related to our current-year operating results. In addition, the effective tax rates in 2017 and 2016 continue to be impacted by
withholding taxes associated with certain intercompany payments, including royalties, service charges and dividends, which in the aggregate
are relatively consistent each year due to the need to repatriate funds to cover U.S.-based costs, such as interest on debt and corporate
overhead. These factors resulted in unusually high effective tax rates in 2017 and 2016.
The effective tax rate in 2017 was impacted by an approximate net $30 benefit recognized as a result of the enactment of the Tax Cuts and
Jobs Act in U.S., a release of valuation allowances of approximately $26 associated with a number of markets in Europe, Middle East &
Africa as a result of a business model change related to the headquarters move, and an approximate $10 benefit as a result of a favorable
court decision in Brazil, partially offset by a charge of approximately $16 associated with valuation allowances to adjust deferred tax assets in
Mexico. The effective tax rate in 2017 was also impacted by a loss contingency related to a non-U.S. pension plan and CTI restructuring,
both for which tax benefits cannot currently be claimed.
The effective tax rate in 2016 was impacted by the deconsolidation of our Venezuelan operations, valuation allowances for deferred tax
assets outside of the U.S. of approximately $9 and CTI restructuring, partially offset by a benefit of approximately $29 as a result of the
implementation of foreign tax planning strategies, a net benefit of approximately $7 primarily due to the release of a valuation allowance
associated with Russia and a benefit from the net proceeds recognized as a result of a legal settlement.
In addition, the effective tax rates and the Adjusted effective tax rates in 2017 and 2016 were negatively impacted by the country mix of
earnings.
See Note 9, Income Taxes on pages F-24 through F-28 of our 2017 Annual Report for more information on tax items, Note 13, Employee
Benefit Plans on pages F-34 through F-43 of our 2017 Annual Report for more information on the loss contingency related to a non-U.S.
pension plan, Note 16, Restructuring Initiatives on pages F-46 through F-50 of our 2017 Annual Report for more information on CTI
restructuring and “Venezuela Discussion” in this MD&A and Note 1, Description of the Business and Summary of Significant Accounting
Policies on pages F-9 through F-16 of our 2017 Annual Report for more information for further discussion of our Venezuelan operations.
Impact of Foreign CurrencyAs compared to the prior-year period, foreign currency in 2017 impacted our consolidated financial results in the form of:
• foreign currency transaction net gains (classified within cost of sales, and selling, general and administrative expenses), which had an
immaterial impact to operating profit and Adjusted operating profit, and operating margin and Adjusted operating margin;
• foreign currency translation, which had a favorable impact to operating profit and Adjusted operating profit of approximately $20, or
approximately 30 basis points to operating margin and approximately 20 basis points to Adjusted operating margin; and

• foreign exchange net gains on our working capital (classified within other expense, net) as compared to net losses in the prior year,
resulting in a year-over-year benefit of approximately $28 before tax on both a reported and Adjusted basis.
Discontinued OperationsThere were no amounts recorded in discontinued operations for the year ended December 31, 2017. Loss from discontinued operations, net
of tax was approximately $14 for the year ended December 31, 2016. See Note 3, Discontinued Operations and Divestitures on pages F-17
through F-18 of our 2017 Annual Report for further discussion.
Venezuela DiscussionAvon Venezuela operates in the direct-selling channel offering Beauty and Fashion & Home products. Avon Venezuela has a manufacturing
facility that produces the Beauty products that it sells. Avon Venezuela imports many of its Fashion & Home products and raw materials and
components needed to manufacture its Beauty products.
Currency restrictions enacted by the Venezuelan government since 2003 impacted the ability of Avon Venezuela to obtain foreign currency
to pay for imported products. In 2010, we began accounting for our operations in Venezuela under accounting guidance associated with
highly inflationary economies. Under U.S. GAAP, the financial statements of a foreign entity operating in a highly inflationary economy are
required to be remeasured as if the functional currency is the company’s reporting currency, the U.S. dollar. This generally results in
translation adjustments, caused by changes in the exchange rate, being reported in earnings currently for monetary assets (e.g., cash,
accounts receivable) and liabilities (e.g., accounts payable, accrued expenses) and requires that different procedures be used to translate
non-monetary assets (e.g., inventories, fixed assets). Non-monetary assets and liabilities are remeasured at the historical U.S. dollar cost
basis. This diverges significantly from the application of accounting rules prior to designation as highly inflationary accounting, where such
gains and losses would have been recognized only in other comprehensive income (loss) (shareholders’ deficit).
Venezuela’s restrictive foreign exchange control regulations and our Venezuelan operations’ increasingly limited access to U.S. dollars
resulted in lack of exchangeability between the Venezuelan bolivar and the U.S. dollar, and restricted our Venezuelan operations’ ability to
pay dividends and settle intercompany obligations. The severe currency controls imposed by the Venezuelan government significantly limited
our ability to realize the benefits from earnings of our Venezuelan operations and access the resulting liquidity provided by those earnings.
We expected that this lack of exchangeability would continue for the foreseeable future, and as a result, we concluded that, effective
March 31, 2016, this condition was other-than-temporary and we no longer met the accounting criteria of control in order to continue
consolidating our Venezuelan operations. As a result, since March 31, 2016, we account for our Venezuelan operations using the cost
method of accounting.
As a result of the change to the cost method of accounting, in the first quarter of 2016 we recorded a loss of approximately $120 in other
expense, net. The loss was comprised of approximately $39 in net assets of the Venezuelan business and approximately $81 in accumulated
foreign currency translation adjustments within AOCI associated with foreign currency movements before Venezuela was accounted for as a
highly inflationary economy. The net assets of the Venezuelan business were comprised of inventories of approximately $24, property, plant
and equipment, net of approximately $15, other assets of approximately $11, accounts receivable of approximately $5, cash of
approximately $4, and accounts payable and accrued liabilities of approximately $20. Our Consolidated Balance Sheets no longer include the
assets and liabilities of our Venezuelan operations. We no longer include the results of our Venezuelan operations in our Consolidated
Financial Statements, and will include income relating to our Venezuelan operations only to the extent that we receive cash for dividends or
royalties remitted by Avon Venezuela.
In February 2015, the Venezuelan government announced the creation of a new foreign exchange system referred to as the SIMADI
exchange (“SIMADI”), which represented the rate which better reflected the economics of Avon Venezuela’s business activity, in comparison
to the other then available exchange rates; as such, we concluded that we should utilize the SIMADI exchange rate to remeasure our
Venezuelan operations. As a result of the change to the SIMADI rate, which caused the recognition of a devaluation of approximately 70%
as compared to the exchange rate we had used previously, we recorded an after-tax benefit of approximately $3 (a benefit of approximately
$4 in other expense, net, and a loss of approximately $1 in income taxes) in the first quarter of 2015, primarily reflecting the write-down of
net monetary assets. In addition, as a result of using the historical U.S. dollar cost basis of non-monetary assets, such as inventories, these
assets continued to be remeasured, following the change to the SIMADI rate, at the applicable rate at the time of their acquisition. The
remeasurement of non-monetary assets at the historical U.S. dollar cost basis caused a disproportionate expense as these assets were
consumed in operations, negatively impacting operating profit and net income by approximately $19 during 2015. Also as a result of the
A V O N 2017 41

PART II
change to the SIMADI rate, we determined that an adjustment of approximately $11 to cost of sales was needed to reflect certain
non-monetary assets, primarily inventories, at their net realizable value, which was recorded in the first quarter of 2015.
In addition, in February 2015, we reviewed Avon Venezuela’s long-lived assets to determine whether the carrying amount of the assets was
recoverable. Based on our expected cash flows associated with the asset group, we determined that the carrying amount of the assets,
carried at their historical U.S. dollar cost basis, was not recoverable. As such, an impairment charge of approximately $90 to selling, general
and administrative expenses was needed to reflect the write-down of the long-lived assets to their estimated fair value of approximately $16,
which was recorded in the first quarter of 2015.
2016 Compared to 2015
RevenueTotal revenue in 2016 declined 7% compared to the prior-year period, primarily due to unfavorable foreign exchange, while Constant $
revenue increased 2%. A number of items affected the year-over-year comparison of Constant $ revenue, the most significant being the sale
of Liz Earle, which was completed in July 2015, that negatively impacted Constant $ revenue growth by approximately 1 point. The other
items affecting the year-over-year comparison netted to an immaterial impact. In addition, our Constant $ revenue benefited from growth in
Argentina, South Africa, Russia, Mexico and Brazil. Argentina contributed approximately 1 point to Avon’s consolidated Constant $ revenue
growth, as this market’s results were impacted by the inflationary impact on pricing. The growth in Constant $ revenue was driven by higher
average order, partially offset by a 2% decrease in Active Representatives. Average order benefited from the net impact of price and mix
which increased 6%, while units sold decreased 4%, primarily due to declines in units sold in Brazil and Mexico, and the impact of the
deconsolidation of Venezuela. TThe decrease in Active Representatives was primarily due to the impact of the deconsolidation of Venezuela
and a decline in Asia Pacific, which included the impact caused by a reduction in the number of sales campaigns in the Philippines. These
declines in Active Representatives were partially offset by growth in Europe, Middle East & Africa, most significantly Russia, which was
primarily due to sustained momentum in recruitment and retention.
Ending Representatives decreased by 2%. The decrease in Ending Representatives at December 31, 2016 as compared to the prior-year
period was primarily due to the impact of the deconsolidation of Venezuela, which had a negative impact of 2 points, and declines in Asia
Pacific. These decreases were partially offset by growth in Europe, Middle East & Africa, most significantly South Africa and Russia, as well as
growth in South Latin America, most significantly Brazil.
See “Venezuela Discussion” in this MD&A and Note 1, Description of the Business and Summary of Significant Accounting Policies on
pages F-9 through F-16 of our 2017 Annual Report to the consolidated financial statements included herein for further discussion of our
Venezuelan operations.

On a category basis, our net sales from reportable segments and associated growth rates were as follows:
Years ended December 31 %/Point Change
2016 2015 US$ Constant $
Beauty:
Skincare $1,605.3 $1,731.4 (7)% 1%
Fragrance 1,512.8 1,613.5 (6) 3
Color 996.3 1,068.6 (7) 2
Total Beauty 4,114.4 4,413.5 (7) 2
Fashion & Home:
Fashion 849.2 902.3 (6) 2
Home 595.4 658.5 (10) 3
Total Fashion & Home 1,444.6 1,560.8 (7) 2
Net sales from reportable segments 5,559.0 5,974.3 (7) 2
Net sales from Other operating segments and
business activities 19.8 102.2 (81) (80)
Net sales $5,578.8 $6,076.5 (8) 1
See “Segment Review” in this MD&A for additional information related to changes in revenue by segment.
Operating MarginOperating margin and Adjusted operating margin increased 290 basis points and 80 basis points, respectively, compared to 2015. The
increases in operating margin and Adjusted operating margin include the benefits associated with costs savings initiatives, including the
Transformation Plan, primarily reductions in headcount, as well as other cost reductions. The increases in operating margin and Adjusted
operating margin are discussed further below in “Gross Margin,” “Selling, General and Administrative Expenses” and “Impairment of
Goodwill.”
Gross MarginGross margin and Adjusted gross margin increased 20 basis points and decreased 30 basis points, respectively, compared to 2015. The gross
margin comparison was impacted by approximately 50 basis points in the prior year by the devaluation of the Venezuelan currency in
conjunction with highly inflationary accounting, as approximately $29 was recognized in the prior-year period associated with carrying
certain non-monetary assets at the historical U.S. dollar cost following a devaluation. See “Venezuela Discussion” in this MD&A for a further
discussion of our Venezuelan operations.
The remaining decrease in gross margin and the decrease of 30 basis points in Adjusted gross margin were, in each case, primarily due to
the following:
• a decrease of approximately 260 basis points due to the unfavorable impact of foreign currency transaction losses and foreign currency
translation;
• a decrease of 30 basis points due to sales of products to New Avon since the separation of the Company’s North America business into
New Avon on March 1, 2016; and
• various other insignificant items that decreased gross margin.
These items were partially offset by the following:
• an increase of 190 basis points due to the favorable net impact of mix and pricing, primarily due to inflationary and strategic pricing in
South Latin America, Europe, Middle East & Africa and North Latin America; and
A V O N 2017 43

PART II
• an increase of 90 basis points due to lower supply chain costs, primarily from lower material costs and cost savings initiatives in Europe,
Middle East & Africa and South Latin America.
See Note 5, Related Party Transactions on pages F-19 through F-20 of our 2017 Annual Report for more information on New Avon.
Selling, General and Administrative ExpensesSelling, general and administrative expenses for 2016 decreased approximately $404 compared to 2015. This decrease is primarily due to
the favorable impact of foreign currency translation, as the strengthening of the U.S. dollar against many of our foreign currencies resulted
in lower reported selling, general and administrative expenses. The decrease in selling, general and administrative expenses is also due to
approximate $90 impairment charge recorded in the prior-year period to reflect the write-down of the long-lived assets to their estimated
fair value associated with the devaluation of the Venezuelan currency in conjunction with highly inflationary accounting, lower fixed
expenses resulting primarily from our cost savings initiatives, lower expenses associated with employee incentive compensation plans, the
approximate $27 of net proceeds recognized as a result of a legal settlement in 2016 and lower advertising expense. Partially offsetting the
decrease in selling, general and administrative expenses was higher bad debt expense, higher amount of CTI restructuring, higher foreign
currency transaction costs and higher Representative, sales leader and field expense.
Selling, general and administrative expenses as a percentage of revenue and Adjusted selling, general, and administrative expenses as a
percentage of revenue decreased 260 basis points and 110 basis points, respectively, compared to 2015. The selling, general and
administrative expenses as a percentage of revenue comparison benefited from:
• approximately 150 basis points by the devaluation of the Venezuelan currency in conjunction with highly inflationary accounting in the
prior-year period, primarily as an approximate $90 impairment charge was recognized in the prior-year period to reflect the write-down of
the long-lived assets to their estimated fair value following a devaluation;
• approximately 50 basis points by the approximate $27 of net proceeds recognized as a result of a legal settlement in 2016;
• approximately 10 basis points by the approximate $7 aggregate settlement charges associated with the payments made to former
employees who were vested and participated in the U.S. defined benefit pension plan recorded in the prior-year period, which did not
occur in 2016; and
• approximately 10 basis points by the approximately $3 of transaction-related costs associated with the separation of North America that
were included in continuing operations recorded in the prior-year period.
These items were partially offset by:
• approximately 50 basis points for higher CTI restructuring.
See “Venezuela Discussion” in this MD&A and Note 1, Description of the Business and Summary of Significant Accounting Policies on
pages F-9 through F-16 of our 2017 Annual Report for a further discussion of our Venezuelan operations, Note 14, Segment Information on
pages F-43 through F-46 of our 2017 Annual Report for more information on the legal settlement, Note 13, Employee Benefit Plans on
pages F-34 through F-43 of our 2017 Annual Report for a further discussion of the pension settlement charges, and Note 16, Restructuring
Initiatives on pages F-46 through F-50 of our 2017 Annual Report for more information on CTI restructuring.
The remaining decrease in selling, general and administrative expenses as a percentage of revenue and the decrease of 110 basis points in
Adjusted selling, general and administrative expenses as a percentage of revenue were, in each case, primarily due to the following:
• a decrease of 210 basis points primarily due to lower fixed expenses, as well as the impact of the Constant $ revenue growth with respect
to our fixed expenses. Lower fixed expenses resulted primarily from our costs savings initiatives, mainly reductions in headcount, but were
partially offset by the inflationary impact on our expenses;
• a decrease of 40 basis points due to lower expenses associated with employee incentive compensation plans; and
• a decrease of 30 basis points from lower advertising expense, primarily in Europe, Middle East & Africa.
These items were partially offset by the following:
• an increase of 80 basis points from higher bad debt expense, driven by Brazil primarily due to the macroeconomic environment, coupled
with actions taken to recruit new Representatives;

• an increase of approximately 50 basis points due to the unfavorable impact of foreign currency translation and foreign currency
transaction losses; and
• an increase of 20 basis points as a result of the Industrial Production Tax (“IPI”) tax law on cosmetics in Brazil that went into effect in May
2015, which reduced revenue as we did not raise the prices paid by Representatives to the same extent as the IPI tax.
See “Segment Review – South Latin America” in this MD&A for a further discussion of the IPI tax law in Brazil.
Impairment of GoodwillDuring the fourth quarter of 2015, we recorded a non-cash impairment charge of approximately $7 for goodwill associated with our Egypt
business. See Note 19, Goodwill on page F-53 of our 2017 Annual Report for more information on Egypt.
See “Segment Review” in this MD&A for additional information related to changes in segment margin.
Other ExpenseInterest expense increased by approximately $16 compared to the prior-year period, primarily due to the interest associated with the
$500 principal amount of 7.875% Senior Secured Notes issued in August 2016 and the increase in the interest rates on the Notes issued in
March 2013 as a result of the downgrades of our long-term credit ratings. These items were partially offset by the interest savings associated
with the repayment of certain of our debt in 2016 and the prepayment of the $250 principal amount of our 2.375% Notes due March 15,
2016 (the “2.375% Notes”) in the third quarter of 2015. Refer to Note 7, Debt and Other Financing on pages F-20 through F-23 of our
2017 Annual Report for additional information.
Gain on extinguishment of debt in 2016 of approximately $1 was comprised of a gain of approximately $4 associated with the cash tender
offers in August 2016 and a gain of approximately $1 associated with the debt repurchases in December 2016, partially offset by a loss of
approximately $3 associated with the prepayment of the remaining principal amount of our 4.20% Notes and our 5.75% Notes in
November 2016 and a loss of approximately $1 associated with the debt repurchases in October 2016. Loss on extinguishment of debt in
2015 of approximately $6 was associated with the prepayment of our 2.375% Notes. Refer to Note 7, Debt and Other Financing on
pages F-20 through F-23 of our 2017 Annual Report for additional information.
Interest income increased by approximately $3 compared to the prior-year period.
Other expense, net, increased by approximately $97 compared to the prior-year period, primarily due to the year-on-year impact of the
Venezuelan special items as we recorded a loss of approximately $120 in the first quarter of 2016 as compared to a benefit of approximately
$4 in the first quarter of 2015. In addition, other expense, net was positively impacted by lower net losses on foreign exchange, partially
offset by our proportionate share of New Avon’s loss of approximately $12. Foreign exchange net losses decreased by approximately
$40 compared to the prior-year period, despite the unfavorable impact of approximately $17 as a result of the devaluation of the Egyptian
pound in the fourth quarter of 2016. See “Venezuela Discussion” in this MD&A for a further discussion of our Venezuelan operations. See
Note 4, Investment in New Avon on pages F-18 through F-19 of our 2017 Annual Report for more information on New Avon.
Gain on sale of business in 2015 was the result of the sale of Liz Earle in July 2015. Refer to Note 3, Discontinued Operations and
Divestitures on pages F-17 through F-18 of our 2017 Annual Report, for additional information regarding the sale of Liz Earle.
Effective Tax RateThe effective tax rates in 2016 and 2015 continue to be impacted by our inability to recognize additional deferred tax assets in various
jurisdictions related to our current-year operating results. In addition, the effective tax rates in 2016 and 2015 continue to be impacted by
withholding taxes associated with certain intercompany payments, including royalties, service charges and dividends, which in the aggregate
are relatively consistent each year due to the need to repatriate funds to cover U.S.-based costs, such as interest on debt and corporate
overhead. These factors resulted in unusually high effective tax rates in 2016 and 2015. Our inability to recognize additional deferred tax
assets in various jurisdictions related to our current-year operating results, along with these withholding taxes, resulted in unusually high
effective tax rates in 2016 and 2015.
The effective tax rate in 2016 was impacted by the deconsolidation of our Venezuelan operations, valuation allowances for deferred tax
assets outside of the U.S. of approximately $9 and CTI restructuring, partially offset by a benefit of approximately $29 as a result of the
A V O N 2017 45

PART II
implementation of foreign tax planning strategies, a net benefit of approximately $7 primarily due to the release of a valuation allowance
associated with Russia and a benefit from the net proceeds recognized as a result of a legal settlement.
The effective tax rate in 2015 was negatively impacted by additional valuation allowances for U.S. deferred tax assets of approximately $670.
The additional valuation allowances in 2015 were due to the continued strengthening of the U.S. dollar against currencies of some of our
key markets and the impact on the benefits from our tax planning strategies associated with the realization of our deferred tax assets. In
addition, the effective tax rate in 2015 was negatively impacted by valuation allowances for deferred tax assets outside of the U.S. of
approximately $15, primarily in Russia, which was largely due to lower earnings, which were significantly impacted by foreign exchange
losses on working capital balances. During 2015, we also recognized a benefit of approximately $19 as a result of the implementation of the
initial stages of foreign tax planning strategies. The valuation allowances for deferred tax assets in 2015 caused income taxes to be
significantly in excess of income before taxes. In addition, the effective tax rate in 2015 was negatively impacted by the devaluation of the
Venezuelan currency in conjunction with highly inflationary accounting.
In addition, the effective tax rates and the Adjusted effective tax rates in 2016 and 2015 were negatively impacted by the country mix of
earnings.
See Note 9, Income Taxes on pages F-24 through F-28 of our 2017 Annual Report, for more information. In addition, see “Venezuela
Discussion” in this MD&A and Note 1, Description of the Business and Summary of Significant Accounting Policies on pages F-9 through
F-16 of our 2017 Annual Report for further discussion of our Venezuelan operations, Note 16, Restructuring Initiatives on pages F-46
through F-50 of our 2017 Annual Report for more information on CTI restructuring, and Note 14, Segment Information on pages F-43
through F-43 of our 2017 Annual Report for more information on the legal settlement.
Impact of Foreign CurrencyDuring 2016, foreign currency continued to have a significant impact on our financial results. Specifically, as compared to the prior-year
period, foreign currency in 2016 impacted our consolidated financial results in the form of:
• foreign currency transaction net losses (classified within cost of sales, and selling, general and administrative expenses), which had an
unfavorable impact to operating profit and Adjusted operating profit of an estimated $165, or approximately 270 points to operating
margin and Adjusted operating margin;
• foreign currency translation, which had an unfavorable impact to operating profit of approximately $60 and Adjusted operating profit of
approximately $65, or approximately 40 points to operating margin and Adjusted operating margin; and
• foreign exchange net losses on our working capital (classified within other expense, net), which were lower by approximately $35 before
tax and $40 before tax on an Adjusted basis, despite the unfavorable impact of approximately $17 as a result of the devaluation of the
Egyptian pound in the fourth quarter of 2016.
Discontinued OperationsLoss from discontinued operations, net of tax was approximately $14 in 2016 compared to approximately $349 for 2015. During 2016, we
recorded charges of approximately $16 before tax (approximately $5 after tax) in the aggregate associated with the separation of the North
America business which closed on March 1, 2016. During 2015, we recorded a charge of approximately $340 before tax (approximately
$340 after tax) associated with the estimated loss on the separation of the North America business. See Note 3, Discontinued Operations
and Divestitures on pages F-17 through F-18 of our 2017 Annual Report for further discussion.
Other Comprehensive Income (Loss)Other comprehensive income, net of taxes was approximately $108 in 2017 compared with approximately $333 in 2016. The year-over-year
comparison was unfavorably impacted by the recognition of losses of $259 from other comprehensive income into our Consolidated
Statements of Operations in 2016 as a result of the separation of the North America business, primarily related to unamortized losses
associated with the employee benefit plans, and the approximate $82 impact of the deconsolidation of Venezuela. The remaining
approximate $116 benefit to the year-over-year comparison was primarily due to foreign currency translation adjustments, which benefited
by approximately $117 as compared to 2016 primarily due to the favorable year-over-year comparison of movements of the Polish zloty and
Mexican peso, partially offset by the unfavorable year-over-year comparison of movements of the Brazilian real.
Other comprehensive income (loss), net of taxes was approximately $333 in 2016 compared with approximately ($151) in 2015, driven by
the recognition of losses of $259 from other comprehensive income (loss) into our Consolidated Statements of Operations in 2016 as a
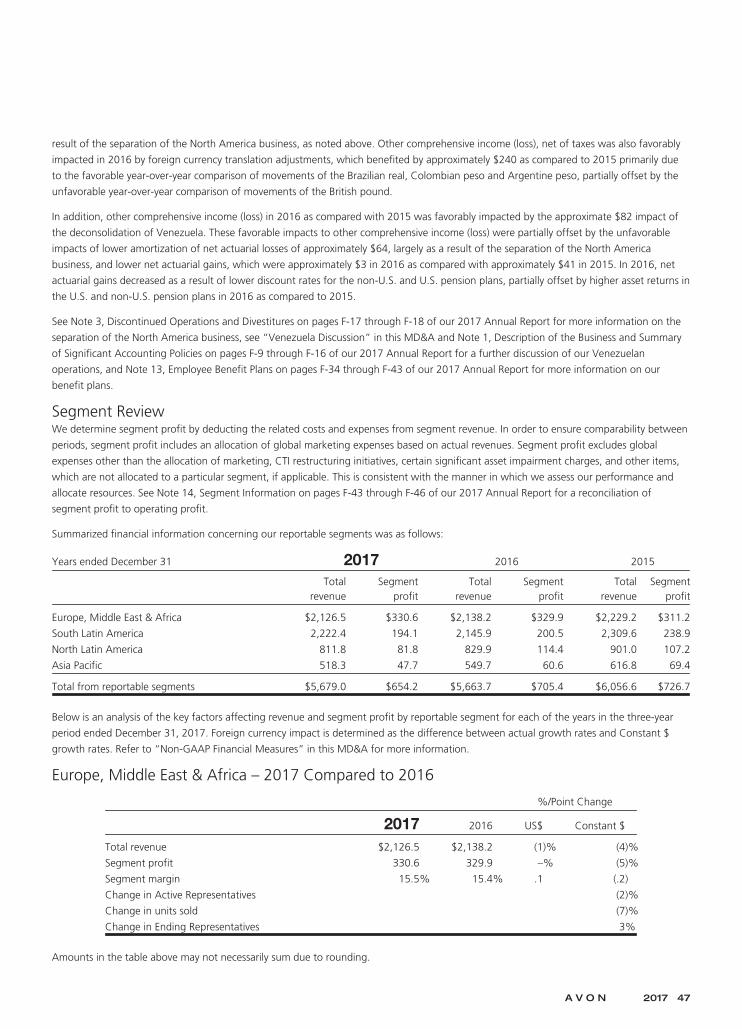
result of the separation of the North America business, as noted above. Other comprehensive income (loss), net of taxes was also favorably
impacted in 2016 by foreign currency translation adjustments, which benefited by approximately $240 as compared to 2015 primarily due
to the favorable year-over-year comparison of movements of the Brazilian real, Colombian peso and Argentine peso, partially offset by the
unfavorable year-over-year comparison of movements of the British pound.
In addition, other comprehensive income (loss) in 2016 as compared with 2015 was favorably impacted by the approximate $82 impact of
the deconsolidation of Venezuela. These favorable impacts to other comprehensive income (loss) were partially offset by the unfavorable
impacts of lower amortization of net actuarial losses of approximately $64, largely as a result of the separation of the North America
business, and lower net actuarial gains, which were approximately $3 in 2016 as compared with approximately $41 in 2015. In 2016, net
actuarial gains decreased as a result of lower discount rates for the non-U.S. and U.S. pension plans, partially offset by higher asset returns in
the U.S. and non-U.S. pension plans in 2016 as compared to 2015.
See Note 3, Discontinued Operations and Divestitures on pages F-17 through F-18 of our 2017 Annual Report for more information on the
separation of the North America business, see “Venezuela Discussion” in this MD&A and Note 1, Description of the Business and Summary
of Significant Accounting Policies on pages F-9 through F-16 of our 2017 Annual Report for a further discussion of our Venezuelan
operations, and Note 13, Employee Benefit Plans on pages F-34 through F-43 of our 2017 Annual Report for more information on our
benefit plans.
Segment ReviewWe determine segment profit by deducting the related costs and expenses from segment revenue. In order to ensure comparability between
periods, segment profit includes an allocation of global marketing expenses based on actual revenues. Segment profit excludes global
expenses other than the allocation of marketing, CTI restructuring initiatives, certain significant asset impairment charges, and other items,
which are not allocated to a particular segment, if applicable. This is consistent with the manner in which we assess our performance and
allocate resources. See Note 14, Segment Information on pages F-43 through F-46 of our 2017 Annual Report for a reconciliation of
segment profit to operating profit.
Summarized financial information concerning our reportable segments was as follows:
Years ended December 31 2017 2016 2015
Totalrevenue
Segmentprofit
Totalrevenue
Segmentprofit
Totalrevenue
Segmentprofit
Europe, Middle East & Africa $2,126.5 $330.6 $2,138.2 $329.9 $2,229.2 $311.2
South Latin America 2,222.4 194.1 2,145.9 200.5 2,309.6 238.9
North Latin America 811.8 81.8 829.9 114.4 901.0 107.2
Asia Pacific 518.3 47.7 549.7 60.6 616.8 69.4
Total from reportable segments $5,679.0 $654.2 $5,663.7 $705.4 $6,056.6 $726.7
Below is an analysis of the key factors affecting revenue and segment profit by reportable segment for each of the years in the three-year
period ended December 31, 2017. Foreign currency impact is determined as the difference between actual growth rates and Constant $
growth rates. Refer to “Non-GAAP Financial Measures” in this MD&A for more information.
Europe, Middle East & Africa – 2017 Compared to 2016
%/Point Change
2017 2016 US$ Constant $
Total revenue $2,126.5 $2,138.2 (1)% (4)%
Segment profit 330.6 329.9 –% (5)%
Segment margin 15.5% 15.4% .1 (.2)
Change in Active Representatives (2)%
Change in units sold (7)%
Change in Ending Representatives 3%
Amounts in the table above may not necessarily sum due to rounding.
A V O N 2017 47

PART II
Total revenue decreased 1% compared to the prior-year period, despite the favorable impact of foreign exchange which was primarily driven
by the weakening of the U.S. dollar relative to the Russian ruble and to a lesser extent, the South African rand, partially offset by the
strengthening of the U.S. dollar relative to the Turkish lira and the British pound. On a Constant $ basis, revenue decreased 4%, most
significantly impacted by declines in Russia and the United Kingdom, partially offset by growth in South Africa. The segment’s Constant $
revenue decline was primarily driven by a decrease in Active Representatives and lower average order. The increase in Ending Representatives
was primarily driven by increases in Russia, Turkey and South Africa, partially offset by a decline in the United Kingdom.
In Russia, revenue increased 5%, benefiting significantly from the favorable impact of foreign exchange. On a Constant $ basis, Russia’s
revenue declined 8%, primarily due to lower average order along with a decrease in Active Representatives. During the first half of 2017,
the Constant $ revenue decline in Russia was impacted by the comparison to strong volume growth in the prior-year period, which
benefited primarily from a pricing lag during an inflationary period. The Constant $ revenue decline in Russia was also impacted by
competitive pressures, innovation issues and a continued difficult macroeconomic environment, primarily in the second half of 2017. These
issues also negatively impacted Active Representatives, despite the increase in Ending Representatives. In the United Kingdom, revenue
declined 14%, which was unfavorably impacted by foreign exchange. On a Constant $ basis, the United Kingdom’s revenue declined 11%,
primarily due to a decrease in Active Representatives, and to a lesser extent, lower average order. In South Africa, revenue grew 20%, which
was favorably impacted by foreign exchange. On a Constant $ basis, South Africa’s revenue grew 9%, primarily due to an increase in Active
Representatives, partially offset by lower average order.
Segment margin increased .1 point, or decreased .2 points on a Constant $ basis, in each case primarily as a result of:
• a decline of .7 points from higher transportation costs, driven primarily by new delivery rates in Russia;
• a decline of .7 points primarily due to the impact of the Constant $ revenue decline causing deleverage of our fixed expenses, partially
offset by lower fixed expenses. Fixed expenses benefited from lower expenses associated with employee incentive compensation plans,
which were partially offset by higher other administrative costs;
• a decline of .4 points from higher bad debt expense, primarily in South Africa and Russia. Higher bad debt expense in South Africa was
driven primarily by lower collection of receivables as a result of deteriorating economic conditions, and in Russia was driven primarily by a
payment facilitation agency that has not remitted to us the funds it received from certain Representatives;
• a decline of .3 points primarily related to the net impact of declining revenue with respect to Representative, sales leader and field
expense; and
• a benefit of 1.8 points due to higher gross margin caused primarily by 1.0 point from the favorable net impact of mix and pricing primarily
driven by Russia, and .7 points due to lower supply chain costs. Supply chain costs benefited primarily from lower material and distribution
costs, partially due to productivity initiatives.
Europe, Middle East & Africa – 2016 Compared to 2015
%/Point Change
2016 2015 US$ Constant $
Total revenue $2,138.2 $2,229.2 (4)% 4%
Segment profit 329.9 311.2 6% 14%
Segment margin 15.4% 14.0% 1.4 1.3
Change in Active Representatives 3%
Change in units sold (1)%
Change in Ending Representatives 3%
Amounts in the table above may not necessarily sum due to rounding.
Total revenue decreased 4% compared to the prior-year period, due to the unfavorable impact from foreign exchange, most significantly the
strengthening of the U.S. dollar relative to the British pound, Russian ruble and South African rand. On a Constant $ basis, revenue grew
4%, primarily driven by South Africa and Russia. The segment’s Constant $ revenue growth was driven primarily by an increase in Active
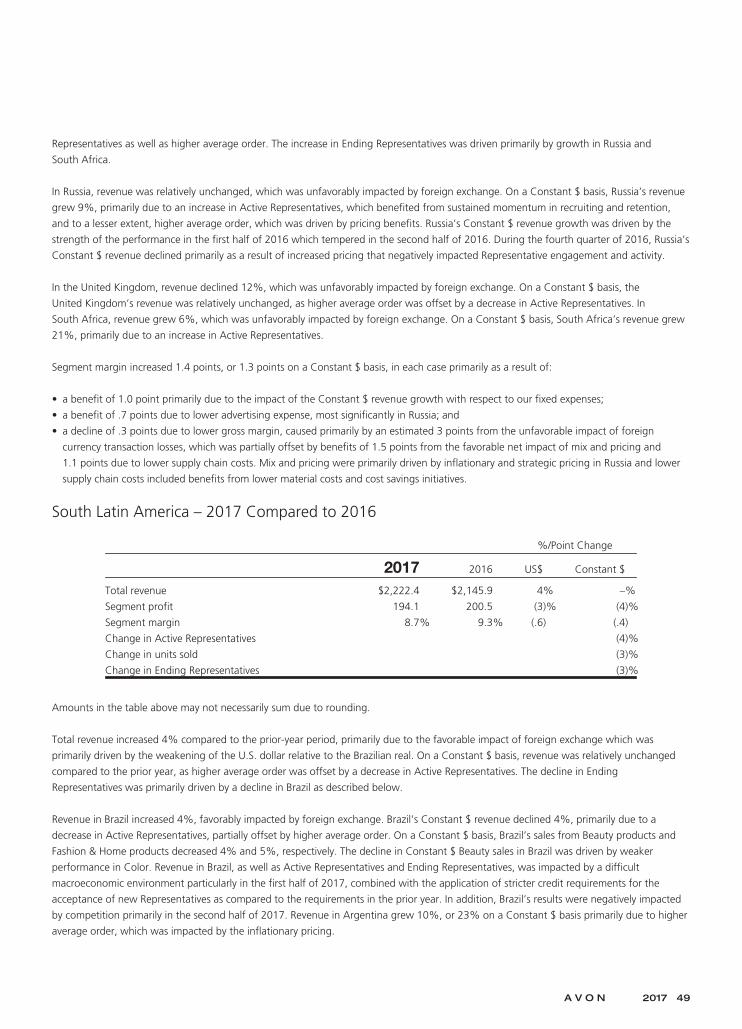
Representatives as well as higher average order. The increase in Ending Representatives was driven primarily by growth in Russia and
South Africa.
In Russia, revenue was relatively unchanged, which was unfavorably impacted by foreign exchange. On a Constant $ basis, Russia’s revenue
grew 9%, primarily due to an increase in Active Representatives, which benefited from sustained momentum in recruiting and retention,
and to a lesser extent, higher average order, which was driven by pricing benefits. Russia’s Constant $ revenue growth was driven by the
strength of the performance in the first half of 2016 which tempered in the second half of 2016. During the fourth quarter of 2016, Russia’s
Constant $ revenue declined primarily as a result of increased pricing that negatively impacted Representative engagement and activity.
In the United Kingdom, revenue declined 12%, which was unfavorably impacted by foreign exchange. On a Constant $ basis, the
United Kingdom’s revenue was relatively unchanged, as higher average order was offset by a decrease in Active Representatives. In
South Africa, revenue grew 6%, which was unfavorably impacted by foreign exchange. On a Constant $ basis, South Africa’s revenue grew
21%, primarily due to an increase in Active Representatives.
Segment margin increased 1.4 points, or 1.3 points on a Constant $ basis, in each case primarily as a result of:
• a benefit of 1.0 point primarily due to the impact of the Constant $ revenue growth with respect to our fixed expenses;
• a benefit of .7 points due to lower advertising expense, most significantly in Russia; and
• a decline of .3 points due to lower gross margin, caused primarily by an estimated 3 points from the unfavorable impact of foreign
currency transaction losses, which was partially offset by benefits of 1.5 points from the favorable net impact of mix and pricing and
1.1 points due to lower supply chain costs. Mix and pricing were primarily driven by inflationary and strategic pricing in Russia and lower
supply chain costs included benefits from lower material costs and cost savings initiatives.
South Latin America – 2017 Compared to 2016
%/Point Change
2017 2016 US$ Constant $
Total revenue $2,222.4 $2,145.9 4% –%
Segment profit 194.1 200.5 (3)% (4)%
Segment margin 8.7% 9.3% (.6) (.4)
Change in Active Representatives (4)%
Change in units sold (3)%
Change in Ending Representatives (3)%
Amounts in the table above may not necessarily sum due to rounding.
Total revenue increased 4% compared to the prior-year period, primarily due to the favorable impact of foreign exchange which was
primarily driven by the weakening of the U.S. dollar relative to the Brazilian real. On a Constant $ basis, revenue was relatively unchanged
compared to the prior year, as higher average order was offset by a decrease in Active Representatives. The decline in Ending
Representatives was primarily driven by a decline in Brazil as described below.
Revenue in Brazil increased 4%, favorably impacted by foreign exchange. Brazil’s Constant $ revenue declined 4%, primarily due to a
decrease in Active Representatives, partially offset by higher average order. On a Constant $ basis, Brazil’s sales from Beauty products and
Fashion & Home products decreased 4% and 5%, respectively. The decline in Constant $ Beauty sales in Brazil was driven by weaker
performance in Color. Revenue in Brazil, as well as Active Representatives and Ending Representatives, was impacted by a difficult
macroeconomic environment particularly in the first half of 2017, combined with the application of stricter credit requirements for the
acceptance of new Representatives as compared to the requirements in the prior year. In addition, Brazil’s results were negatively impacted
by competition primarily in the second half of 2017. Revenue in Argentina grew 10%, or 23% on a Constant $ basis primarily due to higher
average order, which was impacted by the inflationary pricing.
A V O N 2017 49

PART II
Segment margin decreased .6 points, or .4 points on a Constant $ basis, in each case primarily as a result of:
• a decline of .6 points from higher bad debt expense, driven by Brazil due to the lower than anticipated collection of receivables, primarily
impacted by the macroeconomic environment, as well as resulting from an adjustment to credit terms available to new Representatives
during 2016;
• a decline of .6 points primarily due to higher fixed expenses, driven by the inflationary impact on costs outpacing revenue growth,
particularly in Argentina, partially offset by lower expenses associated with employee incentive compensation plans;
• a decline of .5 points due to higher Representative, sales leader and field expense, most significantly in Brazil to support efforts to activate
the field and improve Representative recruitment;
• a decline of .3 points from higher transportation expense, driven by Argentina due to inflationary cost increases; and
• a benefit of 1.8 points due to higher gross margin caused by 2.0 points from the favorable net impact of mix and pricing, primarily due to
inflationary pricing, partially offset by .3 points from higher supply chain costs, which were primarily negatively impacted by higher
material costs which included inflationary pressures in Argentina.
South Latin America – 2016 Compared to 2015
%/Point Change
2016 2015 US$ Constant $
Total revenue $2,145.9 $2,309.6 (7)% 5%
Segment profit 200.5 238.9 (16)% (4)%
Segment margin 9.3% 10.3% (1.0) (.8)
Change in Active Representatives (1)%
Change in units sold (5)%
Change in Ending Representatives 1%
Amounts in the table above may not necessarily sum due to rounding.
Total revenue decreased 7% compared to the prior-year period, due to the unfavorable impact from foreign exchange which was primarily
driven by the strengthening of the U.S. dollar relative to the Argentine peso and the Brazilian real. On a Constant $ basis, revenue increased
5%. The segment’s Constant $ revenue growth was negatively impacted by an estimated 1 point from additional Value Added Tax (“VAT”)
state taxes in Brazil that were implemented in late 2015. In addition, an IPI tax law on cosmetics in Brazil that went into effect in May 2015
caused an estimated 1 point negative impact on the segment’s Constant $ revenue growth. The segment’s Constant $ revenue benefited
from higher average order, which was driven by pricing, and was partially offset by a decrease in Active Representatives. The segment’s
Constant $ revenue and higher average order benefited from relatively high inflation in Argentina, as this market’s results were impacted by
the inflationary impact on pricing. Argentina contributed approximately 4 points to the segment’s Constant $ revenue growth. Revenue in
Argentina decreased 20%, unfavorably impacted by foreign exchange. On a Constant $ basis, Argentina’s revenue grew 28% which was
primarily due to higher average order, partially offset by a decrease in Active Representatives. The increase in Ending Representatives was
primarily driven by growth in Brazil.
Revenue in Brazil decreased 3%, unfavorably impacted by foreign exchange. Brazil’s Constant $ revenue increased 2%, despite the negative
impact of an estimated 3 points due to the additional VAT state taxes discussed above. Constant $ revenue in Brazil was also negatively
impacted by an estimated 3 points from the impact of the IPI tax discussed above. The negative impact of the additional VAT state taxes and
the IPI tax was partially offset by higher average order, which was driven by pricing. Actions taken to recruit new Representatives, including
the adjustment of credit terms, also benefited Brazil’s Constant $ revenue. In addition, Brazil continued to be impacted by a difficult
economic environment. On a Constant $ basis, Brazil’s sales from Beauty products increased 1%, despite the negative impact of the IPI tax
and the additional VAT state taxes. On a Constant $ basis, Brazil’s sales from Fashion & Home products increased 1%.
Segment margin decreased 1.0 point, or .8 points on a Constant $ basis, in each case primarily as a result of:
• a decline of 2.0 points from higher bad debt expense, driven by Brazil primarily due to the macroeconomic environment, coupled with
actions taken to recruit new Representatives, including the adjustment of credit terms;

• a decline of .6 points as a result of the IPI tax law on cosmetics in Brazil, which are a reduction of revenue and we have not raised the
prices paid by Representatives to the same extent as the IPI tax;
• a decline of .4 points from higher advertising expense, primarily in Brazil in the second half of 2016;
• a benefit of .7 points primarily due to the impact of the Constant $ revenue growth with respect to our fixed expenses;
• a benefit of .5 points due to higher gross margin caused by 2.6 points from the favorable net impact of mix and pricing, primarily due to
inflationary and strategic pricing, and 1.2 points from lower supply chain costs, partially offset by an estimated 3.2 points from the
unfavorable impact of foreign currency transaction losses. Supply chain costs benefited primarily as a result of lower material costs and
cost savings initiatives;
• a benefit of .3 points primarily due to the net impact of the Constant $ revenue growth with respect to our Representative, sales leader
and field expense; and
• various other insignificant items that partially offset the decline in segment margin.
North Latin America – 2017 Compared to 2016
%/Point Change
2017 2016 US$ Constant $
Total revenue $811.8 $829.9 (2)% (1)%
Segment profit 81.8 114.4 (28)% (27)%
Segment margin 10.1% 13.8% (3.7) (3.5)
Change in Active Representatives (1)%
Change in units sold (3)%
Change in Ending Representatives (2)%
Amounts in the table above may not necessarily sum due to rounding.
North Latin America consists largely of the Mexico business. Total revenue for the segment decreased 2% compared to the prior-year period,
partly due to the unfavorable impact from foreign exchange, which was primarily driven by the strengthening of the U.S. dollar relative to
the Mexican peso. On a Constant $ basis, revenue decreased 1% due to a decrease in Active Representatives, both of which were negatively
impacted by product fulfillment shortfalls in the region in the second quarter of 2017. Constant $ revenue for the region and Mexico were
both negatively impacted by approximately 1 point and 1 point, respectively, due to the earthquake in Mexico. This earthquake occurred in
late September 2017 and adversely impacted Mexico’s fourth quarter 2017 results. The segment’s Constant $ revenue benefited from
growth in Central America, offset by a Constant $ revenue decline in Mexico. The decline in Ending Representatives was primarily driven by
a decline in Central America.
Revenue in Mexico declined 4%, and was unfavorably impacted by foreign exchange. On a Constant $ basis, Mexico’s revenue declined
2%, primarily due to a decrease in Active Representatives and the impact of the earthquake.
Segment margin decreased 3.7 points, or 3.5 points on a Constant $ basis, in each case primarily as a result of:
• a decline of .9 points due to lower gross margin caused primarily by .9 points from higher supply chain costs and .5 points from the
unfavorable impact of foreign currency transaction net losses, partially offset by .5 points from the favorable net impact of mix and
pricing. The impact of supply chain costs on gross margin was primarily due to lower volume and fixed overhead costs, as well as higher
material costs;
• a decline of .8 points from higher bad debt expense, primarily in Mexico partially due to the implementation of a new collection process as
a result of changes in regulations;
• a decline of .7 points due to higher Representative, sales leader and field expense, primarily as a result of increasing incentives to mitigate
the impact of the product fulfillment shortfalls in the region and the earthquake in Mexico;
• a decline of .6 points from higher transportation costs driven by Mexico primarily due to increased fuel prices; and
• a decline of .3 points from higher net brochure costs, partly due to an increase in the number of pages in support of the segmentation of
our Color category.
A V O N 2017 51

PART II
North Latin America – 2016 Compared to 2015
%/Point Change
2016 2015 US$ Constant $
Total revenue $829.9 $901.0 (8)% 3%
Segment profit 114.4 107.2 7% 22%
Operating margin 13.8% 11.9% 1.9 2.2
Change in Active Representatives –%
Change in units sold (6)%
Change in Ending Representatives (1)%
Amounts in the table above may not necessarily sum due to rounding.
Total revenue decreased 8% compared to the prior-year period, due to the unfavorable impact from foreign exchange which was primarily
driven by the strengthening of the U.S. dollar relative to the Mexican peso. On a Constant $ basis, revenue increased 3%, which benefited
from higher average order. Revenue in Mexico decreased 11%, unfavorably impacted by foreign exchange. On a Constant $ basis, Mexico’s
revenue grew 5%, primarily due to higher average order driven primarily from pricing, partially offset by a decline in units sold.
Segment margin increased 1.9 points, or 2.2 points on a Constant $ basis, in each case primarily as a result of:
• a benefit of 1.1 points due to higher gross margin caused primarily by a benefit of 2.7 points from the favorable impact of mix and
pricing, primarily due to inflationary and strategic pricing, partially offset by 1.5 points from the unfavorable impact of foreign currency
transaction losses; and
• a benefit of .8 points primarily from lower fixed expenses, which includes .6 points as a result of an out-of-period adjustment which
negatively impacted the prior-year period, as well as due to the impact of the Constant $ revenue growth with respect to our fixed
expenses.
Asia Pacific – 2017 Compared to 2016
%/Point Change
2017 2016 US$ Constant $
Total revenue $518.3 $549.7 (6)% (3)%
Segment profit 47.7 60.6 (21)% (14)%
Segment margin 9.2% 11.0% (1.8) (1.3)
Change in Active Representatives (4)%
Change in units sold (1)%
Change in Ending Representatives (1)%
Amounts in the table above may not necessarily sum due to rounding.
Effective in the first quarter of 2017, given that we exited Thailand during 2016, the results of Thailand are now reported in
Other operating segments and business activities for all periods presented, while previously the results had been reported in
Asia Pacific. The impact was not material to Asia Pacific or Other operating segments and business activities and is consistent
with how we present other market exits.
Total revenue decreased 6% compared to the prior-year period, partially due to the unfavorable impact from foreign exchange. On a
Constant $ basis, revenue decreased 3%, primarily due to a decrease in Active Representatives, most significantly in Malaysia, partially offset
by higher average order. The decrease in Ending Representatives was impacted most significantly by a decline in Malaysia, which was
partially offset by growth in the Philippines.

Revenue in the Philippines decreased 2%, or increased 3% on a Constant $ basis, primarily due to higher average order and an increase in
Active Representatives. Revenue growth in the Philippines was driven by the latter half of 2017, as strong commercial offers, including
pricing, which, along with television advertising associated with our Color category, helped drive momentum in the field. In addition, actions
implemented to improve inventory availability provided benefits to revenue growth.
Segment margin decreased 1.8 points, or 1.3 points on a Constant $ basis, in each case primarily as a result of:
• a decline of 1.4 points primarily related to the net impact of declining revenue with respect to Representative, sales leader and field
expense, primarily in the Philippines;
• a decline of 1.0 point due to lower gross margin caused primarily by .7 points from supply chain costs and .4 points from the unfavorable
net impact of mix and pricing. The impact of supply chain costs on gross margin was primarily due to lower volume on fixed overhead
costs;
• a decline of .4 points due to higher advertising expense, primarily in the Philippines, related to television advertising associated with our
Color category during the the latter half of 2017;
• a benefit of 1.0 point due to the lower fixed expenses, including the benefits associated with the Transformation Plan, primarily reductions
in headcount; and
• a benefit of .4 points from lower bad debt expense, primarily in the Philippines, driven mainly by improved collection.
Earlier in 2017, we completed the review of our China operations and have determined that we will retain China in our portfolio of
businesses.
Asia Pacific – 2016 Compared to 2015
%/Point Change
2016 2015 US$ Constant $
Total revenue $549.7 $616.8 (11)% (7)%
Segment profit 60.6 69.4 (13)% (6)%
Operating margin 11.0% 11.3% (.3) .1
Change in Active Representatives (9)%
Change in units sold (6)%
Change in Ending Representatives (9)%
Amounts in the table above may not necessarily sum due to rounding.
Total revenue decreased 11% compared to the prior-year period, partially due to the unfavorable impact from foreign exchange. On a
Constant $ basis, revenue decreased 7%, due to declines in most markets. The segment’s Constant $ revenue decline was primarily due to a
decrease in Active Representatives, partially offset by higher average order. Revenue in the Philippines decreased 3%, but grew 2% on a
Constant $ basis, primarily due to higher average order, partially offset by a decrease in Active Representatives. The segment’s and the
Philippines’ Active Representatives decline was impacted by a reduction in the number of sales campaigns in the Philippines. The decrease in
Ending Representatives was driven by declines in all markets.
Segment margin declined .3 points, or increased .1 point on a Constant $ basis, in each case primarily as a result of:
• a net benefit of .3 points primarily from lower fixed expenses, largely offset by the unfavorable impact of the declining revenue causing
deleverage of our fixed expenses;
• a decline of .8 points due to lower gross margin, caused primarily by 1.1 points from the unfavorable impact of mix and pricing and .3
points from the unfavorable impact of foreign currency transaction losses, partially offset by .7 points from lower supply chain costs; and
• various other insignificant items that benefited segment margin.
Liquidity and Capital ResourcesOur principal sources of funding historically have been cash flows from operations, public offerings of notes, bank financings, issuance of
commercial paper, borrowings under lines of credit and a private placement of notes. At December 31, 2017, we had cash and cash
A V O N 2017 53

PART II
equivalents totaling approximately $882. We believe that our sources of funding will be sufficient to satisfy our currently anticipated cash
requirements through at least the next twelve months.
We may seek to repurchase our equity or to retire our outstanding debt in open market purchases, privately negotiated transactions,
through derivative instruments, cash tender offers or otherwise. Repurchases of equity and debt may be funded by the incurrence of
additional debt or the issuance of equity (including shares of preferred stock) or convertible securities and will depend on prevailing market
conditions, our liquidity requirements, contractual restrictions and other factors, and the amounts involved may be material. We may also
elect to incur additional debt or issue equity (including shares of preferred stock) or convertible securities to finance ongoing operations or to
meet our other liquidity needs. Any issuances of equity (including shares of preferred stock) or convertible securities could have a dilutive
effect on the ownership interest of our current shareholders and may adversely impact earnings per share in future periods. Our credit
ratings were downgraded during the past several years, which may impact our ability to access such transactions on favorable terms, if at all.
For more information, see “Risk Factors – Our credit ratings were downgraded in each of the last three years, which could limit our access to
financing, affect the market price of our financing and increase financing costs. A further downgrade in our credit ratings may adversely
affect our access to liquidity,” “Risk Factors – Our indebtedness could adversely affect us by reducing our flexibility to respond to changing
business and economic conditions,” and “Risk Factors – A general economic downturn, a recession globally or in one or more of our
geographic regions or markets or sudden disruption in business conditions or other challenges may adversely affect our business, our access
to liquidity and capital, and our credit ratings” included in Item 1A on pages 7 through 22 of our 2017 Annual Report.
Our liquidity could also be negatively impacted by restructuring initiatives, dividends, capital expenditures, acquisitions, and certain
contingencies, including any legal or regulatory settlements, described more fully in Note 18, Contingencies on pages F-51 through F-53 of
our 2017 Annual Report. See our Cautionary Statement for purposes of the “Safe Harbor” Statement under the Private Securities Litigation
Reform Act of 1995 on pages 1 through 2 of our 2017 Annual Report.
Balance Sheet Data
2017 2016
Cash and cash equivalents $ 881.5 $ 654.4
Total debt 1,897.9 1,893.9
Working capital 673.7 506.6
Cash Flows
2017 2016 2015
Net cash from continuing operating activities $271.2 $128.0 $ 91.4
Net cash from continuing investing activities (69.6) (82.7) 142.5
Net cash from continuing financing activities – 137.0 (430.5)
Effect of exchange rate changes on cash and equivalents 34.1 (50.4) (80.7)
Net Cash from Continuing Operating ActivitiesNet cash provided by continuing operating activities during 2017 was approximately $271 as compared to approximately $128 during 2016,
an increase of approximately $143 million. The year-over-year comparison was unfavorably impacted by approximately $27 of proceeds, net
of legal fees, related to settling claims relating to professional services in connection with a previously disclosed legal matter, which was
received in 2016. This unfavorable impact was partially offset by an injunction we received in May 2016 for cash deposits associated with IPI
in Brazil. As a result, we were not required to make cash deposits in 2017, while we paid approximately $19 for these cash deposits in 2016,
prior to May. See Note 18, Contingencies on pages F-51 through F-53 of our 2017 Annual Report for additional information on the IPI taxes.
The remaining approximate $135 benefit to the year-over-year comparison of net cash provided by continuing operating activities was
primarily due to improvements in working capital, most significantly from lower purchases of inventory and the timing of payments, as well
as lower net receivables.

Net cash provided by continuing operating activities during 2016 was approximately $37 higher than during 2015. The approximate
$37 increase to net cash provided by continuing operating activities was primarily due to the approximate $67 payment to the U.S. Securities
and Exchange Commission in connection with the FCPA settlement in 2015, which did not recur in 2016, lower operating tax payments,
primarily in Brazil, and higher cash-related earnings. The net cash provided by continuing operating activities in 2016 also benefited from
approximately $27 of proceeds, net of legal fees, related to settling claims relating to professional services in connection with a previously
disclosed legal matter. These items were partially offset by the timing of payments, primarily for inventory, increased levels of accounts
receivable which was primarily attributable to macroeconomic conditions in Brazil, and the contribution to the U.S. pension plan in 2016 of
$20, which did not occur in 2015.
We maintain defined benefit pension plans and unfunded supplemental pension benefit plans (see Note 13, Employee Benefit Plans on
pages F-34 through F-43 of our 2017 Annual Report). Our funding policy for these plans is based on legal requirements and available cash
flows. The amounts necessary to fund future obligations under these plans could vary depending on estimated assumptions (as detailed in
“Critical Accounting Estimates – Pension and Postretirement Expense” in this MD&A). The future funding for these plans will depend on
economic conditions, employee demographics, mortality rates, the number of associates electing to take lump-sum distributions, investment
performance and funding decisions. Based on current assumptions, we expect to make contributions in the range of $10 to $15 to our U.S.
defined benefit pension and postretirement plans and in the range of $20 to $25 to our non-U.S. defined benefit pension and
postretirement plans during 2018.
Net Cash from Continuing Investing ActivitiesNet cash used by continuing investing activities during 2017 was approximately $70, as compared to approximately $83 during 2016. The
approximate $13 decrease to net cash used by continuing investing activities was primarily due to an approximate $22 cash distribution
received from New Avon in the third quarter of 2017, partially offset by lower asset disposals as compared to the prior-year period. See
Note 4, Investment in New Avon on pages F-18 through F-19 of our 2017 Annual Report for more information on the cash distribution
received from New Avon.
Net cash used by continuing investing activities during 2016 was approximately $83, as compared to net cash provided by continuing
investing activities of approximately $143 during 2015. The approximate $226 decrease to net cash (used) provided by continuing investing
activities was primarily due to the net proceeds on the sale of Liz Earle in 2015 of approximately $208. See Note 3, Discontinued Operations
and Divestitures on pages F-17 through F-18 of our 2017 Annual Report for more information on the sale of Liz Earle.
Capital expenditures during 2017 were approximately $97 compared with approximately $93 during 2016 and approximately $92 during
2015.
Capital expenditures in 2018 are currently expected to be in the range of $120 to $140 and are expected to be funded by cash from
operations.
Net Cash from Continuing Financing ActivitiesNet cash provided by continuing financing activities during 2017 was zero, as compared to approximately $137 during 2016. The
approximate $137 decrease to net cash provided by continuing financing activities was primarily due to the net proceeds related to the
$500 principal amount of 7.875% Senior Secured Notes issued in the August 2016 and the net proceeds from the sale of series C preferred
stock. These drivers were partially offset by the repayment of certain of our debt in 2016 of approximately $720 in the aggregate and higher
repayments of short-term debt in the prior-year period. See Note 7, Debt and Other Financing on pages F-20 through F-23 of our 2017
Annual Report and Note 17, Series C Convertible Preferred Shares on pages F-50 through F-51 of our 2017 Annual Report for more
information.
Net cash provided by continuing financing activities during 2016 was approximately $137, as compared to net cash used by continuing
financing activities of approximately $431 during 2015. The approximately $568 increase to net cash provided (used) by continuing
financing activities was primarily due to the net proceeds related to the $500 principal amount of 7.875% Senior Secured Notes issued in
the third quarter of 2016, the net proceeds of approximately $426 from the sale of series C preferred stock, the suspension of our dividend,
and the prepayment of the $250 principal amount of our 2.375% Notes in the third quarter of 2015, which were partially offset by the
repayment of certain of our debt in 2016 of approximately $720 in the aggregate. See Note 17, Series C Convertible Preferred Shares on
pages F-50 through F-51 of our 2017 Annual Report and Note 7, Debt and Other Financing on pages F-20 through F-23 of our 2017 Annual
Report for more information.
A V O N 2017 55

PART II
We purchased approximately 1.6 million shares of our common stock for $7.2 during 2017, as compared to 1.4 million shares of our
common stock for $5.6 during 2016 and .3 million shares of our common stock for $3.1 during 2015, through acquisition of stock from
employees in connection with tax payments upon vesting of restricted stock units and upon vesting of performance restricted stock units in
2017 and 2016.
We did not declare a dividend for 2017 or 2016 as we suspended the dividend effective in the first quarter of 2016. We maintained a
quarterly dividend of $.06 per share for 2015.
Debt and Contractual Financial Obligations and CommitmentsAt December 31, 2017, our debt and contractual financial obligations and commitments by due dates were as follows:
2018 2019 2020 2021 20222023
and Beyond Total
Short-term debt $ 22.8 $ – $ – $ – $ – $ – $ 22.8Long-term debt – 237.8 409.9 – 500.0 732.8 1,880.5Capital lease obligations 2.9 .8 .2 .1 – – 4.0
Total debt 25.7 238.6 410.1 .1 500.0 732.8 1,907.3Debt-related interest(1) 137.9 125.1 101.0 95.4 80.5 56.0 595.9
Total debt-related 163.6 363.7 511.1 95.5 580.5 788.8 2,503.2Operating leases(2) 53.5 41.1 30.5 20.7 18.3 32.0 196.1Purchase obligations 190.1 142.0 79.3 39.2 19.9 8.6 479.1Benefit obligations(3) 45.5 13.8 13.6 14.1 13.2 63.0 163.2
Total debt and contractual financialobligations and commitments(4) $452.7 $560.6 $634.5 $169.5 $631.9 $892.4 $3,341.6
(1) Amounts are based on our current long-term credit ratings. See Note 7, Debt and Other Financing on pages F-20 through F-23 of our 2017 Annual Report formore information.
(2) Amounts are net of expected sublease rental income. See Note 15, Leases and Commitments on page F-46 of our 2017 Annual Report for more information.
(3) Amounts represent expected future benefit payments for our unfunded defined benefit pension and postretirement benefit plans, as well as expectedcontributions for 2018 to our funded defined benefit pension benefit plans. We are not able to estimate our contributions to our funded defined benefitpension and postretirement plans beyond 2018.
(4) The amount of debt and contractual financial obligations and commitments excludes amounts due under derivative transactions. The table also excludesinformation on non-binding purchase orders of inventory. The table does not include any reserves for uncertain income tax positions because we are unableto reasonably predict the ultimate amount or timing of settlement of these uncertain income tax positions. At December 31, 2017, our reserves for uncertainincome tax positions, including interest and penalties, totaled approximately $54.
See Note 7, Debt and Other Financing, and Note 15, Leases and Commitments on pages F-20 through F-23, and on page F-46, respectively,
of our 2017 Annual Report for more information on our debt and contractual financial obligations and commitments. Additionally, as
disclosed in Note 16, Restructuring Initiatives on pages F-46 through F-50 of our 2017 Annual Report, at December 31, 2017, we have
liabilities of approximately $49 associated with our Transformation Plan. The majority of future cash payments associated with these
restructuring liabilities are expected to be made during 2018.
Off Balance Sheet ArrangementsAt December 31, 2017, we had no material off-balance-sheet arrangements.
Capital Resources
Revolving Credit FacilityIn June 2015, Avon International Operations, Inc. (“AIO”), a wholly-owned domestic subsidiary of the Company, entered into a five-year
$400.0 senior secured revolving credit facility (the “2015 facility”). Borrowings under the 2015 facility bear interest, at our option, at a rate

per annum equal to LIBOR plus 250 basis points or a floating base rate plus 150 basis points, in each case subject to adjustment based upon
a leverage-based pricing grid. In December 2017, AIO entered into an amendment to the 2015 facility, which, among other things, modified
the financial covenants (interest coverage and total leverage ratios) to provide the Company additional flexibility.
The 2015 facility may be used for general corporate purposes. As of December 31, 2017, there were no amounts outstanding under the
2015 facility. The 2015 facility replaced the Company’s previous $1 billion unsecured revolving credit facility (the “2013 facility”). In the
second quarter of 2015, $2.5 before tax was recorded for the write-off of issuance costs related to the 2013 facility.
All obligations of AIO under the 2015 facility are (i) unconditionally guaranteed by each material domestic restricted subsidiary of the
Company (other than AIO, the borrower), in each case, subject to certain exceptions and (ii) fully guaranteed on an unsecured basis by the
Company. The obligations of AIO and the subsidiary guarantors are secured by first priority liens on and security interest in substantially all
of the assets of AIO and the subsidiary guarantors, in each case, subject to certain exceptions.
The 2015 facility will terminate in June 2020; provided, however, that it shall terminate on the 91st day prior to the maturity of the 6.50%
Notes (as defined above) and the 4.60% Notes (as defined above), if on such 91st day, the applicable notes are not redeemed, repaid,
discharged, defeased or otherwise refinanced in full.
The 2015 facility contains affirmative and negative covenants, which are customary for secured financings of this type, as well as financial
covenants (interest coverage and total leverage ratios). As of December 31, 2017, we were in compliance with our interest coverage and
total leverage ratios under the 2015 facility, as amended. The amount of the facility available to be drawn down on is reduced by any
standby letters of credit granted by AIO, which, as of December 31, 2017, was approximately $38. As of December 31, 2017, based on then
applicable interest rates, the entire amount of the remaining 2015 facility, which is approximately $362, could have been drawn down
without violating any covenant. Depending on our business results (including the impact of any adverse foreign exchange movements and
significant restructuring charges), it is possible that we may be non-compliant with our interest coverage or total leverage ratio absent the
Company undertaking other alternatives to avoid noncompliance, such as obtaining additional amendments to the 2015 facility or
repurchasing certain debt. If we were to be non-compliant with our interest coverage or total leverage ratio, we would no longer have
access to our 2015 facility and our credit ratings may be downgraded. As of December 31, 2017, there were no amounts outstanding under
the 2015 facility.
ITEM 7A. QUANTITATIVE AND QUALITATIVE DISCLOSURES ABOUT MARKET RISK(U.S. dollars in millions, except per share data)
The overall objective of our financial risk management program is to reduce the potential negative effects from changes in foreign exchange
and interest rates arising from our business activities. We may reduce our exposure to fluctuations in fair value or cash flows associated with
changes in interest rates and foreign exchange rates by creating offsetting positions through the use of derivative financial instruments and
through operational means. Since we may use foreign currency rate-sensitive instruments to hedge a portion of our existing and forecasted
transactions, we expect that any loss in value for the hedge instruments generally would be offset by changes in the value of the underlying
transactions.
We do not enter into derivative financial instruments for trading or speculative purposes, nor are we a party to leveraged derivatives. The
master agreements governing our derivative contracts generally contain standard provisions that could trigger early termination of the
contracts in some circumstances, including if we were to merge with another entity and the creditworthiness of the surviving entity were to
be “materially weaker” than that of Avon prior to the merger.
Interest Rate RiskIn the past we have used interest-rate swaps to manage our interest rate exposure. The interest-rate swaps were used to either convert our
fixed rate borrowing to a variable interest rate or to unwind an existing variable interest-rate swap on a fixed rate borrowing. As of
December 31, 2017, we do not have any interest-rate swap agreements. Approximately 1% of our debt portfolio at December 31, 2017
and 2016, respectively, was exposed to floating interest rates.
Our long-term borrowings were analyzed at year-end to determine their sensitivity to interest rate changes. Based on the outstanding
balance of all these financial instruments at December 31, 2017, a hypothetical 50-basis-point change (either an increase or a decrease) in
A V O N 2017 57

PART II
interest rates prevailing at that date, sustained for one year, would not represent a material potential change in fair value, earnings or cash
flows. This potential change was calculated based on discounted cash flow analyses using interest rates comparable to our current cost of
debt.
Foreign Currency RiskWe conduct business globally, with operations in various locations around the world. Over the past three years, all of our consolidated
revenue was derived from operations of subsidiaries outside of the United States (“U.S.”). The functional currency for most of our foreign
operations is their local currency. We are exposed to changes in financial market conditions in the normal course of our operations, primarily
due to international businesses and transactions denominated in foreign currencies and the use of various financial instruments. We are not
able to project, in any meaningful way, the possible effect of these foreign currency fluctuations on translated amounts or future earnings.
At December 31, 2017, the primary foreign currencies for which we had net underlying foreign currency exchange rate exposures were the
Argentine peso, Brazilian real, British pound, Chilean peso, Colombian peso, the euro, Mexican peso, Peruvian new sol, Philippine peso,
Polish zloty, Romanian leu, Russian ruble, South African rand, Turkish lira and Ukrainian hryvnia.
We may reduce our exposure to fluctuations in fair value or cash flows associated with changes in foreign exchange rates by creating
offsetting positions, including through the use of derivative financial instruments. Our hedges of our foreign currency exposure are not
designed to, and, therefore, cannot entirely eliminate the effect of changes in foreign exchange rates on our consolidated financial position,
results of operations and cash flows.
Our foreign-currency financial instruments were analyzed at year-end to determine their sensitivity to foreign exchange rate changes. Based
on our outstanding foreign exchange contracts at December 31, 2017, the impact of a hypothetical 10% appreciation or 10% depreciation
of the U.S. dollar against our foreign exchange contracts would not represent a material potential change in fair value, earnings or cash
flows. This potential change does not consider our underlying foreign currency exposures. The hypothetical impact was calculated on the
open positions using forward rates at December 31, 2017, adjusted for an assumed 10% appreciation or 10% depreciation of the U.S.
dollar against these hedging contracts.
Credit Risk of Financial InstrumentsAt times, we attempt to minimize our credit exposure to counterparties by entering into derivative transactions and similar agreements with
major international financial institutions with “A-” or higher credit ratings as issued by Standard & Poor’s Corporation. Our foreign currency
derivatives are typically comprised of over-the-counter forward contracts, swaps or options with major international financial institutions.
Although our theoretical credit risk is the replacement cost at the then estimated fair value of these instruments, we believe that the risk of
incurring credit risk losses is remote and that such losses, if any, would not be material.
Non-performance of the counterparties on the balance of all the foreign exchange agreements would have resulted in a write-off of $.2 at
December 31, 2017. In addition, in the event of non-performance by such counterparties, we would be exposed to market risk on the
underlying items being hedged as a result of changes in foreign exchange rates.
See Note 10, Financial Instruments and Risk Management on pages F-28 through F-30 of our 2017 Annual Report for more information.
ITEM 8. FINANCIAL STATEMENTS AND SUPPLEMENTARY DATA
Reference is made to the Index on page F-1 of our Consolidated Financial Statements and Notes thereto contained herein.
ITEM 9. CHANGES IN AND DISAGREEMENTS WITH ACCOUNTANTS ONACCOUNTING AND FINANCIAL DISCLOSURE
Not applicable.
ITEM 9A. CONTROLS AND PROCEDURES
Evaluation of Disclosure Controls and ProceduresAs of the end of the period covered by this report, our principal executive and principal financial officers carried out an evaluation of the
effectiveness of the design and operation of our disclosure controls and procedures pursuant to Rule 13a-15 of the Securities Exchange Act

of 1934, as amended (the “Exchange Act”). In designing and evaluating our disclosure controls and procedures, management recognizes
that any controls and procedures, no matter how well designed and operated, can provide only reasonable assurance of achieving the
desired control objectives, and management was required to apply its judgment in evaluating and implementing possible controls and
procedures. Based upon their evaluation, the principal executive and principal financial officers concluded that our disclosure controls and
procedures were effective as of December 31, 2017, at the reasonable assurance level. Disclosure controls and procedures are designed to
ensure that information relating to Avon (including our consolidated subsidiaries) required to be disclosed by us in the reports we file or
submit under the Exchange Act is recorded, processed, summarized and reported within the time periods specified in the United States
Securities and Exchange Commission’s rules and forms and to ensure that information required to be disclosed is accumulated and
communicated to management to allow timely decisions regarding disclosure.
Management’s Report on Internal Control over Financial ReportingOur management is responsible for establishing and maintaining adequate internal control over financial reporting, as such term is defined
in Rule 13a-15(f) under the Exchange Act. Internal control over financial reporting is defined as a process designed by, or under the
supervision of, our principal executive and principal financial officers and effected by our Board of Directors, management and other
personnel, to provide reasonable assurance regarding the reliability of financial reporting and the preparation of financial statements for
external purposes in accordance with generally accepted accounting principles, and includes those policies and procedures that:
• pertain to the maintenance of records that, in reasonable detail accurately and fairly reflect the transactions and dispositions of our assets;
• provide reasonable assurance that transactions are recorded as necessary to permit preparation of financial statements in accordance with
generally accepted accounting principles, and that our receipts and expenditures are being made only in accordance with authorizations
of our management and directors; and
• provide reasonable assurance regarding prevention or timely detection of unauthorized acquisition, use or disposition of our assets that
could have a material effect on the financial statements.
Internal control over financial reporting cannot provide absolute assurance of achieving financial reporting objectives because of its inherent
limitations. Internal control over financial reporting is a process that involves human diligence and compliance and is subject to lapses in
judgment and breakdowns resulting from human failures. Internal control over financial reporting also can be circumvented by collusion or
improper override. Because of such limitations, there is a risk that material misstatements may not be prevented or detected on a timely
basis by internal control over financial reporting. However, these inherent limitations are known features of the financial reporting process,
and it is possible to design into the process safeguards to reduce, though not eliminate, this risk.
Under the supervision and with the participation of our management, including our principal executive and principal financial officers, we
assessed as of December 31, 2017, the effectiveness of our internal control over financial reporting. This assessment was based on criteria
established in the framework in Internal Control-Integrated Framework issued by the Committee of Sponsoring Organizations of the
Treadway Commission (2013 framework). Based on our assessment using those criteria, our management concluded that our internal
control over financial reporting as of December 31, 2017, was effective.
PricewaterhouseCoopers LLP, the independent registered public accounting firm that audited the financial statements included in this 2017
Annual Report on Form 10-K, has audited the effectiveness of our internal control over financial reporting as of December 31, 2017. Their
2017 report is included on pages F-2 through F-3 of our 2017 Annual Report.
Changes in Internal Control over Financial ReportingOur management has evaluated, with the participation of our principal executive and principal financial officers, whether any changes in our
internal control over financial reporting that occurred during our last fiscal quarter (the registrant’s fourth fiscal quarter in the case of an
annual report) have materially affected, or are reasonably likely to materially affect, our internal control over financial reporting. Based on
the evaluation we conducted, our management has concluded that no such changes have occurred.
ITEM 9B. OTHER INFORMATION
Not applicable.
A V O N 2017 59
PART III
ITEM 10. DIRECTORS, EXECUTIVE OFFICERS AND CORPORATE GOVERNANCE
DirectorsInformation regarding directors is incorporated by reference to the “Proposal 1 – Election of Directors” and “Information Concerning the
Board of Directors” sections of our proxy statement for the 2018 Annual Meeting of Shareholders (“2018 Proxy Statement”).
Executive OfficersInformation regarding executive officers is incorporated by reference to the “Executive Officers” section of our 2018 Proxy Statement.
Section 16(a) Beneficial Ownership Reporting ComplianceThis information is incorporated by reference to the “Section 16(a) Beneficial Ownership Reporting Compliance” section of our 2018 Proxy
Statement.
Code of ConductWe have adopted a Code of Conduct, amended in June 2013, that applies to all members of the Board of Directors and to all of our
employees, including our principal executive officer, principal financial officer and principal accounting officer or controller. Our Code of
Conduct is available, free of charge, on our investor website, www.avoninvestor.com. Our Code of Conduct is also available, without
charge, by sending a letter to Investor Relations, Avon Products, Inc., 601 Midland Avenue, Rye, N.Y. 10580, by sending an email to
[email protected] or by calling (203) 682-8200. None of the provisions of the Code of Conduct may be waived. However, any
amendment to, or waiver from, the provisions of the Code of Conduct that applies to any of those officers would be posted to the same
location on our website in accordance with applicable rules.
Audit Committee; Audit Committee Financial ExpertThis information is incorporated by reference to the “Information Concerning the Board of Directors” section of our 2018 Proxy Statement.
Material Changes in Nominating ProceduresThis information is incorporated by reference to the “Information Concerning the Board of Directors” section of our 2018 Proxy Statement.
ITEM 11. EXECUTIVE COMPENSATION
This information is incorporated by reference to the “Information Concerning the Board of Directors,” “Executive Compensation” and
“Director Compensation” sections of our 2018 Proxy Statement.
ITEM 12. SECURITY OWNERSHIP OF CERTAIN BENEFICIAL OWNERS ANDMANAGEMENT AND RELATED STOCKHOLDER MATTERS
This information is incorporated by reference to the “Equity Compensation Plan Information” and “Ownership of Shares” sections of our
2018 Proxy Statement.
ITEM 13. CERTAIN RELATIONSHIPS AND RELATED TRANSACTIONS, AND DIRECTORINDEPENDENCE
This information is incorporated by reference to the “Information Concerning the Board of Directors” and “Transactions with Related
Persons” sections of our 2018 Proxy Statement.
ITEM 14. PRINCIPAL ACCOUNTANT FEES AND SERVICES
This information is incorporated by reference to the “Proposal 4 – Ratification of Appointment of Independent Registered Public Accounting
Firm” section of our 2018 Proxy Statement.

PART IV
ITEM 15. EXHIBITS AND FINANCIAL STATEMENT SCHEDULE
(a) 1. Consolidated Financial Statements and Report of Independent Registered PublicAccounting FirmSee Index on page F-1.
(a) 2. Financial Statement ScheduleSee Index on page F-1.
All other schedules are omitted because they are not applicable or because the required information is shown in the consolidated financial
statements and notes.
(a) 3. Index to Exhibits
Exhibit
Number Description
2.1 Share Purchase Agreement, dated as of July 9, 2015, among Avon Products Holding Limited, Liz Earle Beauty Co. Limited and
Alliance Boots Holdings Limited (incorporated by reference to Exhibit 2.1 to Avon’s Current Report on Form 8-K filed on July 9,
2015).
2.2 Separation and Investment Agreement, dated as of December 17, 2015, by and among Avon Products, Inc., C-A NA LLC and
Cleveland NA Investors LLC (incorporated by reference to Exhibit 2.1 to Avon’s Current Report on Form 8-K filed on
December 21, 2015).
3.1 Restated Certificate of Incorporation of Avon Products, Inc., as amended with the Secretary of State of the State of New York
on October 12, 2016 (incorporated by reference to Exhibit 3.1 to Avon’s Current Report on Form 8-K filed on October 13,
2016).
3.2 By-Laws of Avon Products, Inc., effective October 6, 2016 (incorporated by reference to Exhibit 3.2 to Avon’s Current Report
on Form 8-K filed on October 13, 2016).
4.1 Indenture, dated as of February 27, 2008, between Avon Products, Inc. and Deutsche Bank Trust Company Americas, as
Trustee (incorporated by reference to Exhibit 4.5 to Avon’s Current Report on Form 8-K filed on March 4, 2008).
4.2 Fourth Supplemental Indenture, dated as of March 2, 2009, between Avon Products, Inc. and Deutsche Bank Trust Company
Americas, as Trustee, with respect to the issuance of the 6.500% Notes due 2019 (incorporated by reference to Exhibit 4.2 to
Avon’s Current Report on Form 8-K filed on March 2, 2009).
4.3 Sixth Supplemental Indenture, dated as of March 12, 2013, between Avon Products, Inc. and Deutsche Bank Trust Company
Americas, as Trustee, with respect to the issuance of the 4.600% Notes due 2020 (incorporated by reference to Exhibit 4.3 to
Avon’s Current Report on Form 8-K filed on March 13, 2013).
4.4 Seventh Supplemental Indenture, dated as of March 12, 2013, between Avon Products, Inc. and Deutsche Bank Trust
Company Americas, as Trustee, with respect to the issuance of the 5.000% Notes due 2023 (incorporated by reference to
Exhibit 4.4 to Avon’s Current Report on Form 8-K filed on March 13, 2013).
4.5 Eighth Supplemental Indenture, dated as of March 12, 2013, between Avon Products, Inc. and Deutsche Bank Trust Company
Americas, as Trustee, with respect to the issuance of the 6.950% Notes due 2043 (incorporated by reference to Exhibit 4.5 to
Avon’s Current Report on Form 8-K filed on March 13, 2013).
4.6 Indenture, dated August 15, 2016, among Avon International Operations, Inc., the guarantors party thereto and Deutsche
Bank Trust Company Americas, as trustee and collateral agent (incorporated by reference to Exhibit 4.1 to Avon’s Quarterly
Report on Form 10-Q for the quarter ended September 30, 2017).
10.1* Avon Products, Inc. 2005 Stock Incentive Plan (incorporated by reference to Appendix G to Avon’s Proxy Statement as filed on
March 28, 2005).
A V O N 2017 61

PART IV
Exhibit
Number Description
10.2* First Amendment of the Avon Products, Inc. 2005 Stock Incentive Plan, effective January 1, 2006 (incorporated by reference to
Exhibit 10.12 to Avon’s Annual Report on Form 10-K for the year ended December 31, 2006).
10.3* Second Amendment of the Avon Products, Inc. 2005 Stock Incentive Plan, effective January 1, 2007 (incorporated by reference
to Exhibit 10.13 to Avon’s Annual Report on Form 10-K for the year ended December 31, 2006).
10.4* Third Amendment to the Avon Products, Inc. 2005 Stock Incentive Plan, dated October 2, 2008 (incorporated by reference to
Exhibit 10.14 to Avon’s Annual Report on Form 10-K for the year ended December 31, 2008).
10.5* Fourth Amendment to the Avon Products, Inc. 2005 Stock Incentive Plan, dated March 1, 2016. (incorporated by reference to
Exhibit 10.7 to Avon’s Quarterly Report on Form 10-Q for the quarter ended March 31, 2016).
10.6* Form of U.S. Stock Option Agreement under the Avon Products, Inc. Year 2005 Stock Incentive Plan (incorporated by
reference to Exhibit 99.1 to Avon’s Current Report on Form 8-K filed on September 6, 2005).
10.7* Avon Products, Inc. 2010 Stock Incentive Plan (incorporated by reference to Appendix E to Avon’s Proxy Statement as filed on
March 25, 2010).
10.8* First Amendment to the Avon Products, Inc. 2010 Stock Incentive Plan, dated March 1, 2016 (incorporated by reference to
Exhibit 10.6 to Avon’s Quarterly Report on Form 10-Q for the quarter ended March 31, 2016).
10.9* Form of Stock Option Award Agreement under the Avon Products, Inc. 2010 Stock Incentive Plan (incorporated by reference
to Exhibit 10.1 to Avon’s Current Report on Form 8-K filed on May 24, 2010).
10.10* Form of Restricted Stock Unit Award Agreement under the Avon Products, Inc. 2010 Stock Incentive Plan (incorporated by
reference to Exhibit 10.2 to Avon’s Current Report on Form 8-K filed on May 24, 2010).
10.11* Form of Retention Restricted Stock Unit Award Agreement under the Avon Products, Inc. 2010 Stock Incentive Plan
(incorporated by reference to Exhibit 10.3 to Avon’s Current Report on Form 8-K filed on May 24, 2010).
10.12* Form of Performance Restricted Stock Unit Award Agreement under the Avon Products, Inc. 2010 Stock Incentive Plan
(incorporated by reference to Exhibit 10.1 to Avon’s Current Report on Form 8-K filed on March 8, 2011).
10.13* Form of Performance Restricted Stock Unit Award Agreement under the Avon Products, Inc. 2010 Stock Incentive Plan
(incorporated by reference to Exhibit 10.21 to Avon’s Annual Report on Form 10-K for the year ended December 31, 2011).
10.14* Form of Retention Restricted Stock Unit Award Agreement under the Avon Products, Inc. 2010 Stock Incentive Plan
(incorporated by reference to Exhibit 10.2 to Avon’s Current Report on Form 8-K filed on March 8, 2011).
10.15* Form of Retention Restricted Stock Unit Award Agreement under the Avon Products, Inc. 2010 Stock Incentive Plan
(incorporated by reference to Exhibit 10.1 to Avon’s Quarterly Report on Form 10-Q for the quarter ended March 31, 2012).
10.16* Form of Restricted Stock Unit Award Agreement under the Avon Products, Inc. 2010 Stock Incentive Plan (incorporated by
reference to Exhibit 10.2 to Avon’s Quarterly Report on Form 10-Q for the quarter ended March 31, 2012).
10.17* Avon Products, Inc. 2013 Stock Incentive Plan (incorporated by reference to Appendix A to Avon’s Proxy Statement as filed on
April 2, 2013).
10.18* Avon Products, Inc. 2013 Stock Incentive Plan, as amended and restated (incorporated by reference to Appendix A to Avon’s
Proxy Statement as filed on March 27, 2015).
10.19* First Amendment to the Avon Products, Inc. 2013 Stock Incentive Plan, as amended and restated, dated March 1, 2016
(incorporated by reference to Exhibit 10.5 to Avon’s Quarterly Report on Form 10-Q for the quarter ended March 31, 2016).
10.20* Form of Restricted Stock Unit Award Agreement under the Avon Products, Inc. 2013 Stock Incentive Plan (incorporated by
reference to Exhibit 10.3 to Avon’s Current Report on Form 8-K filed on May 7, 2013).
10.21* Form of Restricted Stock Unit Award Agreement under the Avon Products, Inc. 2013 Stock Incentive Plan, as amended and restated
(incorporated by reference to Exhibit 10.2 to Avon’s Quarterly Report on Form 10-Q for the quarter ended March 31, 2015).

Exhibit
Number Description
10.22* Form of Retention Restricted Stock Unit Award Agreement under the Avon Products, Inc. 2013 Stock Incentive Plan
(incorporated by reference to Exhibit 10.4 to Avon’s Current Report on Form 8-K filed on May 7, 2013).
10.23* Form of Retention Restricted Stock Unit Award Agreement under the Avon Products, Inc. 2013 Stock Incentive Plan, as
amended and restated (incorporated by reference to Exhibit 10.3 to Avon’s Quarterly Report on Form 10-Q for the quarter
ended March 31, 2015).
10.24* Form of Performance Contingent Restricted Stock Unit Award Agreement under the Avon Products, Inc. 2013 Stock Incentive
Plan (incorporated by reference to Exhibit 10.5 to Avon’s Current Report on Form 8-K filed on May 7, 2013).
10.25* Form of Performance Contingent Restricted Stock Unit Award Agreement under the Avon Products, Inc. 2013 Stock Incentive
Plan, as amended and restated (incorporated by reference to Exhibit 10.4 to Avon’s Quarterly Report on Form 10-Q for the
quarter ended March 31, 2015).
10.26* Form of Stock Option Award Agreement under the Avon Products, Inc. 2013 Stock Incentive Plan, as amended and restated
(incorporated by reference to Exhibit 10.11 to Avon’s Quarterly Report on Form 10-Q for the quarter ended March 31, 2016).
10.27* Avon Products, Inc. 2016 Omnibus Incentive Plan (incorporated by reference to Appendix B to Avon’s Proxy Statement as filed
on April 15, 2016).
10.28* Form of Retention Restricted Stock Unit Award Agreement under the Avon Products, Inc. 2016 Omnibus Incentive Plan
(incorporated by reference to Exhibit 10.2 to Avon’s Current Report on Form 8-K filed on May 26, 2016).
10.29* Form of Restricted Stock Unit Award Agreement under the Avon Products, Inc. 2016 Omnibus Incentive Plan (incorporated by
reference to Exhibit 10.3 to Avon’s Current Report on Form 8-K filed on May 26, 2016).
10.30* Form of Performance Contingent Restricted Stock Unit Award Agreement under the Avon Products, Inc. 2016 Omnibus
Incentive Plan (incorporated by reference to Exhibit 10.4 to Avon’s Current Report on Form 8-K filed on May 26, 2016).
10.31* Form of Stock Option Award Agreement under the Avon Products, Inc. 2016 Omnibus Incentive Plan (incorporated by
reference to Exhibit 10.5 to Avon’s Current Report on Form 8-K filed on May 26, 2016).
10.32* Form of Stock Appreciation Right Certificate Agreement under the Avon Products, Inc. 2016 Omnibus Incentive Plan
(incorporated by reference to Exhibit 10.6 to Avon’s Current Report on Form 8-K filed on May 26, 2016).
10.33* Avon Products, Inc. Deferred Compensation Plan, as amended and restated as of January 1, 2008 (incorporated by reference
to Exhibit 10.20 to Avon’s Annual Report on Form 10-K for the year ended December 31, 2007).
10.34* First Amendment, dated as of December 7, 2010, to the Avon Products, Inc. Deferred Compensation Plan, as amended and
restated as of January 1, 2008 (incorporated by reference to Exhibit 10.22 to Avon’s Annual Report on Form 10-K for the year
ended December 31, 2010).
10.35* Second Amendment, dated March 2, 2011, to the Avon Products, Inc. Deferred Compensation Plan, as amended and restated
as of January 1, 2008 (incorporated by reference to Exhibit 10.4 to Avon’s Quarterly Report on Form 10-Q for the quarter
ended March 31, 2011).
10.36* Third Amendment, dated November 10, 2014, to the Avon Products, Inc. Deferred Compensation Plan, as amended and
restated as of January 1, 2008 (incorporated by reference to Exhibit 10.27 to Avon’s Annual Report on Form 10-K for the year
ended December 31, 2014).
10.37* Fourth Amendment, dated February 29, 2016, to the Avon Products, Inc. Deferred Compensation Plan, as amended and
restated as of January 1, 2008 (incorporated by reference to Exhibit 10.10 to Avon’s Quarterly Report on Form 10-Q for the
quarter ended March 31, 2016).
10.38* Avon Products, Inc. Compensation Plan for Non-Employee Directors, amended and restated as of May 6, 2010 (incorporated
by reference to Exhibit 10.5 to Avon’s Quarterly Report on Form 10-Q for the quarter ended June 30, 2010).
A V O N 2017 63

PART IV
Exhibit
Number Description
10.39* Avon Products, Inc. Compensation Plan for Non-Employee Directors, amended and restated as of January 1, 2013
(incorporated by reference to Exhibit 10.28 to Avon’s Annual Report on Form 10-K/A for the year ended December 31, 2012).
10.40* Avon Products, Inc. Compensation Plan for Non-Employee Directors, amended and restated as of February 8, 2016
(incorporated by reference to Exhibit 10.29 to Avon’s Annual Report on Form 10-K for the year ended December 31, 2015).
10.41* Board of Directors of Avon Products, Inc. Deferred Compensation Plan, amended and restated as of May 6, 2010
(incorporated by reference to Exhibit 10.6 to Avon’s Quarterly Report on Form 10-Q for the quarter ended June 30, 2010).
10.42* Avon Products, Inc. 2013-2017 Executive Incentive Plan (incorporated by reference to Appendix B to Avon’s Proxy Statement
as filed on April 2, 2013).
10.43* First Amendment, dated March 1, 2016, to Avon Products, Inc. 2013-2017 Executive Incentive Plan (incorporated by reference
to Exhibit 10.8 to Avon’s Quarterly Report on Form 10-Q for the quarter ended March 31, 2016).
10.44* Benefit Restoration Pension Plan of Avon Products, Inc., as amended and restated as of January 1, 2009 (incorporated by
reference to Exhibit 10.26 to Avon’s Annual Report on Form 10-K for the year ended December 31, 2008).
10.45* First Amendment, dated as of December 13, 2010, to the Benefit Restoration Pension Plan of Avon Products, Inc., as amended
and restated as of January 1, 2009 (incorporated by reference to Exhibit 10.32 to Avon’s Annual report on Form 10-K for the
year ended December 31, 2011).
10.46* Second Amendment, dated as of September 19, 2012, to the Benefit Restoration Pension Plan of Avon Products, Inc., as
amended and restated as of January 1, 2009 (incorporated by reference to Exhibit 10.3 to Avon’s Quarterly Report on
Form 10-Q for the quarter ended September 30, 2012).
10.47* Third Amendment, dated as of November 10, 2014, to the Benefit Restoration Pension Plan of Avon Products, Inc., as
amended and restated as of January 1, 2009 (incorporated by reference to Exhibit 10.35 to Avon’s Annual Report on
Form 10-K for the year ended December 31, 2014).
10.48* Fourth Amendment, dated February 29, 2016, to the Benefit Restoration Pension Plan of Avon Products, Inc., as amended and
restated as of January 1, 2009 (incorporated by reference to Exhibit 10.9 to Avon’s Quarterly Report on Form 10-Q for the
quarter ended March 31, 2016).
10.49* Avon Products, Inc. Management Incentive Plan, effective as of January 1, 2009 (incorporated by reference to Exhibit 10.50 to
Avon’s Annual Report on Form 10-K for the year ended December 31, 2008).
10.50* Avon Products, Inc. Management Incentive Plan, amended and restated effective as of January 1, 2015.
10.51* Avon Products, Inc. Long-Term Cash Bonus Plan, effective as of January 1, 2015.
10.52* Avon Products, Inc. Compensation Recoupment Policy (incorporated by reference to Exhibit 10.1 to Avon’s Current Report on
Form 8-K filed on March 17, 2010).
10.53* Avon Products, Inc. Amended and Restated Compensation Recoupment Policy, effective as of January 14, 2013 (incorporated
by reference to Exhibit 10.41 to Avon’s Annual Report on Form 10-K/A for the year ended December 31, 2012).
10.54* Avon Products, Inc. Change in Control Policy (incorporated by reference to Exhibit 10.2 to Avon’s Current Report on Form 8-K
filed on March 17, 2010).
10.55* Avon Products, Inc. Amended and Restated Change in Control Policy, dated as of January 9, 2013 (incorporated by reference
to Exhibit 10.43 to Avon’s Annual Report on Form 10-K/A for the year ended December 31, 2012).
10.56* Avon Products, Inc. Long Term Incentive Cash Plan, effective as of January 1, 2011 (incorporated by reference to Exhibit 10.5
to Avon’s Quarterly Report on Form 10-Q for the quarter ended March 31, 2011).
10.57* Avon Products, Inc. International Retirement Plan, amended and restated effective as of January 1, 2009 (incorporated by
reference to Exhibit 10.5 to Avon’s Quarterly Report on Form 10-Q for the quarter ended March 31, 2015).

Exhibit
Number Description
10.58* First Amendment, dated as of December 13, 2010, to the Avon Products, Inc. International Retirement Plan as amended and
restated effective as of January 1, 2009 (incorporated by reference to Exhibit 10.6 to Avon’s Quarterly Report on Form 10-Q
for the quarter ended March 31, 2015).
10.59* Employment Offer Letter Agreement, dated as of February 8, 2012, between Avon Products, Inc. and Fernando Acosta
(incorporated by reference to Exhibit 10.52 to Avon’s Annual Report on Form 10-K for the year ended December 31, 2011).
10.60* Severance Benefit Letter Agreement and General Release of Claims, by and between Avon Products, Inc. and Fernando Acosta,
dated as of August 31, 2017 (incorporated by reference to Exhibit 10.4 to Avon’s Quarterly Report on Form 10-Q for the
quarter ended September 30, 2017).
10.61* Letter Agreement, dated as of April 4, 2012, between the Company and Sheri McCoy (incorporated by reference to
Exhibit 10.1 to Avon’s Current Report on Form 8-K filed on April 10, 2012) as modified by the “CEO stock holding
requirement” adopted on March 13, 2014 (incorporated by reference to Exhibit 10.1 to Avon’s Quarterly Report on
Form 10-Q for the quarter ended March 31, 2014).
10.62* International Assignment Letter Agreement, dated July 20, 2016, between Avon Products, Inc. and Sheri McCoy (incorporated
by reference to Exhibit 10.59 to Avon’s Annual Report on Form 10-K for the year ended December 31, 2016).
10.63* Restricted Stock Unit Award Agreement, dated as of April 23, 2012 between the Company and Sheri McCoy (incorporated by
reference to Exhibit 10.2 to Avon’s Quarterly Report on Form 10-Q for the quarter ended June 30, 2012).
10.64* Letter Agreement, by and between Avon Products, Inc. and Sherilyn McCoy, dated as of August 2, 2017 (incorporated by
reference to Exhibit 10.1 to Avon’s Current Report on Form 8-K filed on August 4, 2017).
10.65* Letter Agreement, dated as of September 13, 2012, between Avon Products, Inc. and John P. Higson (incorporated by
reference to Exhibit 10.8 to Avon’s Quarterly Report on Form 10-Q for the quarter ended March 31, 2015).
10.66* Termination Agreement by and between Avon Products, Inc., Avon Cosmetics GmbH and John Higson, dated as of
September 19, 2017 (incorporated by reference to Exhibit 10.3 to Avon’s Quarterly Report on Form 10-Q for the quarter
ended September 30, 2017).
10.67* Employment Offer Letter Agreement including Forms of Restricted Stock Unit (“RSU”) Award Agreement and Performance
Contingent RSU Award Agreement, dated as of January 23, 2015, between Avon Products, Inc. and James Scully
(incorporated by reference to Exhibit 10.7 to Avon’s Quarterly Report on Form 10-Q for the quarter ended March 31, 2015).
10.68* Severance Benefit Letter Agreement and General Release of Claims, by and between Avon Products, Inc. and James Scully,
dated as of August 12, 2017 (incorporated by reference to Exhibit 10.2 to Avon’s Quarterly Report on Form 10-Q for the
quarter ended September 30, 2017).
10.69* Employment Offer Letter Agreement, dated as of September 10, 2012, between Avon Products, Inc. and Jeff Benjamin
(incorporated by reference to Exhibit 10.13 to Avon’s Quarterly Report on Form 10-Q for the quarter ended March 31, 2016).
10.70* Transition Letter Agreement and General Release of Claims dated as of March 20, 2017, between Avon Products, Inc. and Jeff
Benjamin (incorporated by reference to Exhibit 10.1 to Avon’s Quarterly Report on Form 10-Q for the quarter ended March 31,
2017).
10.71* Employment Offer Letter and Contract of Employment Agreement dated November 28, 2016, between Avon Cosmetics
Limited and James Wilson (incorporated by reference to Exhibit 10.67 to Avon’s Annual Report on Form 10-K for the year
ended December 31, 2016).
10.72 Revolving Credit Agreement, dated as of June 5, 2015, among Avon Products, Inc., Avon International Operations, Inc., the
banks and other lenders party thereto, Citibank, N.A., as Administrative Agent, Collateral Agent and an L/C issuer
(incorporated by reference to Exhibit 10.1 to Avon’s Current Report on Form 8-K filed on June 8, 2015).
A V O N 2017 65

PART IV
Exhibit
Number Description
10.73 First Amendment to Credit Agreement and General Security Agreement (Revolving Credit Agreement), dated as of
December 7, 2015, among Avon Products, Inc., Avon International Operations, Inc., the banks and other lenders party thereto,
Citibank, N.A., as Administrative Agent, Collateral Agent and an L/C issuer (incorporated by reference to Exhibit 10.53 to
Avon’s Annual Report on Form 10-K for the year ended December 31, 2015).
10.74 Second Amendment to Credit Agreement and General Security Agreement and First Amendment to API Limited Recourse
Guaranty, dated August 1, 2016 (incorporated by reference to Exhibit 10.1 to Avon’s Current Report on Form 8-K filed on
August 2, 2016).
10.75 Third Amendment to Credit Agreement, dated December 21, 2017 (incorporated by reference to Exhibit 10.1 to Avon’s
Current Report on Form 8-K filed on December 21, 2017).
10.76 Investment Agreement, dated as of December 17, 2015, between Avon Products, Inc. and Cleveland Apple Investor LLC
(incorporated by reference to Exhibit 10.1 to Avon’s Current Report on Form 8-K filed on December 21, 2015).
10.77 Investor Rights Agreement, dated as of March 1, 2016, between Avon Products, Inc. and Cleveland Apple Investor L.P.
(incorporated by reference to Exhibit 10.1 to Avon’s Current Report on Form 8-K filed on March 7, 2016).
10.78 Intellectual Property License Agreement, dated as of March 1, 2016, among Avon Products, Inc., Avon International
Operations, Inc., Avon NA IP LLC and New Avon LLC (incorporated by reference to Exhibit 10.2 to Avon’s Current Report on
Form 8-K filed on March 7, 2016).
10.79 Agreement, dated as of March 27, 2016, between Avon Products, Inc. and an investor group led by Barington Capital Group,
L.P. (incorporated by reference to Exhibit 10.1 to Avon’s Current Report on Form 8-K filed on March 28, 2016).
21 Subsidiaries of the registrant.
23.1 Consent of PricewaterhouseCoopers LLP (United Kingdom).
23.2 Consent of PricewaterhouseCoopers LLP (United States).
31.1 Certification of Chief Executive Officer pursuant to Section 302 of the Sarbanes-Oxley Act of 2002.
31.2 Certification of Chief Financial Officer pursuant to Section 302 of the Sarbanes-Oxley Act of 2002.
32.1 Certification of Chief Executive Officer Pursuant to 18 U.S.C. Section 1350, As Adopted Pursuant to Section 906 of the
Sarbanes-Oxley Act of 2002.
32.2 Certification of Chief Financial Officer Pursuant to 18 U.S.C. Section 1350, As Adopted Pursuant to Section 906 of the
Sarbanes-Oxley Act of 2002.
101 The following materials formatted in Extensible Business Reporting Language (XBRL): (i) Consolidated Statements of
Operations, (ii) Consolidated Statements of Comprehensive Income (Loss), (iii) Consolidated Balance Sheets, (iv) Consolidated
Statements of Cash Flows, (v) Consolidated Statements of Changes in Shareholders’ Equity (Deficit), (vi) Notes to Consolidated
Financial Statements and (vi) Schedule of Valuation and Qualifying Accounts.
* The Exhibits identified above with an asterisk (*) are management contracts or compensatory plans or arrangements.
Avon’s Annual Report on Form 10-K for the year ended December 31, 2017, at the time of filing with the United States Securities and
Exchange Commission, shall modify and supersede all prior documents filed pursuant to Section 13, 14 or 15(d) of the Securities Exchange
Act of 1934, as amended, for purposes of any offers or sales of any securities after the date of such filing pursuant to any Registration
Statement or Prospectus filed pursuant to the Securities Act of 1933, which incorporates by reference such Annual Report on Form 10-K.
ITEM 16. FORM 10-K SUMMARY
None.

SIGNATURES
Pursuant to the requirements of Section 13 or 15(d) of the Securities Exchange Act of 1934, the registrant has duly caused this report to be
signed on its behalf by the undersigned, thereunto duly authorized, on the 22nd day of February 2018.
Avon Products, Inc.
/s/ Laura Barbrook
Laura Barbrook
Vice President and Corporate Controller – Principal
Accounting Officer
A V O N 2017 67

SIGNATURES
Pursuant to the requirements of the Securities Exchange Act of 1934, this report has been signed below by the following persons on behalf
of the registrant and in the capacities and on the dates indicated.
Signature Title Date
/s/ Jan Zijderveld
Jan Zijderveld Chief Executive Officer – Principal Executive Officer
and Director
February 22, 2018
/s/ James Wilson
James Wilson Executive Vice President and Chief Financial Officer –
Principal Financial Officer
February 22, 2018
/s/ Jose Armario
Jose Armario Director
February 22, 2018
/s/ W. Don Cornwell
W. Don Cornwell Director
February 22, 2018
/s/ Chan W. Galbato
Chan W. Galbato Director
February 22, 2018
/s/ Nancy Killefer
Nancy Killefer Director
February 22, 2018
/s/ Susan J. Kropf
Susan J. Kropf Director
February 22, 2018
/s/ Steven F. Mayer
Steven F. Mayer Director
February 22, 2018
/s/ Helen McCluskey
Helen McCluskey Director
February 22, 2018
/s/ Charles H. Noski
Charles H. Noski Director
February 22, 2018
/s/ Cathy D. Ross
Cathy D. Ross Director
February 22, 2018
/s/ Michael F. Sanford
Michael F. Sanford Director
February 22, 2018

AVON PRODUCTS, INC.
INDEX TO CONSOLIDATED FINANCIAL
STATEMENTS AND SCHEDULE
F-2 – F-3Report of Independent Registered PublicAccounting Firm
Consolidated FinancialStatements:
F-4Consolidated Statements ofOperations for each of the years in thethree-year period ended December 31,2017
F-5Consolidated Statements ofComprehensive Income (Loss) for eachof the years in the three-year periodended December 31, 2017
F-6Consolidated Balance Sheets atDecember 31, 2017 and 2016
F-7Consolidated Statements of CashFlows for each of the years in thethree-year period ended December 31,2017
F-8Consolidated Statements of Changesin Shareholders’ Equity (Deficit) foreach of the years in the three-yearperiod ended December 31, 2017
F-9 – F-55Notes to Consolidated FinancialStatements
Financial StatementSchedule:
F-56Schedule II – Valuation and QualifyingAccounts
A V O N 2017 F-1

REPORT OF INDEPENDENT REGISTERED
PUBLIC ACCOUNTING FIRM
To the Board of Directors and Shareholders of Avon Products, Inc.:
Opinion on the Financial Statements and Internal Control over Financial Reporting
We have audited the accompanying consolidated balance sheet of Avon Products, Inc. and its subsidiaries as of December 31, 2017, and therelated consolidated statements of operations, comprehensive income, changes in shareholders’ equity and cash flows for the year endedDecember 31, 2017, including the related notes and financial statement schedule listed in the accompanying index appearing underItem 15(a)(2) (collectively referred to as the “consolidated financial statements”). We also have audited the Company’s internal control overfinancial reporting as of December 31, 2017, based on criteria established in Internal Control – Integrated Framework (2013) issued by theCommittee of Sponsoring Organizations of the Treadway Commission (COSO).
In our opinion, the consolidated financial statements referred to above present fairly, in all material respects, the financial position of theCompany as of December 31, 2017, and the results of its operations and its cash flows for the year ended December 31, 2017 in conformitywith accounting principles generally accepted in the United States of America. Also in our opinion, the Company maintained, in all materialrespects, effective internal control over financial reporting as of December 31, 2017, based on criteria established in Internal Control –Integrated Framework (2013) issued by the COSO.
Basis for Opinion
The Company’s management is responsible for these consolidated financial statements, for maintaining effective internal control over financialreporting, and for its assessment of the effectiveness of internal control over financial reporting, included in Management’s Report on InternalControl over Financial Reporting. Our responsibility is to express an opinion on the Company’s consolidated financial statements and on theCompany’s internal control over financial reporting based on our audit. We are a public accounting firm registered with the Public CompanyAccounting Oversight Board (United States) (“PCAOB”) and are required to be independent with respect to the Company in accordance withthe U.S. federal securities laws and the applicable rules and regulations of the Securities and Exchange Commission and the PCAOB.
We conducted our audit in accordance with the standards of the PCAOB. Those standards require that we plan and perform the audit toobtain reasonable assurance about whether the consolidated financial statements are free of material misstatement, whether due to error orfraud, and whether effective internal control over financial reporting was maintained in all material respects.
Our audit of the consolidated financial statements included performing procedures to assess the risks of material misstatement of theconsolidated financial statements, whether due to error or fraud, and performing procedures that respond to those risks. Such proceduresincluded examining, on a test basis, evidence regarding the amounts and disclosures in the consolidated financial statements. Our audit alsoincluded evaluating the accounting principles used and significant estimates made by management, as well as evaluating the overallpresentation of the consolidated financial statements. Our audit of internal control over financial reporting included obtaining anunderstanding of internal control over financial reporting, assessing the risk that a material weakness exists, and testing and evaluating thedesign and operating effectiveness of internal control based on the assessed risk. Our audit also included performing such other proceduresas we considered necessary in the circumstances. We believe that our audit provides a reasonable basis for our opinion.
Definition and Limitations of Internal Control over Financial Reporting
A company’s internal control over financial reporting is a process designed to provide reasonable assurance regarding the reliability offinancial reporting and the preparation of financial statements for external purposes in accordance with generally accepted accountingprinciples. A company’s internal control over financial reporting includes those policies and procedures that (i) pertain to the maintenance ofrecords that, in reasonable detail, accurately and fairly reflect the transactions and dispositions of the assets of the company; (ii) providereasonable assurance that transactions are recorded as necessary to permit preparation of financial statements in accordance with generallyaccepted accounting principles, and that receipts and expenditures of the company are being made only in accordance with authorizationsof management and directors of the company; and (iii) provide reasonable assurance regarding prevention or timely detection ofunauthorized acquisition, use, or disposition of the company’s assets that could have a material effect on the financial statements.
Because of its inherent limitations, internal control over financial reporting may not prevent or detect misstatements. Also, projections of anyevaluation of effectiveness to future periods are subject to the risk that controls may become inadequate because of changes in conditions,or that the degree of compliance with the policies or procedures may deteriorate.
/s/ PricewaterhouseCoopers LLPLondon, United KingdomFebruary 22, 2018
PricewaterhouseCoopers LLP (United Kingdom) has served as the Company’s auditor since 2017.

REPORT OF INDEPENDENT REGISTERED
PUBLIC ACCOUNTING FIRM
To the Board of Directors and Shareholders of Avon Products, Inc.:
In our opinion, the consolidated balance sheet as of December 31, 2016 and the related consolidated statements of operations,
comprehensive income, shareholders’ equity and cash flows for each of the two years in the period ended December 31, 2016, present
fairly, in all material respects, the financial position of Avon Products, Inc. and its subsidiaries as of December 31, 2016, and the results of its
operations and its cash flows for each of the two years in the period ended December 31, 2016 in conformity with accounting principles
generally accepted in the United States of America. In addition, in our opinion, the financial statement schedule listed in the index appearing
under Item 15(a)(2) for each of the two years in the period ended December 31, 2016 presents fairly, in all material respects, the information
set forth there in when read in conjunction with the related consolidated financial statements. These financial statements and financial
statement schedule are the responsibility of the Company’s management. Our responsibility is to express an opinion on these financial
statements and financial statement schedule based on our audits. We conducted our audits of these financial statements in accordance with
the standards of the Public Company Accounting Oversight Board (United States). Those standards require that we plan and perform the
audit to obtain reasonable assurance about whether the financial statements are free of material misstatement. An audit includes examining,
on a test basis, evidence supporting the amounts and disclosures in the financial statements, assessing the accounting principles used and
significant estimates made by management, and evaluating the overall financial statement presentation. We believe that our audits provide a
reasonable basis for our opinion.
/s/ PricewaterhouseCoopers LLP
New York, New York
February 22, 2017
A V O N 2017 F-3

AVON PRODUCTS, INC.
CONSOLIDATED STATEMENTS OF OPERATIONS
(In millions, except per share data)
Years ended December 31 2017 2016 2015
Net sales $5,565.1 $5,578.8 $ 6,076.5
Other revenue 150.5 138.9 84.0
Total revenue 5,715.6 5,717.7 6,160.5
Costs, expenses and other:
Cost of sales 2,203.3 2,257.0 2,445.4
Selling, general and administrative expenses 3,239.0 3,138.8 3,543.2
Impairment of goodwill – – 6.9
Operating profit 273.3 321.9 165.0
Interest expense 140.8 136.6 120.5
(Gain) loss on extinguishment of debt – (1.1) 5.5
Interest income (14.8) (15.8) (12.5)
Other expense, net 26.6 171.0 73.7
Gain on sale of business – – (44.9)
Total other expenses 152.6 290.7 142.3
Income from continuing operations, before taxes 120.7 31.2 22.7
Income taxes (100.7) (124.6) (819.2)
Income (loss) from continuing operations, net of tax 20.0 (93.4) (796.5)
Loss from discontinued operations, net of tax – (14.0) (349.1)
Net income (loss) 20.0 (107.4) (1,145.6)
Net loss (income) attributable to noncontrolling interests 2.0 (0.2) (3.3)
Net income (loss) attributable to Avon $ 22.0 $ (107.6) $(1,148.9)
Loss per share:
Basic from continuing operations $ (0.00) $ (0.25) $ (1.81)
Basic from discontinued operations – (0.03) (0.79)
Basic attributable to Avon (0.00) (0.29) (2.60)
Diluted from continuing operations $ (0.00) $ (0.25) $ (1.81)
Diluted from discontinued operations – (0.03) (0.79)
Diluted attributable to Avon (0.00) (0.29) (2.60)
Weighted-average shares outstanding:
Basic 439.7 437.0 435.2
Diluted 439.7 437.0 435.2
The accompanying notes are an integral part of these statements.

AVON PRODUCTS, INC.
CONSOLIDATED STATEMENTS OF COMPREHENSIVE INCOME (LOSS)
(In millions)
Years ended December 31 2017 2016 2015
Net income (loss) $ 20.0 $(107.4) $(1,145.6)
Other comprehensive income (loss):
Foreign currency translation adjustments 82.0 38.6 (275.0)
Change in derivative losses on cash flow hedges, net of taxes of $0.0, $2.7 and $0.0 – 1.3 1.9
Amortization of net actuarial loss and prior service cost, net of taxes of $0.8, $10.9 and
$1.2 15.6 287.3 81.8
Adjustments of net actuarial loss and prior service cost, net of taxes of $2.1, $7.1 and
$3.9 8.9 3.1 40.7
Other comprehensive income related to New Avon investment, net of taxes of $0.0 1.2 2.2 –
Total other comprehensive income (loss), net of taxes 107.7 332.5 (150.6)
Comprehensive income (loss) 127.7 225.1 (1,296.2)
Less: comprehensive loss attributable to noncontrolling interests (1.5) (2.1) (1.6)
Comprehensive income (loss) attributable to Avon $129.2 $ 227.2 $(1,294.6)
The accompanying notes are an integral part of these statements.
A V O N 2017 F-5

AVON PRODUCTS, INC.
CONSOLIDATED BALANCE SHEETS
(In millions, except per share data)
December 31 2017 2016
AssetsCurrent AssetsCash, including cash equivalents of $116.7 and $79.4 $ 881.5 $ 654.4Accounts receivable (less allowances of $138.6 and $131.1) 457.2 458.9Inventories 598.2 586.4Prepaid expenses and other 296.4 291.3Current assets of discontinued operations – 1.3
Total current assets 2,233.3 1,992.3
Property, plant and equipment, at costLand 31.3 29.5Buildings and improvements 646.0 621.5Equipment 804.6 773.1
1,481.9 1,424.1Less accumulated depreciation (779.2) (712.8)
Property, plant and equipment, net 702.7 711.3Goodwill 95.7 93.6Other assets 666.2 621.7
Total assets $ 3,697.9 $ 3,418.9
Liabilities and Shareholders’ DeficitCurrent LiabilitiesDebt maturing within one year $ 25.7 $ 18.1Accounts payable 832.2 768.1Accrued compensation 130.3 129.2Other accrued liabilities 405.6 401.9Sales and taxes other than income 153.0 147.0Income taxes 12.8 10.7Current liabilities of discontinued operations – 10.7
Total current liabilities 1,559.6 1,485.7
Long-term debt 1,872.2 1,875.8Employee benefit plans 150.6 164.5Long-term sales taxes and taxes other than income 193.1 124.5Long-term income taxes 84.9 78.6Other liabilities 84.4 81.3
Total liabilities 3,944.8 3,810.4
Commitments and contingencies (Notes 15 and 18)Series C convertible preferred stock 467.8 444.7
Shareholders’ DeficitCommon stock, par value $.25 – authorized 1,500 shares; issued 758.7 and 754.9 shares 189.7 188.8Additional paid-in capital 2,291.2 2,273.9Retained earnings 2,320.3 2,322.2Accumulated other comprehensive loss (926.2) (1,033.2)Treasury stock, at cost (318.4 and 317.3 shares) (4,600.0) (4,599.7)
Total Avon shareholders’ deficit (725.0) (848.0)
Noncontrolling interests 10.3 11.8
Total shareholders’ deficit (714.7) (836.2)
Total liabilities, series C convertible preferred stock and shareholders’ deficit $ 3,697.9 $ 3,418.9
The accompanying notes are an integral part of these statements.

AVON PRODUCTS, INC.
CONSOLIDATED STATEMENTS OF CASH FLOWS
(In millions)Years ended December 31 2017 2016 2015
Cash Flows from Operating ActivitiesNet income (loss) $ 20.0 $(107.4) $(1,145.6)Loss from discontinued operations, net of tax – 14.0 349.1
Income (loss) from continuing operations, net of tax 20.0 (93.4) (796.5)Adjustments to reconcile net income (loss) to net cash provided by operating activities:
Depreciation 84.3 83.3 94.0Amortization 29.7 30.6 32.1Provision for doubtful accounts 221.9 190.5 144.1Provision for obsolescence 36.7 36.5 45.4Share-based compensation 24.2 24.0 51.2Foreign exchange losses 18.1 6.1 44.3Deferred income taxes (30.2) (8.5) 644.6Charge for Venezuelan monetary assets and liabilities – – (4.2)Charge for Venezuelan non-monetary assets – – 101.7Loss on deconsolidation of Venezuela – 120.5 –Pre-tax gain on sale of business – – (44.9)Impairment of goodwill – – 6.9Other 39.6 (3.3) 11.6
Changes in assets and liabilities:Accounts receivable (214.6) (216.6) (184.7)Inventories (19.2) (28.6) (106.6)Prepaid expenses and other 14.8 16.8 8.7Accounts payable and accrued liabilities 12.3 (17.6) 80.4Income and other taxes 4.1 (4.7) 50.7Noncurrent assets and liabilities 29.5 (7.6) (87.4)
Net cash provided by operating activities of continuing operations 271.2 128.0 91.4
Cash Flows from Investing ActivitiesCapital expenditures (97.3) (93.0) (92.4)Disposal of assets 5.9 13.3 8.2Distribution from New Avon LLC 22.0 – –Net proceeds from sale of business – – 208.3Purchases of investments – – (35.3)Net proceeds from sale of investments – – 53.7Reduction of cash due to Venezuela deconsolidation – (4.5) –Other investing activities (0.2) 1.5 –
Net cash (used) provided by investing activities of continuing operations (69.6) (82.7) 142.5
Cash Flows from Financing ActivitiesCash dividends – – (108.8)Debt, net (maturities of three months or less) 10.3 (36.4) (59.1)Proceeds from debt – 508.7 7.6Repayment of debt (2.9) (733.0) (261.2)Repurchase of common stock (7.2) (5.6) (3.1)Net proceeds from the sale of series C convertible preferred stock – 426.3 –Other financing activities (0.2) (23.0) (5.9)
Net cash provided (used) by financing activities of continuing operations – 137.0 (430.5)
Cash Flows from Discontinued OperationsNet cash (used) provided by operating activities of discontinued operations (8.6) (67.6) 20.7Net cash used by investing activities of discontinued operations – (94.6) (4.2)Net cash used by financing activities of discontinued operations – – (15.0)
Net cash (used) provided by discontinued operations (8.6) (162.2) 1.5
Effect of exchange rate changes on cash and cash equivalents 34.1 (50.4) (80.7)
Net increase (decrease) in cash and cash equivalents 227.1 (30.3) (275.8)Cash and cash equivalents at beginning of year(1) 654.4 684.7 960.5
Cash and cash equivalents at end of year(2) $ 881.5 $ 654.4 $ 684.7
Cash paid for:Interest $ 141.7 $ 142.8 $ 128.6Income taxes, net of refunds received $ 132.2 $ 143.3 $ 162.5
(1) Includes cash and cash equivalents of discontinued operations of $(2.2) and $24.1 at the beginning of the year in 2016 and 2015, respectively.
(2) Includes cash and cash equivalents of discontinued operations of $(2.2) at the end of the year in 2015.
The accompanying notes are an integral part of these statements.
A V O N 2017 F-7

AVON PRODUCTS, INC.
CONSOLIDATED STATEMENTS OF CHANGES
IN SHAREHOLDERS’ EQUITY (DEFICIT)
(In millions, except per share data)
Common Stock AdditionalPaid-InCapital
RetainedEarnings
AccumulatedOther
ComprehensiveLoss
Treasury StockNoncontrolling
Interests TotalShares Amount Shares Amount
Balances at December 31, 2014 750.3 $187.6 $2,207.9 $ 3,702.9 $(1,217.6) 315.6 $(4,591.0) $15.5 $ 305.3Net (loss) income (1,148.9) 3.3 (1,145.6)Other comprehensive loss (148.6) (2.0) (150.6)Dividends – $0.24 per share (105.9) (105.9)Exercise/vesting/expense of share-based
compensation 1.1 0.3 50.7 – – 51.0Repurchase of common stock 0.3 (3.1) (3.1)Purchases and sales of noncontrolling interests,
net of dividends paid of $2.9 (2.9) (2.9)Income tax expense – stock transactions (4.6) (4.6)
Balances at December 31, 2015 751.4 $187.9 $2,254.0 $ 2,448.1 $(1,366.2) 315.9 $(4,594.1) $13.9 $(1,056.4)Net (loss) income (107.6) 0.2 (107.4)Other comprehensive income (loss) 333.0 (0.5) 332.5Dividends accrued – Series C convertible
preferred stock (18.3) (18.3)Exercise/ vesting/ expense of share-based
compensation 3.5 0.9 22.3 – – 23.2Repurchase of common stock 1.4 (5.6) (5.6)Purchases and sales of noncontrolling interests,
net of dividends paid of $1.8 (1.8) (1.8)Income tax expense – stock transactions (2.4) (2.4)
Balances at December 31, 2016 754.9 $188.8 $2,273.9 $ 2,322.2 $(1,033.2) 317.3 $(4,599.7) $11.8 $ (836.2)
Net income 22.0 (2.0) 20.0Other comprehensive income 107.0 0.7 107.7Dividends accrued – Series C convertible
preferred stock (23.1) (23.1)Exercise/ vesting/ expense of share-based
compensation 3.8 1.0 17.3 (0.8) (0.5) 6.8 24.3Repurchase of common stock – (0.1) 1.6 (7.1) (7.2)Purchases and sales of noncontrolling interests,
net of dividends paid of $0.2 (0.2) (0.2)
Balances at December 31, 2017 758.7 $189.7 $2,291.2 $ 2,320.3 $ (926.2) 318.4 $(4,600.0) $10.3 $ (714.7)
The accompanying notes are an integral part of these statements.

AVON PRODUCTS, INC.
NOTES TO CONSOLIDATED FINANCIAL STATEMENTS
(U.S. dollars in millions, except per share and share data)
NOTE 1. Description of the Business and Summary of Significant Accounting Policies
BusinessWhen used in these notes, the terms “Avon,” “Company,” “we,” “our” or “us” mean Avon Products, Inc.
We are a global manufacturer and marketer of beauty and related products. Our business is conducted primarily in one channel, direct
selling. Our reportable segments are based on geographic operations in four regions: Europe, Middle East & Africa; South Latin America;
North Latin America; and Asia Pacific. Our product categories are Beauty and Fashion & Home. Beauty consists of skincare, fragrance and
color (cosmetics). Fashion & Home consists of fashion jewelry, watches, apparel, footwear, accessories, gift and decorative products,
housewares, entertainment and leisure products, children’s products and nutritional products. Sales are made to the ultimate consumer
principally by independent Representatives.
In December 2015, we entered into definitive agreements with affiliates of Cerberus Capital Management L.P. (“Cerberus”), which included
a $435 investment in Avon by an affiliate of Cerberus through the purchase of our convertible preferred stock and the separation of the
North America business (including approximately $100 of cash, subject to certain adjustments) from Avon into New Avon LLC (“New
Avon”), a privately-held company that is majority-owned and managed by an affiliate of Cerberus. These transactions closed in March 2016
and Avon retained approximately 20% ownership in New Avon. The North American business, which represented the Company’s operations
in the United States (“U.S.”), Canada and Puerto Rico, was previously its own reportable segment and has been presented as discontinued
operations for all periods. Refer to Note 3, Discontinued Operations and Divestitures for additional information regarding the investment by
an affiliate of Cerberus and the separation of the North America business. As a result of this transaction, all of our consolidated revenue is
derived from operations of subsidiaries outside of the U.S.
Principles of ConsolidationThe consolidated financial statements include the accounts of Avon and our majority and wholly-owned subsidiaries. Intercompany balances
and transactions are eliminated.
Use of EstimatesWe prepare our consolidated financial statements and related disclosures in conformity with accounting principles generally accepted in the
United States of America, or GAAP. In preparing these statements, we are required to use estimates and assumptions that affect the
reported amounts of assets and liabilities, the disclosure of contingent assets and liabilities at the date of the financial statements and the
reported amounts of revenues and expenses during the reporting period. Actual results could differ materially from those estimates and
assumptions. On an ongoing basis, we review our estimates, including those related to allowances for sales returns, allowances for doubtful
accounts receivable, provisions for inventory obsolescence, the determination of discount rates and other actuarial assumptions for pension
and postretirement benefit expenses, restructuring expense, income taxes and tax valuation allowances, share-based compensation, loss
contingencies and the evaluation of goodwill, property, plant and equipment and capitalized software for potential impairment.
Foreign CurrencyFinancial statements of foreign subsidiaries operating in other than highly inflationary economies are translated at year-end exchange rates
for assets and liabilities and average exchange rates during the year for income and expense accounts. The resulting translation adjustments
are recorded within accumulated other comprehensive income (loss) (“AOCI”). Gains or losses resulting from the impact of changes in
foreign currency rates on assets and liabilities denominated in a currency other than the functional currency are recorded in other expense,
net.
For financial statements of Avon subsidiaries operating in highly inflationary economies, the U.S. dollar is required to be used as the
functional currency. At December 31, 2017, none of our consolidated Avon subsidiaries are considered to be operating in a highly
inflationary economy. Highly inflationary accounting requires monetary assets and liabilities, such as cash, receivables and payables, to be
remeasured into U.S. dollars at the current exchange rate at the end of each period with the impact of any changes in exchange rates being
recorded in income. We record the impact of changes in exchange rates on monetary assets and liabilities in other expense, net. Similarly,
deferred tax assets and liabilities are remeasured into U.S. dollars at the current exchange rates; however, the impact of changes in exchange
rates is recorded in income taxes in our Consolidated Statements of Operations. Non-monetary assets and liabilities, such as inventory,
A V O N 2017 F-9
NOTES TO CONSOLIDATED FINANCIAL STATEMENTS
property, plant and equipment and prepaid expenses are recorded in U.S. dollars at the historical rates at the time of acquisition of such
assets or liabilities.
Venezuela CurrencyCurrency restrictions enacted by the Venezuelan government since 2003 have impacted the ability of Avon Venezuela to obtain foreign
currency to pay for imported products. In 2010, we began accounting for our operations in Venezuela under accounting guidance
associated with highly inflationary economies.
Venezuela’s restrictive foreign exchange control regulations and our Venezuelan operations’ increasingly limited access to U.S. dollars
resulted in lack of exchangeability between the Venezuelan bolivar and the U.S. dollar, and restricted our Venezuelan operations’ ability to
pay dividends and settle intercompany obligations. The severe currency controls imposed by the Venezuelan government significantly limited
our ability to realize the benefits from earnings of our Venezuelan operations and access the resulting liquidity provided by those earnings.
We expected that this lack of exchangeability would continue for the foreseeable future, and as a result, we concluded that, effective
March 31, 2016, this condition was other-than-temporary and we no longer met the accounting criteria of control in order to continue
consolidating our Venezuelan operations. As a result, since March 31, 2016, we have accounted for our Venezuelan operations using the
cost method of accounting.
As a result of the change to the cost method of accounting, in the first quarter of 2016, we recorded a loss of $120.5 in other expense, net.
The loss was comprised of $39.2 in net assets of the Venezuelan business and $81.3 in accumulated foreign currency translation
adjustments within AOCI (shareholders’ deficit) associated with foreign currency changes before Venezuela was accounted for as a highly
inflationary economy. The net assets of the Venezuelan business were comprised of inventories of $23.7, property, plant and equipment, net
of $15.0, other assets of $11.4, accounts receivable of $4.6, cash of $4.5, and accounts payable and accrued liabilities of $20.0. Our
Consolidated Balance Sheets no longer include the assets and liabilities of our Venezuelan operations. We no longer include the results of
our Venezuelan operations in our Consolidated Financial Statements, and will include income relating to our Venezuelan operations only to
the extent that we receive cash for dividends or royalties remitted by Avon Venezuela.
In February 2015, the Venezuelan government announced the creation of a new foreign exchange system referred to as the SIMADI
exchange (“SIMADI”), which represented the rate which better reflected the economics of Avon Venezuela’s business activity, in comparison
to the other then available exchange rates; as such, we concluded that we should utilize the SIMADI exchange rate to remeasure our
Venezuelan operations. As a result of the change to the SIMADI rate, which caused the recognition of a devaluation of approximately 70%
as compared to the exchange rate we had used previously, we recorded an after-tax benefit of $3.4 (a benefit of $4.2 in other expense, net,
and a loss of $.8 in income taxes) in the first quarter of 2015, primarily reflecting the write-down of net monetary assets. In addition, as a
result of using the historical U.S. dollar cost basis of non-monetary assets, such as inventories, these assets continued to be remeasured,
following the change to the SIMADI rate, at the applicable rate at the time of their acquisition. The remeasurement of non-monetary assets
at the historical U.S. dollar cost basis caused a disproportionate expense as these assets were consumed in operations, negatively impacting
operating profit and net income by $18.5 during 2015. Also as a result of the change to the SIMADI rate, we determined that an adjustment
of $11.4 to cost of sales was needed to reflect certain non-monetary assets, primarily inventories, at their net realizable value, which was
recorded in the first quarter of 2015.
In addition, in February 2015, we reviewed Avon Venezuela’s long-lived assets to determine whether the carrying amount of the assets was
recoverable. Based on our expected cash flows associated with the asset group, we determined that the carrying amount of the assets,
carried at their historical U.S. dollar cost basis, was not recoverable. As such, an impairment charge of $90.3 to selling, general and
administrative expenses was needed to reflect the write-down of the long-lived assets to their estimated fair value of $15.7, which was
recorded in the first quarter of 2015. The fair value of Avon Venezuela’s long-lived assets was determined using both market and cost
valuation approaches. The valuation analysis performed required several estimates, including market conditions and inflation rates.
Revenue RecognitionNet sales primarily include sales generated as a result of Representative orders less any discounts, taxes and other deductions. We recognize
revenue upon delivery, when both title and the risks and rewards of ownership pass to the independent Representatives, who are our
customers. Our internal financial systems accumulate revenues as orders are shipped to the Representative. Since we report revenue upon
delivery, revenues recorded in the financial system must be reduced for an estimate of the financial impact of those orders shipped but not
delivered at the end of each reporting period. We use estimates in determining the adjustments to revenue and operating profit for orders

that have been shipped but not delivered as of the end of the period. These estimates are based on daily sales levels, delivery lead times,
gross margin and variable expenses. We also record a provision for estimated sales returns based on historical experience with product
returns. In addition, we estimate an allowance for doubtful accounts on receivable balances based on an analysis of historical data and
current circumstances.
Other RevenueOther revenue is primarily comprised of shipping and handling and order processing fees billed to Representatives, as well as revenue from
the sale of products to New Avon since the separation of the Company’s North America business into New Avon on March 1, 2016, and
ongoing royalties from the licensing of our name and products.
Cash and Cash EquivalentsCash equivalents are stated at cost plus accrued interest, which approximates fair value. Cash equivalents are generally high-quality, short-
term money market instruments with an original maturity of three months or less and consist of time deposits with a number of U.S. and
non-U.S. commercial banks and money market fund investments.
InventoriesInventories are stated at the lower of cost or net realizable value. Cost is determined using the first-in, first-out method. We classify
inventory into various categories based upon its stage in the product life cycle, future marketing sales plans and the disposition process. We
assign a degree of obsolescence risk to products based on this classification to estimate the level of obsolescence provision.
Prepaid Brochure CostsCosts to prepare brochures are initially deferred to prepaid expenses and other and are expensed to selling, general and administrative
expenses over the campaign length. In addition, fees charged to Representatives for brochures are initially deferred and presented as a
reduction to prepaid expenses and other and are recorded as a reduction to selling, general and administrative expenses over the campaign
length. The campaign length is typically three to four weeks.
Brochure costs and associated fees that are presented as prepaid expenses and other were $26.6 at December 31, 2017 and $27.2 at
December 31, 2016. Additionally, paper stock is purchased in advance of creating the brochures. Prepaid expenses and other include paper
supply of $5.6 at December 31, 2017 and $4.3 at December 31, 2016.
Brochure costs expensed to selling, general and administrative expenses amounted to $244.0 in 2017, $244.7 in 2016 and $256.6 in 2015.
The fees charged to Representatives recorded as a reduction to selling, general and administrative expenses amounted to $139.4 in 2017,
$138.6 in 2016 and $141.9 in 2015.
Property, Plant and Equipment and Capitalized SoftwareProperty, plant and equipment are stated at cost and are depreciated using a straight-line method over the estimated useful lives of the
assets. The estimated useful lives generally are as follows: buildings, 45 years; land improvements, 20 years; machinery and equipment,
15 years; and office equipment, five to ten years. Leasehold improvements are depreciated over the shorter of the lease term or the
estimated useful life of the asset. Upon disposal of property, plant and equipment, the cost of the assets and the related accumulated
depreciation are removed from the accounts and the resulting gain or loss is reflected in earnings. Costs associated with repair and
maintenance activities are expensed as incurred.
Certain systems development costs related to the purchase, development and installation of computer software are capitalized and
amortized over the estimated useful life of the related project, generally not to exceed five years. Costs incurred prior to the development
stage, as well as maintenance, training costs, and general and administrative expenses are expensed as incurred. The other assets balance
included unamortized capitalized software costs of $85.2 at December 31, 2017 and $83.9 at December 31, 2016. The amortization
expense associated with capitalized software was $29.5, $30.5 and $31.0 for the years ended December 31, 2017, 2016 and 2015,
respectively.
We evaluate our property, plant and equipment and capitalized software for impairment whenever events or changes in circumstances
indicate that the carrying amount of an asset group may not be recoverable. Recoverability of assets to be held and used is measured by a
comparison of the carrying amount of an asset to estimated pre-tax undiscounted future cash flows expected to be generated by the asset.
A V O N 2017 F-11

NOTES TO CONSOLIDATED FINANCIAL STATEMENTS
If the carrying amount of an asset exceeds its estimated future cash flows, an impairment charge is recognized for the amount by which the
carrying amount of the asset exceeds the fair value of the asset. The fair value of the asset is determined using revenue and cash flow
projections, and royalty and discount rates, as appropriate. See above for more information on Avon Venezuela’s long-lived assets.
GoodwillGoodwill is not amortized and is assessed for impairment annually during the fourth quarter or on the occurrence of an event that indicates
impairment may have occurred, at the reporting unit level. A reporting unit is the operating segment, or a component, which is one level
below that operating segment. Components are aggregated as a single reporting unit if they have similar economic characteristics. When
testing goodwill for impairment, we perform either a qualitative or quantitative assessment for each of our reporting units. Factors
considered in the qualitative analysis include macroeconomic conditions, industry and market considerations, cost factors and overall
financial performance specific to the reporting unit. If the qualitative analysis results in a more likely than not probability of impairment, the
first quantitative step, as described below, is required.
The quantitative test to evaluate goodwill for impairment is a two-step process. In the first step, we compare the fair value of a reporting
unit to its carrying value. If the fair value of a reporting unit is less than its carrying value, we perform a second step to determine the implied
fair value of the reporting unit’s goodwill. The second step of the impairment analysis requires a valuation of a reporting unit’s tangible and
intangible assets and liabilities in a manner similar to the allocation of the purchase price in a business combination. If the resulting implied
fair value of the reporting unit’s goodwill is less than its carrying value, that difference represents an impairment.
The impairment analysis performed for goodwill requires several estimates in computing the estimated fair value of a reporting unit. We
typically use a discounted cash flow (“DCF”) approach to estimate the fair value of a reporting unit, which we believe is the most reliable
indicator of fair value of this business, and is most consistent with the approach that we would generally expect a marketplace participant
would use. In estimating the fair value of our reporting units utilizing a DCF approach, we typically forecast revenue and the resulting cash
flows for periods of five to ten years and include an estimated terminal value at the end of the forecasted period. When determining the
appropriate forecast period for the DCF approach, we consider the amount of time required before the reporting unit achieves what we
consider a normalized, sustainable level of cash flows. The estimation of fair value utilizing a DCF approach includes numerous uncertainties
which require significant judgment when making assumptions of expected growth rates and the selection of discount rates, as well as
assumptions regarding general economic and business conditions, and the structure that would yield the highest economic value, among
other factors.
See Note 19, Goodwill for more information regarding the goodwill impairment in Egypt during 2015.
Financial InstrumentsWe use derivative financial instruments, including forward foreign currency contracts, to manage foreign currency exposures.
If applicable, derivatives are recognized in our Consolidated Balance Sheets at their fair values. When we become a party to a derivative
instrument and intend to apply hedge accounting, we designate the instrument, for financial reporting purposes, as a fair value hedge, a
cash flow hedge, or a net investment hedge. The accounting for changes in fair value (gains or losses) of a derivative instrument depends on
whether we had designated it and it qualified as part of a hedging relationship and further, on the type of hedging relationship. We apply
the following:
• Changes in the fair value of a derivative that is designated as a fair value hedge, along with the loss or gain on the hedged asset or liability
that is attributable to the hedged risk are recorded in earnings.
• Changes in the fair value of a derivative that is designated as a cash flow hedge are recorded in AOCI to the extent effective and
reclassified into earnings in the same period or periods during which the transaction hedged by that derivative also affects earnings.
• Changes in the fair value of a derivative that is designated as a hedge of a net investment in a foreign operation are recorded in foreign
currency translation adjustments within AOCI to the extent effective as a hedge.
• Changes in the fair value of a derivative that is not designated as a hedging instrument are recognized in earnings in other expense, net in
our Consolidated Statements of Operations.
Realized gains and losses on a derivative are reported in our Consolidated Statements of Cash Flows consistent with the nature of the
underlying hedged item.

For derivatives designated as hedges, we assess, both at the hedge’s inception and on an ongoing basis, whether the derivatives that are
used in hedging transactions are highly effective in offsetting changes in fair values or cash flows of hedged items. Highly effective means
that cumulative changes in the fair value of the derivative are between 80% and 125% of the cumulative changes in the fair value of the
hedged item. The ineffective portion of a derivative’s gain or loss, if any, is recorded in earnings in other expense, net in our Consolidated
Statements of Operations. In addition, when we determine that a derivative is not highly effective as a hedge, hedge accounting is
discontinued. When it is probable that a hedged forecasted transaction will not occur, we discontinue hedge accounting for the affected
portion of the forecasted transaction, and reclassify gains or losses that were accumulated in AOCI to earnings in other expense, net in our
Consolidated Statements of Operations.
Deferred Income TaxesDeferred income taxes have been provided on items recognized for financial reporting purposes in different periods than for income tax
purposes using tax rates in effect for the year in which the differences are expected to reverse. A valuation allowance is provided to reduce
our deferred tax assets to an amount that is “more likely than not” to be realized. The ultimate realization of our deferred tax assets
depends upon generating sufficient future taxable income during the periods in which our temporary differences become deductible or
before our net operating loss and tax credit carryforwards expire. See Note 9, Income Taxes for more information.
In accordance with guidance issued by the Financial Accounting Standards Board (“FASB”), on a provisional basis we are choosing to treat
the U.S. income tax consequences of Global Intangible Low-Taxed Income (“GILTI”) as a period cost in future years. As a result, as of
December 31, 2017, no deferred income taxes have been provided. The Company will continue to monitor this election and make a final
determination of the prospective permanent or temporary treatment of GILTI during the one-year measurement period ending on
December 22, 2018 allowed in accordance with Securities and Exchange Commission Staff Accounting Bulletin 118, Income Tax Accounting
Implications of the Tax Cuts and Jobs Act (“SAB 118”).
Uncertain Tax PositionsWe recognize the benefit of a tax position, if that position is more likely than not of being sustained on audit, based on the technical merits
of the position. We record interest expense and penalties payable to relevant tax authorities in income taxes in our Consolidated Statements
of Operations.
Selling, General and Administrative ExpensesSelling, general and administrative expenses include costs associated with selling; marketing; distribution, including shipping and handling
costs; advertising; net brochure costs; research and development; information technology; and other administrative costs, including finance,
legal and human resource functions.
Shipping and HandlingShipping and handling costs are expensed as incurred and amounted to $530.8 in 2017, $489.3 in 2016 and $538.8 in 2015.
AdvertisingAdvertising costs, excluding brochure preparation costs, are expensed as incurred and amounted to $118.4 in 2017, $108.9 in 2016 and
$128.0 in 2015.
Research and DevelopmentResearch and development costs are expensed as incurred and amounted to $52.9 in 2017, $52.1 in 2016 and $61.9 in 2015. Research and
development costs include all costs related to the design and development of new products such as salaries and benefits, supplies and
materials and facilities costs.
Share-based CompensationAll share-based payments to employees are recognized in the financial statements based on their fair value at the date of grant. If applicable,
we use a Monte-Carlo simulation to calculate the fair value of performance restricted stock units with market conditions and the fair value
of premium-priced stock options. We account for forfeitures on share-based payments as they occur.
Restructuring ExpenseWe record the estimated expense for our restructuring initiatives when such costs are deemed probable and estimable, when approved by
the appropriate corporate authority and by accumulating detailed estimates of costs for such plans. These expenses include the estimated
A V O N 2017 F-13
NOTES TO CONSOLIDATED FINANCIAL STATEMENTS
costs of employee severance and related benefits, impairment or accelerated depreciation of property, plant and equipment and capitalized
software, and any other qualifying exit costs. Such costs represent our best estimate, but require assumptions about the programs that may
change over time, including attrition rates. Estimates are evaluated periodically to determine whether an adjustment is required.
Pension and Postretirement ExpensePension and postretirement expense is determined based on a number of actuarial assumptions, which are generally reviewed and
determined on an annual basis. These assumptions include the discount rate applied to plan obligations, the expected rate of return on plan
assets, the rate of compensation increase of plan participants, price inflation, cost-of-living adjustments, mortality rates and certain other
demographic assumptions, and other factors. Actual results that differ from assumptions are accumulated and amortized to expense over
future periods and, therefore, generally affect recognized expense in future periods. We recognize the funded status of pension and other
postretirement benefit plans in our Consolidated Balance Sheets. Each overfunded plan is recognized as an asset and each underfunded plan
is recognized as a liability. The recognition of prior service costs or credits and net actuarial gains or losses, as well as subsequent changes in
the funded status, are recognized as components of AOCI, net of tax, in shareholders’ equity, until they are amortized as a component of
net periodic benefit cost. We recognize prior service costs or credits and actuarial gains and losses beyond a 10% corridor to earnings based
on the estimated future service period of the participants. The determination of the 10% corridor utilizes a calculated value of plan assets for
our more significant plans, whereby gains and losses are smoothed over three- and five-year periods. We use a December 31 measurement
date for all of our employee benefit plans.
ContingenciesWe determine whether to disclose and/or accrue for loss contingencies based on an assessment of whether the risk of loss is remote,
reasonably possible or probable. We record loss contingencies when it is probable that a liability has been incurred and the amount of loss is
reasonably estimable.
Out-of-Period ItemsDuring 2015, we recorded out-of-period adjustments which decreased income from continuing operations by approximately $8 before tax
(approximately $14 after tax). We evaluated the total out-of-period adjustments impacting 2015, both individually and in the aggregate, in
relation to the quarterly and annual periods in which they originated and the annual period in which they were corrected, and concluded
that these adjustments were not material to our consolidated annual financial statements for all impacted periods.
Earnings (Loss) per ShareWe compute earnings (loss) per share (“EPS”) using the two-class method, which is an earnings (loss) allocation formula that determines
earnings (loss) per share for common stock, and earnings (loss) allocated to convertible preferred stock and participating securities, as
appropriate. The earnings allocated to convertible preferred stock are the larger of 1) the preferred dividends accrued in the year or 2) the
percentage of earnings from continuing operations allocable to the preferred stock as if they had been converted to common stock. Our
participating securities are our grants of restricted stock and restricted stock units, which contain non-forfeitable rights to dividend
equivalents to the extent any dividends are declared and paid on our common stock. We compute basic EPS by dividing net income (loss)
allocated to common shareholders by the weighted-average number of shares outstanding during the year. Diluted EPS is calculated to give
effect to all potentially dilutive common shares that were outstanding during the year.

For each of the three years ended December 31 the components of basic and diluted EPS were as follows:
(Shares in millions) 2017 2016 2015
Numerator from continuing operations:Income (loss) from continuing operations less amounts attributable
to noncontrolling interests $ 22.0 $ (93.6) $ (799.8)
Less: Earnings (loss) allocated to participating securities .3 (1.2) (10.9)
Less: Earnings allocated to convertible preferred stock 23.1 18.4 –
Loss from continuing operations allocated to common shareholders (1.4) (110.8) (788.9)
Numerator from discontinued operations:Loss from discontinued operations less amounts attributable to
noncontrolling interests $ – $ (14.0) $ (349.1)
Less: Loss allocated to participating securities – (.2) (4.7)
Loss from discontinued operations allocated to common
shareholders – (13.8) (344.4)
Numerator attributable to Avon:Net income (loss) attributable to Avon less amounts attributable to
noncontrolling interests $ 22.0 $(107.6) $(1,148.9)
Less: Earnings (loss) allocated to participating securities .3 (1.4) (15.7)
Less: Earnings allocated to convertible preferred stock 23.1 18.4 –
Loss attributable to Avon allocated to common shareholders (1.4) (124.6) (1,133.2)
Denominator:Basic EPS weighted-average shares outstanding 439.7 437.0 435.2
Diluted effect of assumed conversion of stock options – – –
Diluted effect of assumed conversion of preferred stock – – –
Diluted EPS adjusted weighted-average shares outstanding 439.7 437.0 435.2
Loss per Common Share from continuing operations:Basic $ (.00) $ (.25) $ (1.81)
Diluted (.00) (.25) (1.81)
Loss per Common Share from discontinued operations:Basic $ .00 $ (.03) $ (.79)
Diluted .00 (.03) (.79)
Loss per Common Share attributable to Avon:Basic $ (.00) $ (.29) $ (2.60)
Diluted (.00) (.29) (2.60)
Amounts in the table above may not necessarily sum due to rounding.
During the years ended December 31, 2017, we did not include stock options to purchase 16.9 million shares of Avon common stock in the
calculation of diluted EPS because the exercise prices of those options were greater than the average market price, and therefore, their
inclusion would be anti-dilutive. During the years ended December 31, 2016 and 2015, we did not include stock options to purchase
14.2 million shares and 12.7 million shares of Avon common stock, respectively, in the calculations of diluted EPS as we had a loss from
continuing operations, net of tax and the inclusion of these shares would decrease the net loss per share. Since the inclusion of such shares
would be anti-dilutive, these are excluded from the calculation.
For the years ended December 31, 2017 and 2016, it is more dilutive to assume the series C convertible preferred stock is not converted into
common stock; therefore, the weighted-average shares outstanding were not adjusted by the as-if converted series C convertible preferred
stock because the effect would be anti-dilutive. The inclusion of the series C convertible preferred stock would increase the net earnings per
A V O N 2017 F-15

NOTES TO CONSOLIDATED FINANCIAL STATEMENTS
share for the year ended December 31, 2017 and decrease the net loss per share for the year ended December 31, 2016. If the as-if
converted series C convertible preferred stock had been dilutive, approximately 87.1 million additional shares would have been included in
the diluted weighted average number of shares outstanding for the years ended December 31, 2017 and 2016. There were no shares of
series C convertible preferred stock outstanding for the year ended December 31, 2015. See Note 17, Series C Convertible Preferred Stock.
NOTE 2. New Accounting Standards
New Accounting Standards ImplementedIn March 2016, the FASB issued Accounting Standards Update (“ASU”) 2016-09, Compensation – Stock Compensation, which is intended
to simplify the accounting for share-based payment transactions. This new guidance changes several aspects of the accounting for share-
based payment transactions, including accounting for income taxes, forfeitures and employer-tax withholding requirements. ASU 2016-09
also clarifies the Statements of Cash Flows presentation for certain components of share-based payment awards. We adopted this new
accounting guidance in the first quarter of 2017, which did not have a material impact on our Consolidated Financial Statements.
Accounting Standards to be Implemented
ASU 2014-09, Revenue from Contracts with CustomersIn May 2014, the FASB issued ASU 2014-09, Revenue from Contracts with Customers, as a new Topic, Accounting Standards Codification
Topic (“ASC”) 606. The core principle of the guidance is that an entity should recognize revenue to depict the transfer of promised goods or
services to customers in an amount that reflects the consideration to which the entity expects to be entitled in exchange for those goods or
services. This new accounting guidance may be adopted either retrospectively or as a cumulative-effect adjustment as of the date of
adoption. We will be adopting this new accounting guidance as a cumulative-effect adjustment to equity as of January 1, 2018. Based on
our evaluation, we expect to:
• consider some of our sales incentive programs as a separate deliverable and allocate a portion of the sales transaction price to this
deliverable, and thus defer a portion of the sales transaction price until the incentive prize is redeemed;
• consider some of our prospective discounts achieved based on sales targets as a separate deliverable and allocate a portion of the sales
transaction prices to this deliverable, thus deferring a portion of the sales transaction price until future discounts are realized;
• adjust the manner in which we present our allowance for sales returns in our Consolidated Balance Sheets, to reflect a refund liability and
a returns asset;
• reflect fees paid by Representatives to the Company for items such as brochures, sales aids and late payments as revenue, rather than as a
reduction to selling, general and administrative expenses (“SG&A”), as these represent separate performance obligations;
• reflect certain of the costs associated with the fees paid by the Representative in cost of sales, rather than SG&A; and
• recharacterize certain costs related to sales incentives, brochures and sales aids in our Consolidated Balance Sheets from prepaid expenses
and other to inventories.
We estimate that the cumulative-effect adjustment upon adoption of the new revenue recognition standard as of January 1, 2018 will be:
• a reduction to equity of approximately $50 to $60 before taxes ($35 to $45 after tax), with a corresponding impact to deferred taxes of
approximately $10 to $20;
• a reduction to prepaid expenses and other of approximately $50 to $60;
• an increase to inventories of approximately $35 to $45; and
• an increase to other accrued liabilities of approximately $35 to $45 due to the net impact of the establishment of a contract liability for
deferred revenue where satisfaction of our performance obligation is not yet complete, which is partially offset by a reduction in the sales
incentive accrual.
This cumulative-effect adjustment impacting our Consolidated Balance Sheets is primarily driven by sales incentives and brochures. The other
changes resulting from the new revenue recognition standard are estimated to not be material.
As a result of adopting this new accounting guidance, we estimate that had we adopted the new standard as of January 1, 2017, the
impact on our full-year 2017 Consolidated Statement of Operations would have been:
• an increase in total revenue by approximately 5%;
• a decrease in gross margin by approximately 300 to 450 basis points; and
• a decrease in operating margin by approximately 10 to 30 basis points.
These impacts are associated with reclassifications of items in our Consolidated Statements of Operations only, which will have no impact on
operating profit. These impacts do not reflect the impact due to the change in timing of recognition of revenue and associated costs that
would be deferred until sales incentive programs and prospective discounts are fulfilled, which we do not believe is material to the estimated
2017 impacts discussed above. If we had adopted the new standard as of January 1, 2017, we believe that the cumulative-effect adjustment
at that time would reasonably approximate the cumulative-effect adjustment calculated as of January 1, 2018 noted above. In addition,
upon adoption, we do not expect the change in timing of recognition of revenue and associated costs to have a significant impact on our
full-year Consolidated Statements of Operations; however, the impact may vary depending on the types of incentive programs, the volume
of incentives offered, and the timing of the programs.
ASU 2017-07, Compensation – Retirement BenefitsIn March 2017, the FASB issued ASU 2017-07, Compensation – Retirement Benefits. This new guidance requires entities to (1) disaggregate
the service cost component from the other components of net periodic benefit costs and present it with other current employee
compensation costs in our Consolidated Statements of Operations and (2) present the other components of net periodic benefit costs below
operating profit in other expense, net. We intend to adopt this new accounting guidance effective January 1, 2018. The new accounting
guidance is applied retrospectively and will increase our operating profit by $7.9 and $2.1, for the years ended December 31, 2017 and
2016, respectively, but will have no impact on net income (loss).
ASU 2016-02, LeasesIn February 2016, the FASB issued ASU 2016-02, Leases, which requires all assets and liabilities arising from leases to be recognized in our
Consolidated Balance Sheets. We intend to adopt this new accounting guidance effective January 1, 2019. While we are still evaluating the
full effect that adopting this new accounting guidance will have on our Consolidated Financial Statements, we believe that it will
significantly increase the assets and liabilities in our Consolidated Balance Sheets.
NOTE 3. Discontinued Operations and Divestitures
Discontinued Operations
North AmericaOn December 17, 2015, the Company entered into definitive agreements with affiliates controlled by Cerberus. The agreements include an
investment agreement providing for a $435.0 investment by Cleveland Apple Investor L.P. (“Cerberus Investor”) (an affiliate of Cerberus) in
the Company through the purchase of perpetual convertible preferred stock (see Note 17, Series C Convertible Preferred Stock) and a
separation and investment agreement providing for the separation of the Company’s North America business, which represented the
Company’s operations in the U.S., Canada and Puerto Rico, from the Company into New Avon, a privately-held company that is majority-
owned and managed by Cerberus NA Investor LLC (“Cerberus NA”) (an affiliate of Cerberus). These transactions closed on March 1, 2016.
Proceeds from the sale of the perpetual convertible preferred stock were used to fund the $100 cash contribution into New Avon,
approximately $250 was used to reduce debt, and the remainder was used for restructuring and reinvestment in the business. The Company
considered that the transactions with affiliates of Cerberus should help to drive enhanced focus on Avon’s international markets, revitalize
the North America business and deliver long-term value to shareholders.
During 2016, Cerberus NA contributed approximately $170 of cash into New Avon in exchange for 80.1% of its ownership interests. The
Company contributed (i) assets primarily related to our North America business (including approximately $100 of cash, subject to certain
adjustments), (ii) certain assumed liabilities (primarily pension and postretirement liabilities) of our North America business and (iii) the
employees of our North America business into New Avon in exchange for a 19.9% ownership interest of New Avon. The Company received
approximately $6 of cash from New Avon as part of a customary working capital adjustment.
The North America business was previously its own reportable segment and has been presented as discontinued operations for all periods
presented as the separation represented a significant strategic shift and was determined to have a major effect on our operations and
financial results.
A V O N 2017 F-17

NOTES TO CONSOLIDATED FINANCIAL STATEMENTS
During the fourth quarter of 2015, the Company recorded an estimated loss on sale of discontinued operations of $340.0 before tax
($340.0 after tax) as the carrying value exceeded the estimated fair value less costs to sell. During 2016, the Company recognized an
additional loss on sale of $15.6 before tax ($5.4 after tax), respectively. The cumulative loss on sale of $355.6 before tax ($345.4 after tax)
represents the net assets contributed into New Avon, including certain pension and postretirement benefit plan liabilities and amounts in
AOCI associated with the North America business, which were primarily unrecognized losses associated with our U.S. defined benefit
pension plan, and costs to sell, as compared to the implied value of our ownership interests in New Avon, at closing, which was $42.5.
In 2016, New Avon entered into a perpetual, irrevocable royalty-free licensing agreement with the Company for the use of the Avon brand
and certain other intellectual property. Also in 2016, Avon and New Avon also entered into a transition services agreement which covers,
among other things, information technology, financial services and human resources, as well as other commercial agreements, including
research and development, product supply and a sublease of office space from Avon to New Avon. See Note 5, Related Party Transactions.
The major classes of financial statement components comprising the loss on discontinued operations, net of tax for North America are
shown below:
Years ended December 31,
2016 2015
Total revenue $135.2 $1,012.5
Cost of sales 53.2 404.0
Selling, general and administrative expenses 91.5 606.2
Operating (loss) income (9.5) 2.3
Other income (expense) items .6 (3.2)
Loss from discontinued operations, before tax (8.9) (.9)
Loss on sale of discontinued operations, before tax (15.6) (340.0)
Income taxes 10.5 (8.2)
Loss from discontinued operations, net of tax $ (14.0) $ (349.1)
There were no amounts recorded in discontinued operations for the year ended December 31, 2017.
Divestitures
Liz EarleOn July 9, 2015, the Company sold Liz Earle Beauty Co. Limited (“Liz Earle”) for approximately $215, less expenses of approximately $5. Liz
Earle was previously reported within our Europe, Middle East & Africa segment. In 2015, we recorded a gain on sale of $44.9 before tax,
which was reported separately in our Consolidated Statements of Operations, and $51.6 after tax, representing the difference between the
proceeds, including the expected working capital settlement, and the carrying value of the Liz Earle business on the date of sale. Proceeds
from the sale of Liz Earle were used to fund a portion of the Company’s redemption of the $250 principal amount of its 2.375% Notes due
March 15, 2016, which occurred on August 10, 2015. See Note 7, Debt and Other Financing for additional information.
NOTE 4. Investment In New Avon
In connection with the separation of the Company’s North America business (as discussed in Note 3, Discontinued Operations and
Divestitures), which closed on March 1, 2016, the Company retained a 19.9% ownership interest in New Avon. The Company has
accounted for its ownership interest in New Avon using the equity method of accounting, which resulted in the Company recognizing its
proportionate share of New Avon’s income or loss and other comprehensive income or loss. Our recorded investment balance in New Avon
at December 31, 2017 was zero.
During the years ended December 31, 2017 and 2016, the Company’s proportionate share of the losses of New Avon was $20.2 and $11.9,
of which $11.5 and $11.9, respectively, of these amounts was recorded within other expense, net. In addition, during the third quarter of
2017, the Company received a cash distribution of $22.0 from New Avon, which reduced our recorded investment balance in New Avon.

During the third quarter of 2017, we recorded only $1.7 of the Company’s proportionate share of the losses in New Avon, as this reduced
our recorded investment balance in New Avon to zero. As a result, we did not record our proportionate share of New Avon’s loss during the
fourth quarter of 2017. If New Avon experiences future losses while our recorded investment balance is zero, we would not record our
proportionate share of such loss. In addition, the Company’s proportionate share of the post-separation other comprehensive income of
New Avon was benefits of $.1 and $2.2 during the years ended December 31, 2017 and 2016, respectively, and was recorded within other
comprehensive income (loss).
The Company also recorded an additional loss of $.5 within other expense, net and a benefit of $1.1 within other comprehensive income
(loss), during the year ended December 31, 2017, primarily associated with purchase accounting adjustments reported by New Avon.
NOTE 5. Related Party Transactions
The following tables present the related party transactions with New Avon and affiliates of Cerberus. There are no other related party
transactions. New Avon is majority owned and managed by Cerberus NA. See Note 3, Discontinued Operations and Note 4, Investment in
New Avon for further details.
Year EndedDecember 31,
Year EndedDecember 31,
2017 2016
Statement of Operations Data
Revenue from sale of product to New Avon(1) $ 32.5 $ 29.2
Gross profit from sale of product to New Avon(1) $ 1.9 $ 2.3
Cost of sales for purchases from New Avon(2) $ 3.8 $ 4.6
Selling, general and administrative expenses:
Transition services, intellectual property,
research and development and subleases(3) $(32.2) $(35.3)
Project management team(4) 2.6 2.7
Net reduction of selling, general and
administrative expenses $(29.6) $(32.6)
December 31,2017
December 31,2016
Balance Sheet Data
Inventories(5) $ .4 $ 1.0
Receivables due from New Avon(6) $ 9.8 $ 11.6
Payables due to New Avon(7) $ .2 $ .7
Payables due to an affiliate of Cerberus(8) $ .4 $ .6
(1) The Company supplies product to New Avon as part of a manufacturing and supply agreement. The Company recorded revenue of $32.5 and $29.2, withinother revenue, and gross profit of $1.9 and $2.3 associated with this agreement during the years ended December 31, 2017 and 2016, respectively.
(2) New Avon also supplies product to the Company as part of the same manufacturing and supply agreement noted above. The Company purchased $3.2 and$5.6 from New Avon associated with this agreement during the years ended December 31, 2017 and 2016, respectively, and recorded $3.8 and $4.6associated with these purchases within cost of sales during the years ended December 31, 2017 and 2016, respectively.
(3) The Company also entered into a transition services agreement to provide certain services to New Avon, as well as an intellectual property (“IP”) licenseagreement, an agreement for technical support and innovation and subleases for office space. In addition, New Avon performed certain services for theCompany under a similar transition services agreement which expired during the third quarter of 2017. The Company recorded a net $32.2 and$35.3 reduction of selling, general and administrative expenses associated with these agreements during the years ended December 31, 2017 and 2016,respectively, which generally represents a recovery of the related costs.
(4) The Company also entered into agreements with an affiliate of Cerberus, which provide for the secondment of Cerberus affiliate personnel to theCompany’s project management team responsible for assisting with the execution of the transformation plan (the “Transformation Plan”) announced inJanuary 2016. The Company recorded $2.6 and $2.7 in selling, general and administrative expenses associated with these agreements during the years endedDecember 31, 2017 and 2016, respectively. See Note 16, Restructuring Initiatives for additional information related to the Transformation Plan.
A V O N 2017 F-19

NOTES TO CONSOLIDATED FINANCIAL STATEMENTS
(5) Inventories relate to purchases from New Avon, associated with the manufacturing and supply agreement, which have not yet been sold, and were classifiedwithin inventories in our Consolidated Balance Sheets.
(6) The receivables due from New Avon relate to the agreements for transition services, the IP license, research and development and subleases for office space,as well as the manufacturing and supply agreement, and were classified within prepaid expenses and other in our Consolidated Balance Sheets.
(7) The payables due to New Avon relate to the manufacturing and supply agreement, and were classified within other accrued liabilities in our ConsolidatedBalance Sheets.
(8) The payables due to an affiliate of Cerberus relate to the agreement for the project management team, and were classified within other accrued liabilities inour Consolidated Balance Sheets.
In addition, the Company also issued standby letters of credit to the lessors of certain equipment, a lease for which was transferred to New
Avon in connection with the separation of the Company’s North America business. The initial liability for the estimated value of such
standby letters of credit was $2.1, which was included in the additional loss on sale of the North America business recognized in loss from
discontinued operations, net of tax in our Consolidated Statements of Operations during the year ended December 31, 2016. At
December 31, 2017 and 2016, the Company has a liability of $1.4 and $1.6, respectively, for the estimated value of such standby letters of
credit. The reduction of this estimated liability of $.2 and $.5 was recognized in other expense, net in our Consolidated Statements of
Operations during the years ended December 31, 2017 and 2016, respectively.
See Note 17, Series C Convertible Preferred Stock, for discussion of preferred shares issued to Cerberus Investor.
NOTE 6. Inventories
Inventories at December 31 consisted of the following:
2017 2016
Raw materials $190.6 $179.3
Finished goods 407.6 407.1
Total $598.2 $586.4
NOTE 7. Debt and Other Financing
DebtDebt at December 31 consisted of the following:
2017 2016
Debt maturing within one year:
Notes payable $ 22.6 $ 13.5
Current portion of long-term debt 3.1 4.6
Total $ 25.7 $ 18.1
Long-term debt:
6.50% Notes, due March 2019 $ 237.2 $ 236.8
4.60% Notes, due March 2020 408.8 408.2
7.875% Senior Secured Notes, due August 2022 492.6 491.0
5.00% Notes, due March 2023 484.5 483.7
Other debt, payable through 2025 with interest from
.5% to 11.3% 5.2 9.0
6.95% Notes, due March 2043 241.0 240.8
Total 1,869.3 1,869.5
Unamortized deferred gain – swap terminations 6.0 10.9
Less current portion (3.1) (4.6)
Total long-term debt $1,872.2 $1,875.8

Notes payable included short-term borrowings of international subsidiaries at average annual interest rates of approximately 23.0% at
December 31, 2017 and 11.0% at December 31, 2016.
Other debt included obligations under capital leases of $4.0 at December 31, 2017 and $7.6 at December 31, 2016, which primarily relate
to leases of automobiles and equipment.
Public NotesIn March 2013, we issued, in a public offering, $250.0 principal amount of 2.375% Notes due March 15, 2016 (the “2.375% Notes”),
$500.0 principal amount of 4.60% Notes due March 15, 2020 (the “4.60% Notes”), $500.0 principal amount of 5.00% Notes due
March 15, 2023 (the “5.00% Notes”) and $250.0 principal amount of 6.95% Notes due March 15, 2043 (the “6.95% Notes”) (collectively,
the “2013 Notes”). In March 2008, we issued $350.0 principal amount of 6.50% Notes due March 1, 2019 (the “6.50% Notes”). Interest
on the 2013 Notes is payable semi-annually on March 15 and September 15 of each year, and interest on the 6.50% Notes is payable semi-
annually on March 1 and September 1 of each year.
In August 2015, we prepaid the entire principal amount of our 2.375% Notes plus accrued interest of $3.1 and a make-whole premium of
$5.0. In connection with the prepayment of our 2.375% Notes, we incurred a loss on extinguishment of debt of $5.5 before tax in the third
quarter of 2015 consisting of the $5.0 make-whole premium for the 2.375% Notes and the write-off of $.5 of debt issuance costs and
discounts related to the initial issuance of the 2.375% Notes.
The indenture governing the 2013 Notes contains interest rate adjustment provisions depending on the long-term credit ratings assigned to
the 2013 Notes with S&P and Moody’s. As described in the indenture, the interest rates on the 2013 Notes increase by .25% for each
one-notch downgrade below investment grade on each of our long-term credit ratings assigned to the 2013 Notes by S&P or Moody’s.
These adjustments are limited to a total increase of 2% above the respective interest rates in effect on the date of issuance of the 2013
Notes. As a result of the long-term credit rating downgrades by S&P and Moody’s since issuance of the 2013 Notes, the interest rates on
these notes have increased by the maximum allowable increase.
In August 2016, we completed cash tender offers which resulted in a reduction of principal of $108.6 of our 5.75% Notes due March 1,
2018 (the “5.75% Notes”), $73.8 of our 4.20% Notes due July 15, 2018 (the “4.20% Notes”), $68.1 of our 6.50% Notes and $50.1 of our
4.60% Notes. In connection with the cash tender offers, we incurred a gain on extinguishment of debt of $3.9 before tax in the third
quarter of 2016, consisting of a deferred gain of $12.8 associated with the March 2012 and January 2013 interest-rate swap agreement
terminations (see Note 10, Financial Instruments and Risk Management), partially offset by the $5.8 of early tender premium paid for the
cash tender offers, $1.2 of a deferred loss associated with treasury lock agreements designated as cash flow hedges of the anticipated
interest payments on the 5.75% Notes (see Note 10, Financial Instruments and Risk Management), $1.0 of deal costs and the write-off of
$.9 of debt issuance costs and discounts related to the initial issuances of the notes that were the subject of the cash tender offers.
In October 2016, we repurchased $44.0 of our 6.50% Notes, $44.0 of our 4.20% Notes, $40.0 of our 4.60% Notes and $35.2 of our
5.75% Notes. The aggregate repurchase price was equal to the principal amount of the notes, plus a premium of $6.2 and accrued interest
of $1.1. In connection with these repurchases of debt, we incurred a loss on extinguishment of debt of $1.0 before tax in the fourth quarter
of 2016 consisting of the $6.2 premium paid for the repurchases, $.5 for the write-off of debt issuance costs and discounts related to the
initial issuance of the notes that were repurchased and $.4 for a deferred loss associated with treasury lock agreements designated as cash
flow hedges of the anticipated interest payments on the 5.75% Notes (see Note 10, Financial Instruments and Risk Management), partially
offset by a deferred gain of approximately $6.1 associated with the March 2012 and January 2013 interest-rate swap agreement
terminations (see Note 10, Financial Instruments and Risk Management).
On November 30, 2016, we prepaid the remaining principal amount of our 4.20% Notes and 5.75% Notes. The prepayment price was
equal to the remaining principal amount of $132.2 for our 4.20% Notes and $106.2 for our 5.75% Notes, plus a make-whole premium of
$12.1 for both series of notes and accrued interest of $3.6 for both series of notes. In connection with the prepayment of our 4.20% Notes
and 5.75% Notes, we incurred a loss on extinguishment of debt of $2.9 before tax in the fourth quarter of 2016 consisting of the $12.1
make-whole premium, $1.0 of a deferred loss associated with treasury lock agreements designated as cash flow hedges of the anticipated
interest payments on the 5.75% Notes (see Note 10, Financial Instruments and Risk Management) and the write-off of $.3 of debt issuance
costs and discounts related to the initial issuances of the notes that were prepaid, partially offset by a deferred gain of $10.5 associated with
the January 2013 interest-rate swap agreement termination (see Note 10, Financial Instruments and Risk Management).
A V O N 2017 F-21
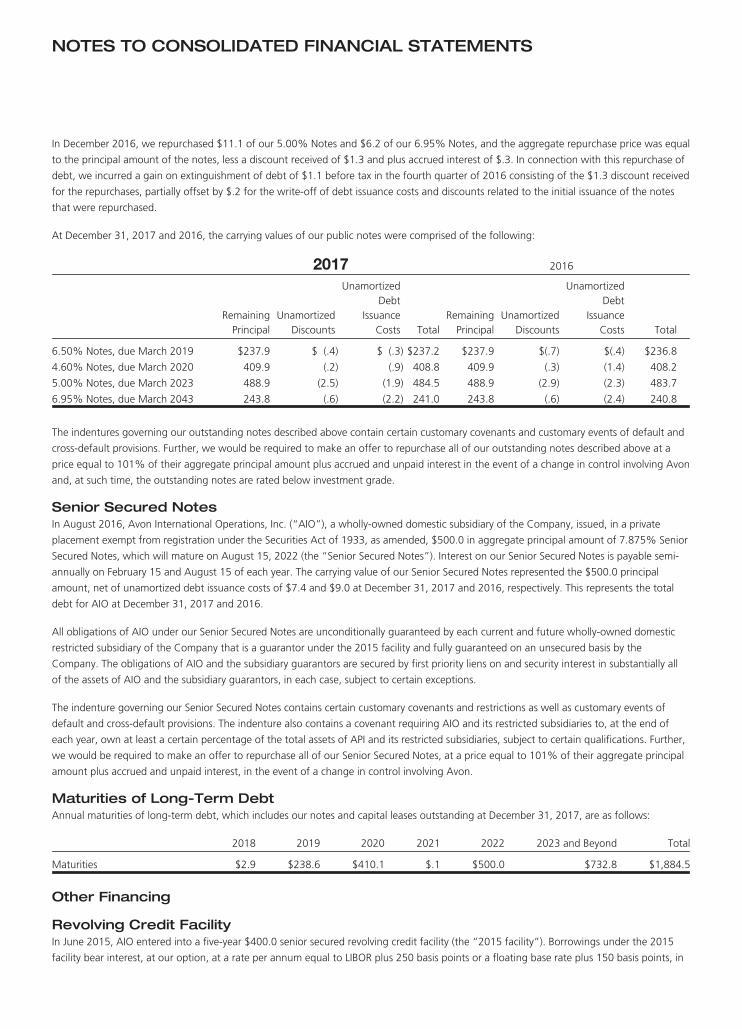
NOTES TO CONSOLIDATED FINANCIAL STATEMENTS
In December 2016, we repurchased $11.1 of our 5.00% Notes and $6.2 of our 6.95% Notes, and the aggregate repurchase price was equal
to the principal amount of the notes, less a discount received of $1.3 and plus accrued interest of $.3. In connection with this repurchase of
debt, we incurred a gain on extinguishment of debt of $1.1 before tax in the fourth quarter of 2016 consisting of the $1.3 discount received
for the repurchases, partially offset by $.2 for the write-off of debt issuance costs and discounts related to the initial issuance of the notes
that were repurchased.
At December 31, 2017 and 2016, the carrying values of our public notes were comprised of the following:
2017 2016
RemainingPrincipal
UnamortizedDiscounts
UnamortizedDebt
IssuanceCosts Total
RemainingPrincipal
UnamortizedDiscounts
UnamortizedDebt
IssuanceCosts Total
6.50% Notes, due March 2019 $237.9 $ (.4) $ (.3) $237.2 $237.9 $(.7) $(.4) $236.8
4.60% Notes, due March 2020 409.9 (.2) (.9) 408.8 409.9 (.3) (1.4) 408.2
5.00% Notes, due March 2023 488.9 (2.5) (1.9) 484.5 488.9 (2.9) (2.3) 483.7
6.95% Notes, due March 2043 243.8 (.6) (2.2) 241.0 243.8 (.6) (2.4) 240.8
The indentures governing our outstanding notes described above contain certain customary covenants and customary events of default and
cross-default provisions. Further, we would be required to make an offer to repurchase all of our outstanding notes described above at a
price equal to 101% of their aggregate principal amount plus accrued and unpaid interest in the event of a change in control involving Avon
and, at such time, the outstanding notes are rated below investment grade.
Senior Secured NotesIn August 2016, Avon International Operations, Inc. (“AIO”), a wholly-owned domestic subsidiary of the Company, issued, in a private
placement exempt from registration under the Securities Act of 1933, as amended, $500.0 in aggregate principal amount of 7.875% Senior
Secured Notes, which will mature on August 15, 2022 (the “Senior Secured Notes”). Interest on our Senior Secured Notes is payable semi-
annually on February 15 and August 15 of each year. The carrying value of our Senior Secured Notes represented the $500.0 principal
amount, net of unamortized debt issuance costs of $7.4 and $9.0 at December 31, 2017 and 2016, respectively. This represents the total
debt for AIO at December 31, 2017 and 2016.
All obligations of AIO under our Senior Secured Notes are unconditionally guaranteed by each current and future wholly-owned domestic
restricted subsidiary of the Company that is a guarantor under the 2015 facility and fully guaranteed on an unsecured basis by the
Company. The obligations of AIO and the subsidiary guarantors are secured by first priority liens on and security interest in substantially all
of the assets of AIO and the subsidiary guarantors, in each case, subject to certain exceptions.
The indenture governing our Senior Secured Notes contains certain customary covenants and restrictions as well as customary events of
default and cross-default provisions. The indenture also contains a covenant requiring AIO and its restricted subsidiaries to, at the end of
each year, own at least a certain percentage of the total assets of API and its restricted subsidiaries, subject to certain qualifications. Further,
we would be required to make an offer to repurchase all of our Senior Secured Notes, at a price equal to 101% of their aggregate principal
amount plus accrued and unpaid interest, in the event of a change in control involving Avon.
Maturities of Long-Term DebtAnnual maturities of long-term debt, which includes our notes and capital leases outstanding at December 31, 2017, are as follows:
2018 2019 2020 2021 2022 2023 and Beyond Total
Maturities $2.9 $238.6 $410.1 $.1 $500.0 $732.8 $1,884.5
Other Financing
Revolving Credit FacilityIn June 2015, AIO entered into a five-year $400.0 senior secured revolving credit facility (the “2015 facility”). Borrowings under the 2015
facility bear interest, at our option, at a rate per annum equal to LIBOR plus 250 basis points or a floating base rate plus 150 basis points, in

each case subject to adjustment based upon a leverage-based pricing grid. In December 2017, AIO entered into an amendment to the 2015
facility, which, among other things, modified the financial covenants (interest coverage and total leverage ratios) to provide the Company
additional flexibility.
The 2015 facility may be used for general corporate purposes. As of December 31, 2017, there were no amounts outstanding under the
2015 facility. The 2015 facility replaced the Company’s previous $1 billion unsecured revolving credit facility (the “2013 facility”). In the
second quarter of 2015, $2.5 before tax was recorded for the write-off of issuance costs related to the 2013 facility.
All obligations of AIO under the 2015 facility are (i) unconditionally guaranteed by each material domestic restricted subsidiary of the
Company (other than AIO, the borrower), in each case, subject to certain exceptions and (ii) fully guaranteed on an unsecured basis by the
Company. The obligations of AIO and the subsidiary guarantors are secured by first priority liens on and security interest in substantially all
of the assets of AIO and the subsidiary guarantors, in each case, subject to certain exceptions.
The 2015 facility will terminate in June 2020; provided, however, that it shall terminate on the 91st day prior to the maturity of the 6.50%
Notes (as defined above) and the 4.60% Notes (as defined above), if on such 91st day, the applicable notes are not redeemed, repaid,
discharged, defeased or otherwise refinanced in full.
The 2015 facility contains affirmative and negative covenants, which are customary for secured financings of this type, as well as financial
covenants (interest coverage and total leverage ratios). As of December 31, 2017, we were in compliance with our interest coverage and
total leverage ratios under the 2015 facility, as amended. The amount of the facility available to be drawn down on is reduced by any
standby letters of credit granted by AIO, which, as of December 31, 2017, was approximately $38. As of December 31, 2017, based on then
applicable interest rates, the entire amount of the remaining 2015 facility, which is approximately $362, could have been drawn down
without violating any covenant.
Letters of CreditAt December 31, 2017 and December 31, 2016, we also had letters of credit outstanding totaling $37.7 and $45.9, respectively. The
balances at December 31, 2017 and 2016 primarily relate to letters of credit issued to lessors of certain equipment, a lease for which was
transferred to New Avon in connection with the separation of the Company’s North America business. The balances at December 31, 2017
and December 31, 2016 also include letters of credit which guarantee various insurance activities.
Long-Term Credit RatingsOur long-term credit ratings are: Moody’s ratings of Stable Outlook with B1 for corporate family debt, B3 for senior unsecured debt, and
Ba1 for our Senior Secured Notes; S&P ratings of Stable Outlook with B for corporate family debt and senior unsecured debt and BB- for our
Senior Secured Notes; and Fitch rating of Negative Outlook with B+, each of which are below investment grade. We do not believe these
long-term credit ratings will have a material impact on our near-term liquidity. However, any rating agency reviews could result in a change
in outlook or downgrade, which could further limit our access to new financing, particularly short-term financing, reduce our flexibility with
respect to working capital needs, affect the market price of some or all of our outstanding debt securities, and likely result in an increase in
financing costs, and less favorable covenants and financial terms under our financing arrangements.
A V O N 2017 F-23
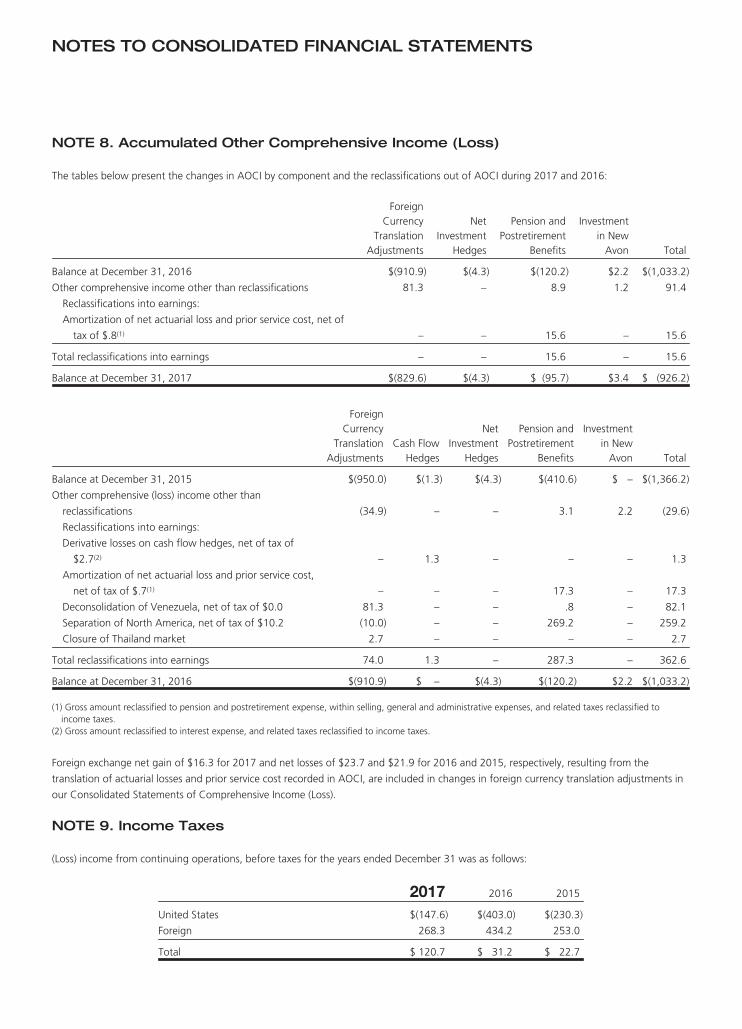
NOTES TO CONSOLIDATED FINANCIAL STATEMENTS
NOTE 8. Accumulated Other Comprehensive Income (Loss)
The tables below present the changes in AOCI by component and the reclassifications out of AOCI during 2017 and 2016:
ForeignCurrency
TranslationAdjustments
NetInvestment
Hedges
Pension andPostretirement
Benefits
Investmentin New
Avon Total
Balance at December 31, 2016 $(910.9) $(4.3) $(120.2) $2.2 $(1,033.2)
Other comprehensive income other than reclassifications 81.3 – 8.9 1.2 91.4
Reclassifications into earnings:
Amortization of net actuarial loss and prior service cost, net of
tax of $.8(1) – – 15.6 – 15.6
Total reclassifications into earnings – – 15.6 – 15.6
Balance at December 31, 2017 $(829.6) $(4.3) $ (95.7) $3.4 $ (926.2)
ForeignCurrency
TranslationAdjustments
Cash FlowHedges
NetInvestment
Hedges
Pension andPostretirement
Benefits
Investmentin New
Avon Total
Balance at December 31, 2015 $(950.0) $(1.3) $(4.3) $(410.6) $ – $(1,366.2)
Other comprehensive (loss) income other than
reclassifications (34.9) – – 3.1 2.2 (29.6)
Reclassifications into earnings:
Derivative losses on cash flow hedges, net of tax of
$2.7(2) – 1.3 – – – 1.3
Amortization of net actuarial loss and prior service cost,
net of tax of $.7(1) – – – 17.3 – 17.3
Deconsolidation of Venezuela, net of tax of $0.0 81.3 – – .8 – 82.1
Separation of North America, net of tax of $10.2 (10.0) – – 269.2 – 259.2
Closure of Thailand market 2.7 – – – – 2.7
Total reclassifications into earnings 74.0 1.3 – 287.3 – 362.6
Balance at December 31, 2016 $(910.9) $ – $(4.3) $(120.2) $2.2 $(1,033.2)
(1) Gross amount reclassified to pension and postretirement expense, within selling, general and administrative expenses, and related taxes reclassified toincome taxes.
(2) Gross amount reclassified to interest expense, and related taxes reclassified to income taxes.
Foreign exchange net gain of $16.3 for 2017 and net losses of $23.7 and $21.9 for 2016 and 2015, respectively, resulting from the
translation of actuarial losses and prior service cost recorded in AOCI, are included in changes in foreign currency translation adjustments in
our Consolidated Statements of Comprehensive Income (Loss).
NOTE 9. Income Taxes
(Loss) income from continuing operations, before taxes for the years ended December 31 was as follows:
2017 2016 2015
United States $(147.6) $(403.0) $(230.3)
Foreign 268.3 434.2 253.0
Total $ 120.7 $ 31.2 $ 22.7

The provision for income taxes for the years ended December 31 was as follows:
2017 2016 2015
Federal:
Current $ – $ – $ –
Deferred (34.0) – 668.3
Total Federal (34.0) – 668.3
Foreign:
Current 130.6 128.5 173.9
Deferred 3.8 (4.2) (24.3)
Total Foreign 134.4 124.3 149.6
State and Local:
Current .3 .3 .7
Deferred – – .6
Total State and other .3 .3 1.3
Total $100.7 $124.6 $819.2
The effective tax rate for the years ended December 31 was as follows:
2017 2016 2015
Statutory federal rate 35.0% 35.0% 35.0%
State and local taxes, net of federal tax benefit .2 .6 2.5
Tax on foreign income 6.0 (24.4) 141.4
Tax on uncertain tax positions (3.6) 34.1 8.2
Venezuela deconsolidation, devaluation and
highly inflationary accounting – 23.9 168.1
Reorganizations – (93.6) (173.5)
U.S. Tax Reform (24.7) – –
Net change in valuation allowances 62.4 375.1 3,395.6
Imputed royalties and associated non-deductible
expenses 9.5 50.3 41.2
Research credits (1.3) (5.4) (8.9)
Other (.1) 3.8 (.8)
Effective tax rate 83.4% 399.4% 3,608.8%
As a result of the enactment of the Tax Cuts and Jobs Act in the U.S., the Company recognized a net income tax benefit of $29.9 associated
with the following items which are reflected in the “U.S. Tax Reform” line above: $33.5 for a valuation allowance release associated with
minimum tax credits which can be utilized and/or refunded in the future and $3.6 for an uncertain tax position for potential withholding
taxes on the repatriation of unremitted earnings. In addition, there was no impact on our financial position or results associated with each of
the following: a write-off of deferred tax assets due to the rate change from 35% to 21% and their associated valuation allowance of
$161.4; a reversal of deferred tax liabilities and recording of a valuation allowance of $66.7 associated with unremitted earnings;
establishment of deferred tax assets for other miscellaneous withholding tax items and their associated valuation allowance of $5.5; and a
one-time tax on offshore earnings and the associated utilization of foreign tax credits of $2.9.
Included in the net change in valuation allowance above, we released valuation allowances of $25.5 associated with a number of markets in
Europe, Middle East & Africa as a result of a business model change related to the move of the Company’s headquarters from the U.S. to
the UK.
A V O N 2017 F-25

NOTES TO CONSOLIDATED FINANCIAL STATEMENTS
In the fourth quarter of 2015, the Company recognized a benefit of $18.7 associated with the initial stages of implementation of foreign tax
planning strategies which is reflected within the “Reorganizations” line above. We completed the implementation of these tax planning
strategies and recognized an additional benefit of $29.3 in the first quarter of 2016.
Deferred tax assets (liabilities) resulting from temporary differences in the recognition of income and expense for tax and financial reporting
purposes at December 31 consisted of the following:
2017 2016
Deferred tax assets:
Tax loss and deduction carryforwards $ 2,022.1 $ 2,033.0
Tax credit carryforwards 981.0 874.0
All other future deductions 471.0 744.0
Valuation allowance (3,217.7) (3,296.0)
Total deferred tax assets 256.4 355.0
Deferred tax liabilities $ (74.9) $ (215.1)
Net deferred tax assets $ 181.5 $ 139.9
Deferred tax assets (liabilities) at December 31 were classified as follows:
2017 2016
Deferred tax assets:
Other assets $203.8 $162.1
Total deferred tax assets 203.8 162.1
Deferred tax liabilities:
Long-term income taxes $ (22.3) $ (22.2)
Total deferred tax liabilities (22.3) (22.2)
Net deferred tax assets $181.5 $139.9
At December 31, 2017, we had recognized deferred tax assets of $981.0 relating to tax credit carryforwards (U.S. foreign tax credits,
minimum tax credits, research and experimentation credits and other tax credits) for which a valuation allowance of $946.7 has been
provided. The tax credit carryforwards consist of U.S. foreign tax credits of $912.6 which are subject to expiration between 2018 and 2027;
U.S. minimum tax credits of $35.9 which are not subject to expiration; U.S. research and experimentation credits of $19.6 which are subject
to expiration between 2027 and 2037 and other tax credits of $12.9 which are subject to expiration between 2018 and 2032.
At December 31, 2017, we had recognized deferred tax assets of $2,022.1 relating to foreign and state tax loss carryforwards for which a
valuation allowance of $1,961.5 has been provided. The deferred tax assets relating to tax loss carryforwards consist of $1,922.2 of foreign
tax loss carryforwards, for which a valuation allowance of $1,861.6 has been provided, and $99.9 of state tax loss carryforwards, for which
a valuation allowance of $99.9 has been provided.
The foreign tax loss carryforwards at December 31, 2017 were $7,448.4, of which $7,060.4 are not subject to expiration and $388.0 are
subject to expiration between 2018 and 2034. The state tax loss carryforwards at December 31, 2017, after taking into consideration the
estimated effects of pre-apportionment states, were $1,512.4 which are subject to expiration between 2018 and 2037.
At December 31, 2017, as a result of our U.S. liquidity profile, we continue to assert that our foreign earnings are not indefinitely reinvested.
Accordingly, we adjusted our deferred tax liability to account for our 2017 undistributed earnings of foreign subsidiaries and for the tax
effect of earnings that were actually repatriated to the U.S. during the year. The net impact on the deferred tax liability associated with the
Company’s undistributed earnings is a decrease of $64.4, resulting in a deferred tax liability balance of $22.6 related to the incremental tax
cost on approximately $1.5 billion of undistributed foreign earnings at December 31, 2017. The $64.4 decrease was primarily a result of the
enactment of the Tax Cuts and Jobs Act in the U.S.

At December 31, 2017, the valuation allowance primarily represents amounts for substantially all U.S. deferred tax assets, certain foreign tax
loss carryforwards and certain other foreign deferred tax assets. The recognition of deferred tax assets was based on the evaluation of
current and estimated future profitability of the operations, reversal of deferred tax liabilities and the likelihood of utilizing tax credit and/or
loss carryforwards. Tax planning strategies were also considered and evaluated as support for the realization of deferred tax assets. Where
these sources of income existed along with sufficient positive evidence that indicated it was more likely than not that such sources of income
could be relied upon, then the deferred tax assets were not reduced by a valuation allowance.
Following a valuation allowance recorded in 2014 to reduce our U.S. deferred tax assets to an amount that is “more likely than not” to be
realized, during 2015, the Company recorded an additional valuation allowance for the remaining U.S. deferred tax assets of $669.7. The
increase in the valuation allowance resulted from management’s determination that it was no longer more likely than not to realize the tax
benefits expected to be obtained from tax planning strategies associated with an anticipated accelerated receipt in the U.S. of foreign source
income. As the U.S. dollar had further strengthened against currencies of some of our key markets during 2015, the benefits associated with
the Company’s tax planning strategies were no longer sufficient for the Company to continue to conclude that its tax planning strategies
were prudent. In the absence of any alternative prudent tax planning strategies and other sources of future taxable income, it was
determined that a full valuation allowance should be recorded. Although the Company continues to expect that it will generate taxable
income from intercompany transactions and consequently, tax liability in the U.S., the Company is expected to offset its current and future
tax liability with foreign tax credits, and as a result, the expected level of future taxable income and tax liability is not adequate to realize the
benefit of previously recorded deferred tax assets. Although the Company may not be able to recognize a financial statement benefit
associated with its deferred tax assets, the Company will continue to manage and plan for the utilization of its deferred tax assets to avoid
the expiration of deferred tax assets that have limited lives.
Uncertain Tax PositionsAt December 31, 2017, we had $48.6 of total gross unrecognized tax benefits of which approximately $46.0 would favorably impact the
provision for income taxes, if recognized.
A reconciliation of the beginning and ending amount of unrecognized tax benefits is as follows:
Balance at December 31, 2014 $ 56.7
Additions based on tax positions related to the current year 3.5
Additions for tax positions of prior years 5.7
Reductions for tax positions of prior years (1.5)
Reductions due to lapse of statute of limitations (.4)
Reductions due to settlements with tax authorities (11.0)
Balance at December 31, 2015 53.0
Additions based on tax positions related to the current year 1.8
Additions for tax positions of prior years 9.4
Reductions for tax positions of prior years (2.8)
Reductions due to lapse of statute of limitations (.7)
Reductions due to settlements with tax authorities (2.0)
Balance at December 31, 2016 58.7
Additions based on tax positions related to the current year 1.4
Additions for tax positions of prior years 17.6
Reductions for tax positions of prior years (7.9)
Reductions due to lapse of statute of limitations (3.1)
Reductions due to settlements with tax authorities (18.0)
Balance at December 31, 2017 $ 48.6
We accrue interest and penalties related to unrecognized tax benefits in the provision for income taxes. We did not record any expenses for
interest and penalties, net of taxes during the year ended December 31, 2017, and recorded expenses $2.5 and $2.8 for interest and
penalties, net of taxes during the years ended December 31, 2016 and 2015, respectively. At December 31, 2017 and December 31, 2016
A V O N 2017 F-27
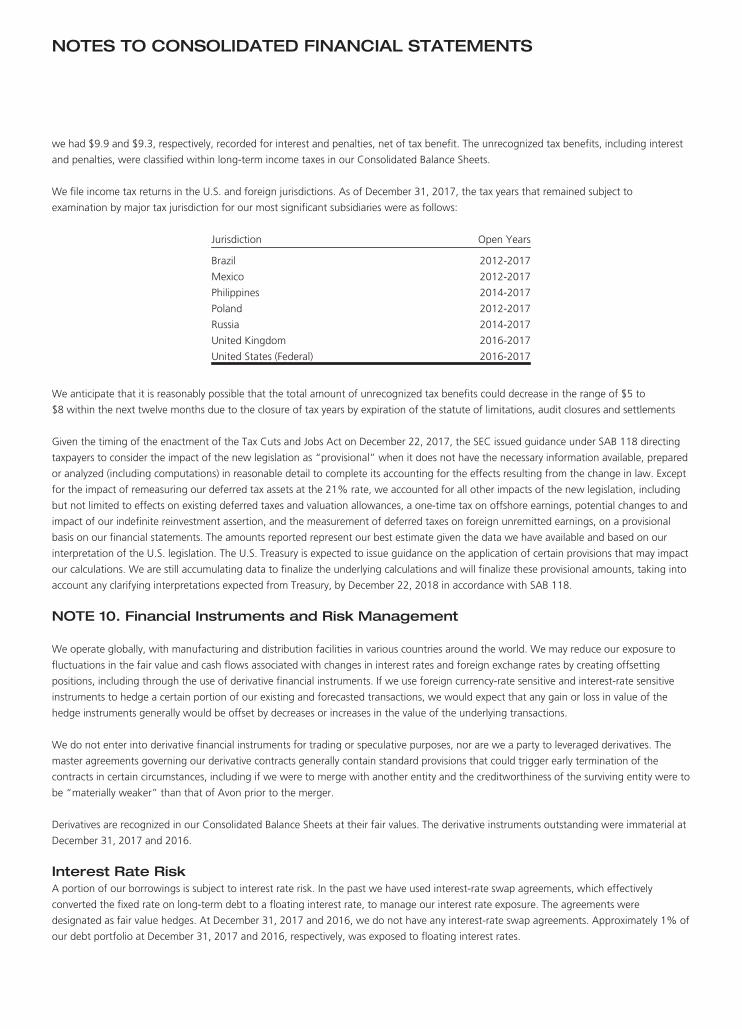
NOTES TO CONSOLIDATED FINANCIAL STATEMENTS
we had $9.9 and $9.3, respectively, recorded for interest and penalties, net of tax benefit. The unrecognized tax benefits, including interest
and penalties, were classified within long-term income taxes in our Consolidated Balance Sheets.
We file income tax returns in the U.S. and foreign jurisdictions. As of December 31, 2017, the tax years that remained subject to
examination by major tax jurisdiction for our most significant subsidiaries were as follows:
Jurisdiction Open Years
Brazil 2012-2017
Mexico 2012-2017
Philippines 2014-2017
Poland 2012-2017
Russia 2014-2017
United Kingdom 2016-2017
United States (Federal) 2016-2017
We anticipate that it is reasonably possible that the total amount of unrecognized tax benefits could decrease in the range of $5 to
$8 within the next twelve months due to the closure of tax years by expiration of the statute of limitations, audit closures and settlements
Given the timing of the enactment of the Tax Cuts and Jobs Act on December 22, 2017, the SEC issued guidance under SAB 118 directing
taxpayers to consider the impact of the new legislation as “provisional” when it does not have the necessary information available, prepared
or analyzed (including computations) in reasonable detail to complete its accounting for the effects resulting from the change in law. Except
for the impact of remeasuring our deferred tax assets at the 21% rate, we accounted for all other impacts of the new legislation, including
but not limited to effects on existing deferred taxes and valuation allowances, a one-time tax on offshore earnings, potential changes to and
impact of our indefinite reinvestment assertion, and the measurement of deferred taxes on foreign unremitted earnings, on a provisional
basis on our financial statements. The amounts reported represent our best estimate given the data we have available and based on our
interpretation of the U.S. legislation. The U.S. Treasury is expected to issue guidance on the application of certain provisions that may impact
our calculations. We are still accumulating data to finalize the underlying calculations and will finalize these provisional amounts, taking into
account any clarifying interpretations expected from Treasury, by December 22, 2018 in accordance with SAB 118.
NOTE 10. Financial Instruments and Risk Management
We operate globally, with manufacturing and distribution facilities in various countries around the world. We may reduce our exposure to
fluctuations in the fair value and cash flows associated with changes in interest rates and foreign exchange rates by creating offsetting
positions, including through the use of derivative financial instruments. If we use foreign currency-rate sensitive and interest-rate sensitive
instruments to hedge a certain portion of our existing and forecasted transactions, we would expect that any gain or loss in value of the
hedge instruments generally would be offset by decreases or increases in the value of the underlying transactions.
We do not enter into derivative financial instruments for trading or speculative purposes, nor are we a party to leveraged derivatives. The
master agreements governing our derivative contracts generally contain standard provisions that could trigger early termination of the
contracts in certain circumstances, including if we were to merge with another entity and the creditworthiness of the surviving entity were to
be “materially weaker” than that of Avon prior to the merger.
Derivatives are recognized in our Consolidated Balance Sheets at their fair values. The derivative instruments outstanding were immaterial at
December 31, 2017 and 2016.
Interest Rate RiskA portion of our borrowings is subject to interest rate risk. In the past we have used interest-rate swap agreements, which effectively
converted the fixed rate on long-term debt to a floating interest rate, to manage our interest rate exposure. The agreements were
designated as fair value hedges. At December 31, 2017 and 2016, we do not have any interest-rate swap agreements. Approximately 1% of
our debt portfolio at December 31, 2017 and 2016, respectively, was exposed to floating interest rates.

In January 2013, we terminated eight of our interest-rate swap agreements previously designated as fair value hedges, with notional
amounts totaling $1,000. As of the interest-rate swap agreements’ termination date, the aggregate favorable adjustment to the carrying
value (deferred gain) of our debt was $90.4, which was amortized as a reduction to interest expense over the remaining term of the
underlying debt obligations. During the year ended December 31, 2016, the net impact of the gain amortization was $35.4, including
$23.6 related to the extinguishment of debt (see Note 7, Debt and Other Financing). At December 31, 2017, there is no unamortized
deferred gain associated with the January 2013 interest-rate swap termination, as the underlying debt obligations have been paid.
In March 2012, we terminated two of our interest-rate swap agreements previously designated as fair value hedges, with notional amounts
totaling $350. As of the interest-rate swap agreements’ termination date, the aggregate favorable adjustment to the carrying value
(deferred gain) of our debt was $46.1, which is being amortized as a reduction to interest expense over the remaining term of the
underlying debt obligations through March 2019. During the years ended December 31, 2017 and 2016, the net impact of the gain
amortization was $4.9 and $11.9, respectively, including $5.8 related to the extinguishment of debt during the year ended December 31,
2016 (see Note 7, Debt and Other Financing). At December 31, 2017, the unamortized deferred gain associated with the March 2012
interest-rate swap termination was $6.0, and was classified within long-term debt in our Consolidated Balance Sheets.
During 2007, we entered into treasury lock agreements (the “2007 locks”) with notional amounts totaling $500.0 that expired on July 31,
2008. The 2007 locks were designated as cash flow hedges of the anticipated interest payments on $250.0 principal amount of notes due in
2013 and $250.0 principal amount of the 2018 Notes. The losses on the 2007 locks of $38.0 were recorded in AOCI. $19.2 of the losses
were amortized to interest expense in our Consolidated Statements of Operations over five years and $18.8 were being amortized over ten
years. During the year ended December 31, 2016, we accelerated the recognition of $2.6 of the losses on the 2007 locks related to the
extinguishment of debt (see Note 7, Debt and Other Financing). As a result, there are no more unamortized deferred losses relating to the
treasury lock agreements in AOCI.
For the year ended December 31, 2016, treasury lock agreements impacted AOCI as follows:
2016Pre-tax net unamortized deferred losses at beginning of year(1) $(4.0)
Reclassification of net losses to earnings 4.0
Pre-tax net unamortized deferred losses at end of year $ –
(1) Amounts above exclude taxes of $2.7 at the beginning of year in 2016.
Foreign Currency RiskWe may use foreign exchange forward contracts to manage a portion of our foreign currency exchange rate exposures. At December 31,
2017, we had outstanding foreign exchange forward contracts with notional amounts totaling approximately $39 for various currencies.
We may use foreign exchange forward contracts to manage foreign currency exposure of certain intercompany loans. These contracts are
not designated as hedges. The change in fair value of these contracts is immediately recognized in earnings and substantially offsets the
foreign currency impact recognized in earnings relating to the associated intercompany loans. During the years ended December 31, 2017
and 2016, we recorded a gain of $3.0 and and a loss of $13.5, respectively, in other expense, net in our Consolidated Statements of
Operations related to these undesignated foreign exchange forward contracts. Also during the years ended December 31, 2017 and 2016,
we recorded a loss of $5.2 and a gain of $10.4, respectively, related to the associated intercompany loans, caused by changes in foreign
currency exchange rates.
Credit Risk of Financial InstrumentsAt times, we attempt to minimize our credit exposure to counterparties by entering into derivative transactions and similar agreements with
major international financial institutions with “A-” or higher credit ratings as issued by Standard & Poor’s Corporation. Our foreign currency
derivatives are typically comprised of over-the-counter forward contracts, swaps or options with major international financial institutions.
Although our theoretical credit risk is the replacement cost at the then estimated fair value of these instruments, we believe that the risk of
incurring credit risk losses is remote and that such losses, if any, would not be material.
A V O N 2017 F-29

NOTES TO CONSOLIDATED FINANCIAL STATEMENTS
Non-performance of the counterparties on the balance of all the foreign exchange agreements would have resulted in a write-off of $.2 at
December 31, 2017. In addition, in the event of non-performance by such counterparties, we would be exposed to market risk on the
underlying items being hedged as a result of changes in foreign exchange rates.
NOTE 11. Fair Value
Assets and Liabilities Recorded at Fair ValueThe fair value measurement provisions required by GAAP establish a fair value hierarchy, which prioritizes the inputs used in measuring fair
value into three broad levels as follows:
• Level 1 – Quoted prices in active markets for identical assets or liabilities.
• Level 2 – Inputs, other than the quoted prices in active markets, that are observable either directly or indirectly.
• Level 3 – Unobservable inputs based on our own assumptions.
Assets and Liabilities Recorded at Fair Value on a Recurring BasisOther than our defined benefit pension and postretirement plan assets, the assets and liabilities measured at fair value on a recurring basis
are comprised of foreign exchange forward contracts (see Note 10, Financial Instruments and Risk Management) and available-for-sale
securities, which were immaterial at December 31, 2017 and 2016. See Note 13, Employee Benefit Plans, for the fair value hierarchy for our
plan assets. The available-for-sale securities include securities held in a trust in order to fund future benefit payments for non-qualified
retirement plans (see Note 13, Employee Benefit Plans).
Fair Value of Financial InstrumentsOur financial instruments include cash and cash equivalents, available-for-sale securities, short-term investments, accounts receivable, debt
maturing within one year, accounts payable, long-term debt and foreign exchange forward contracts. The carrying value for cash and cash
equivalents, accounts receivable, accounts payable and short-term investments approximate fair value because of the short-term nature of
these instruments.
The net asset (liability) amounts recorded in the balance sheet (carrying amount) and the estimated fair values of our remaining financial
instruments at December 31 consisted of the following:
2017 2016
CarryingAmount Fair Value
CarryingAmount Fair Value
Available-for-sale securities $ 3.7 $ 3.7 $ 2.8 $ 2.8
Debt maturing within one year(1) (25.7) (25.7) (18.1) (18.1)
Long-term debt(1) (1,872.2) (1,718.6) (1,875.8) (1,877.5)
Foreign exchange forward contracts – – (2.4) (2.4)
(1) The carrying value of debt maturing within one year and long-term debt is presented net of debt issuance costs and includes any related discount or premiumand unamortized deferred gains on terminated interest-rate swap agreements, as applicable.
The methods and assumptions used to estimate fair value are as follows:
• Available-for-sale securities – The fair values of these investments were the quoted market prices for issues listed on securities exchanges.
• Debt maturing within one year and long-term debt – The fair values of our debt and other financing were determined using Level 2 inputs
based on indicative market prices.
• Foreign exchange forward contracts – The fair values of forward contracts were estimated based on quoted forward foreign exchange
prices at the reporting date.
NOTE 12. Share-Based Compensation Plans
The Avon Products, Inc. 2013 Stock Incentive Plan, as amended and restated (the “2013 Plan”) and the Avon Products, Inc. 2016 Omnibus
Incentive Plan (the “2016 Plan”), which are shareholder-approved plans, provide for several types of share-based incentive compensation

awards including stock options, restricted stock, restricted stock units and performance restricted stock units. Following shareholder approval
of the 2016 Plan in May 2016, there were no further awards made under the 2013 Plan. Under the 2013 Plan, the maximum number of
shares that may be awarded is 55,000,000 shares, where the maximum number of shares are reduced as follows: (i) in the case of the grant
of an award of an option or stock appreciation right (“SAR”), by each share subject to such an award and (ii) in the case of the grant of an
award payable in shares other than an option or SAR by 3.13 multiplied by each share subject to such an award. Under the 2016 Plan, the
maximum number of shares that may be awarded is 48,000,000 shares, where the maximum number of shares are reduced as follows: (i) in
the case of the grant of an award of an option or SAR, by each share subject to such an award and (ii) in the case of the grant of an award
payable in shares other than an option or SAR by 2.4 multiplied by each share subject to such an award. Shares issued under share-based
awards will be primarily funded with issuance of new shares.
We have issued stock options under the 2016 Plan, and restricted stock units and performance restricted stock units under the 2013 Plan
and the 2016 Plan. We also have outstanding stock options under our prior shareholder-approved plans. Stock option awards are granted
with an exercise price generally equal to the closing market price of our stock at the date of grant. Stock options generally vest in thirds over
the three-year period following each option grant date and have ten-year contractual terms. Restricted stock units granted to Associates
generally vest and settle after three years. Restricted stock units awarded to non-management directors vest in approximately one year and
settle upon a director’s departure from the Board of Directors. Performance restricted stock units generally vest after three years only upon
the satisfaction of certain performance conditions.
For the years ended December 31:
2017 2016 2015
Compensation cost for stock options, performance restricted stock units and
restricted stock units $24.2 $24.0 $51.2
Total income tax benefit recognized for share-based arrangements 1.4 1.9 4.1
All of the compensation cost for stock options, performance restricted stock units and restricted stock units, including those that will be
funded with treasury shares, for 2017, 2016 and 2015 was recorded in selling, general and administrative expenses in our Consolidated
Statements of Operations.
Stock OptionsDuring 2017 and 2016, we granted premium-priced stock options, in which the exercise price was equal to a 25% premium and 30%
premium, respectively, from the closing market price of our stock price at the date of grant. The premium-priced stock options vest on a
three-year graded vesting schedule. The fair value of each premium-priced stock option is estimated on the date of grant using a Monte-
Carlo simulation. When estimating the fair value of each option, we used the following weighted-average assumptions for options granted
during the years ended December 31, 2017 and 2016:
2017 2016
Risk-free rate(1) 2.1% 1.6%
Expected term(2) 7 years 7 years
Expected Avon volatility(3) 41% 39%
Expected dividends –% –%
(1) The risk-free rate was based upon the rate on a zero coupon U.S. Treasury bill, for periods within the contractual life of the option, in effect at the time ofgrant.
(2) The expected term of the option was based on the vesting terms of the respective option and a contractual life of 10 years.
(3) Expected Avon volatility was based on the daily historical volatility of our stock price, over a period similar to the expected life of the option.
The weighted-average grant-date fair value per share of options granted were $1.54 and $1.37 during 2017 and 2016, respectively. There
were no stock options granted during 2015.
A V O N 2017 F-31

NOTES TO CONSOLIDATED FINANCIAL STATEMENTS
A summary of stock options as of December 31, 2017, and changes during 2017, is as follows:
Shares(in 000’s)
Weighted-AverageExercise
Price
Weighted-Average
ContractualTerm
AggregateIntrinsic
Value
Outstanding at January 1, 2017 14,824 $20.09
Granted 6,785 5.32
Exercised – –
Forfeited 2,505 5.52
Expired 1,939 34.50
Outstanding at December 31, 2017 17,165 $14.95 5.6 $ –
Exercisable at December 31, 2017 8,518 $22.27 2.9 $ –
We recognize expense on stock options using a graded vesting method, which recognizes the associated expense based on the timing of
option vesting dates. At December 31, 2017, there was $4.8 of unrecognized compensation cost related to stock options outstanding. That
cost is expected to be recognized over a weighted-average period of 2.0 years.
There were no stock options exercised during 2017, 2016 or 2015.
Restricted Stock, Restricted Stock Units and Performance Restricted Stock UnitsDuring 2017 and 2016, we granted performance restricted stock units that would vest and settle after three years based on the relative total
shareholder return of our common stock against companies included in the S&P 400 index as of the date of grant over a three year
performance period (“2017 PRSUs” and “2016 PRSUs”, respectively). The grant date fair value per share of these awards already reflects the
estimated probability of achieving the market condition, and therefore we record the expense ratably over the performance period.
During 2015, we granted performance restricted stock units that would vest and settle after three years only upon the satisfaction of certain
performance conditions over two years (“2015 PRSUs”). In addition, if the performance conditions are achieved above target, these
performance restricted stock units are subject to a market condition in which the number of performance restricted stock units that vest will
be limited to the target amount if the Company’s absolute total shareholder return during the three-year service period is negative. We have
adjusted the compensation cost recognized to-date to reflect our performance, which reflects an estimated payout below target, and as
such, the absolute total shareholder return market condition will not impact the number of performance restricted stock units that vest.
The fair value of the 2017 PRSUs, 2016 PRSUs and 2015 PRSUs was estimated on the date of grant using a Monte-Carlo simulation that
estimates the fair value based on the Company’s share price activity, expected term of the award, risk-free interest rate, expected dividends
and the expected volatility of the stock of the Company. When estimating the fair value of the 2017 PRSUs, 2016 PRSUs and the 2015
PRSUs, we used the following weighted-average assumptions:
2017PRSUs
2016PRSUs
2015PRSUs
Risk-free rate(1) 1.6% 1.1% 1.1%
Expected Avon volatility(2) 61% 56% 38%
Expected average volatility(3) 29% 28% N/A
Expected dividends –% –% 3%
(1) The risk-free rate was based upon the rate on a zero coupon U.S. Treasury bill, for periods within the three year performance period, in effect at the time ofgrant.
(2) Expected Avon volatility was based on the weekly historical volatility of our stock price, over a period similar to the three year performance period of the2017 PRSUs and 2016 PRSUs and the three year service period of the 2015 PRSUs.
(3) Expected average volatility was based on the weekly historical volatility of the stock prices of each member of companies included in the S&P 400 index as ofthe date of the grant, over a period similar to the three year performance period of the 2017 PRSUs and 2016 PRSUs.

The weighted-average grant-date fair value per share of the 2017 PRSUs, 2016 PRSUs and 2015 PRSUs was $4.52, $4.42 and $7.49,
respectively.
A summary of restricted stock and restricted stock units at December 31, 2017, and changes during 2017, is as follows:
RestrictedStock
And Units(in 000’s)
Weighted-Average
Grant-DateFair Value
January 1, 2017 5,356 $ 8.64
Granted 2,813 4.05
Vested (2,387) 11.41
Forfeited (978) 5.36
December 31, 2017 4,804 $ 5.26
A summary of performance restricted stock units at December 31, 2017, and changes during 2017, is as follows:
PerformanceRestricted
Stock Units(in 000’s)
Weighted-Average
Grant-Date Fair
Value
January 1, 2017(1) 4,922 $ 8.99
Granted 1,869 4.21
Vested (1,478) 14.69
Forfeited (957) 6.68
December 31, 2017(1) 4,356 $ 5.50
(1) Based on initial target payout.
The total fair value of restricted stock units and performance restricted stock units that vested during 2017 was $15.2, based upon market
prices on the vesting dates. At December 31, 2017, there was $14.0 of unrecognized compensation cost related to these restricted stock,
restricted stock units and performance restricted stock units compensation arrangements outstanding. That cost is expected to be
recognized over a weighted-average period of 1.8 years.
Later in 2015, we granted 1,123,183 performance restricted stock units that vested and settled in 2016 only upon the satisfaction of certain
performance conditions through 2015. The terms of this award did not result in a fair value measurement date until 2016. During 2016 and
2015, we recognized compensation cost of $2.0 and $1.6, respectively, for these performance restricted stock units. As this award vested
and settled in 2016, no additional compensation cost was recognized in 2017.
Restricted Stock Units and Performance Restricted Stock Units Funded WithTreasury SharesIn March 2015 and April 2012, we granted 489,596 and 200,000 restricted stock units, respectively, that will be funded with treasury
shares, outside of our shareholder-approved plans, in reliance upon The New York Stock Exchange rules. The restricted stock units granted
in March 2015 have a weighted-average grant-date fair value of $9.00 and vest and settle ratably over three years. The restricted stock units
granted in April 2012 had a weighted-average grant-date fair value of $21.69 and vested and settled ratably over five years. During 2017,
366,397 of these restricted stock units vested, and there were no restricted stock units were outstanding at December 31, 2017. During
2017, 2016 and 2015, we recognized compensation cost of $.8, $1.7 and $2.7, respectively, for these restricted stock units. At
December 31, 2017, there was no unrecognized compensation cost related to these restricted stock units as the awards had vested.
In March 2015, we granted 121,951 performance restricted stock units that will be funded with treasury shares, outside of the 2013 Plan, in
reliance upon The New York Stock Exchange rules. These performance restricted stock units have a weighted-average grant-date fair value
A V O N 2017 F-33

NOTES TO CONSOLIDATED FINANCIAL STATEMENTS
of $7.49 and the same terms exist for these awards as the 2015 PRSUs discussed above. 101,625 of these performance restricted stock units
were outstanding at December 31, 2017. During 2017, 2016 and 2015, we recognized compensation cost of $.1, $.1 and $.2, respectively,
for these performance restricted stock units. At December 31, 2017, there was an immaterial amount of unrecognized compensation cost
related to these performance restricted stock units.
NOTE 13. Employee Benefit Plans
Defined Contribution PlansWe offer a defined contribution plan for employees in the United Kingdom (“UK”), which allows eligible participants to contribute eligible
compensation through payroll deductions. We double employee contributions up to the first 5% of eligible compensation and therefore the
maximum level provided by Avon is 10% of eligible compensation. We made matching contributions in cash to the UK defined contribution
plan of $6.7 in 2017, $6.5 in 2016 and $7.6 in 2015, which follow the same investment allocation that the participant has selected for his
or her own contributions.
We also offer a qualified defined contribution plan for U.S.-based employees, the Avon Personal Savings Account Plan (the “PSA”), which
allows eligible participants to contribute up to 25% of eligible compensation through payroll deductions. We match employee contributions
dollar for dollar up to the first 3% of eligible compensation and fifty cents for each dollar contributed from 4% to 6% of eligible
compensation. We made matching contributions in cash to the PSA of $2.6 in 2017, $3.8 in 2016 and $4.0 in 2015, which follow the same
investment allocation that the participant has selected for his or her own contributions. Prior to the separation of the North America
business, the costs associated with the contributions to the PSA were allocated between Discontinued Operations and Global as the plan
included both North America and U.S. Corporate Avon associates. See Note 3, Discontinued Operations and Divestitures.
For U.S.-based employees hired on or after January 1, 2015, we made additional contributions to a Retirement Savings Account (“RSA”)
within the PSA. Such contributions will range from 3% to 6% of a participant’s eligible compensation depending on the sum of the
participant’s age and length of service (as of December 31 of the prior year). Investment of such contributions will follow the same
investment allocation that the participant has selected for his or her own contributions to the PSA. A participant will be vested in the RSA
generally after three full years of applicable service.
Defined Benefit Pension and Postretirement PlansAvon and certain subsidiaries have contributory and noncontributory defined benefit retirement plans for substantially all employees of those
subsidiaries. Benefits under these plans are generally based on an employee’s length of service and average compensation near retirement,
and certain plans have vesting requirements. Plans are funded based on legal requirements and cash flow.
Our largest non-U.S. defined benefit pension plan is in the UK. The UK defined benefit pension plan is closed to employees hired on or after
April 1, 2013. The U.S. defined benefit pension plan, the Avon Products, Inc. Personal Retirement Account Plan (the “PRA”), is closed to
employees hired on or after January 1, 2015. Qualified retirement benefits for U.S.-based employees hired on or after January 1, 2015 will
be provided solely through the PSA, as described above.
As part of the separation of the North America business, in 2016 we transferred $499.6 of pension liabilities under the PRA associated with
current and former employees of the North America business and certain other former Avon employees, along with $355.9 of assets held by
the PRA, to a defined benefit pension plan sponsored by New Avon. We also transferred $60.4 of other postretirement liabilities (namely,
retiree medical and supplemental pension liabilities) in respect of such employees and former employees. See Note 3, Discontinued
Operations and Divestitures. We continue to retain certain U.S. pension and other postretirement liabilities primarily associated with
employees who are actively employed by Avon in the U.S. providing services other than with respect to the North America business. Prior to
this separation, our net periodic benefit costs for the U.S. pension and postretirement benefit plans were allocated between Discontinued
Operations and Global as the plan included both North America and U.S. Corporate Avon associates.
We provide health care benefits, subject to certain limitations, to certain retired associates in the U.S. and certain foreign countries. In the
U.S., such health care benefits for Corporate Avon associates hired on or before January 1, 2005 are in the form of a health reimbursement
account. U.S. Corporate Avon associates hired after January 1, 2005 are not eligible for retiree health care benefits. Such retiree health care
benefits for current and former employees of the North America business and certain other former Avon employees based in the U.S. were
transferred to New Avon.

We recognize the funded status of defined benefit pension and other postretirement benefit plans on the balance sheet. Each overfunded
plan is recognized as an asset and each underfunded plan is recognized as a liability. The recognition of prior service costs or credits and net
actuarial gains or losses, as well as subsequent changes in the funded status, are recognized as components of AOCI, net of tax, in
shareholders’ equity, until they are amortized as a component of net periodic benefit cost. We recognize prior service costs or credits and
actuarial gains and losses beyond a 10% corridor to earnings based on the estimated future service period of the participants. The
determination of the 10% corridor utilizes a calculated value of plan assets for our more significant plans, whereby gains and losses are
smoothed over three- and five-year periods.
A V O N 2017 F-35

NOTES TO CONSOLIDATED FINANCIAL STATEMENTS
Reconciliation of Benefit Obligations, Plan Assets and Funded StatusThe following table summarizes changes in the benefit obligation, plan assets and the funded status of our significant defined benefit
pension and postretirement plans. We use a December 31 measurement date for all of our employee benefit plans.
Pension PlansPostretirement
BenefitsU.S. Plans Non-U.S. Plans
2017 2016 2017 2016 2017 2016
Change in Benefit Obligation:Beginning balance $(87.6) $(606.8) $(652.9) $(667.7) $(26.0) $(76.6)
Service cost (4.3) (6.4) (4.6) (5.0) (.1) (.1)Interest cost (3.0) (6.5) (18.0) (21.8) (1.3) (1.7)Actuarial (loss) gain .6 (7.5) (15.5) (95.9) .3 2.6Benefits paid 5.4 26.0 42.5 37.3 .4 1.4Plan amendments – – – – – (1.0)Curtailments – .2 – 1.0 – –Settlements – – – – – –Special termination benefits – – – – – (.1)Divestitures – 509.9 – – – 50.1Venezuela deconsolidation – – – 1.5 – –Foreign currency changes and other – 3.5 (65.7) 97.7 (1.5) (.6)
Ending balance $(88.9) $ (87.6) $(714.2) $(652.9) $(28.2) $(26.0)
Change in Plan Assets:Beginning balance $ 51.4 $ 408.3 $ 613.7 $ 576.3 $ – $ –
Actual return on plan assets 5.5 .7 49.9 153.6 – –Company contributions 11.6 26.6 19.7 20.0 .4 1.4Benefits paid (5.4) (26.0) (42.5) (37.3) (.4) (1.4)Divestitures – (355.9) – – – –Foreign currency changes and other – (2.3) 64.6 (98.9) – –
Ending balance $ 63.1 $ 51.4 $ 705.4 $ 613.7 $ – $ –
Funded Status:
Funded status at end of year $(25.8) $ (36.2) $ (8.8) $ (39.2) $(28.2) $(26.0)
Amount Recognized in Balance Sheet:Other assets $ – $ – $ 82.0 $ 54.8 $ – $ –Accrued compensation (1.0) (1.7) (2.2) (1.4) (2.7) (2.4)Employee benefit plans liability (24.8) (34.5) (88.6) (92.6) (25.5) (23.6)
Net amount recognized $(25.8) $ (36.2) $ (8.8) $ (39.2) $(28.2) $(26.0)
Pretax Amounts Recognized inAccumulated Other ComprehensiveLoss:Net actuarial loss $ 41.4 $ 49.5 $ 176.8 $ 176.5 $ 1.2 $ 1.7Prior service credit (.2) (.2) (.9) (1.0) (1.3) (1.6)
Total pretax amount recognized $ 41.2 $ 49.3 $ 175.9 $ 175.5 $ (.1) $ .1
Supplemental Information:Accumulated benefit obligation $ 85.9 $ 85.2 $ 199.8 $ 182.3 N/A N/A
Plans with Projected Benefit Obligation inExcess of Plan Assets:Projected benefit obligation $ 88.9 $ 87.6 $ 216.7 $ 200.8 N/A N/AFair value plan assets 63.1 51.4 125.9 106.8 N/A N/A
Plans with Accumulated BenefitObligation in Excess of Plan Assets:Projected benefit obligation $ 88.9 $ 87.6 $ 202.0 $ 182.8 N/A N/AAccumulated benefit obligation 85.9 85.2 191.9 172.8 N/A N/AFair value plan assets 63.1 51.4 114.0 92.9 N/A N/A
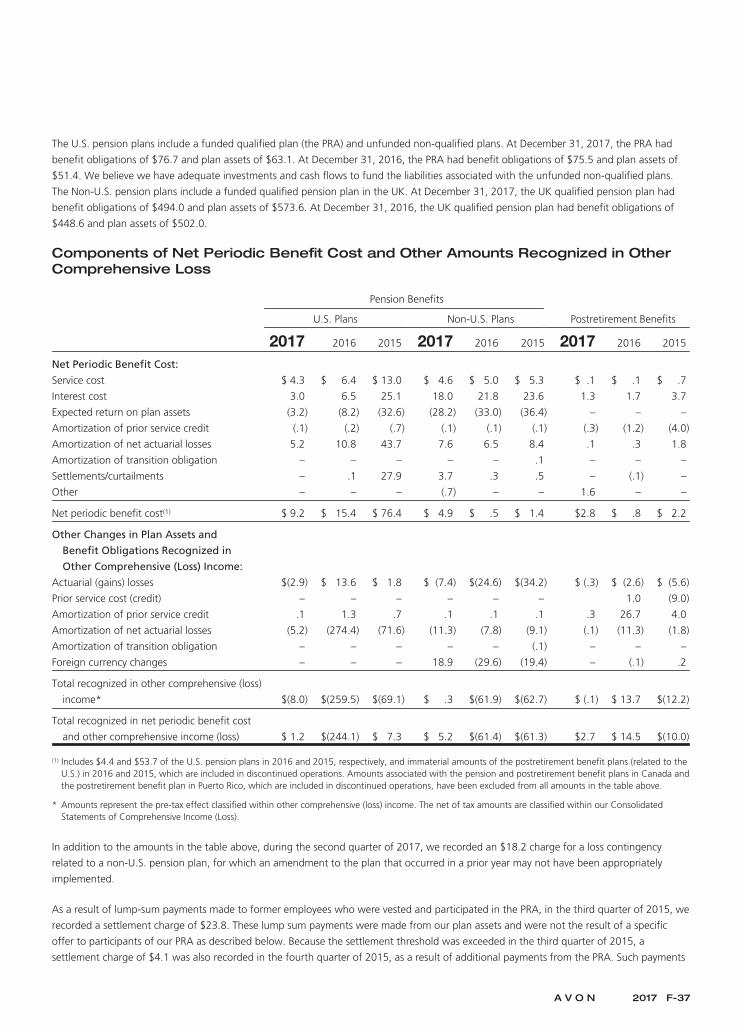
The U.S. pension plans include a funded qualified plan (the PRA) and unfunded non-qualified plans. At December 31, 2017, the PRA had
benefit obligations of $76.7 and plan assets of $63.1. At December 31, 2016, the PRA had benefit obligations of $75.5 and plan assets of
$51.4. We believe we have adequate investments and cash flows to fund the liabilities associated with the unfunded non-qualified plans.
The Non-U.S. pension plans include a funded qualified pension plan in the UK. At December 31, 2017, the UK qualified pension plan had
benefit obligations of $494.0 and plan assets of $573.6. At December 31, 2016, the UK qualified pension plan had benefit obligations of
$448.6 and plan assets of $502.0.
Components of Net Periodic Benefit Cost and Other Amounts Recognized in OtherComprehensive Loss
Pension Benefits
Postretirement BenefitsU.S. Plans Non-U.S. Plans
2017 2016 2015 2017 2016 2015 2017 2016 2015
Net Periodic Benefit Cost:
Service cost $ 4.3 $ 6.4 $ 13.0 $ 4.6 $ 5.0 $ 5.3 $ .1 $ .1 $ .7
Interest cost 3.0 6.5 25.1 18.0 21.8 23.6 1.3 1.7 3.7
Expected return on plan assets (3.2) (8.2) (32.6) (28.2) (33.0) (36.4) – – –
Amortization of prior service credit (.1) (.2) (.7) (.1) (.1) (.1) (.3) (1.2) (4.0)
Amortization of net actuarial losses 5.2 10.8 43.7 7.6 6.5 8.4 .1 .3 1.8
Amortization of transition obligation – – – – – .1 – – –
Settlements/curtailments – .1 27.9 3.7 .3 .5 – (.1) –
Other – – – (.7) – – 1.6 – –
Net periodic benefit cost(1) $ 9.2 $ 15.4 $ 76.4 $ 4.9 $ .5 $ 1.4 $2.8 $ .8 $ 2.2
Other Changes in Plan Assets and
Benefit Obligations Recognized in
Other Comprehensive (Loss) Income:
Actuarial (gains) losses $(2.9) $ 13.6 $ 1.8 $ (7.4) $(24.6) $(34.2) $ (.3) $ (2.6) $ (5.6)
Prior service cost (credit) – – – – – – 1.0 (9.0)
Amortization of prior service credit .1 1.3 .7 .1 .1 .1 .3 26.7 4.0
Amortization of net actuarial losses (5.2) (274.4) (71.6) (11.3) (7.8) (9.1) (.1) (11.3) (1.8)
Amortization of transition obligation – – – – – (.1) – – –
Foreign currency changes – – – 18.9 (29.6) (19.4) – (.1) .2
Total recognized in other comprehensive (loss)
income* $(8.0) $(259.5) $(69.1) $ .3 $(61.9) $(62.7) $ (.1) $ 13.7 $(12.2)
Total recognized in net periodic benefit cost
and other comprehensive income (loss) $ 1.2 $(244.1) $ 7.3 $ 5.2 $(61.4) $(61.3) $2.7 $ 14.5 $(10.0)
(1) Includes $4.4 and $53.7 of the U.S. pension plans in 2016 and 2015, respectively, and immaterial amounts of the postretirement benefit plans (related to theU.S.) in 2016 and 2015, which are included in discontinued operations. Amounts associated with the pension and postretirement benefit plans in Canada andthe postretirement benefit plan in Puerto Rico, which are included in discontinued operations, have been excluded from all amounts in the table above.
* Amounts represent the pre-tax effect classified within other comprehensive (loss) income. The net of tax amounts are classified within our ConsolidatedStatements of Comprehensive Income (Loss).
In addition to the amounts in the table above, during the second quarter of 2017, we recorded an $18.2 charge for a loss contingency
related to a non-U.S. pension plan, for which an amendment to the plan that occurred in a prior year may not have been appropriately
implemented.
As a result of lump-sum payments made to former employees who were vested and participated in the PRA, in the third quarter of 2015, we
recorded a settlement charge of $23.8. These lump sum payments were made from our plan assets and were not the result of a specific
offer to participants of our PRA as described below. Because the settlement threshold was exceeded in the third quarter of 2015, a
settlement charge of $4.1 was also recorded in the fourth quarter of 2015, as a result of additional payments from the PRA. Such payments
A V O N 2017 F-37
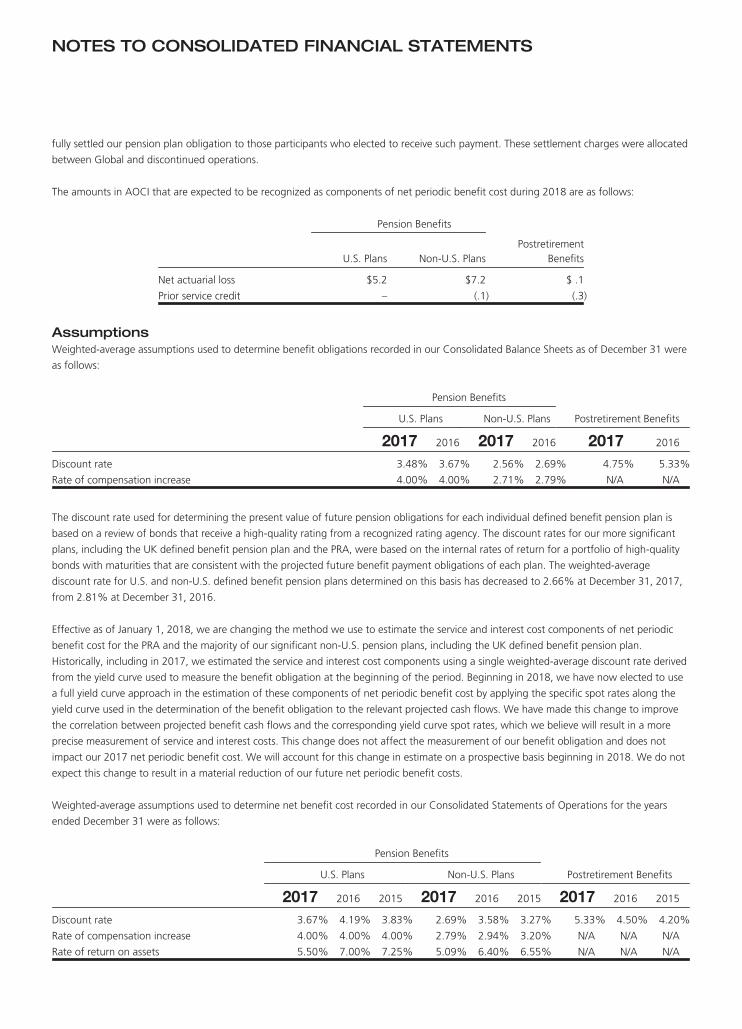
NOTES TO CONSOLIDATED FINANCIAL STATEMENTS
fully settled our pension plan obligation to those participants who elected to receive such payment. These settlement charges were allocated
between Global and discontinued operations.
The amounts in AOCI that are expected to be recognized as components of net periodic benefit cost during 2018 are as follows:
Pension Benefits
U.S. Plans Non-U.S. PlansPostretirement
Benefits
Net actuarial loss $5.2 $7.2 $ .1
Prior service credit – (.1) (.3)
AssumptionsWeighted-average assumptions used to determine benefit obligations recorded in our Consolidated Balance Sheets as of December 31 were
as follows:
Pension Benefits
U.S. Plans Non-U.S. Plans Postretirement Benefits
2017 2016 2017 2016 2017 2016
Discount rate 3.48% 3.67% 2.56% 2.69% 4.75% 5.33%
Rate of compensation increase 4.00% 4.00% 2.71% 2.79% N/A N/A
The discount rate used for determining the present value of future pension obligations for each individual defined benefit pension plan is
based on a review of bonds that receive a high-quality rating from a recognized rating agency. The discount rates for our more significant
plans, including the UK defined benefit pension plan and the PRA, were based on the internal rates of return for a portfolio of high-quality
bonds with maturities that are consistent with the projected future benefit payment obligations of each plan. The weighted-average
discount rate for U.S. and non-U.S. defined benefit pension plans determined on this basis has decreased to 2.66% at December 31, 2017,
from 2.81% at December 31, 2016.
Effective as of January 1, 2018, we are changing the method we use to estimate the service and interest cost components of net periodic
benefit cost for the PRA and the majority of our significant non-U.S. pension plans, including the UK defined benefit pension plan.
Historically, including in 2017, we estimated the service and interest cost components using a single weighted-average discount rate derived
from the yield curve used to measure the benefit obligation at the beginning of the period. Beginning in 2018, we have now elected to use
a full yield curve approach in the estimation of these components of net periodic benefit cost by applying the specific spot rates along the
yield curve used in the determination of the benefit obligation to the relevant projected cash flows. We have made this change to improve
the correlation between projected benefit cash flows and the corresponding yield curve spot rates, which we believe will result in a more
precise measurement of service and interest costs. This change does not affect the measurement of our benefit obligation and does not
impact our 2017 net periodic benefit cost. We will account for this change in estimate on a prospective basis beginning in 2018. We do not
expect this change to result in a material reduction of our future net periodic benefit costs.
Weighted-average assumptions used to determine net benefit cost recorded in our Consolidated Statements of Operations for the years
ended December 31 were as follows:
Pension Benefits
U.S. Plans Non-U.S. Plans Postretirement Benefits
2017 2016 2015 2017 2016 2015 2017 2016 2015
Discount rate 3.67% 4.19% 3.83% 2.69% 3.58% 3.27% 5.33% 4.50% 4.20%
Rate of compensation increase 4.00% 4.00% 4.00% 2.79% 2.94% 3.20% N/A N/A N/A
Rate of return on assets 5.50% 7.00% 7.25% 5.09% 6.40% 6.55% N/A N/A N/A

In determining the long-term rates of return, we consider the nature of each plan’s investments, an expectation for each plan’s investment
strategies, historical rates of return and current economic forecasts, among other factors. We generally evaluate the expected rate of return
on plan assets annually and adjust as necessary. In determining the net cost for the year ended December 31, 2017, the assumed rate of
return on assets globally was 5.12%, which represents the weighted-average rate of return on all plan assets. Amounts associated with the
pension and postretirement benefit plans in Canada and the postretirement benefit plan in Puerto Rico, which are associated with
discontinued operations, have been excluded from all amounts above.
A significant portion of our pension plan assets relate to the UK defined benefit pension plan. The assumed rate of return for determining
2017 net periodic benefit cost for the UK defined benefit pension plan was 5.15%. In addition, the 2018 rate of return assumption for the
UK defined benefit pension plan was based on an asset allocation of approximately 80% in corporate and government bonds and
mortgage-backed securities (which are expected to earn approximately 2% to 4% in the long-term) and approximately 20% in equity
securities, emerging market debt and high yield securities (which are expected to earn approximately 5% to 9% in the long-term). In
addition to the physical assets, the asset portfolio for the UK defined benefit pension plan has derivative instruments which increase our
exposure to fixed income (in order to better match liabilities) and, to a lesser extent, impact our equity exposure.
Historically, the pension plan with the most significant pension plan assets was the PRA. The assumed rate of return for determining 2017
net periodic benefit cost for the PRA was 5.50%. In addition, the 2018 rate of return assumption for the PRA was based on an asset
allocation of approximately 70% in corporate and government bonds (which are expected to earn approximately 3% to 5% in the long-
term) and approximately 30% in equity securities (which are expected to earn approximately 6% to 8% in the long-term).
Similar assessments were performed in determining rates of return on other non-U.S. defined benefit pension plan assets, to arrive at our
weighted-average assumed rate of return of 5.09% for determining 2017 net cost for all non-US defined benefit pension plan assets.
Plan AssetsOur U.S. and non-U.S. funded defined benefit pension plans target and weighted-average asset allocations at December 31, 2017 and
2016, by asset category were as follows:
U.S. Pension Plan Non-U.S. Pension Plans
% of Plan Assets % of Plan Assets
Target at Year-End Target at Year-End
Asset Category 2018 2017 2016 2018 2017 2016
Equity securities 30% 30% 28% 20% 18% 22%
Debt securities 70 70 69 70 77 68
Other – – 3 10 6 10
Total 100% 100% 100% 100% 100% 100%
A V O N 2017 F-39
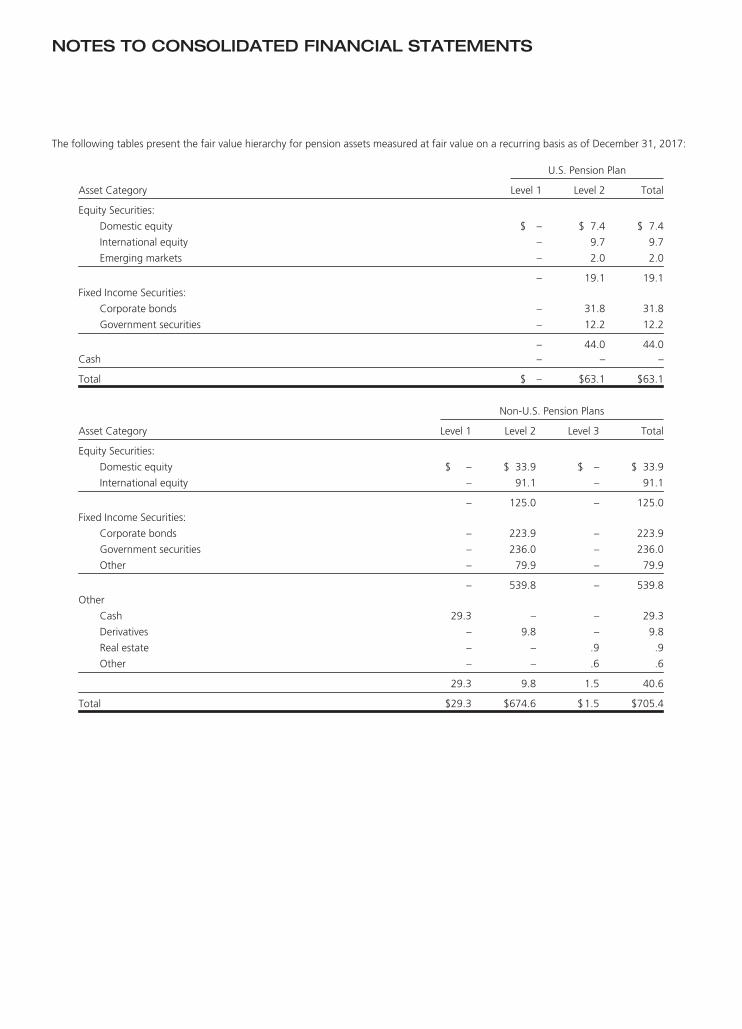
NOTES TO CONSOLIDATED FINANCIAL STATEMENTS
The following tables present the fair value hierarchy for pension assets measured at fair value on a recurring basis as of December 31, 2017:
U.S. Pension Plan
Asset Category Level 1 Level 2 Total
Equity Securities:
Domestic equity $ – $ 7.4 $ 7.4
International equity – 9.7 9.7
Emerging markets – 2.0 2.0
– 19.1 19.1Fixed Income Securities:
Corporate bonds – 31.8 31.8
Government securities – 12.2 12.2
– 44.0 44.0Cash – – –
Total $ – $63.1 $63.1
Non-U.S. Pension Plans
Asset Category Level 1 Level 2 Level 3 Total
Equity Securities:
Domestic equity $ – $ 33.9 $ – $ 33.9
International equity – 91.1 – 91.1
– 125.0 – 125.0Fixed Income Securities:
Corporate bonds – 223.9 – 223.9
Government securities – 236.0 – 236.0
Other – 79.9 – 79.9
– 539.8 – 539.8Other
Cash 29.3 – – 29.3
Derivatives – 9.8 – 9.8
Real estate – – .9 .9
Other – – .6 .6
29.3 9.8 1.5 40.6
Total $29.3 $674.6 $1.5 $705.4

The following tables present the fair value hierarchy for pension assets measured at fair value on a recurring basis as of December 31, 2016:
U.S. Pension Plan
Asset Category Level 1 Level 2 Total
Equity Securities:
Domestic equity $ – $ 7.9 $ 7.9
International equity – 6.3 6.3
Emerging markets $ – 1.5 1.5
– 15.7 15.7
Fixed Income Securities:
Corporate bonds – 25.7 25.7
Government securities – 9.9 9.9
– 35.6 35.6
Cash .1 – .1
Total(3) $.1 $51.3 $51.4
Non-U.S. Pension Plans
Asset Category Level 1 Level 2 Level 3 Total
Equity Securities:
Domestic equity $ – $ 27.7 $ – $ 27.7
International equity – 107.6 – 107.6
– 135.3 – 135.3
Fixed Income Securities:
Corporate bonds – 194.8 – 194.8
Government securities – 192.8 – 192.8
Other – 32.0 – 32.0
– 419.6 – 419.6
Other:
Cash 23.2 – – 23.2
Derivatives – 34.1 – 34.1
Real estate – – .9 .9
Other – – .6 .6
23.2 34.1 1.5 58.8
Total $23.2 $589.0 $1.5 $613.7
A reconciliation of the beginning and ending balances for our Level 3 investments is provided in the table below:
Amount
Balance at January 1, 2016 $1.8
Actual return on plan assets held (.2)
Foreign currency changes (.1)
Balance at December 31, 2016 1.5
Actual return on plan assets held (.1)
Foreign currency changes .1
Balance at December 31, 2017 $1.5
Investments in equity securities classified as Level 1 in the fair value hierarchy are valued at quoted market prices. Investments in equity
securities classified as Level 2 in the fair value hierarchy include collective funds that are valued at quoted market prices for non-active
A V O N 2017 F-41

NOTES TO CONSOLIDATED FINANCIAL STATEMENTS
securities. Fixed income securities are based on broker quotes for non-active securities. Mutual funds are valued at quoted market prices.
Real estate is valued by reference to investment and leasing transactions at similar types of property, supplemented by third party appraisals.
Derivative instruments are not publicly traded and each derivative contract is specifically negotiated with a unique financial counterparty. The
derivative instruments are valued based upon valuation statements received from the financial counterparties, which use underlying yield
curves or market indices.
The overall objective of the plan assets associated with the PRA and the UK defined benefit pension plan is to provide the means to pay
benefits to participants and their beneficiaries in the amounts and at the times called for by the plan. This is expected to be achieved
through the investment of our contributions and other trust assets and by utilizing investment policies designed to achieve adequate funding
over a reasonable period of time.
In some of our defined benefit pension plans, we have adopted investment strategies which are designed to match the movements in the
pension liability through an increased allocation towards debt securities. In addition, we also utilize derivative instruments in our UK defined
benefit pension plans to achieve the desired market exposures or to hedge certain risks. Derivative instruments may include, but are not
limited to, futures, options, swaps or swaptions. Investment types, including the use of derivatives are based on written guidelines
established for each investment manager and monitored by the plan’s investment committee.
Pension trust assets are invested so as to achieve a return on investment, based on levels of liquidity and investment risk that are prudent
and reasonable as circumstances change from time to time. While we recognize the importance of the preservation of capital, we also
adhere to the theory of capital market pricing which maintains that varying degrees of investment risk should be rewarded with
compensating returns. Consequently, prudent risk-taking is justifiable.
The asset allocation decision includes consideration of the non-investment aspects of the PRA and the UK defined benefit pension plan,
including future retirements, lump-sum elections, growth in the number of participants, company contributions, and cash flow. These
characteristics of the plan place certain demands upon the level, risk, and required growth of trust assets. We regularly conduct analyses of
the plan’s current and likely future financial status by forecasting assets, liabilities, benefits and company contributions over time. In so
doing, the impact of alternative investment policies upon the plan’s financial status is measured and an asset mix which balances asset
returns and risk is selected.
Our decision with regard to asset mix is reviewed periodically. Asset mix guidelines include target allocations and permissible ranges for each
asset category. Assets are monitored on an ongoing basis and rebalanced as required to maintain an asset mix within the permissible ranges.
The guidelines will change from time to time, based on an ongoing evaluation of the factors discussed above.
Cash flowsWe expect to make contributions related to continuing operations in the range of $10 to $15 to our U.S. defined benefit pension and
postretirement plans and in the range of $20 to $25 to our non-U.S. defined benefit pension and postretirement plans during 2018.
Total benefit payments expected to be paid from the plans are as follows:
Pension Benefits
U.S. PlansNon-U.S.
Plans TotalPostretirement
Benefits
2018 $13.1 $ 29.7 $ 42.8 $ 2.7
2019 9.6 30.5 40.1 2.6
2020 8.6 31.5 40.1 2.6
2021 8.3 32.2 40.5 2.5
2022 7.9 44.6 52.5 2.4
2023-2027 26.6 227.1 253.7 10.0
Postemployment BenefitsWe provide postemployment benefits, which include salary continuation, severance benefits, disability benefits and continuation of health
care benefits to eligible former employees. The accrued cost for such postemployment benefits was $9.7 and $15.0 at December 31, 2017
and 2016, respectively, and was included in employee benefit plans in our Consolidated Balance Sheets.

Supplemental Retirement ProgramsIn the U.S., in addition to qualified retirement plans (i.e., the PSA and the PRA), we also maintain unfunded non-qualified plans. We offer a
non-qualified deferred compensation plan, the Avon Products, Inc. Deferred Compensation Plan (the “DCP”), for certain higher paid key
employees. The DCP is an unfunded, unsecured plan for which obligations are paid to participants out of our general assets. The DCP allows
for the deferral of up to 50% of a participant’s base salary, the deferral of up to 100% of incentive compensation bonuses, and the deferral
of contributions that would normally have been made to the PSA but are not deferred because the amount was in excess of U.S. Internal
Revenue Code limits on contributions to the PSA. Participants may elect to have their deferred compensation invested in one or more of
three permitted investment alternatives. Expense associated with the DCP was $1.4 in 2017, $1.0 in 2016 and $.5 in 2015. The benefit
obligation under the DCP was $21.0 at December 31, 2017 and $26.1 at December 31, 2016 and was included in other liabilities and
accrued compensation in our Consolidated Balance Sheets.
We maintain supplemental retirement programs consisting of the Supplemental Executive Retirement Plan of Avon Products, Inc. (“SERP”)
and the Benefit Restoration Pension Plan of Avon Products, Inc (“BRP”). under which non-qualified supplemental pension benefits are paid
to higher paid key employees in addition to amounts received under our qualified defined benefit retirement plan, which is subject to IRS
limitations on covered compensation. The SERP has not been offered to new employees in the last eight years, and the BRP is closed to
employees hired on or after January 1, 2015 in conjunction with the closure of the PRA. The annual cost of these programs has been
included in the determination of the net periodic benefit cost shown previously and amounted to $3.0 in 2017, $3.9 in 2016 and $6.3 in
2015. The benefit obligation under these programs was $12.3 at December 31, 2017 and $12.1 at December 31, 2016 and was included in
employee benefit plans and accrued compensation in our Consolidated Balance Sheets.
We also maintain a Supplemental Life Plan (“SLIP”) under which additional death benefits ranging from $.4 to $2.0 are provided to certain
active and retired officers. The SLIP has not been offered to new officers in over seven years.
We established a grantor trust to provide assets that may be used for the benefits payable under the SERP and SLIP. The trust is irrevocable
and, although subject to creditors’ claims, assets contributed to the trust can only be used to pay such benefits with certain exceptions. The
assets held in the trust are included in other assets and at December 31 consisted of the following:
2017 2016
Corporate-owned life insurance policies $36.0 $34.9
Cash and cash equivalents 1.1 .3
Total $37.1 $35.2
The assets are recorded at fair market value, except for investments in corporate-owned life insurance policies which are recorded at their
cash surrender values as of each balance sheet date, which is a proxy of fair value. Changes in the cash surrender value during the period are
recorded as a gain or loss within selling, general and administrative expenses in our Consolidated Statements of Operations.
NOTE 14. Segment Information
Our reportable segments are based on geographic operations in four regions: Europe, Middle East & Africa; South Latin America; North Latin
America; and Asia Pacific. The segments have similar business characteristics and each offers similar products through similar customer
access methods.
The accounting policies of the segments are the same as those described in Note 1, Description of the Business and Summary of Significant
Accounting Policies. We evaluate the performance of our segments based on revenues and segment profits or losses. Segment revenues
primarily reflect direct sales of products to Representatives based on the Representative’s geographic location.
We determine segment profit by deducting the related costs and expenses from segment revenue. In order to ensure comparability between
periods, segment profit includes an allocation of global marketing expenses based on actual revenues. Segment profit excludes global
expenses other than the allocation of marketing, costs to implement (“CTI”) restructuring initiatives (see Note 16, Restructuring Initiatives), a
loss contingency related to a non-U.S. pension plan (see Note 13, Employee Benefit Plans), certain significant asset impairment charges (see
Note 19, Goodwill), and other items, which are not allocated to a particular segment, if applicable. This is consistent with the manner in
which we assess our performance and allocate resources.
A V O N 2017 F-43

NOTES TO CONSOLIDATED FINANCIAL STATEMENTS
Other operating segments and business activities include the business results for Liz Earle, which was sold in July 2015, Venezuela, as it was
deconsolidated effective March 31, 2016, as well as markets that have been exited. Effective in the first quarter of 2017, given that we
exited Thailand during 2016, the results of Thailand are now reported in Other operating segments and business activities for all periods
presented, while previously the results had been reported in Asia Pacific. Other operating segments and business activities also include
revenue from the sale of products to New Avon since the separation of the Company’s North America business into New Avon on March 1,
2016 and ongoing royalties from the licensing of our name and products.
Summarized financial information concerning our reportable segments as of December 31 is shown in the following tables:
Total Revenue
2017 2016 2015
Europe, Middle East & Africa $2,126.5 $2,138.2 $2,229.2
South Latin America 2,222.4 2,145.9 2,309.6
North Latin America 811.8 829.9 901.0
Asia Pacific 518.3 549.7 616.8
Total segment revenue 5,679.0 5,663.7 6,056.6
Other operating segments and business activities 36.6 54.0 103.9
Total revenue $5,715.6 $5,717.7 $6,160.5
Operating Profit
2017 2016 2015
Segment Profit
Europe, Middle East & Africa $ 330.6 $ 329.9 $ 311.2
South Latin America 194.1 200.5 238.9
North Latin America 81.8 114.4 107.2
Asia Pacific 47.7 60.6 69.4
Total segment profit 654.2 705.4 726.7
Other operating segments and business activities 5.2 5.3 16.1
Unallocated global expenses (307.7) (338.6) (391.2)
CTI restructuring initiatives (60.2) (77.4) (49.1)
Loss contingency (18.2) – –
Legal settlement(1) – 27.2 –
Venezuelan special items – – (120.2)
Pension settlement charge – – (7.3)
Other items – – (3.1)
Asset impairment and other charges – – (6.9)
Operating profit $ 273.3 $ 321.9 $ 165.0
(1) In the third quarter of 2016, we settled claims relating to professional services that had been provided to the Company prior to 2013 in connection with apreviously disclosed legal matter. The proceeds, net of legal fees, of $27.2 before tax ($27.2 after tax) were recognized as a reduction of SG&A in the thirdquarter of 2016 and were subsequently received by the Company in the fourth quarter of 2016.

Total Assets
2017 2016 2015
Europe, Middle East & Africa $1,190.5 $ 949.3 $ 909.9
South Latin America 1,273.6 1,306.3 1,126.8
North Latin America 335.8 344.4 368.3
Asia Pacific 296.9 295.4 315.0
Total from reportable segments 3,096.8 2,895.4 2,720.0
Total from discontinued operations(2) – 1.3 371.2
Other operating segments .9 2.9 50.5
Global 600.2 519.3 628.7
Total assets(2) $3,697.9 $3,418.9 $3,770.4
(2) Total assets from discontinued operations and total assets at December 31, 2015 in the table above exclude the $100.0 receivable from continuing operationsthat was presented within current assets of discontinued operations. See Note 3, Discontinued Operations and Divestitures.
Capital Expenditures
2017 2016 2015
Europe, Middle East & Africa $29.4 $18.8 $17.2
South Latin America 35.4 39.2 42.0
North Latin America 12.9 11.7 9.7
Asia Pacific 2.3 4.5 3.5
Total from reportable segments 80.0 74.2 72.4
Other operating segments – – 4.8
Global 17.3 18.8 15.2
Total capital expenditures $97.3 $93.0 $92.4
Depreciation and Amortization
2017 2016 2015
Europe, Middle East & Africa $ 29.9 $ 28.2 $ 29.0
South Latin America 34.3 30.9 34.2
North Latin America 13.6 13.1 14.2
Asia Pacific 9.3 11.1 13.4
Total from reportable segments 87.1 83.3 90.8
Other operating segments – .6 4.6
Global 26.9 30.0 30.7
Total depreciation and amortization $114.0 $113.9 $126.1
Total Revenue by Major CountryA major country is defined as one with total revenues greater than 10% of consolidated total revenues.
2017 2016 2015
Brazil $1,263.8 $1,220.4 $1,252.6
All other 4,451.8 4,497.3 4,907.9
Total $5,715.6 $5,717.7 $6,160.5
A V O N 2017 F-45

NOTES TO CONSOLIDATED FINANCIAL STATEMENTS
Long-Lived Assets by Major CountryA major country is defined as one with long-lived assets greater than 10% of consolidated long-lived assets, and also includes our country of
domicile (the U.S.). Long-lived assets primarily include property, plant and equipment associated with our continuing operations. Long-lived
assets in Brazil consist primarily of property, plant and equipment related to manufacturing and distribution facilities and long-lived assets in
the U.S. consist primarily of property, plant and equipment, including our global research and development facility.
2017 2016 2015
Brazil $ 396.9 $ 400.9 $ 302.7
U.S. 174.4 196.1 225.9
All other 554.3 559.9 597.3
Total $1,125.6 $1,156.9 $1,125.9
NOTE 15. Leases and Commitments
Minimum rental commitments under noncancellable operating leases, primarily for equipment and office facilities at December 31, 2017,
are included in the following table under leases. Purchase obligations include commitments to purchase paper, inventory and other services.
Year LeasesPurchase
Obligations
2018 $ 60.2 $190.1
2019 49.5 142.0
2020 39.0 79.3
2021 29.2 39.2
2022 27.1 19.9
Later years 66.6 8.6
Sublease rental income (75.5) N/A
Total $196.1 $479.1
Rent expense was $66.2 in 2017, $75.0 in 2016 and $74.4 in 2015. Plant construction, expansion and modernization projects with an
estimated cost to complete of $33.0 were in progress at December 31, 2017.
NOTE 16. Restructuring Initiatives
Transformation PlanIn January 2016, we initiated a transformation plan (“the Transformation Plan”), which included cost reduction efforts to continue to
improve our cost structure and to enable us to reinvest in growth. Under this plan, we had targeted pre-tax annualized cost savings of
approximately $350 after three years, with an estimated $200 from supply chain reductions and an estimated $150 from other cost
reductions, which were expected to be achieved through restructuring actions, as well as other cost-savings strategies that would not result
in restructuring charges. We have reinvested and continue to plan to reinvest a portion of these cost savings in growth initiatives, including
media, social selling and information technology systems that will help us modernize our business. We had initiated the Transformation Plan
in an attempt to enable us to achieve our long-term goals of mid-single-digit constant-dollar revenue growth and low double-digit operating
margin. As part of the Transformation Plan, we identified certain actions, that we believe will reduce ongoing costs, primarily consisting of
global headcount reductions relating to operating model changes, as well as the closure of Australia, New Zealand and Thailand, which
were smaller, under-performing markets. The operating model changes include the streamlining of our corporate functions to align with the
current and future needs of the business and an information technology infrastructure outsourcing initiative.
As a result of the restructuring actions approved-to-date, we have recorded total costs to implement these restructuring initiatives of
$166.9 before taxes, of which $60.8 was recorded during the year ended December 31, 2017, in our Consolidated Statements of
Operations. The additional charges not yet incurred associated with the restructuring actions approved to-date of approximately $15 to $20
before taxes are expected to be recorded primarily in 2018. At this time we are unable to quantify the total costs to implement the
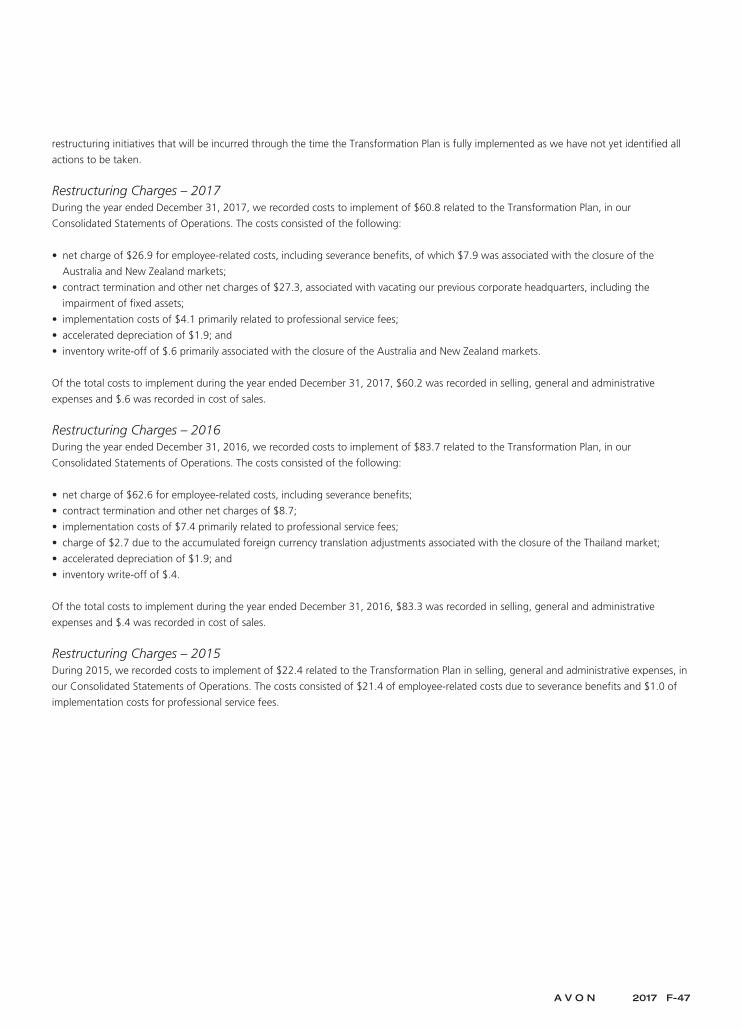
restructuring initiatives that will be incurred through the time the Transformation Plan is fully implemented as we have not yet identified all
actions to be taken.
Restructuring Charges – 2017During the year ended December 31, 2017, we recorded costs to implement of $60.8 related to the Transformation Plan, in our
Consolidated Statements of Operations. The costs consisted of the following:
• net charge of $26.9 for employee-related costs, including severance benefits, of which $7.9 was associated with the closure of the
Australia and New Zealand markets;
• contract termination and other net charges of $27.3, associated with vacating our previous corporate headquarters, including the
impairment of fixed assets;
• implementation costs of $4.1 primarily related to professional service fees;
• accelerated depreciation of $1.9; and
• inventory write-off of $.6 primarily associated with the closure of the Australia and New Zealand markets.
Of the total costs to implement during the year ended December 31, 2017, $60.2 was recorded in selling, general and administrative
expenses and $.6 was recorded in cost of sales.
Restructuring Charges – 2016During the year ended December 31, 2016, we recorded costs to implement of $83.7 related to the Transformation Plan, in our
Consolidated Statements of Operations. The costs consisted of the following:
• net charge of $62.6 for employee-related costs, including severance benefits;
• contract termination and other net charges of $8.7;
• implementation costs of $7.4 primarily related to professional service fees;
• charge of $2.7 due to the accumulated foreign currency translation adjustments associated with the closure of the Thailand market;
• accelerated depreciation of $1.9; and
• inventory write-off of $.4.
Of the total costs to implement during the year ended December 31, 2016, $83.3 was recorded in selling, general and administrative
expenses and $.4 was recorded in cost of sales.
Restructuring Charges – 2015During 2015, we recorded costs to implement of $22.4 related to the Transformation Plan in selling, general and administrative expenses, in
our Consolidated Statements of Operations. The costs consisted of $21.4 of employee-related costs due to severance benefits and $1.0 of
implementation costs for professional service fees.
A V O N 2017 F-47
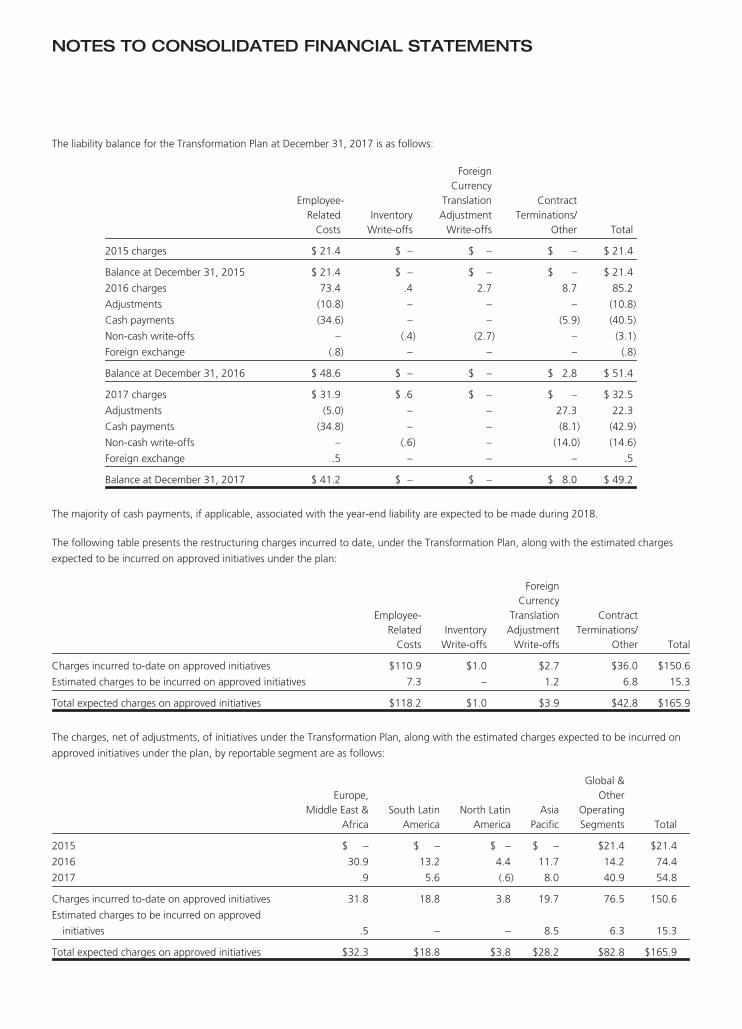
NOTES TO CONSOLIDATED FINANCIAL STATEMENTS
The liability balance for the Transformation Plan at December 31, 2017 is as follows:
Employee-Related
CostsInventory
Write-offs
ForeignCurrency
TranslationAdjustment
Write-offs
ContractTerminations/
Other Total
2015 charges $ 21.4 $ – $ – $ – $ 21.4
Balance at December 31, 2015 $ 21.4 $ – $ – $ – $ 21.4
2016 charges 73.4 .4 2.7 8.7 85.2
Adjustments (10.8) – – – (10.8)
Cash payments (34.6) – – (5.9) (40.5)
Non-cash write-offs – (.4) (2.7) – (3.1)
Foreign exchange (.8) – – – (.8)
Balance at December 31, 2016 $ 48.6 $ – $ – $ 2.8 $ 51.4
2017 charges $ 31.9 $ .6 $ – $ – $ 32.5
Adjustments (5.0) – – 27.3 22.3
Cash payments (34.8) – – (8.1) (42.9)
Non-cash write-offs – (.6) – (14.0) (14.6)
Foreign exchange .5 – – – .5
Balance at December 31, 2017 $ 41.2 $ – $ – $ 8.0 $ 49.2
The majority of cash payments, if applicable, associated with the year-end liability are expected to be made during 2018.
The following table presents the restructuring charges incurred to date, under the Transformation Plan, along with the estimated charges
expected to be incurred on approved initiatives under the plan:
Employee-Related
CostsInventory
Write-offs
ForeignCurrency
TranslationAdjustment
Write-offs
ContractTerminations/
Other Total
Charges incurred to-date on approved initiatives $110.9 $1.0 $2.7 $36.0 $150.6
Estimated charges to be incurred on approved initiatives 7.3 – 1.2 6.8 15.3
Total expected charges on approved initiatives $118.2 $1.0 $3.9 $42.8 $165.9
The charges, net of adjustments, of initiatives under the Transformation Plan, along with the estimated charges expected to be incurred on
approved initiatives under the plan, by reportable segment are as follows:
Europe,Middle East &
AfricaSouth Latin
AmericaNorth Latin
AmericaAsia
Pacific
Global &Other
OperatingSegments Total
2015 $ – $ – $ – $ – $21.4 $21.4
2016 30.9 13.2 4.4 11.7 14.2 74.4
2017 .9 5.6 (.6) 8.0 40.9 54.8
Charges incurred to-date on approved initiatives 31.8 18.8 3.8 19.7 76.5 150.6
Estimated charges to be incurred on approved
initiatives .5 – – 8.5 6.3 15.3
Total expected charges on approved initiatives $32.3 $18.8 $3.8 $28.2 $82.8 $165.9
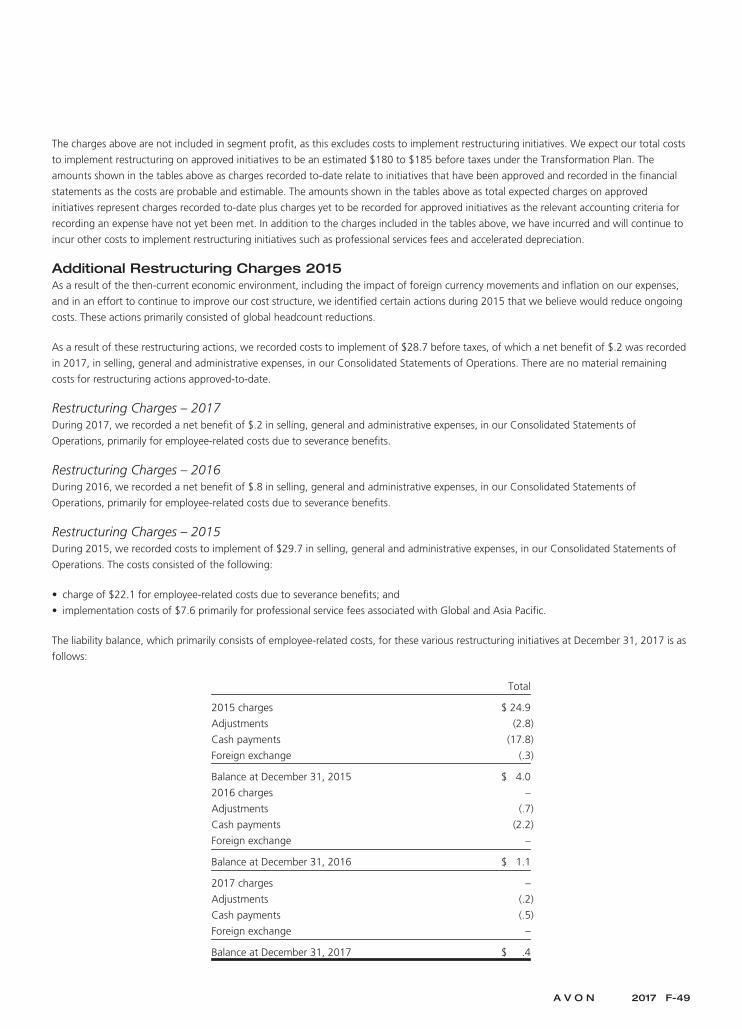
The charges above are not included in segment profit, as this excludes costs to implement restructuring initiatives. We expect our total costs
to implement restructuring on approved initiatives to be an estimated $180 to $185 before taxes under the Transformation Plan. The
amounts shown in the tables above as charges recorded to-date relate to initiatives that have been approved and recorded in the financial
statements as the costs are probable and estimable. The amounts shown in the tables above as total expected charges on approved
initiatives represent charges recorded to-date plus charges yet to be recorded for approved initiatives as the relevant accounting criteria for
recording an expense have not yet been met. In addition to the charges included in the tables above, we have incurred and will continue to
incur other costs to implement restructuring initiatives such as professional services fees and accelerated depreciation.
Additional Restructuring Charges 2015As a result of the then-current economic environment, including the impact of foreign currency movements and inflation on our expenses,
and in an effort to continue to improve our cost structure, we identified certain actions during 2015 that we believe would reduce ongoing
costs. These actions primarily consisted of global headcount reductions.
As a result of these restructuring actions, we recorded costs to implement of $28.7 before taxes, of which a net benefit of $.2 was recorded
in 2017, in selling, general and administrative expenses, in our Consolidated Statements of Operations. There are no material remaining
costs for restructuring actions approved-to-date.
Restructuring Charges – 2017During 2017, we recorded a net benefit of $.2 in selling, general and administrative expenses, in our Consolidated Statements of
Operations, primarily for employee-related costs due to severance benefits.
Restructuring Charges – 2016During 2016, we recorded a net benefit of $.8 in selling, general and administrative expenses, in our Consolidated Statements of
Operations, primarily for employee-related costs due to severance benefits.
Restructuring Charges – 2015During 2015, we recorded costs to implement of $29.7 in selling, general and administrative expenses, in our Consolidated Statements of
Operations. The costs consisted of the following:
• charge of $22.1 for employee-related costs due to severance benefits; and
• implementation costs of $7.6 primarily for professional service fees associated with Global and Asia Pacific.
The liability balance, which primarily consists of employee-related costs, for these various restructuring initiatives at December 31, 2017 is as
follows:
Total
2015 charges $ 24.9
Adjustments (2.8)
Cash payments (17.8)
Foreign exchange (.3)
Balance at December 31, 2015 $ 4.0
2016 charges –
Adjustments (.7)
Cash payments (2.2)
Foreign exchange –
Balance at December 31, 2016 $ 1.1
2017 charges –
Adjustments (.2)
Cash payments (.5)
Foreign exchange –
Balance at December 31, 2017 $ .4
A V O N 2017 F-49

NOTES TO CONSOLIDATED FINANCIAL STATEMENTS
The majority of cash payments, if applicable, associated with this liability are expected to be made during 2018.
The charges approved to date under these various restructuring initiatives by reportable business segment were as follows:
Europe,Middle East &
AfricaSouth Latin
AmericaNorth Latin
AmericaAsia
Pacific
Global &Other
OperatingSegments Total
Total charges incurred $4.2 $2.6 $.2 $5.7 $8.4 $21.1
In addition to the charges included in the tables above, we have incurred other costs to implement restructuring initiatives such as
professional services fees.
Other Restructuring InitiativesDuring 2017, 2016 and 2015, we recorded net benefits of $.4, $5.5 and $3.0, respectively, primarily in selling, general and administrative
expenses, in our Consolidated Statements of Operations, associated with the restructuring programs launched in 2005 and 2009 and the
restructuring initiative launched in 2012 (the “Other Restructuring Initiatives”), each of which are substantially complete. The net benefit in
2016 primarily consisted of a net gain of $3.7 due to the sale of a distribution center in the U.S. The liability balance associated with the
Other Restructuring Initiatives is not material at December 31, 2017.
NOTE 17. Series C Convertible Preferred Stock
On March 1, 2016, the Company issued and sold to Cerberus Investor 435,000 shares of newly issued series C preferred stock for an
aggregate purchase price of $435.0 pursuant to an Investment Agreement, dated as of December 17, 2015, between the Company and
Cerberus Investor. In connection with the issuance of the series C preferred stock, the Company incurred direct and incremental expenses of
$8.7, comprised of financial advisory fees and legal expenses, which reduced the carrying value of the series C preferred stock. Cumulative
preferred dividends accrue daily on the series C preferred stock at a rate of 1.25% per quarter. The series C preferred stock had accrued
unpaid dividends of $41.5 as of December 31, 2017. There were no dividends declared in the years ended December 31, 2017 and 2016.
Dividend Rights. The series C preferred stock ranks senior to the shares of our common stock with respect to dividend rights and rights on
the distribution of assets on any liquidation, dissolution or winding up of our affairs. The series C preferred stock has a liquidation preference
of $1,000 per share, representing an aggregate liquidation preference of $435.0 upon issuance. Holders of series C preferred stock are
entitled to participate on an as-converted basis in any dividends paid to the holders of shares of the Company’s common stock. In addition,
cumulative preferred dividends accrue daily on the series C preferred stock and are payable at a rate of 1.25% per quarter (net of any
dividends on the Company’s common stock and subject to increase up to a maximum rate of 5.00% per quarter if the Company breaches
certain obligations). Except to the extent not otherwise previously paid by the Company, preferred dividends are payable on the seventh
anniversary of the issuance date of the series C preferred stock as and when declared by the Board of Directors and at the end of each
quarter thereafter. Accrued and unpaid preferred dividends may be paid, at the Company’s option, (i) in cash, (ii) subject to certain
conditions, in shares of the Company’s common stock or (iii) upon conversion of shares of series C preferred stock, in shares of the
Company’s non-voting, non-convertible Series D Preferred Stock. Any such shares of Series D Preferred Stock issued would have similar
preferential rights.
Conversion Features. series C preferred stock is convertible at the option of the holders at any time into shares of the Company’s common
stock at an initial conversion price of $5.00 per share, subject to certain anti-dilution adjustments. Prior to receipt of applicable shareholder
approval, shares of series C preferred stock are not convertible into more than 19.99% of the number of shares of common stock
outstanding immediately prior to the issuance of the series C preferred stock, subject to certain anti-dilution adjustments. As of
December 31, 2017, series C preferred stock was convertible into 87,051,524 shares of common stock. If at any time the volume weighted
average price of the common stock exceeds $10.00 per share (subject to certain anti-dilution adjustments) for a period of 30 consecutive
trading days, the Company may cause all of the series C preferred stock to be converted into shares of common stock based on the then
applicable conversion price.
Voting Rights. Holders of series C preferred stock are entitled to vote generally with the holders of common stock on an as-converted basis.
Holders of series C preferred stock are also entitled to a separate class vote with respect to (i) the election of up to three directors to the

Board of Directors, subject to maintaining certain levels of beneficial ownership of series C preferred stock and/or common stock,
(ii) amendments to the Company’s organizational documents that have an adverse effect on the series C preferred stock, (iii) issuances by
the Company of securities that are senior to, or equal in priority with, the series C preferred stock or (iv) the delisting of the Company’s
common stock, other than in connection with a change of control event.
Change of Control Put. Upon certain change of control events involving the Company, holders of series C preferred stock can require the
Company to repurchase the series C preferred stock for an amount equal to the greater of (i) an amount in cash equal to 100% of the
liquidation preference thereof plus all accrued but unpaid dividends or (ii) the consideration the holders would have received if they had
converted their shares of series C preferred stock into common stock immediately prior to the change of control event.
NOTE 18. Contingencies
Settlements of FCPA InvestigationsAs previously reported, we engaged outside counsel to conduct an internal investigation and compliance reviews focused on compliance
with the Foreign Corrupt Practices Act (“FCPA”) and related U.S. and foreign laws in China and additional countries. The internal
investigation, which was conducted under the oversight of our Audit Committee, began in June 2008 and along with the compliance
reviews, was completed in 2014.
Following our voluntary reporting of the internal investigation to both the U.S. Department of Justice (the “DOJ”) and the U.S. Securities and
Exchange Commission (the “SEC”) and our subsequent cooperation with those agencies, the United States District Court for the Southern
District of New York (the “USDC”) approved in December 2014 a deferred prosecution agreement (“DPA”) entered into between the
Company and the DOJ related to charges of violations of the books and records and internal controls provisions of the FCPA. In addition,
Avon Products (China) Co. Ltd., a subsidiary of the Company operating in China, pleaded guilty to conspiring to violate the books and
records provision of the FCPA and was sentenced by the USDC to pay a $68 fine. The SEC also filed a complaint against the Company
charging violations of the books and records and internal controls provisions of the FCPA and a consent to settlement (the “Consent”)
which was approved in a judgment entered by the USDC in January 2015, and included $67 in disgorgement and prejudgment interest. The
DPA, the above-mentioned guilty plea and the Consent resolved the SEC’s and the DOJ’s investigations of the Company’s compliance with
the FCPA and related U.S. laws in China and additional countries. The fine was paid in December 2014 and the payment to the SEC was
made in January 2015.
The DPA has expired, and the charges against the Company were dismissed with prejudice on February 5, 2018.
Under the DPA and the Consent, among other things, the Company agreed to have a compliance monitor (the “monitor”). During July
2015, the Company engaged a monitor, who had been approved by the DOJ and the SEC. The monitor recommended some changes to our
policies and procedures that we have adopted and in August 2017, the monitor certified that the Company’s compliance program was
reasonably designed and implemented to detect and prevent violations of the anti-corruption laws and was functioning effectively,
consistent with the requirements of the DPA and the Consent. The monitor has been replaced by the Company, which has undertaken self-
reporting obligations for the remainder of the monitoring period. The Company submitted its first self-report to the DOJ and the SEC in
January 2018. The Company will continue self-reporting to the SEC until the monitoring period expires, which is scheduled under the
Consent to occur in July 2018.
The third-party costs incurred in connection with ongoing compliance with self-reporting and the Consent have not been material to date.
While we do not anticipate material costs going forward, the Company’s self-reporting obligations may be costly and/or time-consuming.
Brazilian Tax Assessments
In 2002, our Brazilian subsidiary received an excise tax (IPI) assessment from the Brazilian tax authorities for alleged tax deficiencies during
the years 1997-1998, which was officially closed in favor of Avon Brazil in July 2017. In December 2012, additional assessments were
received for the year 2008 with respect to excise tax (IPI) and taxes charged on gross receipts (PIS and COFINS). In the second quarter of
2014, the PIS and COFINS assessments were officially closed in favor of Avon Brazil. As in the 2002 IPI case, the 2012 IPI assessment asserts
that the establishment in 1995 of separate manufacturing and distribution companies in Brazil was done without a valid business purpose
and that Avon Brazil did not observe minimum pricing rules to define the taxable basis of excise tax. The structure adopted in 1995 is
comparable to that used by many other companies in Brazil. We believe that our Brazilian corporate structure is appropriate, both
operationally and legally, and that the 2012 IPI assessment is unfounded.
A V O N 2017 F-51

NOTES TO CONSOLIDATED FINANCIAL STATEMENTS
These matters are being vigorously contested. In January 2013, we filed a protest seeking a first administrative level review with respect to
the 2012 IPI assessment. In July 2013, the 2012 IPI assessment was upheld at the first administrative level and we appealed this decision to
the second administrative level. The 2012 IPI assessment totals approximately $347, including penalties and accrued interest.
On October 3, 2017, Avon Brazil received a new tax assessment notice regarding IPI for 2014. The 2017 IPI assessment totals approximately
$266, including penalties and accrued interest. In line with the other assessments received in the past, the Brazilian tax authorities assert that
the structure adopted in 2005 has no valid business purpose and that Avon Brazil did not observe minimum pricing rules to define the
taxable basis of excise tax. Avon will vigorously contest this assessment, and presented the first defense on November 1, 2017.
In the event that the 2012 and the 2017 IPI assessments are upheld, it may be necessary for us to provide security to pursue further appeals,
which, depending on the circumstances, may result in a charge to earnings and an adverse effect on the Company’s Consolidated
Statements of Cash Flows. It is not possible to reasonably estimate the likelihood or potential amount of assessments that may be issued for
subsequent periods (tax years up through 2010 are closed by statute). However, other similar IPI assessments involving different periods
(1998-2001) have been canceled and officially closed in our favor by the second administrative level and in July 2017 we received the official
cancellation of the 2002 assessment pursuant to the favorable decision discussed above. We believe that the likelihood that the 2012 and
the 2017 IPI assessments will be upheld is reasonably possible. As stated above, we believe that the 2012 and 2017 IPI assessments are
unfounded. At December 31, 2017, we have not recognized a liability for the 2012 or 2017 IPI assessments.
Brazil IPI Tax on CosmeticsIn May 2015, an Executive Decree on certain cosmetics went into effect in Brazil which increased the amount of IPI taxes that are to be
remitted by Avon Brazil to the taxing authority on the sales of cosmetic products subject to IPI. Avon Brazil filed an objection to this IPI tax
increase on the basis that it is not constitutional. In December 2016, Avon Brazil received a favorable decision from the Federal District Court
regarding this objection. This decision has been appealed by the tax authorities.
From May 2015 through April 2016, Avon Brazil remitted the taxes associated with this IPI tax increase into a judicial deposit which would
be remitted to the taxing authorities in the event that we are not successful in our objection to the tax increase. In May 2016, Avon Brazil
received a favorable preliminary decision on its objection to the tax and was granted a preliminary injunction. As a result, beginning in May
2016, Avon Brazil is no longer required to remit the taxes associated with IPI into a judicial deposit. While an increasing number of recent
preliminary decisions have been in favor of the taxpayer, as of December 31, 2017, we have concluded that it is appropriate to continue to
recognize the associated IPI taxes as a liability. At December 31, 2017, the liability to the taxing authorities for this IPI tax increase was
approximately $193 and was classified within long-term sales taxes and taxes other than income in our Consolidated Balance Sheets, and
the judicial deposit was approximately $74 and was classified within other assets in our Consolidated Balance Sheets. The net liability that
does not have a corresponding judicial deposit was approximately $119 at December 31, 2017 and the interest associated with this net
liability has been and will continue to be recognized in other expense, net. Our cash flow from operations has benefited as compared to our
earnings as we have recognized the expense and associated interest related to this IPI tax in our Consolidated Statements of Operations;
however, since May 2016, we have not made a corresponding cash payment into a judicial deposit based on the preliminary injunction that
is still in force.
An unfavorable ruling to our objection of this IPI tax increase would have an adverse effect on the Company’s Consolidated Statements of
Cash Flows as Avon Brazil would have to remit the liability owed to the taxing authorities. This amount would be partially offset by the
amount of the judicial deposit held by Avon Brazil. We are not able to reliably predict the timing of the outcome of our objection to this tax
increase.
Talc-Related LitigationThe Company has been named a defendant in numerous personal injury lawsuits filed in U.S. courts, alleging that certain talc products the
Company sold in the past were contaminated with asbestos. Many of these actions involve a number of co-defendants from a variety of
different industries, including manufacturers of cosmetics and manufacturers of other products that, unlike the Company’s products, were
designed to contain asbestos. We believe that the claims against us are without merit. We are defending vigorously against these claims and
will continue to do so. To date, there have been no findings of liability against the Company in any of these cases but we are unable to
predict the ultimate outcome of each case. Additional similar cases arising out of the use of the Company’s talc products are reasonably
anticipated. At this time, we are unable to estimate our reasonably possible losses. Also, in light of the litigation’s inherent uncertainties,
potential costs to litigate these cases are not known, but they may be significant, though some costs will be covered by insurance.

Brazilian Labor-Related LitigationOn an ongoing basis, the Company is subject to numerous and diverse labor-related lawsuits filed by employees in Brazil. These cases are
assessed on an aggregated and ongoing basis based on historical outcomes of similar cases. The claims made are often for significantly
larger sums than have historically been paid out by the Company. Our practice continues to be to recognize a liability based on our
assessment of historical payments in similar cases. Our best estimate of the probable loss for such current cases at December 31, 2017 is
approximately $17 and, accordingly, we have recognized a liability for this amount.
Other MattersVarious other lawsuits and claims, arising in the ordinary course of business or related to businesses previously sold, are pending or
threatened against Avon. In management’s opinion, based on its review of the information available at this time, the total cost of resolving
such other contingencies at December 31, 2017, is not expected to have a material adverse effect on our consolidated financial position,
results of operations or cash flows.
NOTE 19. Goodwill
Q4 2015 Egypt Impairment AssessmentDuring the 2015 year-end close process, our analysis of the Egypt business indicated an impairment as the carrying value of the business
exceeded the estimated fair value. This was primarily the result of reducing our long-term projections of the business. During 2015, Egypt
performed generally in line with our revenue and earnings projections, which assumed growth as compared to 2014. However, as a result of
currency restrictions for the payment of goods in Egypt, we lowered our long-term revenue and earnings projections for the business.
Accordingly, a non-cash before tax impairment charge of $6.9 ($6.9 after tax) was recorded to reduce the carrying amount of goodwill.
There is no amount remaining associated with goodwill for our Egypt reporting unit as a result of this impairment charge.
Key assumptions used in measuring the fair value of Egypt during the impairment assessment included projections of revenue and the
resulting cash flows, as well as the discount rate (based on the estimated weighted-average cost of capital). To estimate the fair value of
Egypt, we forecasted revenue and the resulting cash flows over five years using a DCF model which included a terminal value at the end of
the projection period. We believed that a five-year period was a reasonable amount of time in order to return cash flows of Egypt to
normalized, sustainable levels.
Goodwill
Europe, MiddleEast & Africa
South LatinAmerica
AsiaPacific Total
Gross balance at December 31, 2016 $25.6 $72.3 $ 85.0 $182.9
Accumulated impairments (6.9) – (82.4) (89.3)
Net balance at December 31, 2016 $18.7 $72.3 $ 2.6 $ 93.6
Changes during the period ended December 31, 2017:
Foreign exchange 1.7 .4 – 2.1
Gross balance at December 31, 2017 $27.3 $72.7 $ 85.0 $185.0
Accumulated impairments (6.9) – (82.4) (89.3)
Net balance at December 31, 2017 $20.4 $72.7 $ 2.6 $ 95.7
A V O N 2017 F-53

NOTES TO CONSOLIDATED FINANCIAL STATEMENTS
NOTE 20. Supplemental Balance Sheet Information
At December 31, 2017 and 2016, prepaid expenses and other included the following:
Components of Prepaid expenses and other 2017 2016
Prepaid taxes and tax refunds receivable $111.6 $ 99.3Receivables other than trade 67.2 68.3Prepaid brochure costs, paper and other literature 64.8 73.2Other 52.8 50.5
Prepaid expenses and other $296.4 $291.3
At December 31, 2017 and 2016, other assets included the following:
Components of Other assets 2017 2016
Deferred tax assets (Note 9) $203.8 $162.1Capitalized software (Note 1) 85.2 83.9Judicial deposits other than Brazil IPI tax (see below) 82.2 78.0Net overfunded pension plans (Note 13) 82.0 54.8Long-term receivables 75.6 78.9Judicial deposit for Brazil IPI tax on cosmetics (Note 18) 73.8 69.0Trust assets associated with supplemental benefit plans (Note 13) 37.1 35.2Tooling (plates and molds associated with our beauty products) 12.5 14.7Investment in New Avon (Note 4) – 32.8Other 14.0 12.3
Other assets $666.2 $621.7
NOTE 21. Results of Operations by Quarter (Unaudited)
2017 First Second Third Fourth Year
Total revenue $1,333.1 $1,395.9 $1,417.8 $1,568.8 $5,715.6Gross profit 816.0 870.9 867.8 957.6 3,512.3Operating profit(1) 28.7 31.6 83.0 130.0 273.3(Loss) income from continuing operations, before taxes (6.7) (12.2) 48.0 91.6 120.7(Loss) income from continuing operations, net of tax(3) (36.5) (45.8) 11.9 90.4 20.0Net loss attributable to noncontrolling interests – .3 .6 1.1 2.0Net (loss) income attributable to Avon $ (36.5) $ (45.5) $ 12.5 $ 91.5 $ 22.0(Loss) earnings per common share from continuing operations
Basic $ (.10) $ (.12) $ .01 $ .17 $ (.00)(4)
Diluted (.10) (.12) .01 .17 (.00)(4)
2016 First Second Third Fourth Year
Total revenue $1,306.5 $1,434.3 $1,408.8 $1,568.1 $5,717.7Gross profit 787.7 869.3 857.9 945.8 3,460.7Operating profit(1) 7.8 95.1 112.0 107.0 321.9(Loss) income from continuing operations, before taxes(2) (158.1) 71.9 74.6 42.8 31.2(Loss) income from continuing operations, net of tax(3) (155.8) 35.8 36.3 (9.7) (93.4)(Loss) income from discontinued operations, net of tax (9.6) (2.6) (.7) (1.1) (14.0)Net (income) loss attributable to noncontrolling interests (.5) (.2) .4 .1 (.2)Net (loss) income attributable to Avon $ (165.9) $ 33.0 $ 36.0 $ (10.7) $ (107.6)
(Loss) earnings per common share from continuing operationsBasic $ (.38) $ .07 $ .07 $ (.03) $ (.25)(4)
Diluted (.38) .07 .07 (.03) (.25)(4)
(1) Operating profit (loss) was impacted by the following:

2017 First Second Third Fourth Year
Costs to implement restructuring initiatives:
Cost of sales $ (.1) $ – $ – $ .7 $ .6
Selling, general and administrative expenses 10.1 20.3 6.2 23.0 59.6
Total costs to implement restructuring initiatives $10.0 $20.3 $ 6.2 $23.7 $ 60.2
Loss contingency $ – $18.2 $ – $ – $ 18.2
2016 First Second Third Fourth Year
Costs to implement restructuring initiatives:
Cost of sales $ – $ .3 $ – $ .3 $ .6
Selling, general and administrative expenses 46.8 9.1 14.0 6.9 76.8
Total costs to implement restructuring initiatives $46.8 $ 9.4 $ 14.0 $ 7.2 $ 77.4
Legal settlement $ – $ – $(27.2) $ – $(27.2)
In addition to the items impacting operating profit (loss) above:
(2) (Loss) income from continuing operations, before taxes during 2016 was impacted by:
• the deconsolidation of our Venezuelan operations. As a result of the change to the cost method of accounting, in the first quarter of 2016 we recorded a lossof $120.5 in other expense, net. The loss was comprised of $39.2 in net assets of the Venezuelan business and $81.3 in accumulated foreign currencytranslation adjustments within AOCI associated with foreign currency movements before Venezuela was accounted for as a highly inflationary economy;
• a gain on extinguishment of debt of $3.9 before and after tax in the third quarter caused by the deferred gain associated with interest-rate swap agreementterminations, partially offset by the early tender premium paid, the deferred loss associated with treasury lock agreements, deal costs and the write-off ofdebt issuance costs and discounts associated with the cash tender offers in August 2016;
• a loss on extinguishment of debt of $1.0 before and after tax in the fourth quarter caused by the premium paid for the repurchases, the write-off of debtissuance costs and discounts and the deferred loss associated with treasury lock agreements, partially offset by the deferred gain associated with interest-rateswap agreement terminations associated with the debt repurchases in October 2016;
• a loss on extinguishment of debt of $2.9 before and after tax in the fourth quarter caused by the make-whole premium, the deferred loss associated withtreasury lock agreements and the write-off of debt issuance costs and discounts and partially offset by the deferred gain associated with interest-rate swapagreement terminations associated with the prepayment of the remaining principal amount of the 4.20% Notes (as defined in Note 7, Debt and OtherFinancing) and 5.75% Notes (as defined in Note 7, Debt and Other Financing); and
• a gain on extinguishment of debt of $1.1 before and after tax in the fourth quarter consisting of the discount received for the repurchases, partially offset bythe write-off of debt issuance costs and discounts associated with the debt repurchases in December 2016.
(3) (Loss) income from continuing operations, net of tax during 2017 was impacted by a $29.9 net income tax benefit recognized in the fourth quarter as aresult of the enactment of the Tax Cuts and Jobs Act in the U.S., a release of valuation allowances of $25.5 associated with a number of markets in Europe,Middle East & Africa as a result of a business model change related to the move of the Company’s headquarters from the U.S. to the UK, and a $10.4benefit as a result of a favorable court decision in Brazil, partially offset by a charge of $16.0 associated with valuation allowances to adjust deferred taxassets in Mexico.
(Loss) income from continuing operations, net of tax during 2016 was impacted by a charge for valuation allowances for deferred tax assets outside of theU.S of $8.6, which was recorded in the fourth quarter, the release of a valuation allowance associated with Russia of $7.1 which was recorded in thesecond quarter, and an income tax benefit of $29.3 recognized as the result of the implementation of foreign tax planning strategies which was recorded inthe first quarter.
(4) The sum of per share amounts for the quarters does not necessarily equal that for the year because the computations were made independently.
See Note 16, Restructuring Initiatives, “Results Of Operations – Consolidated” within MD&A on pages 37 through 46, Note 14, Segment
Information, “Venezuela Discussion” within MD&A on pages 41 through 42, Note 1, Description of the Business and Summary of Significant
Accounting Policies, Note 13, Employee Benefit Plans, Note 18, Contingencies, Note 7, Debt and Other Financing and Note 8, Income Taxes,
for more information on these items.
A V O N 2017 F-55

SCHEDULE II
AVON PRODUCTS, INC. AND SUBSIDIARIESVALUATION AND QUALIFYING ACCOUNTS
Years ended December 31, 2017, 2016 and 2015
Additions
(In millions) Description
Balanceat
Beginningof Period
Chargedto Costs
andExpenses
Chargedto
Revenue Deductions
Balanceat End of
Period
2017Allowance for doubtful accounts receivable $ 122.9 $ 221.9 $ — $(215.5)(1) $ 129.3
Allowance for sales returns 8.2 — 197.9 (196.8)(2) 9.3
Allowance for inventory obsolescence 58.4 36.7 — (33.8)(3) 61.3
Deferred tax asset valuation allowance 3,296.0 (78.4)(4) — — 3,217.6
2016Allowance for doubtful accounts receivable $ 77.6 $ 190.5 $ — $(145.2)(1) $ 122.9
Allowance for sales returns 9.1 — 186.9 (187.8)(2) 8.2
Allowance for inventory obsolescence 71.3 36.5 — (49.4)(3) 58.4
Deferred tax asset valuation allowance 2,090.1 1,205.9(5) — — 3,296.0
2015Allowance for doubtful accounts receivable $ 93.7 $ 144.1 $ — $(160.2)(1) $ 77.6
Allowance for sales returns 13.2 — 190.8 (194.9)(2) 9.1
Allowance for inventory obsolescence 98.9 45.4 — (73.0)(3) 71.3
Deferred tax asset valuation allowance 1,480.6 609.5(5) — — 2,090.1
(1) Accounts written off, net of recoveries and foreign currency translation adjustment.
(2) Returned product reused or destroyed and foreign currency translation adjustment.
(3) Obsolete inventory destroyed and foreign currency translation adjustment.
(4) Decrease in valuation allowance primarily related to a partial release of the U.S. valuation allowance as a result of the enactment of the Tax Cuts and Jobs Actin the U.S. and the impact of a business model change related to the move of the Company’s headquarters from the U.S. to the UK.
(5) Increase in valuation allowance primarily for deferred tax assets that are not more likely than not to be realized in the future.


We are proud of what we representWe are
determinedindependent
bravecourageouspassionate
strong
We are

Board of Directors* Corporate Information
Chan W. GalbatoNon-Executive Chairman
Avon Products, Inc.
Chief Executive Offi cer
Cerberus Operations and Advisory Company, LLC
Jan ZijderveldChief Executive Offi cer
Avon Products, Inc.
W. Don CornwellLead Independent Director
Avon Products, Inc.
Former Chairman and
Chief Executive Offi cer
Granite Broadcasting Corporation
Helen McCluskeyFormer President and
Chief Executive Offi cer
The Warnaco Group
Charles H. NoskiFormer Vice Chairman
Bank of America Corporation
Cathy D. RossFormer Executive Vice President
and Chief Financial Offi cer
FedEx Express
Michael F. SanfordManaging Director and Co-Head
North American Private Equity
Cerberus Capital Management, L.P.
Nancy KilleferFormer Senior Partner
McKinsey & Company
Jose ArmarioFormer Corporate Executive
Vice President of Worldwide Supply Chain,
Development and Franchising
McDonald´s Corporation
Susan J. KropfFormer President and
Chief Operating Offi cer
Avon Products, Inc.
Lenard B. TesslerVice Chairman and
Senior Managing Director
Cerberus Capital Management, L.P.
For information on the company’s Executive Offi cers, please see the proxy statement.
*As of March 20, 2018
Avon Products, Inc.Building 6, Chiswick Park
London, W4 5HR
United Kingdom
+44 1604 232425
www.avoncompany.com
Independent Registered Public Accounting FirmPricewaterhouseCoopers LLP
1 Embankment Place, London WC2N 6RH, United Kingdom
Institutional Investor InquiriesPlease call Gina Grant at 203-682-8200or email [email protected]
Individual Investor InquiriesFor questions regarding stock certifi cates or accounts,
or Avon’s direct stock purchase plan, contact our
Stock Transfer Agent and Registrar at Computershare Investor Services
250 Royall Street
Canton, MA 02021
(781) 575-2723www.computershare.com
For other investor questions or document requests,
please visit our website at www.avoncompany.com; email [email protected]; or call 203-682-8200
Form 10-KThe company’s 2017 Annual Report (Form 10-K) can be
viewed on the Internet at www.avoninvestor.com
For information about becoming an Avon Representative or purchasing Avon products, please visit www.avoncompany.com
Annual Report design by Avon Corporate Identity
Paper: Cover and Narrative have 10% Post-Consumer waste
content. All paper is FSC Certifi ed and Recyclable.