Embed Size (px)
Citation preview
Maximising Gas Well Potential in the BreaghField by Mitigating Formation Damage
Colin McPhee, Michael Judt, Darren McRae, Senergy (GB) Ltd, and John Rapach, Sterling Resources UK Ltd

When is formation damage important?
! Prospect/development planning! correct selection of field development options! consideration of formation damage should be an integral
part of production or injection optimisation process! Development wells
! best to minimise damage! but can also remove damage
! Exploration and appraisal wells! formation damage mitigation is often sacrificed on the alter
of drilling expediency! recognising and diagnosing formation damage can unlock
hidden reservoir potential! Example - Breagh field, Southern North Sea
! many others exist

Breagh Field background
! Breagh located NW gas basin in Southern North Sea
! Reservoir in distributorychannel, Scremerstonformation sands of Lower Carboniferous age, preserved below Permian unconformity
! Well 42/13-2 (1997)! poor test results – original
operator relinquished licence
SOUTH NORTH
Cleveland Basin Dogger High
Breagh Gas Accumulation
Top Triassic
Top Zechstein
Top Rotliegend
Top Carboniferous
Base ChalkLate Cretaceous-Early Tertiary Inversion
SOUTH NORTH
Cleveland Basin Dogger High
Breagh Gas Accumulation
Top Triassic
Top Zechstein
Top Rotliegend
Top Carboniferous
Base ChalkLate Cretaceous-Early Tertiary Inversion
SOUTH NORTH
Cleveland Basin Dogger High
Breagh Gas Accumulation
Top Triassic
Top Zechstein
Top Rotliegend
Top Carboniferous
Base ChalkLate Cretaceous-Early Tertiary Inversion
SOUTH NORTH
Cleveland Basin Dogger High
Breagh Gas Accumulation
Top Triassic
Top Zechstein
Top Rotliegend
Top Carboniferous
Base ChalkLate Cretaceous-Early Tertiary Inversion
72007200
72007200
72007200
72007200
72007200
72007200
72007200
7700
7700
77007700
77007700
77007700
77007700
77007700
77007700
77007700
77007700
77007700
77007700
77007700
7700
7700
77007700
77007700
77007700
77007700
77007700
77007700
77007700
7700
7700
77007700
82008200
82008200
82008200
82008200
82008200
87008700
0 24E
0 24E
0 36E
0 36E
54 3
5N
54 3
5N
330,000
330,000
340,000
340,000
6,05
0,00
0
6,05
0,00
0
42/13-1
42/13-2
42/13-3
0 1000 2000
metres
N

42/13-2 results
Pore filling illitePore filling kaolinite
Quartz overgrowths
Pore filling illitePore filling kaolinite
Quartz overgrowths
Pore filling illitePore filling kaolinite
Quartz overgrowths
Pore filling illitePore filling kaolinite
Quartz overgrowths
! Reservoir properties! 66 ft pay in 400 ft gas column! average ! =13.4%! average Sw = 32%
! Core properties! 0.5 mD to 478 mD (average ~ 10 mD) ! 3%-5% pore filling clays (kaolinite and
illite)! 36% to 45% of pore throats < 1 micron
! Test results! produced at only 3 mmscf/d! main pressure build up was affected by
changing well bore storage, masking the radial flow period
! match to log-log derivative plot of the main pressure drawdown indicated mean kh of 158 mDft and damage skin (S) of +47

42/13-2 formation damage indications
! Reservoir exposed to heavy salt brine at around 400 psi overbalance then displaced with sea water! 5 intervals perforated at 1550
psi underbalance using TCP-conveyed 4 ½” RDX guns
! WBM filtrate invasion between 30 – 60 inches from the wellbore (7450 ft to 7500 ft MD)
! perfs may not have penetrated beyond invaded and damaged zone! strong formation with coarse
angular grains & high friction angle
! New operator recognisedpotential! commissioned integrated
study to evaluate well results and drill and complete new appraisal well utilising best practice in well construction
Logs show deep invasion between 7450 ft and 7500 ft mDLogs show deep invasion between 7450 ft and 7500 ft mD

Appraisal well 42/13-3 design
! Assess the potential deliverability of the Lower Carboniferous reservoir from an undamaged formation.
! Vertical cased and perforated well! Key issues in well design:
! could the reservoir section be drilled at minimum overbalance without compromising drilling or completion operations?
! could the well be tested or produced without sand failure or sand production (common problem in SNS)?
! could the well DIF be designed to prevent or minimise formation damage during conventional drilling?
! Underbalance drilling had cost issues! drill conventionally at minimum safe overbalance (+ 0.4 ppg)
! Integrated geomechanics/formation damage study! evaluate wellbore stability with 10.1 ppg mud! assess risk of sand failure and sand production during testing! characterise formation properties and carry out return
permeability tests using water-based and oil-based DIFs

Return permeability tests on 42/13-2 core
! WB and OB DIFs formulated on basis of:! average formation permeability ~ 10 mD! clay content (3% - 5%) and pore size
distribution (~40% < 0.5 micron)! Return permeability tests at reservoir
conditions! replicate field placement/overbalance
(from 10.1 ppg mud)! 48 hours dynamic imbibition and 48 hours
static imbibition! Imbibition (fluid loss)
! Monitor DIF fluid loss (fraction of pore volume)
! kg versus kg (reference)! after DIF exposure (worst case)! after mud cake removed (best case)! after remaining filtrate spun out
(permanent damage)
0
0.1
0.2
0.3
0.4
0.5
0.6
0.7
0.8
0.9
1
0.001 0.01 0.1 1 10 100
Pore Throat Size Radius (microns)
Mer
cury
Sat
urat
ion
(PV)
Microporosity
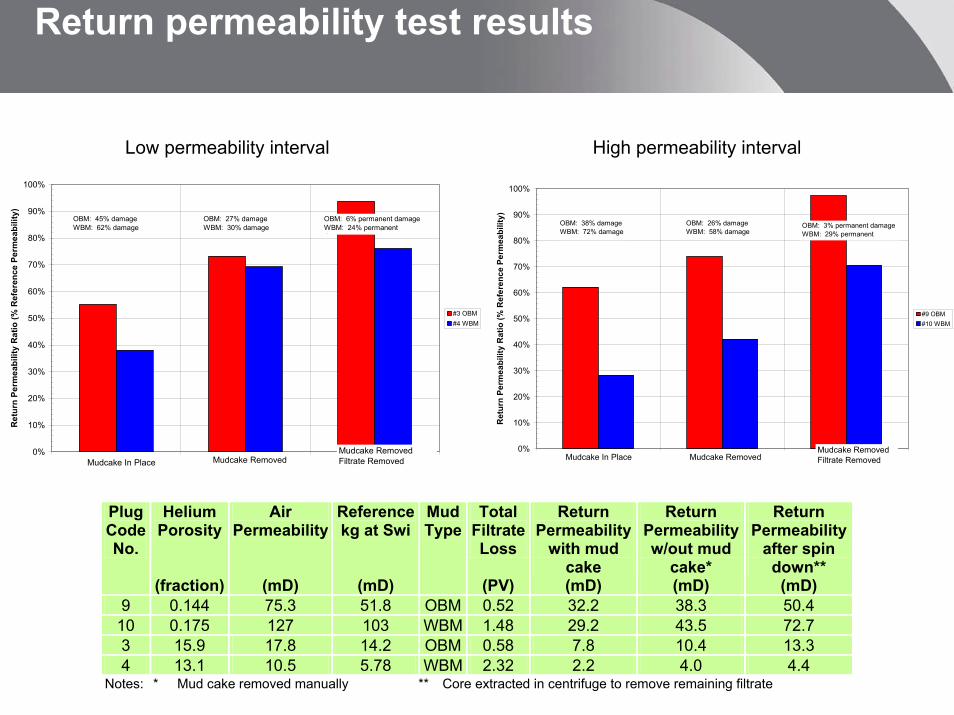
Return permeability test results
Low permeability interval High permeability interval
0%
10%
20%
30%
40%
50%
60%
70%
80%
90%
100%
1 2 3
Ret
urn
Perm
eabi
lity
Rat
io (%
Ref
eren
ce P
erm
eabi
lity)
#3 OBM#4 WBM
Mudcake In Place Mudcake RemovedMudcake RemovedFiltrate Removed
OBM: 45% damageWBM: 62% damage
OBM: 27% damageWBM: 30% damage
OBM: 6% permanent damageWBM: 24% permanent d
0%
10%
20%
30%
40%
50%
60%
70%
80%
90%
100%
1 2 3
Ret
urn
Perm
eabi
lity
Rat
io (%
Ref
eren
ce P
erm
eabi
lity)
#9 OBM#10 WBM
OBM: 38% damageWBM: 72% damage
OBM: 26% damageWBM: 58% damage
OBM: 3% permanent damageWBM: 29% permanent
Mudcake In Place Mudcake RemovedMudcake RemovedFiltrate Removed
Plug Code No.
Helium Porosity
Air Permeability
Reference kg at Swi
Mud Type
Total Filtrate Loss
Return Permeability
with mud cake
Return Permeability w/out mud
cake*
Return Permeability
after spin down**
(fraction) (mD) (mD) (PV) (mD) (mD) (mD) 9 0.144 75.3 51.8 OBM 0.52 32.2 38.3 50.4
10 0.175 127 103 WBM 1.48 29.2 43.5 72.7 3 15.9 17.8 14.2 OBM 0.58 7.8 10.4 13.3 4 13.1 10.5 5.78 WBM 2.32 2.2 4.0 4.4
Notes: * Mud cake removed manually ** Core extracted in centrifuge to remove remaining filtrate
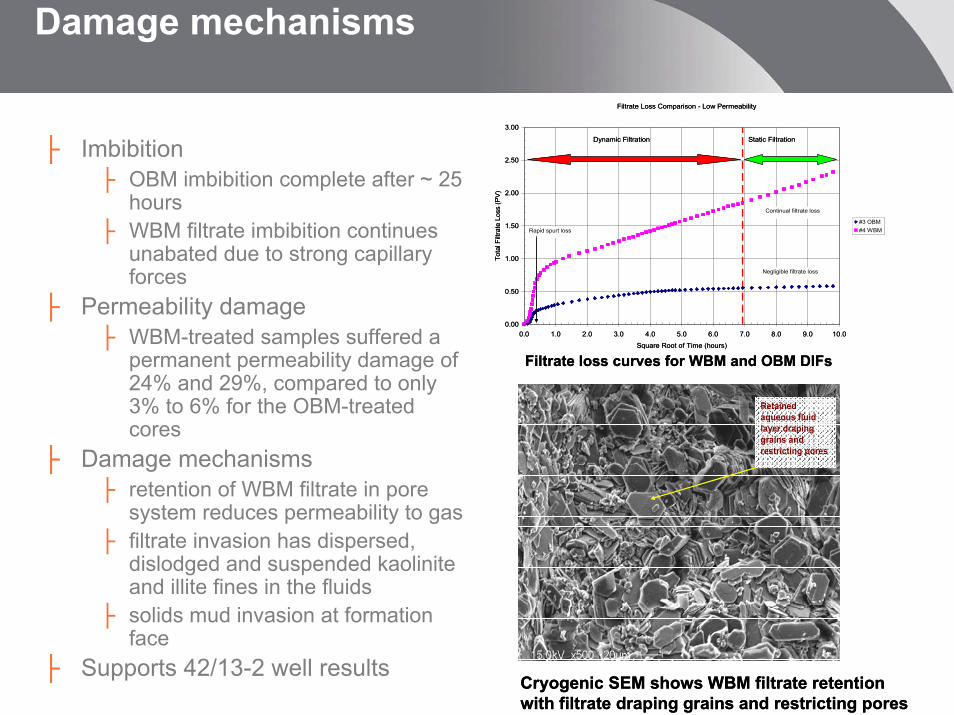
Damage mechanisms
Filtrate loss curves for WBM and OBM DIFs
Filtrate Loss Comparison - Low Permeability
0.00
0.50
1.00
1.50
2.00
2.50
3.00
0.0 1.0 2.0 3.0 4.0 5.0 6.0 7.0 8.0 9.0 10.0
Square Root of Time (hours)
Tota
l Filt
rate
Los
s (P
V)
#3 OBM#4 WBM
Dynamic Filtration Static Filtration
Rapid spurt loss
Negligible filtrate loss
Continual filtrate loss
! Imbibition! OBM imbibition complete after ~ 25
hours! WBM filtrate imbibition continues
unabated due to strong capillary forces
! Permeability damage! WBM-treated samples suffered a
permanent permeability damage of 24% and 29%, compared to only 3% to 6% for the OBM-treated cores
! Damage mechanisms! retention of WBM filtrate in pore
system reduces permeability to gas! filtrate invasion has dispersed,
dislodged and suspended kaolinite and illite fines in the fluids
! solids mud invasion at formation face
! Supports 42/13-2 well results
Retained aqueous fluid layer draping grains and restricting pores
Retained aqueous fluid layer draping grains and restricting pores
Cryogenic SEM shows WBM filtrate retention with filtrate draping grains and restricting pores
Retained aqueous fluid layer draping grains and restricting pores
Retained aqueous fluid layer draping grains and restricting pores
Cryogenic SEM shows WBM filtrate retention with filtrate draping grains and restricting pores

Geomechanics – Strength Model
! SPE 98110 database! Log-derived strength
model
! Calibrated by tests on 42/13-2 core
TWC Strength Model Probability Distribution(based on 42/13-2 :7375 - 7885 ft MD)
0%
10%
20%
30%
40%
50%
60%
70%
80%
90%
100%
8000 10000 12000 14000 16000 18000 20000
TWC (psi)
prob
abili
ty (C
umul
ativ
e Fr
eque
ncy)
NetPay
Percentile TWC(psi)
P5 12350P10 12802P20 13215P30 13592P40 13888P50 14101P60 14317P70 14714P80 15132P90 15617P95 17059
Net Interval
Percentile TWC(psi)
P5 12160P10 12439P20 12912P30 13086P40 13306P50 13527P60 13761P70 13940P80 14180P90 14464P95 14733
Pay Interval
35741798 "# cEUCS
4696.024.12 "# UCSUCSTWC
2
101034.1tx
E bc $#
%
Core Saturation Confining Failure Young's Poisson's Cohesive Friction Depth Fluid Pressure Stress Modulus Ratio Strength Angle(ft MD) (MPa) (psi) (Mpsi) (-) (psi) (deg)7467.21 Oil UCS 57467467.21 Oil 18 17319 2.82 0.249 1365 39.27478.21 Oil UCS 54647478.21 Oil 18 21544 3.94 0.196 1101 46.1

Geomechanics – Stress Model
! Vertical stress! density log integration 42/13-2
! Horizontal stresses! LOT, image logs in 42/13-2 ! pore pressure
! RFT
! SPE 98110 database! stress tensors validated against
offset data
Total Vertical Stress
Maximum Horizontal Stress
Minimum Horizontal Stress
Pore Pressure
(psi/ft) (psi/ft) (psi/ft) (psi/ft) 1.00 0.80 0.72 0.501
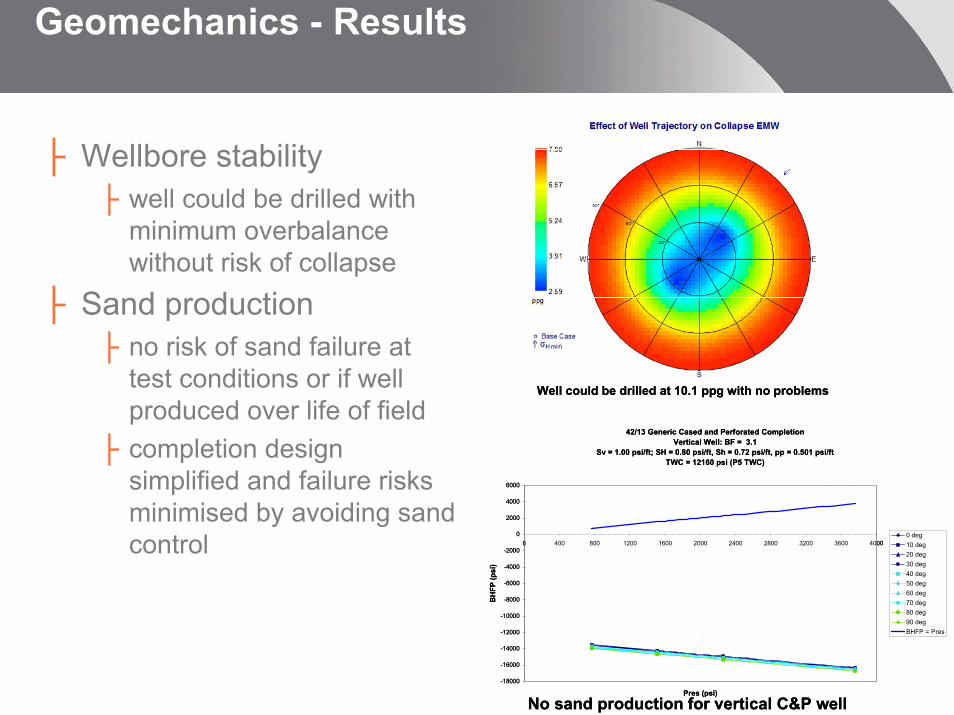
Geomechanics - Results
Well could be drilled at 10.1 ppg with no problemsWell could be drilled at 10.1 ppg with no problems
! Wellbore stability! well could be drilled with
minimum overbalance without risk of collapse
! Sand production! no risk of sand failure at
test conditions or if well produced over life of field
! completion design simplified and failure risks minimised by avoiding sand control
42/13 Generic Cased and Perforated CompletionVertical Well: BF = 3.1
Sv = 1.00 psi/ft; SH = 0.80 psi/ft, Sh = 0.72 psi/ft, pp = 0.501 psi/ftTWC = 12160 psi (P5 TWC)
-18000
-16000
-14000
-12000
-10000
-8000
-6000
-4000
-2000
0
2000
4000
6000
0 400 800 1200 1600 2000 2400 2800 3200 3600 4000
Pres (psi)
BH
FP (p
si)
0 deg10 deg20 deg30 deg40 deg50 deg60 deg70 deg80 deg90 degBHFP = Pres
No sand production for vertical C&P well

42/13-3 Well Results
! Drilling and completion! drilled with 10.1 ppg oil-
based DIF with no wellbore instability issues
! Reservoir! two good quality sands in
Upper Breagh unit! 7358 ft MD to 7387 ft MD! 7413 ft MD to 7435 ft MD
! 77 ft net pay in 296 ft gas column
! Lower Breagh reservoir Unit consists of poorer quality sands and several thin limestones.

42/13-3 Well Results
! Productivity! perforated between 7340 ft
and 7450 ft MD on 3 ½” OD TCP test string
! test kh ~ 237 mDft! damage skin 0 to +2! 17.6 mmscf/d (with no sand
production) compared to 3 mmscf/d in 42/13-2
! AOF 10 times 42/13-2 AOF! Success
! well proved connectivity of channels
! 3 well field development underway
0
500
1000
1500
2000
2500
3000
3500
4000
0 5 10 15 20 25 30
Gas Production rate (MMscf/d)B
otto
m H
ole
Flow
ing
Pres
sure
(psi
a)
13 2 Well Test IPR
13 3 Well Test IPR
BHFP 42/13-3
BHFP 42/13-2
0
500
1000
1500
2000
2500
3000
3500
4000
0 5 10 15 20 25 30
Gas Production rate (MMscf/d)B
otto
m H
ole
Flow
ing
Pres
sure
(psi
a)
13 2 Well Test IPR
13 3 Well Test IPR
BHFP 42/13-3
BHFP 42/13-2

Well 42/13-5z
! Horizontal well in Breagh! cased and perforated completion! same OBM DIF as 42/13-3! drilled at minimum overbalance
! Tested January 2009! horizontal sand section 1,200 ft! tested dry gas at 26 mmscf/d!mechanical skin ~ 0

Conclusions
! Breagh field was condemned as non-viable as a result of poor well productivity rather than poor permeability or connectivity.
! Post mortem welltest and petrophysical evaluation on 42/13-2 indicated extensive formation damage through a combination of filtrate retention, fines migration and solids mud invasion.
! New operator drilled 42/13-3 appraisal well utilising best practice in well construction, drill in fluid and completion design.
! 42/13-3 produced 17.6 mmscf/d with zero to low skin. AOF increased 10 times compared to 42/13-2
! 42/13-5z horizontal well produced 26 mmscf/d with zero skin! An integrated petrophysical, geomechanical and formation
evaluation solution can recognise, diagnose and help mitigate against formation damage.
! Significant development opportunities can be realised in “uneconomic and non-viable” oil and gas fields

Observations
! In some operators, disciplinary compartmentalization and unaligned KPIs can combine to overlook or bypass viable opportunities, losing the value initially to the operator itself, and potentially to the rest of the industry.
! The key to the revival of this “toxic asset” has been the willingness of the smaller, independent operator to:! take calculated risks in a risk-averse climate ! foster and encourage an integrated, multi-disciplinary
approach that draws on the combined skills of geologists, petrophysicists, drilling, reservoir and production engineers.

Acknowledgements
! Senergy Ltd. and Sterling Resources for encouragement to share results
! Ken Black (Senergy)! Corex UK – formation damage tests! Fractech (UK) – rock mechanics tests! MI Swaco (UK) – DIF design! Rick Lemanczyk & Mike Byrne (Senergy) -
lux ex tenebris!